Article

Fracture Failure Model of Caragana korshinskii Kom. Branches Constructed Using ABAQUS/Explicit

College of Mechanical and Electrical Engineering, Inner Mongolia Agricultural University, Hohhot 010018, China
*
Author to whom correspondence should be addressed.
Forests 2025, 16(1), 90; https://doi.org/10.3390/f16010090
Submission received: 5 December 2024 / Revised: 7 January 2025 / Accepted: 7 January 2025 / Published: 8 January 2025
(This article belongs to the Section Forest Operations and Engineering)

Abstract

:
This study focuses on developing a finite element model for Caragana korshinskii Kom. branches and calibrating the necessary parameters. Using Caragana korshinskii Kom. branches in full bloom as the subject, we established a finite element model with ABAQUS and analyzed the relationship between the shear force and displacement. The Johnson–Cook model was employed to create a finite element shear model for Caragana korshinskii Kom. branches and to calibrate its parameters. Plackett–Burman and climbing tests were conducted to identify key parameters influencing the shear mechanical model of Caragana korshinskii Kom. branches, specifically the yield stress and strain. This included the strengthening index and fracture strain. Through central composite design experiments, the optimal parameters for the shear model of Caragana korshinskii Kom. branches were identified: a yield stress of 18.65 MPa, a strain strengthening index of 0.59, and a fracture strain of 0.54. The results indicated that the maximum error in the simulated shear force values for Caragana korshinskii Kom. branches of varying diameters was 9.68%. Additionally, the difference between the simulated and actual tensile force values was 1.7%. These findings indicate that the calibrated finite element model is accurate and effective in simulating the failure behavior of Caragana korshinskii Kom. branches, providing a valuable tool for optimizing cutting and harvesting processes.

1. Introduction

Caragana korshinskii Kom. is part of the Leguminosae family and is commonly found in the arid and semi-arid regions of northwest China [1,2]. Caragana korshinskii Kom. branches are the primary byproduct of the plant and serve as a valuable renewable biomass resource across various sectors, with promising applications in fuel, livestock feed, and bio-oil [3,4,5,6,7]. The primary method for processing Caragana korshinskii Kom. involves crushing, which is essential for maximizing its value. Crushing serves as a critical step and a prerequisite for high-value utilization. Despite their potential, the utilization rate of Caragana korshinskii Kom. branches remains low, making it challenging to achieve higher added value. This is primarily due to the poor crushing quality of the branch crushers and high energy consumption [8,9]. To tackle this issue, physical testing is commonly employed; however, it is time-consuming, labor-intensive, and expensive. Additionally, the high-speed rotation of the chopping drum and the swift movement of the Caragana korshinskii Kom. branches hinder the analysis of the interaction between the cutting blade and the branches, as well as the measurement of the internal stress distribution in the stems caused by the blade [10].
The finite element method offers a novel approach to investigating the interaction characteristics between agricultural machinery and crops [11]. By creating a numerical simulation model of the agricultural machinery–crop system, it enables an intuitive and quantitative analysis of the interactions between rigid mechanical components and flexible crop plants. This method is more efficient, cost-effective, and requires a shorter research and development cycle compared to traditional experiments [12,13]. For example, Bu et al. [14] established a finite element model of a branch–bar system to simulate the response under different loads, providing a reliable finite element model for the future design of apple harvesting devices to simulate the response under different loads and provide a reliable finite element model for future apple harvesting device designs. Souza et al. [15] employed finite element analysis to numerically simulate the interaction between coffee harvesting rods and branches, assessing the mechanical behavior of the plant under vibration. The cutting process of 
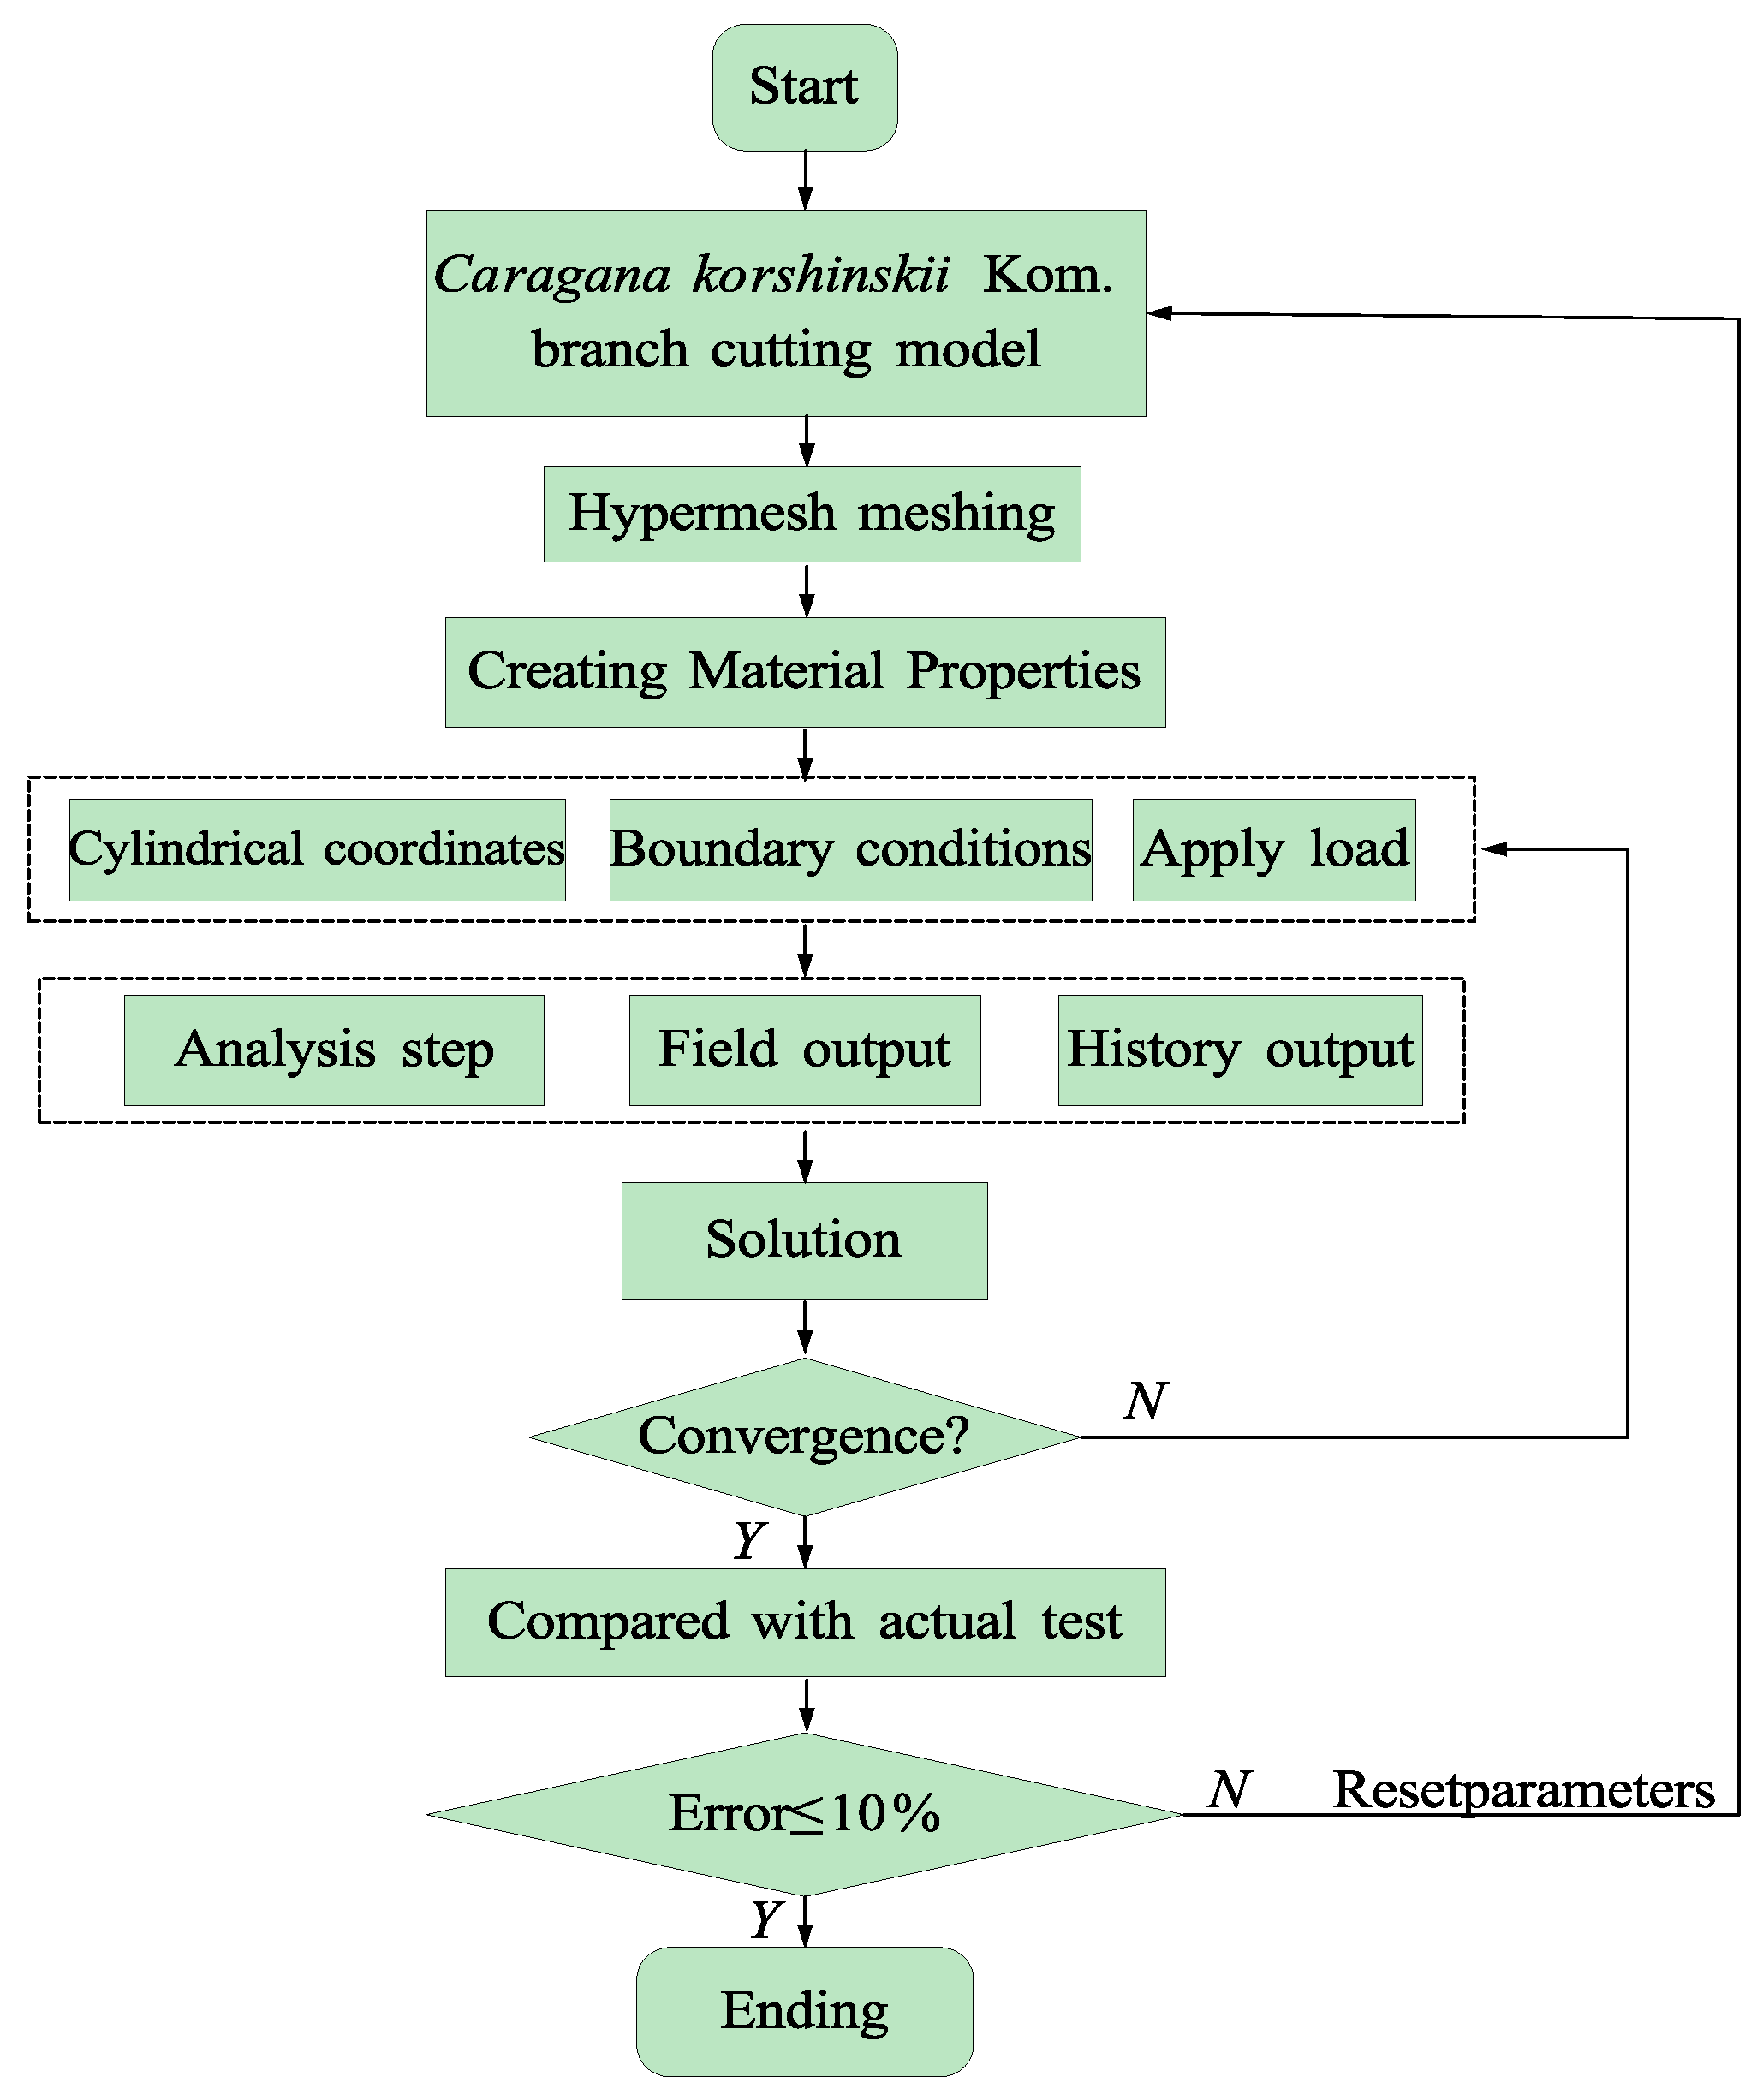
Caragana korshinskii Kom. branches is intricate and unpredictable, characterized by high-speed dynamic impacts and typical penetrating collisions. The interaction between the cutting tool and the branches involves discontinuous dynamic contact, making it challenging to observe and analyze using conventional methods. The explicit dynamics module in finite element analysis effectively addresses short-duration, large-deformation dynamic issues and various complex nonlinear contact scenarios [16]. Therefore, it can help understand the chopping process of Caragana korshinskii Kom. branches. In order to obtain results consistent with the actual cutting test, it is very necessary to accurately define the mechanical properties of the stems in the finite element simulation. Obtaining accurate stem model parameters is a prerequisite for ensuring the reliability and accuracy of numerical simulation. However, there is currently a lack of discussion on the construction and parameter setting of the Caragana korshinskii Kom. branches model, which greatly affects the application of finite element numerical simulation technology in the chopping process of Caragana korshinskii Kom. branches.
Due to the difficulty in obtaining certain parameters through mechanical property tests, scholars often combine finite element simulation with experimental verification. Jiang et al. [17] used LS-DYNA software to simulate stem shear failure based on the P-K model, highlighting the effects of the strain rate, yield stress, and Poisson’s ratio. Kaygin et al. [18] employed FEM to assess the strength characteristics of wood joints. Amaruddin et al. [19] used the finite element method to model the bending behavior of a wood pin in a three-point bending test. Defining the orthotropic and anisotropic properties of wood is crucial in finite element modeling. Henriques et al. [20] determined the orthotropic linear elastic parameters of Pinus pinaster Ait. wood through uniaxial compression tests. Zahedi et al. [21] used the ABAQUSTM finite element software to model and analyze wood as a linear orthotropic elastic material. Zhang et al. [22] built a finite element model of tomato stalks using the Johnson–Cook equation, comparing cutting forces in conventional and ultrasonic cutting and revealing the advantages of ultrasonic technology for tomato harvesting. However, at present, most of the research on finite element models in the field of agriculture and forestry focuses on revealing the single characteristics of crop damage mechanism [
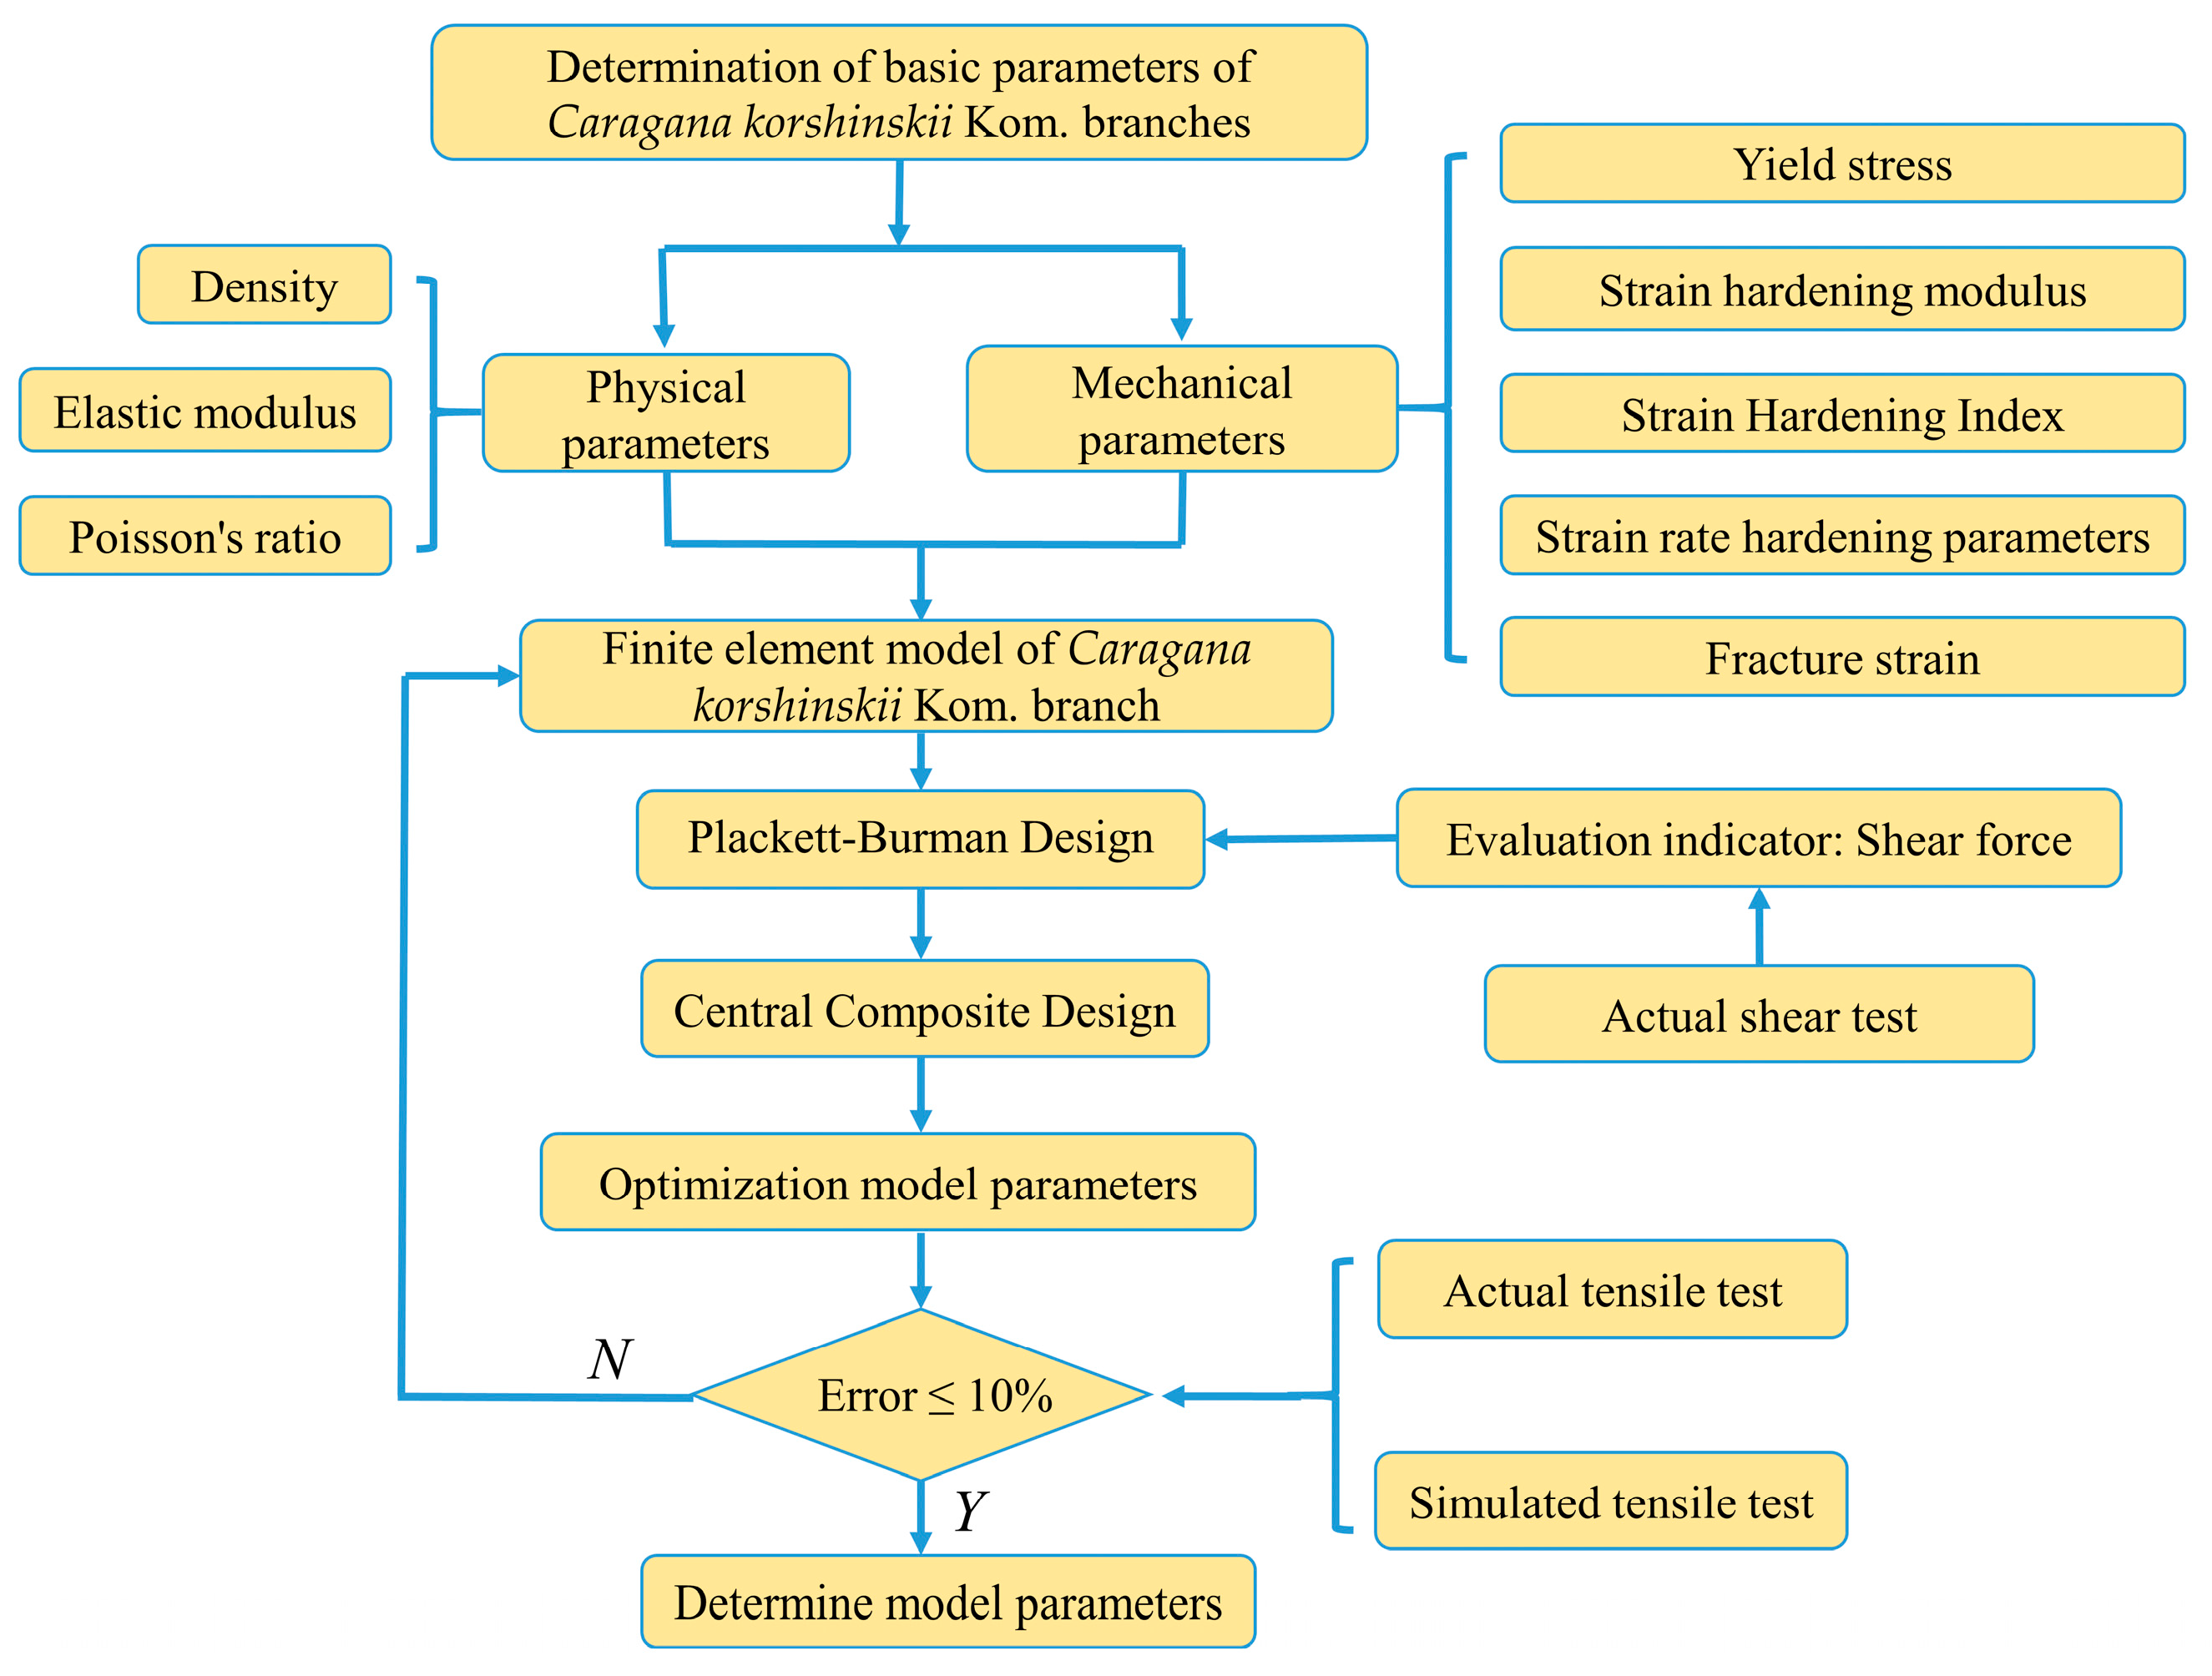
23], and the shear strain mechanism of crops, especially the shear strain mechanism of stem crops, is insufficient. The Johnson–Cook model accounts for both the strain rate and strain hardening, making it suitable for modeling material failure under high strain rates. Its simple mathematical form, low number of parameters, ease of implementation, and high computational efficiency make it ideal for describing a material response under complex conditions such as impact and cutting. Although Li et al. [24] used the modified Johnson–Cook constitutive model to describe the mechanical properties of Caragana korshinskii Kom. branches, there are currently few reports on the simulation of Caragana korshinskii Kom. branches, and a finite element model that can represent the shear mechanics of Caragana korshinskii Kom. branches has not yet been established.
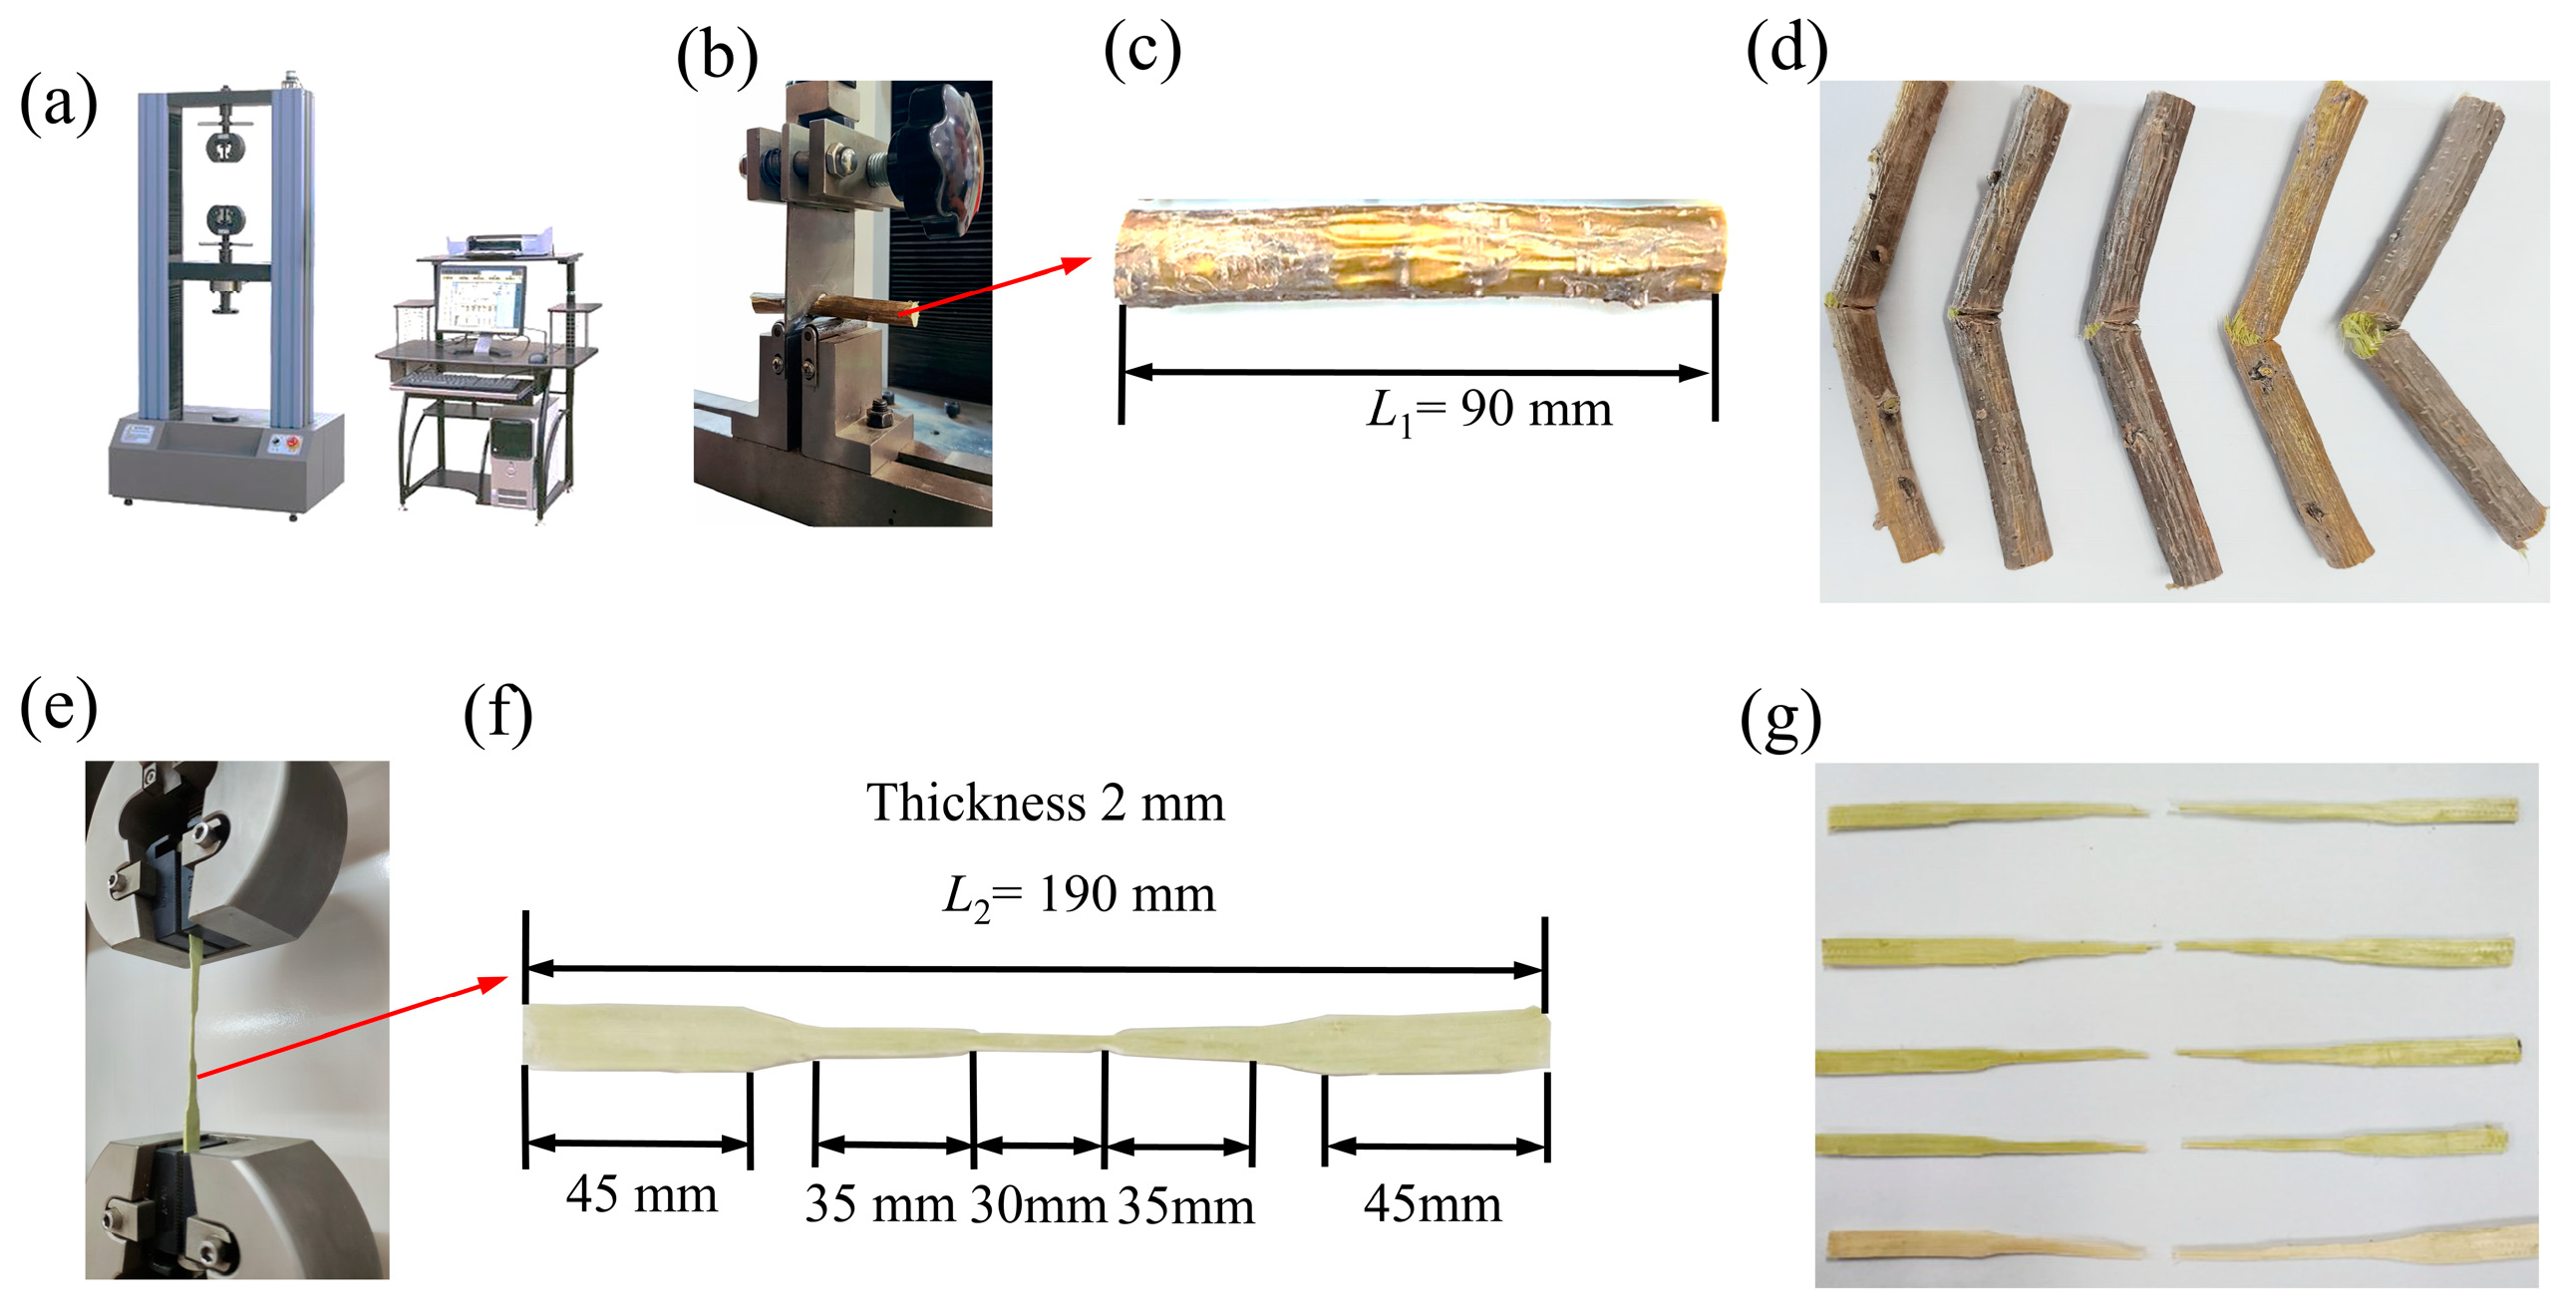
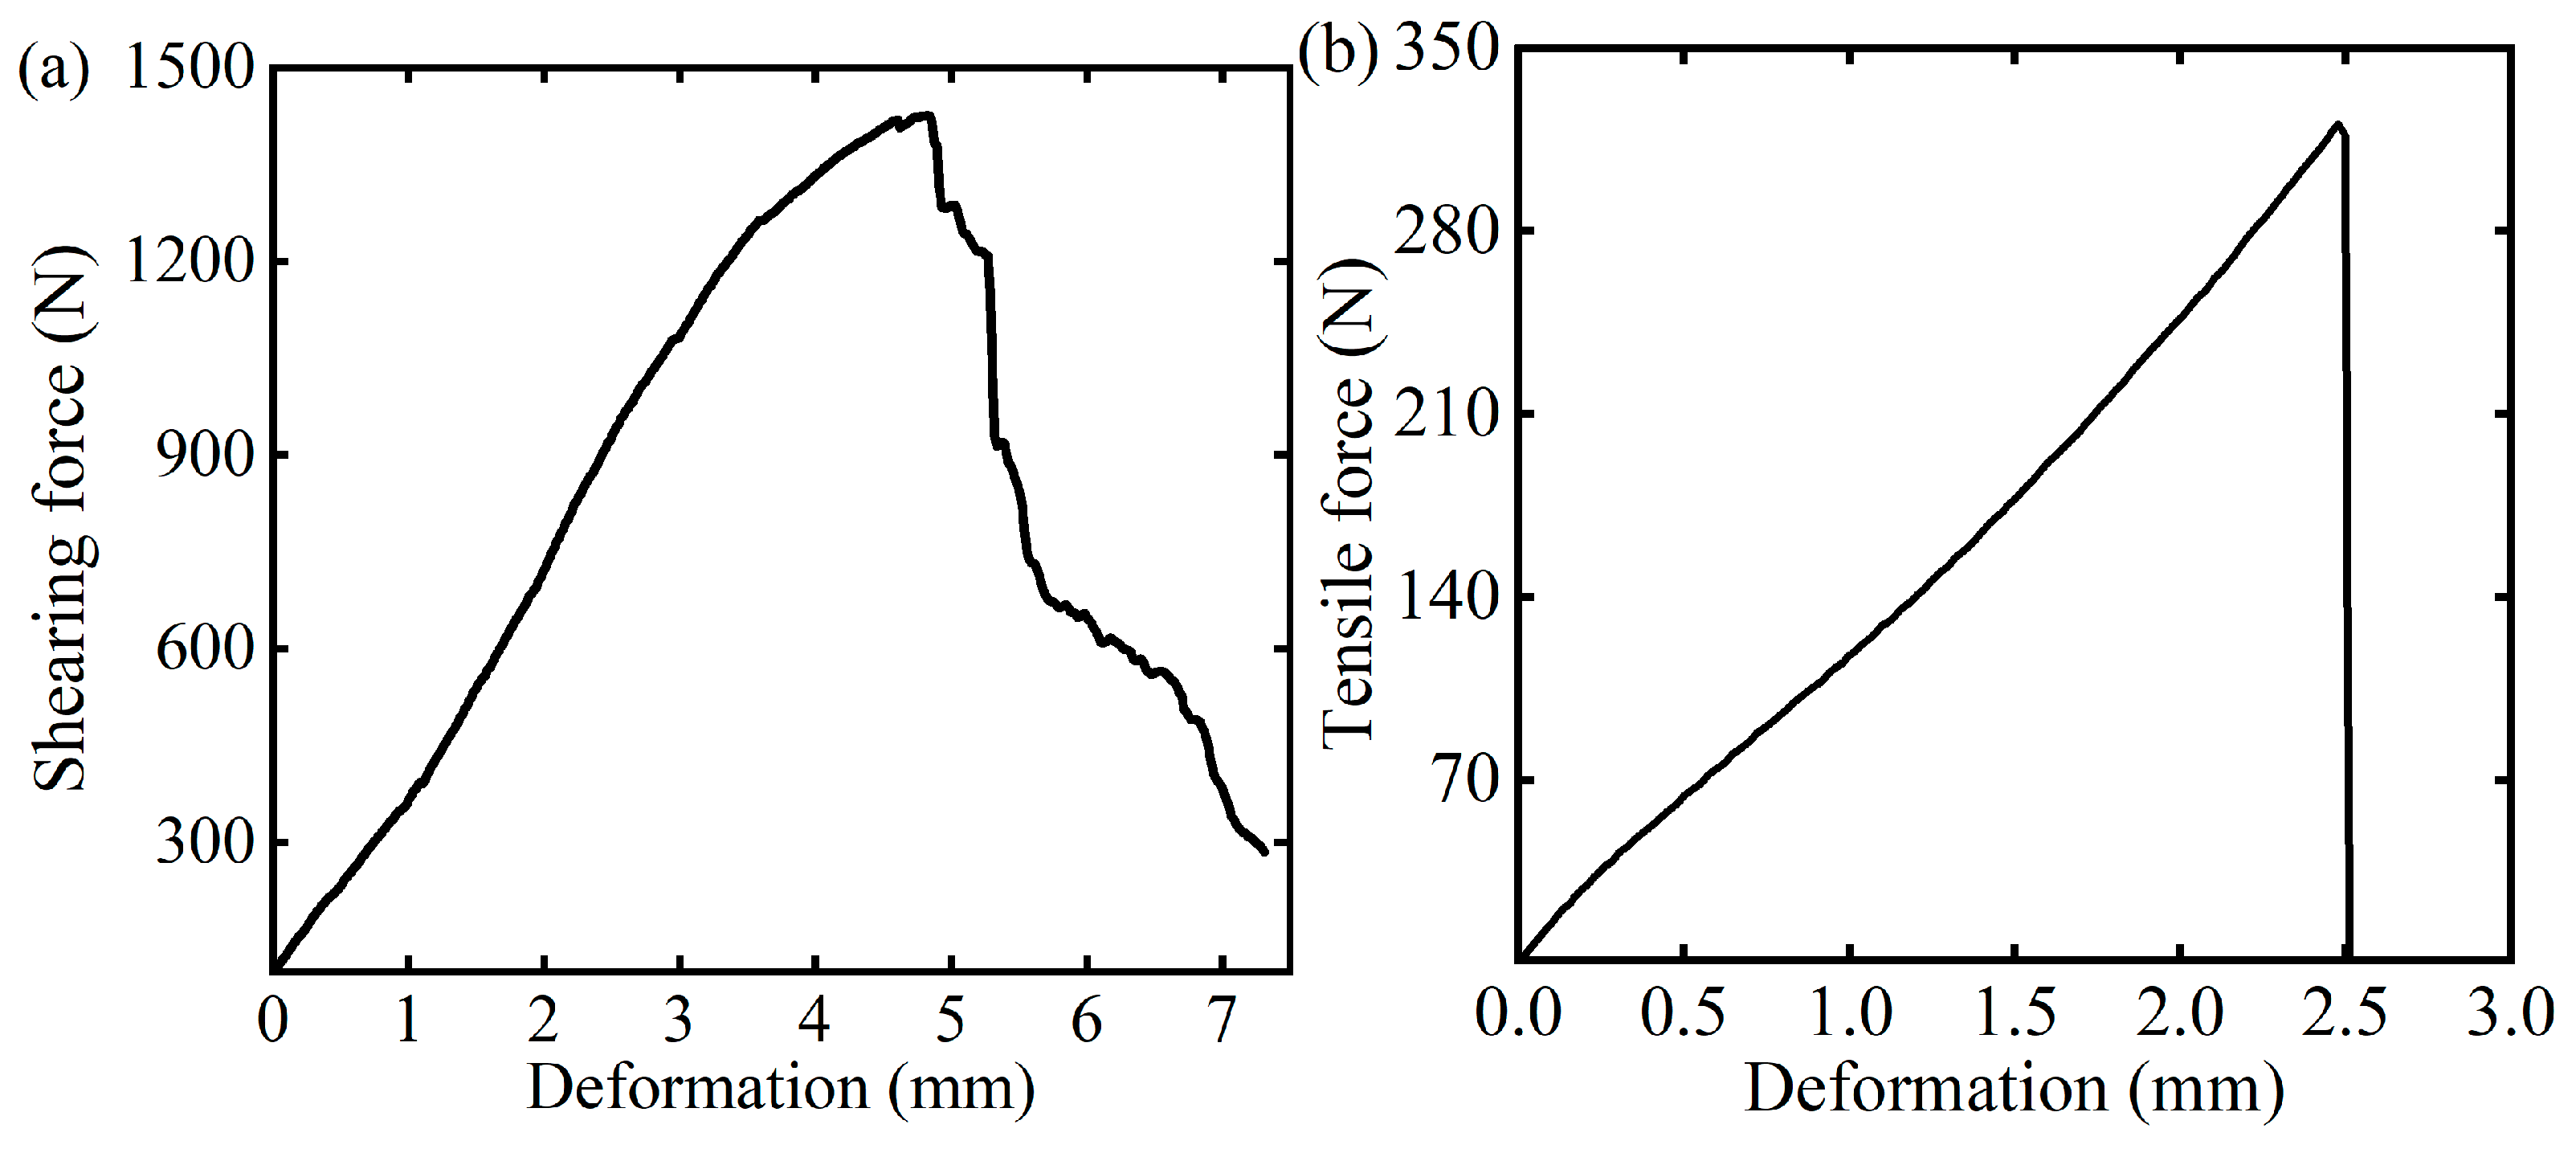
This study aims to develop a finite element model of Caragana korshinskii Kom. branches using the finite element method (FEM), calibrate the model’s relevant parameters, and accurately predict the biomechanical properties of the branches. The Johnson–Cook model is capable of simulating material behavior under dynamic loading conditions, making it suitable for high-speed cutting of branches. The mechanical properties were evaluated under various loading conditions (shear and tension), with FEM simulations performed on Caragana korshinskii Kom. branches from Inner Mongolia as the focus. FEM parameters were calibrated through radial shear tests, and the calibration results were subsequently validated.

2. Materials and Methods

2.1. Test Materials

Caragana korshinskii Kom. exhibits numerous branches, a high level of lignification, and significant toughness and shear resistance. The samples used in this experiment were collected in August 2023 from Hohhot City and Helinger County (40°9′36″ E, 111°48′ N). The cross section of the Caragana korshinskii Kom. branches is roughly circular, tapering gradually from the root to the tip. From the outside in, the cross section consists of the epidermis, phloem, xylem, and pith, with the phloem containing fibers, as illustrated in Figure 1. Studies have shown that the lignin content of Caragana korshinskii Kom. branches ranges from 41% to 57%, while the hemicellulose content ranges from 14% to 20% [25].
Forty Caragana korshinskii Kom. branches, aged 3 to 5 years, were randomly selected from the field, pruned, and measured for length from the base to the main branch internode using a vernier caliper and ruler. The branch diameters ranged from 6.58 to 14.86 mm. During the test, the laboratory temperature was 24 °C, with humidity at around 46%. Basic physical properties were assessed before conducting biomechanical experiments. Due to the small diameter of Caragana korshinskii Kom. branches, testing according to the standard [26] was not feasible. Instead, 90 mm long samples were cut, with 50 samples randomly divided into 5 groups. Trunk density was measured using the overflow equal volume method, resulting in an average density of 985.47 kg/m3 and a coefficient of variation of 35.86%. The skin density was 431.82 kg/m3 with a coefficient of variation of 21.34%. Although the overflow method is accurate, sample morphology and the precision of the electronic balance, particularly for small or irregular samples, may introduce errors. To determine moisture content, five groups of Caragana korshinskii Kom. branches, each weighing 100 ± 5 g, were selected and dried. After 24 h of drying, the weight was measured every two hours until the measurement error was less than 0.001 g. The average moisture content was 39.42%, with a coefficient of variation of 2.47%. However, surface moisture content, drying temperature, and time accuracy may influence the results.

2.2. Shear and Tensile Mechanical Testing

A shear test was conducted on Caragana korshinskii Kom. branches using a SDJF-20KN electronic universal testing machine (Zhuode Instrument and Equipment (Beijing) Co., Ltd., Beijing, China) equipped with a customized blade, as shown in Figure 2a. Figure 2b shows the shear test device, with the distance between the two metal brackets (used to support the sample) set to 10 mm. The Caragana korshinskii Kom. branch diameter was selected to be 10 ± 0.5 mm, with a sample length of 90 ± 0.5 mm, avoiding stem nodes whenever possible. The test sample is illustrated in Figure 2c. Figure 2d shows the sample after shear failure. Initially, the prepared Caragana korshinskii Kom. branch sample was placed on the support of the testing machine, and the blade was secured with a clamp. The test was concluded when the stem exhibited noticeable fracture. Figure 2e illustrates a tensile mechanical test. The test sample is shown in Figure 2f. Figure 2g shows the sample after tensile failure. Initially, the prepared Caragana korshinskii Kom. branch sample was placed between two clamps, with the loading speed set to 10 mm·min−1. The test ends when the specimen exhibits visible fracture or significant damage.

2.3. Finite Element Model of Branch Shear Based on Johnson–Cook Model

Given that the medulla and epidermis of the Caragana korshinskii Kom. branches have minimal impact on cutting compared to the xylem, the branch is modeled as a cylinder with an isotropic elastic-plastic material model for simplicity. Hopkinson pressure bar tests indicate that the strength of Caragana korshinskii Kom. branches increases with strain rate. Understanding the dynamic characteristics of Caragana korshinskii Kom. branches will enhance the accuracy and predictability of related research [27,28]. Accurately characterizing the stress changes in Caragana korshinskii Kom. branches beyond the dynamic yield point and developing a nonlinear constitutive model based on strain rate are essential prerequisites for numerical simulation.
The strain hardening behavior observed in wood under compression or shear loads exhibits a similar stress–strain curve to that of plastically deformed metals, largely due to the densification of wood tissue under pressure. This similarity in curve shape enables the use of the strain hardening parameter from the Johnson–Cook model to describe the increase in strength with strain in wood.

2.3.1. Johnson–Cook Constitutive Equation

In analyzing the stress–strain curve of Caragana korshinskii Kom. branches cross-grain specimens under dynamic loading, it was observed that their dynamic mechanical properties resembled those of ductile metals, allowing for analysis using established empirical models from metal research. The Johnson–Cook model, developed by Johnson G.R. and Cook W.H. in 1983, serves as an ideal rigid-plastic strengthening model for engineering challenges involving high temperatures, high strain rates, and significant material deformation [29].
This constitutive model is founded on the modified Von Mises yield criterion and includes a contact unit failure algorithm. It offers several advantages, including a clear physical interpretation of material parameters, relatively straightforward parameter definitions, ease of fitting to experimental data, and strong versatility. The Johnson–Cook model is extensively used in dynamic studies, such as metal cutting simulations and impact analyses [30]. The model’s expression is presented in Equation (1):
σ y = ( A + B ε n ) ( 1 + C ln ε ˙ ε ˙ 0 ) [ 1 ( T T r T m T r ) m ]
where σ is the dynamic stress of the material during plastic deformation, (MPa); A is the yield stress, (MPa); B is the stress hardening parameter; C is the strain rate hardening parameter; T is the test temperature, (°C); Tr is the ambient temperature during testing, (°C); Tm is the melting point of the material, (°C); m is the temperature rise softening index; and n is the hardening index.
The Johnson–Cook equation, as shown in Equation (1), serves as a constitutive model describing the relationship between stress and strain during the plastic deformation of materials. The study demonstrates that the transverse grain specimens of Caragana korshinskii Kom. experience two distinct stages: elastic deformation followed by mild strengthening. The modified Johnson–Cook constitutive model was applied for curve fitting, resulting in a satisfactory match [25]. Thus, a constitutive model is needed to accurately represent the stress–strain relationship in the plastic deformation of stem materials, which the Johnson–Cook equation provides. Since the stem shearing process does not generate significant heat, the material temperature during testing remains approximately at room temperature (T = Tr), allowing for the neglect of temperature effects. Consequently, Equation (1) can be simplified as
σ y = ( A + B ε n ) ( 1 + C ln ε ˙ ε ˙ 0 )
Equation (2) is the constitutive equation used in finite element simulation. The finite element model of Caragana korshinskii Kom. branches shearing was constructed based on ABAQUS software and shearing simulation research was carried out.

2.3.2. Development of a Finite Element Model for Caragana korshinskii Kom. Branches

ABAQUS software is well-suited for solving highly nonlinear structural dynamic problems and is effective in simulating the cutting process. Essentially, the numerical analysis of the cutting process of Caragana korshinskii Kom. branches involves the failure of the material unit after large deformation or the stress overload of the branch, providing an intuitive representation of the cutting process. The Caragana korshinskii Kom. branch is treated as a single entity, with its material behavior modeled using the Johnson–Cook model. The simulation analysis is conducted using the Abaqus/Explicit solver, based on explicit dynamic theory, which is capable of handling complex numerical analysis.
A three-dimensional model of cutting Caragana korshinskii Kom. branches with a diameter of 10 mm was created using SOLIDWORKS 2022 and imported into ABAQUS 2022 for further analysis. Initially, the contact between the shear blade and Caragana korshinskii Kom. was defined using the contact pair algorithm. The shear blade was designated as the master surface, while the Caragana korshinskii Kom. surface was treated as the slave surface. Given that the Caragana korshinskii Kom. model experiences significant shear deformation during the cutting process, the contact pair was assigned a small slip formulation. This setting allows minimal relative sliding between the shear blade and the Caragana korshinskii Kom. surface throughout the analysis. The normal contact behavior between the master and slave surfaces was modeled as “hard” contact, while the tangential behavior was modeled using the Coulomb friction model with the “penalty” method. This approach permits some relative movement (“elastic sliding”) when the surfaces are in contact. The friction coefficient between the shear blade and Caragana korshinskii Kom. was set to 0.36. The support was modeled as a rigid body, with the shear loading speed along the Y-axis set to 10 mm·min−1 and the total simulation time set to 12 s. During mesh generation, an appropriate mesh structure and size were chosen to balance simulation accuracy and computational efficiency. Given the tool’s irregular shape, the blade was meshed with tetrahedral elements (C3D10M). The remaining components, including the support and Caragana korshinskii Kom. branch, were meshed using hexahedral structured elements (C3D8R). The mesh size was set to 1 mm, resulting in a total of 32,493 elements. Figure 3a shows the three-dimensional model, while Figure 3b presents a two-dimensional diagram of the shear blade.
The Caragana korshinskii Kom. branches are left unconstrained, while displacement in the Y direction is applied to the blade model at a constant speed of 10 mm·min−1. The support base is modeled as a rigid body and fixed in place. For contact, “penalty” contact is applied between the Caragana korshinskii Kom. branches and the blade model, with the distance minimized to reduce idle computation time prior to cutting. Essentially, the numerical analysis of the Caragana korshinskii Kom. branches cutting process involves studying the large deformation and eventual failure of the stem unit under overload, with the observable result being branch fracture. To streamline the modeling process, the branch is treated as a single entity, and the Johnson–Cook model is used to define its material properties. The model construction workflow is displayed in Figure 4.

2.4. Parameter Calibration Test Design

The experimental design begins with a Plackett–Burman design for preliminary screening, aimed at quickly identifying the key factors influencing the results. Following the Plackett–Burman test, we employed a central composite design. The central composite design is primarily used to refine the key factors identified earlier, allowing for a more precise evaluation of variable interactions and nonlinear effects. Figure 5 presents a flowchart outlining the methodology of this study.

2.4.1. Plackett–Burman Experimental Design

The Plackett–Burman test was conducted using Design-Expert software (version 12.0.4.x64) to identify parameters significantly affecting the maximum shear force. Factors included in the test were density, elastic modulus, Poisson’s ratio, yield stress, strain hardening modulus, strain hardening exponent, strain rate hardening parameter, fracture strain, and failure displacement. Research on the mechanical and physical properties of Caragana korshinskii Kom. branches remains incomplete, particularly regarding finite element model parameters. The values or ranges for each test parameter were established based on prior results and referenced from various stem parameters [31]. The test parameters are presented in Table 1.
Steepest climbing test: This test identifies the region around the optimal values for the selected main parameters. Nonsignificant basic parameters are set to their mid-level in the two-level factor test, while significant parameters are incrementally increased based on a predetermined step size. A stem model is created for shear force simulation analysis, and the variation in relative error between the peak shear force from the simulation and the physical test is documented. The area near the optimal value is determined by analyzing the trend in relative error. The relative error (∆E) is calculated using Equation (3).
Δ E = F a F m F m × 100 %
where Fa is the average value of Fm, N.
This shear behavior has significant implications for the design and operation of crushing equipment. The nonlinear increase in shear force during the initial stages of deformation suggests that the crushing process may require gradually increasing force as the material starts to deform. However, as the shear force transitions to linear elasticity, it indicates that the material will resist further deformation, which could cause higher energy consumption or require more powerful machinery to continue the crushing process. Once the branches approach their fracture point and the shear strength begins to decline, this indicates that crushing equipment should be able to handle fluctuating force levels to efficiently complete the fracturing process without causing unnecessary wear or energy loss.
In the context of crushing equipment, this behavior suggests that tensile force resistance will be low after the ultimate tensile strength is exceeded, leading to rapid failure of the material. This means that when designing a crushing process for Caragana korshinskii Kom. branches, the equipment must be capable of applying sufficient tensile force to reach the material’s ultimate strength without causing premature breakage. Additionally, the lack of a yield stage indicates that crushing devices should be designed to avoid any intermediate stages of deformation, focusing instead on applying a sufficient and controlled force to achieve fracture effectively.
By understanding these shear and tensile characteristics, crushing equipment can be better optimized for efficiency and material handling, minimizing energy consumption and maximizing throughput while preventing equipment failure due to unexpected material behavior.

2.4.2. Central Composite Design

Utilizing the findings from the two-level factorial and steepest climbing tests, the design principles of central composite design were applied. The optimal values for significant parameters were established as high, medium, and low levels for the response surface test, with nonsignificant parameters set to their mid-values. A model of the Caragana korshinskii Kom. branches was created to simulate and analyze the maximum shear force, leading to the development of a regression model that relates maximum shear force to significant parameters. The shear force values were then input into the regression equation to derive the simulation model parameters.

2.5. Tensile Test Verification

The primary forms of material damage during the crushing of Caragana korshinskii Kom. branches are shear failure and tensile failure. To accurately model the Caragana korshinskii Kom. branches, a tensile test was conducted corresponding to the constructed model. A tensile specimen model matching the actual specimen size was created. To enhance simulation speed and simplify testing equipment, the stem contact areas were disregarded; one end of the specimen was fixed while tensile force was applied to the other end. The loading speed and conditions mirrored those of the actual test. The tensile simulation model of Caragana korshinskii Kom. branches is illustrated in Figure 6. The specimen was meshed using C3D8R elements, which are 8-node hexahedral elements featuring simplified integration. The load was applied as a displacement at a rate of 10 mm·min−1, with material properties based on values obtained from the shear test.

3. Results and Discussion

3.1. Shear and Tensile Mechanical Test Results

Figure 7a presents the force–displacement curves from the shear test. Initially, the curve shows nonlinear growth, with the shear force increasing as displacement rises. As displacement continues, the shear force transitions to linear elasticity. During the yield stage, the deformation accelerates while the load increases more slowly until reaching its peak, indicating Caragana korshinskii Kom. branches’ failure. Post-fracture, the deformation increases and the shear load fluctuates due to vascular bundles in the xylem approaching their fracture limit and a gradual reduction in shear strength. The load-deflection diagrams of Caragana korshinskii Kom. branches indicate they behave similarly to elastic-plastic materials, exhibiting both elastic deformation and yield fracture stages.
Figure 7b displays the tensile curve for the Caragana korshinskii Kom. branches sample. As the tensile displacement increases, there is an approximately linear relationship between the tensile force and the displacement. The sample reaches its ultimate tensile strength, resulting in an immediate break, accompanied by a rapid drop in tensile force to nearly zero. Unlike metals, the Caragana korshinskii Kom. branches sample exhibited no yield behavior throughout the test, highlighting its unique biomaterial characteristics.

3.2. Plackett–Burman Test Results

The key parameters influencing the peak shear force of the stem are density, elastic modulus, Poisson’s ratio, yield stress, strain hardening modulus, strain hardening index, strain rate hardening parameter, and fracture strain. An experimental design with two levels and eight factors was implemented. The experimental design and simulation results are presented in Table 2, while the effects of each parameter, determined through variance analysis, are summarized in Table 3.
Table 3 highlights the significance ranking of influence rates in the shear test of Caragana korshinskii Kom. branches. Parameters X4, X6, and X8 significantly affected the shear force, while other parameters had a minimal impact. Consequently, only these three significant parameters were considered in the subsequent steepest climbing test and response surface test, with nonsignificant factors set at intermediate levels. Significance and variance analyses were conducted using Design-Expert software, as detailed in Table 3. Parameters X4 and X8 exerted extremely significant effects on the maximum shear force (p < 0.01), while X6 had a significant effect (p < 0.05). The remaining parameters did not significantly affect the maximum shear force (p > 0.05). Thus, the yield stress (X4), failure strain (X6), and strain rate parameter (X8) were identified as the three key factors for response surface optimization design.
Parameters were ranked based on their contribution rates, identifying three significant factors influencing the peak shear force of the stem: yield stress, strain hardening index, and fracture strain. The Pareto chart (Figure 8) illustrates both the significance ranking of each factor and their respective positive and negative effects. Consequently, in designing the steepest climbing test, the yield stress and fracture strain were treated as ascending factors, while the strain hardening index was treated as a descending factor.
The Plackett–Burman test identified three key parameters significantly affecting the peak shear force of Caragana korshinskii Kom. branches for the steepest climbing test: X4, X6, and X8. Parameters with lesser effects were set to their central values. The relative error between the simulated and experimental peak shear forces served as the evaluation metric to determine the optimal ranges for the significant parameters. The test schemes and results are presented in Table 4. As X4 and X8 increased and X6 decreased, the error between the simulated and experimental peak shear forces initially decreased, then increased. Test scheme 3 exhibited the smallest relative error, suggesting it is near the optimal value. Consequently, a yield stress of 19 MPa, a strain hardening index of 0.64, and a fracture strain of 0.48 were chosen as the central points for the subsequent central composite test, with test schemes 2 and 4 designated as the low and high levels, respectively.

3.3. Response Surface Experiment Results

The central composite design was employed for further response surface analysis. Utilizing the significant parameters identified in the Plackett–Burman test and the central point established by the steepest climbing test, a three-factor, three-level response surface test was performed. The experimental design and results are presented in Table 5. Based on the test results, the following quadratic multiple regression equation was derived for peak shear force in relation to the three significant factors:
F m = 1177.63 + 102.73 X 4 + 19.3 X 6 + 49.11 X 8 7.08 X 4 X 6 + 21.39 X 4 X 8 12.1 X 6 X 8 2.25 X 4 2 17.82 X 6 2 8.59 X 8 2
The response surface test results were fitted and analyzed, revealing a coefficient of determination (R2) of 0.9832 for the fitting equation. Variance analysis (Table 6) indicated that the p-value for the quadratic full model was less than 0.01, while the p-value for the lack of fit term was greater than 0.05. The yield stress (X4), strain rate strengthening parameter (X6), and fracture strain (X8) significantly impacted the peak shear force. The influence of each factor on the peak shear force, ranked from largest to smallest, was as follows: yield stress (X4), fracture strain (X8), and strain rate strengthening parameter (X6). These findings align with the significance ranking from the Plackett–Burman test. The effects of factor interactions on peak shear force were ranked from largest to smallest as well: X62 and X4X8.
Using the average peak shear force of 1266.78 N as the response value, the optimal parameter combination influencing the peak shear force was identified, and parameters X4, X6, and X8 were optimized and analyzed. The optimization model is presented in Equation (5).
F m 1266.78 N s . t . 17 X 4 21 0.4 X 6 0.8 0.4 X 8 0.6
Taking the measured peak shear force of 1266.78 N as the target, the optimization solution obtained using Design-Expert software was as follows: X4 = 18.65 MPa, X6 = 0.59 and X8 = 0.54. The model was set according to the calibrated parameters, and the other setting conditions remained unchanged. The finite element model was established and compared with the actual test results. The optimization parameters in the Johnson–Cook model are intended to ensure the best fit with experimental data, rather than directly representing the material’s physical properties, particularly parameters like yield stress.

3.4. Shear and Tension Finite Element Model Verification

3.4.1. Shear Test Verification

The model was configured using the calibrated parameters, while other conditions remained unchanged. The finite element model was established and compared with actual test results (Figure 9).
Figure 10a presents the shear force–displacement curve of the Caragana korshinskii Kom. branches, showing a consistent trend, with peak shear forces of 1333.24 N and 1285.63 N, indicating a small difference between them. Figure 10b displays the fitting curve of the force–displacement changes in the elastic stage of the stem. The slopes of the fitting curves for the actual and simulated values were 294.17 and 297.37, respectively. The fluctuations in the actual value curve can be attributed to the heterogeneity and complexity of the shear specimens.
To ensure the feasibility, accuracy, and broad applicability of the calibrated model parameters, cutting models of Caragana korshinskii Kom. branches with diameters of 8 mm, 10 mm, 12 mm, 14 mm, and 16 mm were developed for verification (Table 7). The maximum shear force error between the simulation and actual tests was under 9.68%. Additionally, a strong linear relationship was observed between the maximum shear force and the stem diameter, confirming the validity of the parameter calibration method and the accuracy of the finite element model. However, the effects of physical parameters on the maximum shear force varied among different crop stems, with the yield stress significantly influencing the maximum shear force.

3.4.2. Tensile Verification Test

Figure 11 presents a comparison between the predicted and experimental fractures. Notably, the model accurately forecasted the displacement of the damaged region, aligning perfectly with the specimen’s failure. Figure 11a,b illustrate the actual fracture process of the specimen, while Figure 11c,d depict the stress distribution at the tensile limit and fracture, represented as contour maps.
Figure 12 illustrates the load–displacement curve of the specimen, showing a strong alignment between the predicted and experimental curves. The predicted maximum load capacity was Fm = 315.66 N at a displacement of 2.47 mm, which was slightly below the test value of Fm = 321.01 N, resulting in a relative error of 1.7%.

4. Conclusions

(1)
A sensitivity analysis utilizing the Plackett–Burman experimental design indicated that the factors influencing the shear force in Caragana korshinskii Kom. branches, in order of significance, were yield stress, strain hardening index, and fracture strain.
(2)
The optimal values identified were a yield stress of 18.65 MPa, strain hardening exponent of 0.59, and a fracture strain of 0.54. The maximum relative error between the shear force predicted by the Caragana korshinskii Kom. branches model using these optimal parameters and the actual measured shear force was 9.68%.
(3)
The discrepancy between the tensile force predicted by the model and the actual tensile force of the Caragana korshinskii Kom. branches was just 1.7%, demonstrating the model’s high accuracy in predicting the fracture behavior of the Caragana korshinskii Kom. branches.
Combining a finite element simulation with actual cutting tests improves cutting research efficiency while reducing costs and time. A simulation predicts the mechanical behavior, stress distribution, and crack development during cutting, helping optimize cutting parameters. Actual tests verify simulation results and provide data for real-world applications. This complementary approach reduces unnecessary experiments, explores cutting performance under various conditions, and optimizes tools and processes, enhancing experimental accuracy and efficiency.

Author Contributions

Conceptualization, Q.S.; methodology, J.Z.; software, Q.S.; validation, Q.S. and W.L.; formal analysis, J.Z.; investigation, Z.Y.; resources, Z.Y.; data curation, Q.S. and Z.L.; writing—original draft preparation, Q.S.; writing—review and editing, X.M.; visualization, X.M.; supervision, W.L. and Z.L.; project administration, Z.Y.; funding acquisition, Z.Y., J.Z. and Q.S. All authors have read and agreed to the published version of the manuscript.

Funding

This research was funded by the National Natural Science Foundation of China (52265035), the Inner Mongolia Autonomous Region Natural Science Foundation (2022MS05049), the Research Program of science and technology at Universities of Inner Mongolia Autonomous Region (NJZZ23047), the Program for improving the Scientific Research Ability of Youth Teachers of Inner Mongolia Agricultural University (BR230154) and (2024 fiscal funds) the Double First-Class Construction Fund—Discipline Construction Quality Improvement Project (DC2400000900).

Data Availability Statement

The original contributions presented in the study are included in the article; further inquiries can be directed to the corresponding author.

Conflicts of Interest

The authors declare no conflicts of interest.

References

  1. Wang, K.; Zheng, J.; Li, G.; Ma, Z.; Zhang, X.; Zhang, Q.; Yang, Z.; Huang, G. Caragana korshinskii of different planting years altered the soil water, carbon, and nitrogen storage in the different layers within level ditch on slope in a Semi-Arid Area. CATENA 2024, 242, 108126. [Google Scholar] [CrossRef]
  2. Li, X.; Huang, D.; Lin, X. Interlinked regulator loops of ABA and JA respond to salt and drought stress in Caragana korshinskii. Environ. Exp. Bot. 2024, 225, 105829. [Google Scholar] [CrossRef]
  3. Sun, X.; Ma, J.; Li, C.; Zang, Y.; Tian, J.; Li, L.; Li, Y.; Ye, F.; Zhang, D. Hypoglycemic oligostilbenes from the stems of Caragana sinica. Bioorg. Chem. 2023, 134, 106458. [Google Scholar] [CrossRef]
  4. Wang, X.; Huang, X.; Zhang, Z.; Duan, Z. Effect of Caragana korshinskii Kom. as a partial substitution for sheep forage on intake, digestibility, growth, carcass features, and the Rumen Bacterial Community. Trop. Anim. Health Prod. 2022, 54, 190. [Google Scholar] [CrossRef]
  5. Zhang, J.; Zheng, D.; Wu, K.; Zhang, X. Combustion characteristics of Caragana korshinskii Kom. J. Biobased Mater. Bioenergy 2019, 13, 69–78. [Google Scholar] [CrossRef]
  6. Wang, T.; Liu, H.; Duan, C.; Xu, R.; Zhang, Z.; She, D.; Zheng, J. The eco-friendly biochar and valuable bio-oil from Caragana korshinskii: Pyrolysis preparation, characterization, and adsorption applications. Materials 2020, 13, 3391. [Google Scholar] [CrossRef] [PubMed]
  7. Xu, X.; Yu, G.; Wang, J.; Xu, X.; Zhang, W.; Xu, Y. Study on preparation technology of high-quality biomass fuel pellets using Caragana korshinskii kom. POWDER. Wood Res. 2024, 69, 157–168. [Google Scholar] [CrossRef]
  8. Gao, Y.; Wang, Y.; Kang, F.; Kan, J. Multi-objective optimization of cross-section integrity rate and sawing power consumption in sawing Caragana korshinskii Kom. Branches. Ind. Crops Prod. 2023, 193, 116244. [Google Scholar] [CrossRef]
  9. Gao, Y.; Kang, F.; Kan, J.; Wang, Y.; Tong, S. Analysis and experiment of cutting mechanical parameters for Caragana korshinskii (C.k.) branches. Forests 2021, 12, 1359. [Google Scholar] [CrossRef]
  10. Xie, L.; Wang, J.; Cheng, S.; Zeng, B.; Yang, Z. Optimisation and finite element simulation of the chopping process for chopper sugarcane harvesting. Biosyst. Eng. 2018, 175, 16–26. [Google Scholar] [CrossRef]
  11. Ji, W.; Qian, Z.; Xu, B.; Chen, G.; Zhao, D. Apple viscoelastic complex model for bruise damage analysis in constant velocity grasping by gripper. Comput. Electron. Agric. 2019, 162, 907–920. [Google Scholar] [CrossRef]
  12. Xiong, D.; Ai, J.; Fu, M.; Yu, W.; Li, X.; Luo, H. Finite element analysis and experiment of cutting rape shoot stalks based on ansys. Proc. Inst. Mech. Eng. Part C J. Mech. Eng. Sci. 2024, 238, 3678–3688. [Google Scholar] [CrossRef]
  13. Chen, H.; Jin, L.; Fang, C.; Liu, L.; Kačániová, M.; Wang, J.; Lu, J.; Ban, Z. Integration of puncture loading and finite element simulations to predict the mechanical responses for kiwifruit. Postharvest Biol. Technol 2024, 217, 113102. [Google Scholar] [CrossRef]
  14. Bu, L.; Chen, C.; Hu, G.; Zhou, J.; Sugirbay, A.; Chen, J. Investigating the dynamic behavior of an apple branch-stem-fruit model using experimental and simulation analysis. Comput. Electron. Agric. 2021, 186, 106224. [Google Scholar] [CrossRef]
  15. Souza, V.H.S.; Dias, G.L.; Santos, A.A.R.; Costa, A.L.G.; Santos, F.L.; Magalhães, R.R. Evaluation of the interaction between a harvester rod and a coffee branch based on finite element analysis. Comput. Electron. Agric. 2018, 150, 476–483. [Google Scholar] [CrossRef]
  16. Meng, Y.; Wei, J.; Wei, J.; Chen, H.; Cui, Y. An ANSYS/LS-DYNA simulation and experimental study of circular saw blade cutting system of mulberry cutting machine. Comput. Electron. Agric. 2019, 157, 38–48. [Google Scholar] [CrossRef]
  17. Jiang, Y.; Liao, Y.; Liao, Q. Calibrated the simulation parameters of feed rapeseed stems based on the P-K failure model. J. Shenyang Agric. Univ. 2022, 53, 309–318. [Google Scholar]
  18. Kaygin, B.; Yorur, H.; Uysal, B. Simulating strength behaviors of corner joints of wood constructions by using Finite Element Method. Drvna Ind. 2016, 67, 133–140. [Google Scholar] [CrossRef]
  19. Amaruddin, H.I.; Hassan, R. 3D Finite Element Analysis of a wood dowel in bending perpendicular to the grain. Gading J. Sci. Technol. 2022, 5, 69–76. [Google Scholar]
  20. Henriques, J.; Xavier, J.; Andrade-Campos, A. Identification of orthotropic elastic properties of wood by digital image correlation and Finite Element Model updating techniques. Procedia Struct. Integr. 2022, 37, 25–32. [Google Scholar] [CrossRef]
  21. Zahedi, M.; Kazemi Najafi, S.; Füssl, J.; Elyasi, M. Determining elastic constants of poplar wood (Populus deltoides) by ultrasonic waves and its application in the Finite Element Analysis. Wood Mater. Sci. Eng. 2022, 17, 668–678. [Google Scholar] [CrossRef]
  22. Zhang, J.; Xin, D.; Lan, W.; Dang, K.; Niu, Z.; Cui, Y. Simulation and experiment on ultrasonic cutting process of clustered tomato stems. Trans. Chin. Soc. Agric. Mach. 2024, 55, 153–161. [Google Scholar]
  23. Florisson, S.; Gamstedt, E.K. An overview of lab-based micro computed tomography aided Finite Element Modelling of wood and its current bottlenecks. Holzforschung 2023, 77, 793–815. [Google Scholar] [CrossRef]
  24. Li, C.; Zhang, J.; Cao, L.; Zhang, X. Analysis of dynamic mechanical properties of Caragana korshinskii using split hopkinson pressure bar test. J. Northeast For. Univ. 2024, 52, 102–106. [Google Scholar]
  25. Huang, X.; Zhang, X.; Zhang, Y.; Xing, X.; Zhao, L.; Li, B.; Yang, C. Steam explosion, bacterial complex and their combination effeet on fiber degradation of Caragana harvested from different seasons. Acta Vet. Zootech. Sin. 2020, 51, 2197–2206. [Google Scholar]
  26. GB/T 1931-2009; Method of Testing in Compressive Strength Parallel to Grain of Wood. Standardization Administration of the People’s Republic of China: Beijing, China, 2009.
  27. Xu, L.; Li, Y.; Ma, Z.; Zhao, Z.; Wang, C. Theoretical analysis and finite element simulation of a rice kernel obliquely impacted by a threshing tooth. Biosyst. Eng. 2013, 114, 146–156. [Google Scholar] [CrossRef]
  28. Zhang, L.; Xie, Q.; Wu, Y.; Zhang, B. Research progress on constitutive model for wood. J. Build. Struct. 2023, 44, 286–304. [Google Scholar] [CrossRef]
  29. Yu, M.; Wang, B.; Ji, P.; Li, B.; Zhang, L.; Zhang, Q. Simulation Analysis of the Circular Sawing Process of Medium Density Fiberboard (MDF) Based on the Johnson–Cook Model. Eur. J. Wood Prod. 2024, 82, 447–459. [Google Scholar] [CrossRef]
  30. Kumar Reddy Sirigiri, V.; Yadav Gudiga, V.; Shankar Gattu, U.; Suneesh, G.; Mohan Buddaraju, K. A review on Johnson Cook material model. Mater. Today. Proc. 2022, 62, 3450–3456. [Google Scholar] [CrossRef]
  31. Liu, J.; Zhao, J.; Zhang, J.; Zhao, D. Cutting constitutive equation and its parameter measurement of oil tree peony stem. J. Beijing For. Univ. 2022, 42, 138–144. [Google Scholar]
Figure 1. Growth status of Caragana korshinskii Kom. branches and samples: (a) Caragana korshinskii Kom. growth status; (b) samples collected; (c) truncated specimen; (d) end surface after drying.
Forests 16 00090 g001
Figure 2. Equipment and specimens for shear and tensile mechanical testing of Caragana korshinskii Kom. branches: (a) electronic universal testing machine; (b) shear test; (c) shear specimen; (d) condition of the specimen after shearing; (e) tensile test; (f) tensile specimen; (g) condition of the specimen after fracture.
Forests 16 00090 g002
Figure 3. Finite element cutting model and mesh division of Caragana korshinskii Kom. branches: (a) three-dimensional model; (b) shear blade.
Forests 16 00090 g003
Figure 4. Construction process of finite element model of Caragana korshinskii Kom. branches.
Forests 16 00090 g004
Figure 5. Test flowchart.
Forests 16 00090 g005
Figure 6. Simulation model of Caragana korshinskii Kom. branches stretching.
Forests 16 00090 g006
Figure 7. Load displacement curve of Caragana korshinskii Kom. branches: (a) shear test; (b) tensile test.
Forests 16 00090 g007
Figure 8. Pareto diagram of Plackett–Burman experiment.
Forests 16 00090 g008
Figure 9. Shear test: (a) actual test; (b) simulation test.
Forests 16 00090 g009
Figure 10. Force versus displacement curves (shear test): (a) full curve; (b) linear growth curve.
Forests 16 00090 g010
Figure 11. Tensile test comparison: (a) actual stretching stage; (b) sample fracture; (c) simulation stretching stage; (d) simulated sample fracture.
Forests 16 00090 g011
Figure 12. Force versus displacement curves (tensile test).
Forests 16 00090 g012
Table 1. Plackett–Burman test parameters.
FactorsCodeLevels
−11
Density X10.70.9
Elastic modulusX216002400
Poisson’s ratioX30.30.5
Yield stress (MPa)X41525
Strain hardening modulus (MPa) X535
Strain Hardening IndexX60.40.8
Strain rate hardening parametersX70.10.5
Fracture strainX80.40.8
Table 2. Design and results of the Plackett–Burman test.
No.X1X2X3X4X5X6X7X8Fm (N)
11−1111−1−1−11756.66
2111−1−1−11−1930.1
31−111−11111792.87
4−1−1−11−111−11309.72
511−1111−1−11279.57
611−1−1−11−111026.45
7−1111−1−1−112085.32
8−1−1−1−1−1−1−1−1804.04
9−11−111−1112144.92
101−1−1−11−1111248.14
11−1−11−111−111110.21
12−111−1111−1903.01
Table 3. Results of variance analysis of Plackett–Burman test.
SourceSum of SquaresdfMean SquareF-Valuep-Value
Model2.358 × 10682.948 × 10533.690.0074 **
X18717.2518717.250.99630.3918
X210,076.35110,076.351.150.3619
X348,810.83148,810.835.580.0992
X41.575 × 10611.575 × 106179.980.0009 **
X520,337.16120,337.162.320.2248
X61.995 × 10511.995 × 10522.800.0175 *
X75918.9715918.970.67650.4711
X84.900 × 10514.900 × 10556.000.0049 **
Residual26,249.0438749.68
Cor Total2.384 × 10611
Note: p ≤ 0.01 (Extremely significant **); p ≤ 0.05 (Significant *); p > 0.05 (No significant).
Table 4. Significance analysis of Plackett–Burman test parameters.
RunX4X6X8Peak Shear Stress (N)Error (%)
1150.800.401081.1314.66
2170.720.441178.856.94
3190.640.481268.640.15
4210.560.521293.792.13
5230.480.561379.288.88
6250.400.601417.7111.91
Table 5. Central composite design experiment.
RunX4X6X8Fm (N)
1−11−11179.69
20001278.14
301.68101262.70
40001278.14
510−11295.05
600−1.6811150.42
70001278.14
80001278.14
9−1011178.85
10−1−111182.68
110001278.14
120−1.68101174.10
13001.6811338.58
141−111411.89
150001278.14
161−1−11278.79
171011424.60
18−1.681001076.85
191.681001447.98
20−1−1−11090.29
Table 6. Variance analysis.
SourceSum of SquaresdfMean SquareF-Valuep-Value
Model1.926 × 105921,403.0165.22<0.0001 **
X41.139 × 10511.139 × 105346.93<0.0001 **
X63885.4713885.4711.840.0063 **
X823,603.46123,603.4671.93<0.0001 **
X4X6158.311158.310.48240.5031
X4X82483.0612483.067.570.0205 *
X6X8758.411758.412.310.1594
X4267.85167.850.20680.6590
X623473.3913473.3910.580.0087 **
X821009.3011009.303.080.1100
Residual3281.6610328.17
Lack of Fit3281.665656.33
Pure Error0.000050.0000
Cor Total1.95 × 10519
Note: p ≤ 0.01 (Extremely significant **); p ≤ 0.05 (Significant *); p > 0.05 (No significant).
Table 7. Comparison of peak shear force of Caragana korshinskii Kom. branches.
Diameter (mm)Peak Shear Force (N)Error (%)
Actual Value (N)Simulation Value (N)
8651.96588.829.68
10927.32876.635.47
121237.81275.463.04
141316.251376.224.56
161486.411586.566.74
Disclaimer/Publisher’s Note: The statements, opinions and data contained in all publications are solely those of the individual author(s) and contributor(s) and not of MDPI and/or the editor(s). MDPI and/or the editor(s) disclaim responsibility for any injury to people or property resulting from any ideas, methods, instructions or products referred to in the content.

