Article

Effects on Carbon Sequestration of Biomass and Investment in State-Owned Forest Farms: A Case Study of Shaanxi Province, China

by
Li Gao
,
Hua Li
* and
Shuqiang Li
College of Economics and Management, Northwest A&F University, Xianyang 712100, China
*
Author to whom correspondence should be addressed.
Forests 2025, 16(1), 60; https://doi.org/10.3390/f16010060
Submission received: 2 December 2024 / Revised: 28 December 2024 / Accepted: 29 December 2024 / Published: 1 January 2025
(This article belongs to the Section Forest Economics, Policy, and Social Science)

Abstract

:
Enhancing carbon sequestration capacity through effective forest management is a critical strategy for mitigating climate change. China has established public administrations, known as state-owned forest farms (SFFs), primarily to manage state-owned forests. This study examines the carbon sequestration effects of forestry investment made by 211 SFFs in Shaanxi Province from 2000 to 2018, using a panel fixed effects model and a panel threshold model. The findings reveal that SFF investment has a significant time-lag effect on carbon sequestration, with the marginal contribution peaking three years after the initial investment. Additionally, the impact of investment exhibits spatial heterogeneity, varying across regions due to differences in environmental and ecological conditions. Threshold effects are also identified, indicating that the effectiveness of carbon sequestration is constrained by the scale and structure of investment, with diminishing returns observed beyond optimal levels. Furthermore, we found that investment increases carbon sequestration mainly by expanding forest area and improving forest quality. These findings underscore the importance of cost-effectiveness analyses to optimize forestry investment decisions. SFFs are advised to prioritize appropriate investment timing, regions, scales, and structures to achieve optimal carbon sequestration benefits and maximize resource utilization, supporting sustainable forest management and climate change mitigation efforts.

1. Introduction

Global climate change, driven by greenhouse gas (GHG) emissions, presents a significant challenge to human development, and combating global warming has become a collective consensus and societal responsibility [1,2]. In addition to carbon reduction and capture through technological means, the nature-based solutions—such as ecosystem protection and restoration—also offer effective ways to limit warming [3]. Forests, as a vital component of terrestrial ecosystems, account for 80–90% of global plant biomass [4], maintain a carbon sink of approximately 3.56 Pg per year [5], and serve as key contributors to carbon sequestration and storage [6,7]. Enhancing carbon sequestration in forests is thus crucial for mitigating and adapting to climate change [8].
The diversity of forest ownership types has significant implications for forest management and the attainment of policy objectives [9]. Two key institutional factors—the structure of forest ownership and public sector forestry expenditures—play a critical role in shaping forest management practices and reflect the level of investment in the sector [10]. According to forest tenure, forest ownership is typically classified into public, private, and unknown categories. In 2015, publicly owned forests spanned 2912 million hectares, representing 73% of the global forest area, with 83% of these managed by public administrations [11]. Enhancing the carbon sequestration capacity of publicly owned forests, particularly those managed by public entities, is thus a crucial strategy for increasing forest carbon sinks.
China’s forest tenure system is divided between state-owned and collective forests. In 2021, state-owned forests covered 0.92 billion hectares, representing 40.19% of the total forested area, with a timber volume of 10.53 billion cubic meters, or 55.45% of the national total [12]. Although the timber volume per unit area in state-owned forests exceeds that of collective forests, it remains only 83% of the global average (the world average growing stock per unit area was 137.1 m3/ha (https://openknowledge.fao.org/handle/20.500.14283/ca9825en (accessed on 29 December 2024)), indicating that the potential of state-owned forests has not been fully realized. To better manage state-owned forests, the Chinese government has established administrations known as state-owned forest farms or state-owned forest enterprises (hereafter, collectively referred to as SFFs), which also hold management rights over some collective forests. Since the early 21st century, China’s forestry sector has pursued a development strategy centered on ecological construction. However, logging bans or restrictions on most SFFs in northern China have led to a sharp decline in revenue. Over time, this has created challenges, including insufficient investment in state-owned forests and delayed employee salary payments. In 2015, the Chinese government launched a reform of the SFF system aimed at increasing investment in state-owned forests and improving employee incentives through institutional reforms and financial support. The reform sought to expand the area and timber volume of state-owned forests, enhance forest carbon sinks, and improve the forests’ ability to mitigate climate change. Moreover, the development of a carbon sink market is expected to provide economic incentives to SFFs, ensuring the long-term sustainable management of state-owned forests.
Previous research on the effect of forest inputs in China primarily focuses on collective forests or all forests [13,14]. There is relatively little literature available on the output effect or carbon sequestration effect of SFF investment. Investigating the carbon sequestration effect of SFF investment is crucial for understanding the profit potential of carbon sink trading in state-owned forests and assessing its economic feasibility. Furthermore, this research contributes to an accurate evaluation of the role SFFs play in forest management in China. In addition, SFFs face limited financial support and revenue. Identifying more cost-effective investment areas, scales, and structures can help improve the efficiency of capital use and optimize resource allocation. Further, this study on sustainable forest management provides a valuable reference for countries with forest strategies, such as the European Union.
The purpose of this study is to assess the carbon sequestration effect of SFF investment in China from a cost-effectiveness perspective and to optimize SFF investment decisions. First, we analyze the direct impact and impact channels of SFF investment on carbon sequestration and propose research hypotheses. The direct impacts of SFF investment on carbon sequestration include immediate effects, time-lag effects, spatial heterogeneity, and threshold effects. The impact channels involve increasing forest area and improving forest quality. Second, we focus on SFFs in Shaanxi Province, whose development history and management practices closely resemble those of other northern state-owned forests in China. Third, we use a panel fixed effects model, a panel threshold model, and a mediating effect model to test these hypotheses. Specifically, we assess the immediate impact of SFF investment on forests, calculate the optimal lag period for investment returns, and identify priority investment areas, and the optimal investment scale and structure. On this basis, we further clarify the channels through which investment influences carbon sequestration. Finally, we offer policy recommendations for improving the management of state-owned forests.

2. Theoretical Analysis and Research Hypothesis

This section discusses the analysis of the immediate effect of SFF investment on carbon sequestration. As a key productive input, investment or capital determines output when combined with other factors such as labor, land, and technology. Specifically, SFF investment in forestation (including afforestation and reforestation) and forest management (e.g., rotation, thinning, fire management, and protection against insects) can contribute to increasing forest coverage, enhancing forest stock, and preventing forest degradation, all of which boost carbon sequestration [15,16]. However, certain types of forestation practices may destroy the original vegetation and reduce the immediate carbon sequestration [17]. Similarly, while forest management measures are generally intended to promote the long-term health and growth of forests, some activities, such as thinning, involve the removal of trees, which directly reduces aboveground biomass and carbon stocks [18,19]. That is, forest management may reduce current carbon sequestration. Furthermore, studies have shown that financial investment in China’s Sloping Land Conversion Program has a significant negative direct effect on NDVI [20]. Therefore, the immediate effect of SFF investment on carbon sequestration may not be significantly positive (Hypothesis 1).
This section discusses the analysis of the time-lag effects of SFF investment on carbon sequestration. In economic production, investment often exhibits a time-lag effect [21], meaning there is a delay between the initial investment and the realization of its impact on output. In ecological production, investment also exhibits time-lag effects [22]. Due to the biological characteristics of forests, certain outcomes of investment materialize at different rates. Forest area change resulting from investment is the most timely, while the effect of forest stock and forest carbon stock needs a certain growth cycle to be realized [23]. Ding et al. [20] estimate that the ecological effect of forestation investment peaks around the fourth year. Zhang et al. [18] also find that forest ecosystems’ carbon stocks respond to forest management over several years. Therefore, we hypothesize that there are time-lag effects of SFF investment on carbon sequestration (Hypothesis 2).
This section discusses the spatial heterogeneity analysis of the carbon sequestration effect of SFF investment. In addition to anthropogenic disturbances such as forest management behavior, climatic conditions, ecological endowment, and geographic location also affect forest carbon sequestration [24]. Forest growth is highly dependent on the natural environment. Factors such as local climate, initial ecological conditions, and soil quality affect the growth process, which in turn influences the level of carbon sequestration. Furthermore, SFFs are distributed across different geographic regions, each serving diverse primary functions, such as wind and sand control, water conservation, and biodiversity maintenance. These variations in ecological roles may lead to different management approaches. Hong et al. [25] found that biomass density increase after forestation shows high spatial heterogeneity, and forestation in wet (cold) regions is more effective in carbon sequestration than in dry (warm) regions. Therefore, the carbon sequestration effect of SFF investment may vary across regions, and the lag period of investment may also be different (Hypothesis 3).
This section discusses the analysis of the threshold effects of SFF investment on carbon sequestration. The carbon sequestration effect of SFF investment may be influenced by the investment scale and structure. In line with the law of diminishing marginal returns, the marginal return on investment declines as the investment stock continues to accumulate, assuming other inputs remain constant [26]. This suggests that there is an optimal investment scale beyond which additional capital yields diminishing returns, making efficient capital utilization crucial. Therefore, we propose that there exists an investment scale threshold, with different marginal returns on either side (Hypothesis 4-1). Different forestry activities play different roles in forest growth. Both forestation and forest management increase carbon sequestration but with differences in marginal contributions and time lags [27]. Therefore, we propose that SFFs investing in different forestry activities may yield different carbon sequestration effects, indicating the existence of an investment structure threshold with different marginal returns on either side (Hypothesis 4-2).
The functions of forests in increasing carbon stocks are addressed through two activities under the Kyoto Protocol: forestation and forest management. Forestation increases regional carbon sequestration by changing land use types and increasing forest area [28]. Forest management increases carbon sequestration by promoting forest growth and enhancing forest quality through forestry techniques such as adjusting forest structure, optimizing forest density, and improving ventilation and light conditions [29,30]. The SFF investment is primarily allocated to forestation and forest management. Therefore, we hypothesize that the SFF investment enhances carbon sequestration by expanding forest areas and improving forest quality (Hypothesis 5).

3. Materials and Methods

3.1. Study Area

Shaanxi Province, located in northwestern China, is traversed by both the Yangtze and Yellow River basins. The province features higher elevations in its northern and southern regions compared to the central areas (Figure 1). Its terrain is complex and diverse, encompassing plateaus, mountains, plains, and basins. Spanning three distinct climate zones, Shaanxi experiences significant climatic variation between its northern and southern areas. The province’s average annual temperature is 13.7 °C, and the average annual precipitation is 680 mm [31]. Shaanxi is mainly dominated by broad-leaved mixed forests, with dominant tree species in pure forests including oaks, Chinese pine, and black locust. Forest land is mainly located in the southern part (Figure 1), and timber production totaled 190 thousand cubic meters in 2022 [12].
The state-owned forests in Shaanxi Province cover an area of 2.64 million hectares, representing 29.52% of the total forest area, with a storage capacity of 249.56 million cubic meters, or 43.82% of the total [12]. All SFFs in the province are located within natural forest protection project areas and are primarily responsible for public welfare functions, such as forest protection and resource management. There are 208 SFFs in Shaanxi, employing 11,390 workers, and collectively managing an operational area of 3.82 million hectares [32]. Shaanxi Province is geographically divided by the Beishan and Qinling Mountains into three major regions: the Loess Plateau in northern Shaanxi (LP), the Guanzhong Plain in central Shaanxi (GP), and the Qinba Mountain area in southern Shaanxi (QM). SFFs are distributed across all three regions, playing vital ecological roles.

3.2. Variable Selection

(1)
Dependent variable. To examine the carbon sequestration effect of SFF investment, we select forest carbon sequestration as the investment output. Forest carbon sequestration is estimated based on China’s forest inventory data [33], which are relatively accurate. However, these data are usually collected only once every five years and are reported at the provincial level, making it difficult to quantify the carbon sequestration of individual SFFs. The InVEST model, which calculates carbon sequestration based on land use changes and fixed parameters [34], considers changes in forest area but does not capture variations in forest quality. The net primary productivity (NPP) of vegetation in remote sensing data accurately characterizes the amount of organic matter accumulated by green plants after photosynthesis minus autotrophic respiration [35]. It can reflect forest vegetation changes in a more timely and continuous manner. Furthermore, forest vegetation tends to sequester carbon more rapidly and in greater quantities than soil, particularly in the early stages of forestation [36], and the carbon storage changes in soil after forestation are more complex [37]. Thus, we use forest vegetation carbon sequestration, estimated via NPP, as the evaluation index of the ecological effect of SFF investment.
(2)
Independent variables. SFF investment refers to the total expenditures on forestry activities across all stages of forest growth. These activities specifically include afforestation and reforestation, thinning, fire management, protection against insects, and other related efforts. Furthermore, these expenditures have been adjusted for inflation, using the consumer price index (CPI), to reflect real expenditures. This adjustment ensures a more accurate representation of the investment’s value over time.
(3)
Control variables. First, socio-economic factors. As basic factors in production function, labor and land are key inputs that influence the final output, which in this study is the amount of carbon sequestration. To measure the impact of labor and land inputs, we include the number of employees and the operating area of SFFs. Additionally, employee motivation and pressure affect work productivity [38]. Thus, we use employee salary as a proxy variable for motivation and management scale per employee as a proxy for pressure to evaluate their effect on carbon sequestration. Second, natural factors. Carbon accumulation in vegetation occurs through photosynthesis, a process that is temperature-sensitive and typically more efficient at higher temperatures [39]. Thus, temperature may affect carbon sequestration. Wind speed can influence a tree’s physiological processes, growth, and survival [40], potentially affecting carbon sequestration as well. Moderate precipitation is crucial for forest survival and growth [41]. In addition, relatively static factors such as soil quality, slope inclination, and slope orientation are important drivers of forest growth but are not shown separately due to the use of panel fixed effect models. Finally, forest quantity and quality are also influenced by previous forest conditions [42]. To capture this dynamic, we introduce the forest stock lagged by one period as a proxy for the initial forest endowment in the model.
(4)
Threshold variables. The threshold variables in this study include investment scale and investment structure. We choose SFF investment in forestry activities as a proxy variable for the investment scale. Since forestation is a key forestry activity and constitutes a significant portion of SFF investment, we use forestation investment as a proxy for investment structure. As with other expenditures, nominal forestation investment is adjusted to real expenditures using the consumer price index (CPI) to account for inflation.
(5)
Channel variables. In this study, we assume that the impact of SSF investment on carbon sequestration operates through two channels: increasing forest area and improving forest quality. We use forestation area to represent the increase in forest area, including afforestation area and reforestation area. Forest quality is typically measured by the stock volume per unit area. However, the statistical intervals for forest stock volume data in SFFs are at least five years, making it difficult to reflect changes in forest quality in a timely and continuous manner. Considering that forest management is a key technical means to enhance forest quality, we choose the newly added forest management area as a proxy variable for forest quality improvement.

3.3. Data Sources and Processing

(1)
Study period and sample. Our sample consists of 211 state-owned forest farms (SFFs) in Shaanxi Province, with data spanning from 2008 to 2018. The comprehensive reform of SFFs in China commenced in 2015, during which SFFs in Shaanxi underwent mergers and reorganizations, leading to changes in their fundamental characteristics. To ensure consistency and completeness in our dataset, we base our statistical analysis on the information available for these SFFs as of 2008.
(2)
Estimation of vegetation carbon sequestration of forests managed by SFFs. Green vegetation absorbs CO2 from the air, produces organic matter, and releases oxygen through photosynthesis. The chemical equation is as follows: 6 CO 2 + 6 H 2 O C 6 H 12 O 6 + 6 O 2 , which means that 1.62 g CO2 could be fixed for 1g dry matter formed by the vegetation. The carbon content of the dry matter is about 45% of the NPP. Therefore, the formula for the amount of carbon sequestered is cs = NPP / 0.45 × 1.62 in g/m2 [43,44,45]. Lastly, using the 211 SFFs’ boundary map, we extract the vegetation carbon sequestration of forests managed by each SFF from 2008–2018 by ArcGIS10.7. The NPP data are derived from the Moderate Resolution Imaging Spectroradiometer (MODIS) NPP product (MOD17A3HGF) (https://lpdaac.usgs.gov/products/mod17a3hgfv006/ (accessed on 30 July 2023)) released by the National Aeronautics and Space Administration (NASA), with a spatial resolution of 500 m.
(3)
Other variables. The data on SFF investment, employee number, operating area, employee salary, management scale per employee, forest stock, forestation investment, forestation area, and forest management area are obtained from the National Forestry and Grassland Administration (NFGA). Further, we supplement and adjust the data based on our primary survey. The consumer price index data are from the Shaanxi Statistical Yearbook. The average annual precipitation and temperature data are from the resource and environment data cloud platform of the Chinese Academy of Sciences (https://www.resdc.cn/ (accessed on 29 December 2024)). The station data on wind speed are retrieved from the National Meteorological Science Data Center of China (https://data.cma.cn/ (accessed on 29 December 2024)). Variable design and descriptive statistics are reported in Table 1.

3.4. Method

3.4.1. Panel Fixed Effects Model

The panel fixed effects model can solve omitted variable bias caused by unobserved individual or temporal heterogeneity, and obtain relatively consistent estimates. Consequently, this model allows for an accurate estimation of the marginal contribution of SFF investment to carbon sequestration.
c s i t = α 1 i n v e s t i t + α 2 e m p l o y e e i t + α 3 a r e a i t + α 4 p e r s a l a r y i t + α 5 p e r s c a l e i t +     α 6 t e m p i t + α 7 w i n d i t + α 8 p r e i t + α 9 f o r e s t _ s t o c k i , t 1 + μ i + ε i t
c s is the vegetation carbon sequestration of SFF-managed forests, and i n v e s t is the SFF investment. Further, e m p l o y e e is the number of employees, a r e a is the operating area of SFFs, p e r s a l a r y represents employee salary, p e r s c a l e indicates management scale per employee, t e m p is the average annual temperature, w i n d is wind speed, and p r e is average annual precipitation. f o r e s t _ s t o c k is forest stock. In addition, α 1 to α 9 are parameters for variables, i represents the SFFs, t represents the year, μ is the fixed effect, and ε is the error term.

3.4.2. Panel Threshold Model

The threshold effect occurs when a variable reaches a specific critical value, triggering sudden structural changes in the magnitude or direction of the independent variable’s impact on the dependent variable [46]. The critical value is called the threshold value. This structural mutation is endogenously determined by the sample, which avoids statistical and estimation bias caused by subjective judgment of the threshold. To examine whether the carbon sequestration effect of SFF investment is affected by investment scale and structure, we adopt panel threshold models for empirical testing. For brevity, we focus here on a single threshold model, outlined as follows:
c s i t = β 0 i n v e s t i t I i n v e s t i t γ + β 1 i n v e s t i t I i n v e s t i t > γ + β 2 e m p l o y e e i t + β 3 a r e a i t + β 4 p e r s a l a r y i t + β 5 p e r s c a l e i t + β 6 t e m p i t + β 7 w i n d i t + β 8 p r e i t + β 9 f o r e s t s t o c k i , t 1 + μ i + ε i t
c s i t = δ 0 i n v e s t i t I f o r i n v i t γ + δ 1 i n v e s t i t I f o r i n v i t > γ + δ 2 e m p l o y e e i t + δ 3 a r e a i t + δ 4 p e r s a l a r y i t + δ 5 p e r s c a l e i t + δ 6 t e m p i t + δ 7 w i n d i t + δ 8 p r e i t + δ 9 f o r e s t s t o c k i , t 1 + μ i + ε i t
where I · denotes an indicator function equal to 1 when the condition in the parentheses is satisfied and 0 otherwise, γ is a specific threshold value to be estimated, f o r i n v is forestation investment, β 0 to β 9 and δ 0 to δ 9 are the coefficients to be estimated for the models, and the definitions of the other symbols are the same as in Equation (1).

3.4.3. Mediating Effect Model

We use a stepwise regression method [47] to test the mediating effects of the forestation area and forest management area, in order to verify whether investment impacts carbon sequestration by altering forest area and forest quality. Taking forest area as the mediating variable, the following models are set up:
f o r a r e a i t = η 1 i n v e s t i t + η 2 e m p l o y e e i t + η 3 a r e a i t + η 4 p e r s a l a r y i t + η 5 p e r s c a l e i t +     η 6 t e m p i t + η 7 w i n d i t + η 8 p r e i t + η 9 f o r e s t _ s t o c k i , t 1 + μ i + ε i t
c s i t = γ 11 i n v e s t i t + γ 12 f o r a r e a i t + γ 2 e m p l o y e e i t + γ 3 a r e a i t + γ 4 p e r s a l a r y i t + γ 5 p e r s c a l e i t +     γ 6 t e m p i t + γ 7 w i n d i t + γ 8 p r e i t + γ 9 f o r e s t _ s t o c k i , t 1 + μ i + ε i t
where f o r a r e a is the forestation area. Equation (1) represents the total effect of investment on carbon sequestration. Equation (4) represents the effect of investment on the mediation variable, the afforestation area. In Equation (5), γ 11 and γ 12 represent the direct effects of investment and the afforestation area on carbon sequestration, respectively, while η 1 γ 12 represents the indirect effect of investment on carbon sequestration through the forestation area.

4. Results

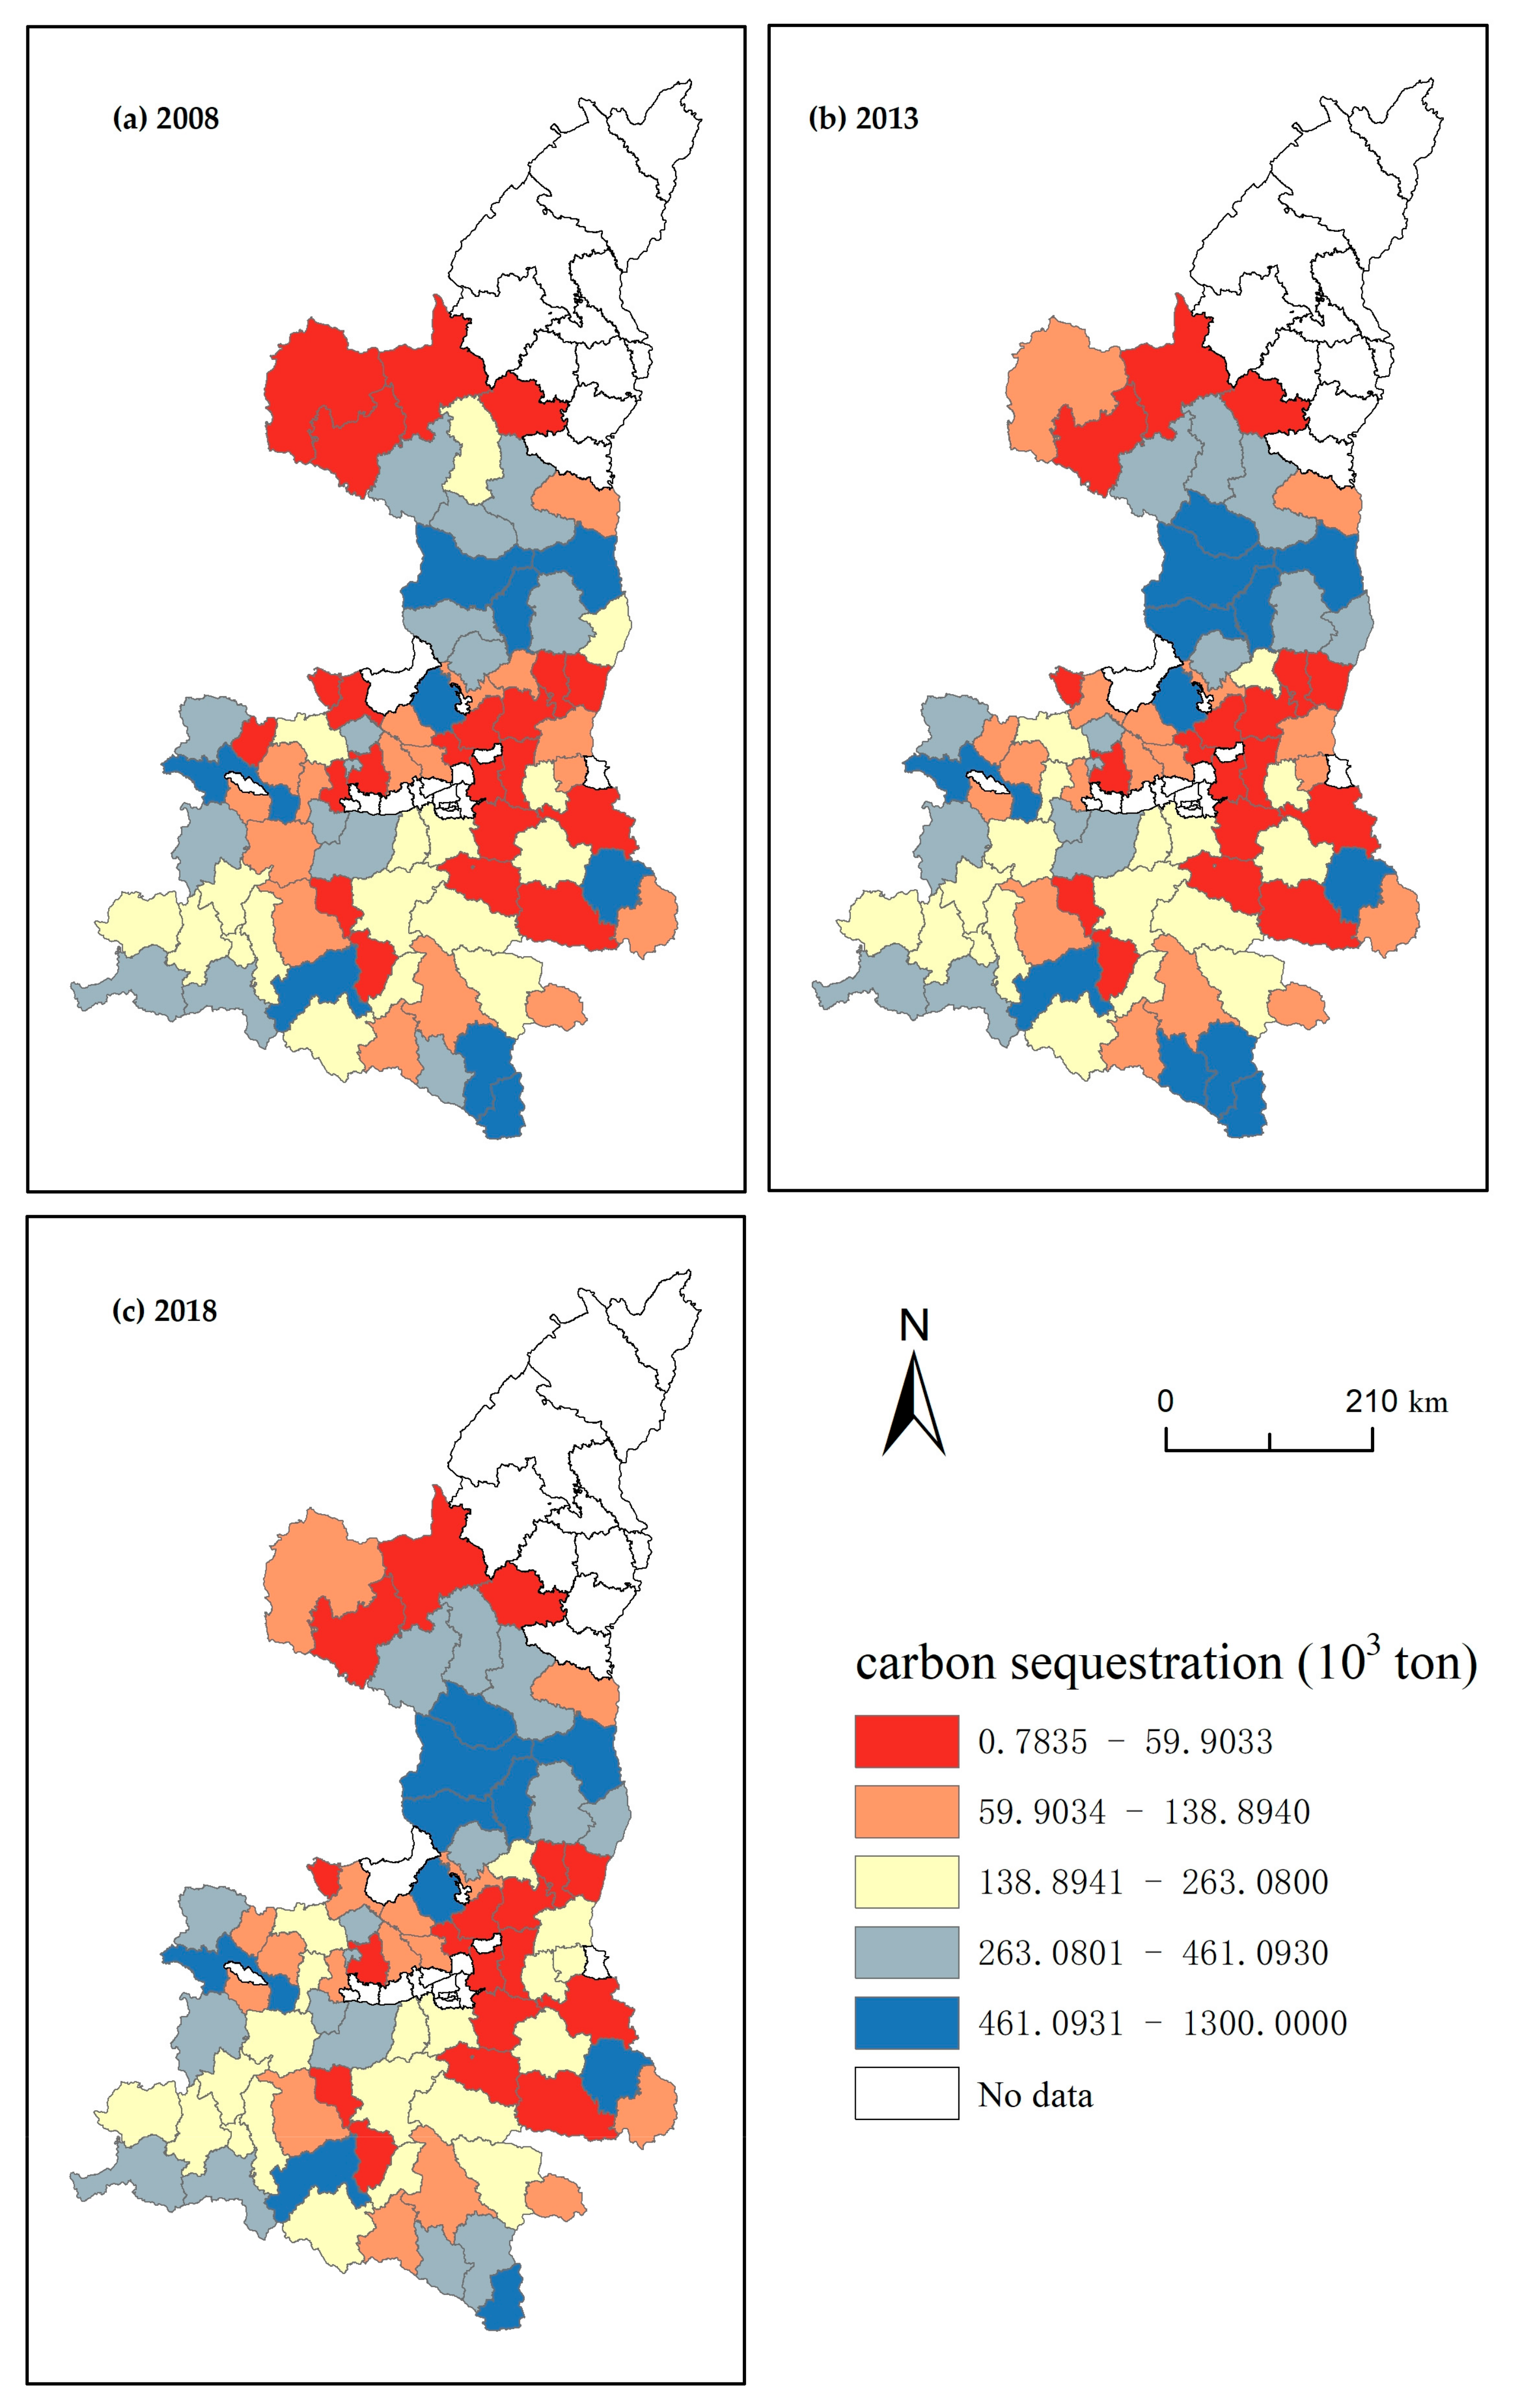
4.1. Changes in Carbon Sequestration and Investment by SFFs

Figure 2 illustrates an upward trend in SFF investment from 2008 to 2018. By 2018, SFF investment had increased by CNY 17,140.37 million, representing a 3.85-fold rise compared to 2008. Similarly, carbon sequestration of forests managed by SFFs exhibited an overall upward trend with fluctuations. In 2018, carbon sequestration reached 64.28 Tg C, a 20.25% increase over the 2008 level.
State-owned forests and collective forests in China are interspersed, resulting in the decentralized distribution of SFF operating areas. To better capture the spatial variation in carbon sequestration, we calculated the average carbon sequestration of SFFs at the county level and visualized it using ArcGIS, classifying values by quintiles (Figure 3). In general, SFFs with high carbon sequestration are predominantly located south of the LP, west of the GP, and south of the QM. Carbon sequestration in 2013 showed a significant increase compared to 2008, with SFFs in four counties in the LP improving by one quintile and SFFs in seven counties in the GP also experiencing an increase. However, changes in the QM were less pronounced, with only one county showing an improvement. By 2018, carbon sequestration levels had not changed significantly compared to 2013, with only a few SFFs in the GP showing further improvement.

4.2. Assessment of the Carbon Sequestration Effect of SFF Investment

4.2.1. Analysis of Immediate and Lagged Carbon Sequestration Effect of Investment

Table 2 presents the estimation results for the carbon sequestration effect of SFF investment. Model (1) examines the immediate effect of SFF investment on carbon sequestration. The results indicate that increasing investment has no significant effect on current carbon sequestration, thereby confirming Hypothesis 1. Model (2) demonstrates that SFF investment exhibits a significant time-lag effect, supporting Hypothesis 2. To evaluate this time-lag effect, we introduce the lagged term of investment into the model and apply the maximum marginal contribution method to determine the optimal lag period [20]. Model (2) reveals that the marginal contribution to carbon sequestration is maximized when investment is lagged by three periods. Specifically, for every CNY 10 thousand increase in investment, carbon sequestration rises by an average of 0.0204 thousand tons.
Regarding the control variables, the number of employees, operating area, employee salary, forest stock with a one-period lag, average annual temperature, and wind speed all have positive and significant effects on carbon sequestration, with the directions of regression coefficients consistent with expectations. However, annual average precipitation exhibits a significantly negative effect on carbon sequestration in both Model (1) and Model (2). After introducing the quadratic term for precipitation, Model (3) indicates a U-shaped relationship, where the effect of precipitation on carbon sequestration initially decreases before increasing. Additionally, the effect of management scale per employee on carbon sequestration is not statistically significant.
To further assess the reliability of the regression results from Model (2) in Table 2, we conduct robustness tests using variable transformations and extreme value treatments (Table 3). Model (1) presents the estimation results after logarithmic transformation of the variables, indicating that a 1% increase in SFF investment leads to an average 0.0007% increase in carbon sequestration after three periods. Model (2) shows the results using the present values of economic variables, including investment and employee salaries. Model (3) reports the results after applying a 1% trimming of the full sample data. In summary, the results from Models (1)–(3) in Table 3 confirm the robustness of the regression findings from Model (2) in Table 2, reinforcing the conclusion that there is a positive and significant time-lag effect of SFF investment on carbon sequestration.

4.2.2. Spatial Heterogeneity Analysis of Carbon Sequestration Effect of Investment

Table 4 demonstrates that the optimal lag period and marginal contribution of SFF investment vary across regions, thereby verifying Hypothesis 3. To explore the spatial heterogeneity of investment effect, we introduce an interaction term between regional variables and investment into the model. Model (1) shows that, with a three-period lag, the carbon sequestration effect is significant only in the LP. Using split-sample regressions, we further estimate the optimal lag period for the carbon sequestration effect of investment in each region, including the LP, the GP, and the QM. Models (2)–(4) reveal regional differences in both the optimal lag period and the marginal contribution of SFF investment. Specifically, the optimal lag period is one period in the LP, three in the GP, and six in the QM. Interestingly, the coefficient on employee salary in Model (4) is highly significant but exhibits the opposite sign from what was anticipated. To test for a possible nonlinear effect, we introduce a squared term for this variable in Model (4). Model (5) shows that all coefficient signs align with expectations, and the coefficient values are consistent with those in the total sample regression (Model (2) in Table 2). Notably, the optimal lag period for SFF investment in the QM adjusts to four.

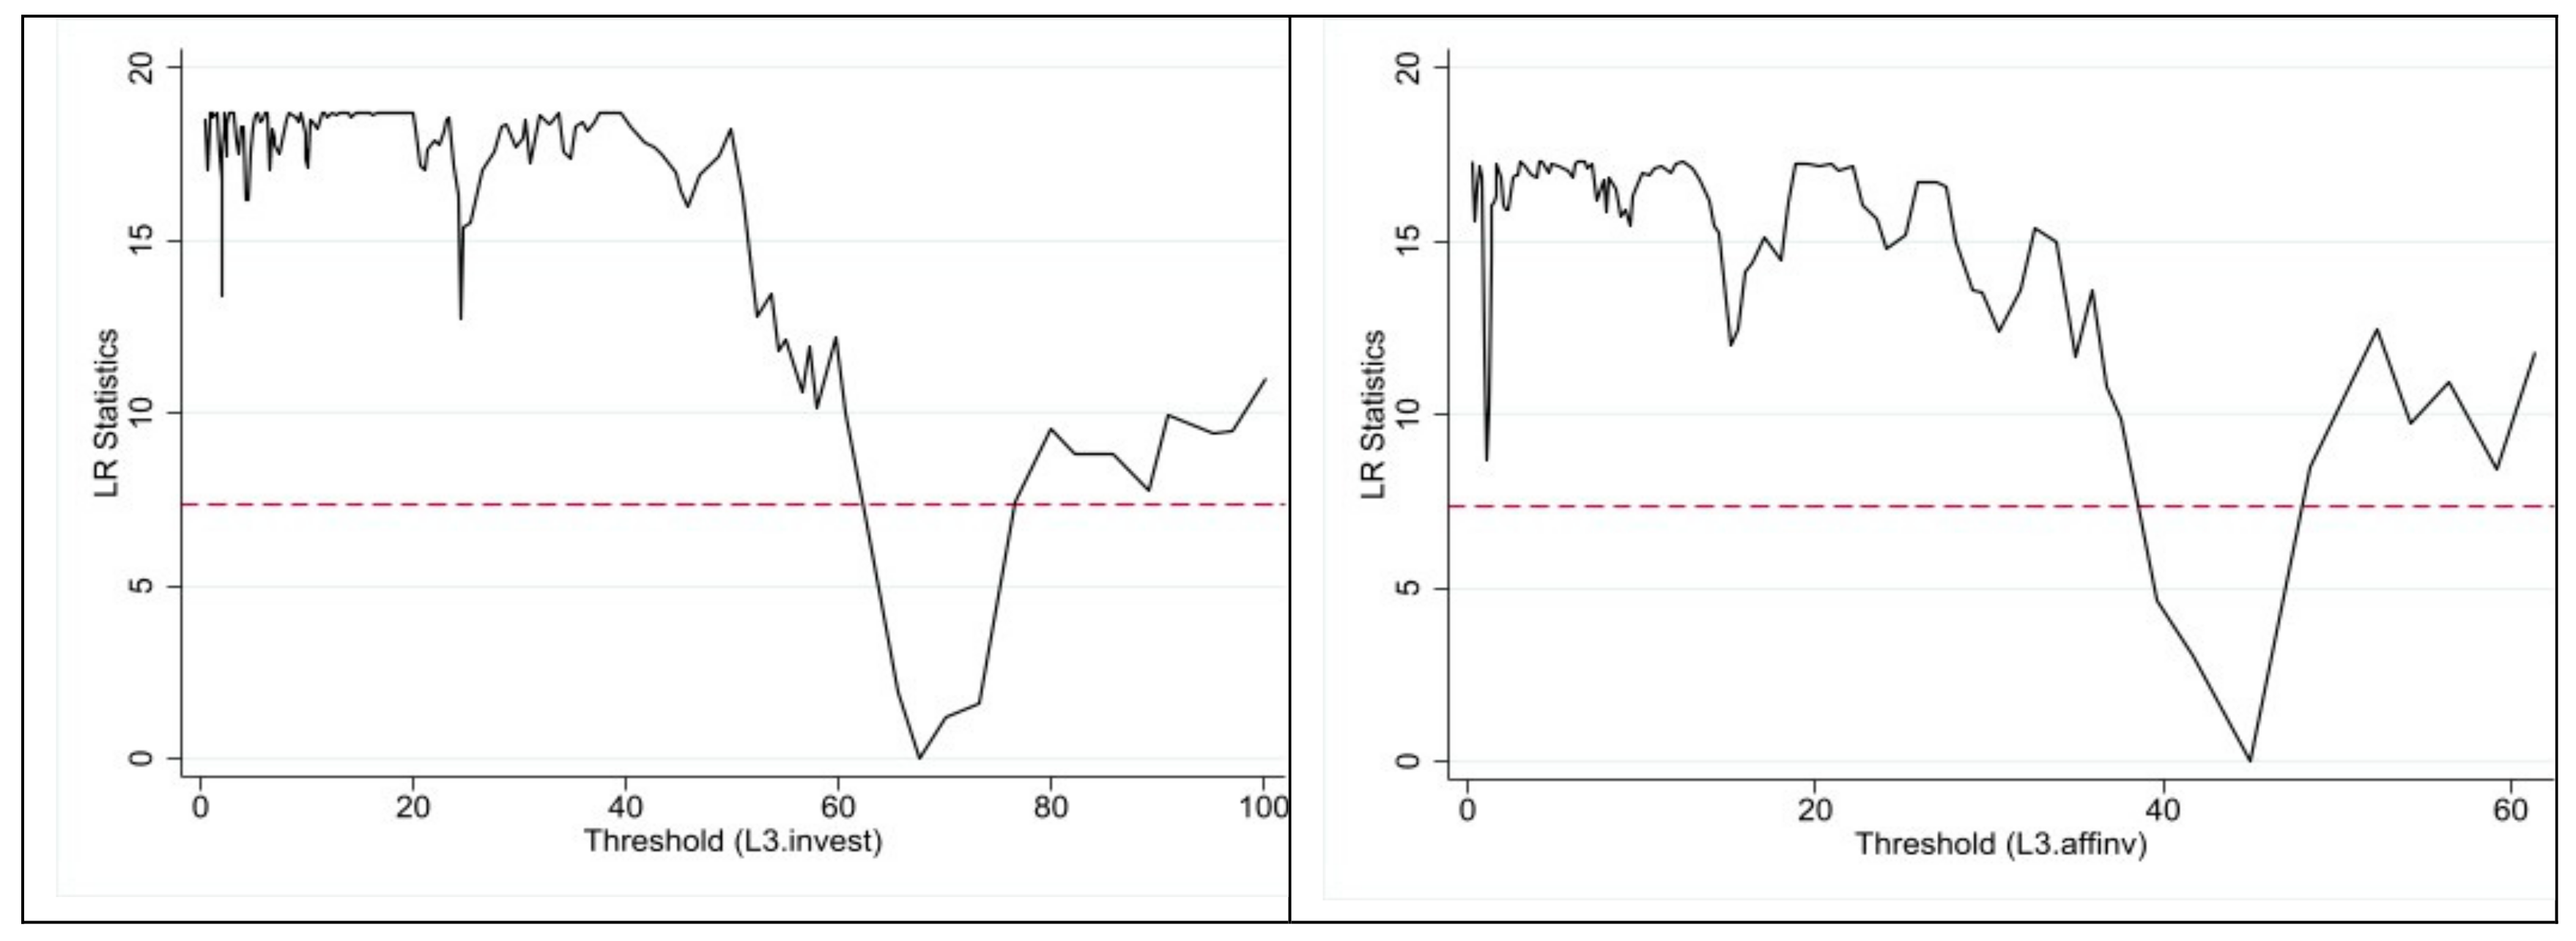
4.2.3. Analysis of the Threshold Effects of SFF Investment on Carbon Sequestration

To investigate the threshold effects of SFF investment, we use total investment and forestation investment with a three-period lag as threshold variables. The objective is to test whether the carbon sequestration effect of SFF investment is influenced by the scale and structure of the investment. Before using the panel threshold model, we need to test the existence of the threshold effects and further determine the number and value of thresholds. Table 5 shows that two single threshold models pass the reliability tests. Moreover, likelihood ratio (LR) tests further verify the existence of these two thresholds. Figure 4 shows that the LR intersects the red dashed line (critical value), indicating that both single thresholds are significant at the 95% confidence level.
Table 6 demonstrates that the threshold effects of SFF investment are significant, confirming Hypotheses 4-1 and 4-2. According to production theory, capital adheres to the law of diminishing marginal returns. Therefore, SFF investment is introduced as a threshold variable in the panel threshold model to examine the impact of investment scale on carbon sequestration. Model (1) indicates that when the investment scale is below CNY 6.76162 million, the marginal carbon sequestration is 0.2005 thousand tons. However, when the investment scale exceeds CNY 6.76162 million, the marginal return decreases to less than 15% of the previous level. This suggests that the carbon sequestration effect of SFF investment is influenced by investment scale. Model (2) shows that when forestation investment is below CNY 4.49730 million, the marginal carbon sequestration is 0.1715 thousand tons. When forestation investment exceeds CNY 4.49730 million, the marginal return is approximately 15.45% of the prior level. In other words, the carbon sequestration effect of SFF investment is also affected by investment structure. Therefore, as forestation investment reaches a certain threshold, increased emphasis should be placed on forest management.

4.2.4. Analysis of the Impact Channels of SFF Investment on Carbon Sequestration

To further understand the channels through which SFF investment impacts carbon sequestration, we use mediating effect models to test whether investment affects carbon sequestration by increasing forest area and improving forest quality (Table 7). Model (1) shows that the impact of investment on forestation area is significantly positive, indicating that investment increases forest area. Model (2) shows that when both investment and forestation area are included, they still positively impact carbon sequestration. Model (3) shows that the impact of investment on forest management area is significantly positive, indicating that investment improves forest quality. Model (4) shows that when both investment and forest management area are included, they still positively impact carbon sequestration. These findings indicate that investment increases forest area and improves forest quality, which in turn enhances carbon sequestration. Based on this, Hypothesis 5 is confirmed.

5. Discussion

Our study assesses the carbon sequestration effects of SFF investment based on a cost-effectiveness perspective. First, compared with previous studies, we focus on SFFs, the management organizations of state-owned forests in China. Compared with collective forest managers, SFFs are more scaled and organized, potentially leading to differences in carbon sequestration outcomes. However, existing studies have focused more on collective forests or “mixtures” of the two [13,14]. Our study thus contributes to a deeper understanding of state-owned forest management in China. Second, we apply remote sensing NPP data to estimate carbon sequestration by forest vegetation, and the ecological effect of SFF investment is analyzed using the panel fixed effects model, which controls for variations arising from individual characteristics of SFFs. Third, we evaluate temporal and spatial differences in the carbon sequestration effect, identifying the periods and regions where SFF investments are more cost-effective. We also use panel threshold models to determine the optimal investment scale and structure, providing guidance for optimizing SFF investment decisions and resource allocation. Finally, we explore the mechanism through which investment impacts carbon sequestration and find that investment increases forest area and improves forest quality.
Our study finds that the immediate carbon sequestration effect of SFF investment is not statistically significant. Previous research has similarly shown that forest area changes respond most immediately to investment, while increases in forest stock and carbon sequestration are delayed and may even initially decline [17,18,19]. However, the ecological effect of such investment tends to materialize gradually over time. Our findings further indicate that the increase in carbon sequestration is most pronounced in the third year following the investment. This highlights a clear time-lag effect in SFF investment, consistent with the findings of Zhang et al. [18]. Therefore, SFF investment decisions should be made from a long-term perspective, avoiding an overemphasis on short-term returns.
This study finds that the optimal lag period and marginal contribution of SFF investment to carbon sequestration vary across different regions, indicating significant spatial heterogeneity in the carbon sequestration effect. This finding aligns with Hong et al. [25] and is further related to climatic conditions, ecological endowment, and economic development across regions [24]. Our analysis also reveals that carbon sequestration is more pronounced with increased investment in northern Shaanxi (the LP). Both the interaction term in the model and the sub-sample regressions according to the region support this conclusion. Northern Shaanxi is a Loess Plateau region with relatively poor ecological endowment and environmental quality, so the ecological effect is more obvious and economically feasible with increased investment, which is consistent with the findings of Ding et al. [20]. Therefore, from the perspectives of environmental and economic effectiveness, SFFs with poorer ecological endowments are better suited for increased investment.
This paper demonstrates that the threshold effects of SFF investment on carbon sequestration are significant. Specifically, the effectiveness of carbon sequestration is influenced by both the scale and structure of the investment. On the one hand, the returns to SFF investment follow the law of diminishing marginal returns, with the optimal investment scale found to be CNY 6.76162 million. When investment exceeds this threshold, marginal returns decrease by approximately 86%. On the other hand, when forestation investment surpasses CNY 4.49730 million, the marginal effect on carbon sequestration significantly declines. These results suggest that the marginal returns on investment vary across different forestry activities, which is consistent with the findings of Gao and Li [27]. Therefore, rather than pursuing forest area expansion, SFFs should prioritize long-term forest management to continuously improve forest quality and carbon sequestration capacity.
The ecological service functions of SFFs vary across different geographical locations, and thus, their management performance cannot be fully assessed solely through the lens of carbon sequestration. Further research can comprehensively evaluate the ecological effects of SFF investment from the ecosystem service perspective. Additionally, because of the imperfect data preservation of some SFFs and the high difficulty of field surveys, we are unable to conduct a mechanism test to disclose how investments impact carbon sequestration. Moving forward, we plan to strengthen collaborations with relevant organizations and conduct longitudinal research to collect more extensive and detailed data, enabling a more comprehensive assessment of SFFs’ ecological impact and a mechanism analysis of how investment affects carbon sequestration.

6. Conclusions

This study assesses the carbon sequestration effect of SFF investment in Shaanxi Province, and optimizes the SFF investment decision based on cost–benefit analysis. First, the immediate carbon sequestration effect of SFF investment is not significant. Second, the ecological benefits of investment emerge gradually over time, with the marginal contribution peaking after a three-period lag, indicating a clear time-lag effect. Third, after categorizing SFFs by geographic location, we observe that the optimal lag period and marginal contribution of investment differ across regions, revealing substantial spatial heterogeneity in the carbon sequestration effect. Fourth, the carbon sequestration effect of SFF investment is significantly influenced by both the investment scale and structure, with pronounced threshold effects. When investment is below CNY 6.76162 million, the marginal carbon sequestration is 0.2005 thousand tons; however, when investment exceeds this threshold, the marginal benefit falls to less than 15% of the initial level. Similarly, for forestation investment below CNY 4.49730 million, the marginal carbon sequestration is 0.1715 thousand tons, while investment above this level yields only about 15.45% of the previous return.
SFF investment significantly enhances vegetation carbon sequestration, but their effectiveness exhibits clear path dependence. Firstly, the output effect of forestry investment exhibits a time lag, so SFFs should prioritize long-term investment returns over short-term benefits to ensure sustainable forest development. Secondly, investment priority areas should be identified by balancing regional ecological functions and carbon sequestration costs. Thirdly, the investment scale should be aligned with the current total capital allocated to state-owned forests, developing a more cost-effective investment strategy. Finally, given the varying roles of different forestry activities, SFFs with substantial afforestation investment should adjust their investment structures and place greater emphasis on forest management.

Author Contributions

L.G.: Conceptualization, writing—original draft, and formal analysis. H.L.: writing—review and editing, supervision, and funding acquisition. S.L.: editing and supervision. All authors have read and agreed to the published version of the manuscript.

Funding

This work was supported by the National Natural Science Fund of China (No. 71273211), the Shaanxi Federation of Social Sciences Circles (No. 2021ZD1041), and the Natural Science Basic Research Program of Shaanxi (No. 2023-JC-YB-603).

Data Availability Statement

The data sources have been indicated in the text, and all data are available upon request from the authors.

Conflicts of Interest

The authors declare that they have no known competing financial interests or personal relationships that could have appeared to influence the work reported in this paper.

References

  1. Filonchyk, M.; Peterson, M.P.; Zhang, L.; Hurynovich, V.; He, Y. Greenhouse Gases Emissions and Global Climate Change: Examining the Influence of CO2, CH4, and N2O. Sci. Total Environ. 2024, 935, 173359. [Google Scholar] [CrossRef] [PubMed]
  2. Campbell-Lendrum, D.; Neville, T.; Schweizer, C.; Neira, M. Climate Change and Health: Three Grand Challenges. Nat. Med. 2023, 29, 1631–1638. [Google Scholar] [CrossRef] [PubMed]
  3. Girardin, C.A.J.; Jenkins, S.; Seddon, N.; Allen, M.; Lewis, S.L.; Wheeler, C.E.; Griscom, B.W.; Malhi, Y. Nature-Based Solutions Can Help Cool the Planet—If We Act Now. Nature 2021, 593, 191–194. [Google Scholar] [CrossRef]
  4. Pan, Y.; Birdsey, R.A.; Phillips, O.L.; Jackson, R.B. The Structure, Distribution, and Biomass of the World’s Forests. Annu. Rev. Ecol. Evol. Syst. 2013, 44, 593–622. [Google Scholar] [CrossRef]
  5. Pan, Y.; Birdsey, R.A.; Phillips, O.L.; Houghton, R.A.; Fang, J.; Kauppi, P.E.; Keith, H.; Kurz, W.A.; Ito, A.; Lewis, S.L.; et al. The Enduring World Forest Carbon Sink. Nature 2024, 631, 563–569. [Google Scholar] [CrossRef]
  6. Hurteau, M.D. Chapter 27—The Role of Forests in the Carbon Cycle and in Climate Change. In Climate Change, 3rd ed.; Letcher, T.M., Ed.; Elsevier: Amsterdam, The Netherlands, 2021; pp. 561–579. ISBN 978-0-12-821575-3. [Google Scholar]
  7. Kallio, A.M.I.; Solberg, B.; Käär, L.; Päivinen, R. Economic Impacts of Setting Reference Levels for the Forest Carbon Sinks in the EU on the European Forest Sector. For. Policy Econ. 2018, 92, 193–201. [Google Scholar] [CrossRef]
  8. Assmuth, A.; Autto, H.; Halonen, K.-M.; Haltia, E.; Huttunen, S.; Lintunen, J.; Lonkila, A.; Nieminen, T.M.; Ojanen, P.; Peltoniemi, M.; et al. Forest Carbon Payments: A Multidisciplinary Review of Policy Options for Promoting Carbon Storage in EU Member States. Land Use Pol. 2024, 147, 107341. [Google Scholar] [CrossRef]
  9. Weiss, G.; Lawrence, A.; Lidestav, G.; Feliciano, D.; Hujala, T.; Sarvašová, Z.; Dobšinská, Z.; Živojinović, I. Research Trends: Forest Ownership in Multiple Perspectives. For. Policy Econ. 2019, 99, 1–8. [Google Scholar] [CrossRef]
  10. Whiteman, A.; Wickramasinghe, A.; Piña, L. Global Trends in Forest Ownership, Public Income and Expenditure on Forestry and Forestry Employment. For. Ecol. Manag. 2015, 352, 99–108. [Google Scholar] [CrossRef]
  11. FAO. Global Forest Resources Assessment 2020: Main Report; FAO: Rome, Italy, 2020; ISBN 978-92-5-132974-0. [Google Scholar]
  12. National Forestry and Grassland Administration. 2021 China Forestry and Grassland Ecology Integrated Monitoring and Assessment Report; China Forestry Publishing House: Beijing, China, 2023; ISBN 978-7-5219-2082-6. (In Chinese) [Google Scholar]
  13. Zhou, Y.; Xue, C.; Liu, S.; Zhang, J. Carbon Sequestration Costs and Spatial Spillover Effects in China’s Collective Forests. Carbon Balance Manag. 2024, 19, 14. [Google Scholar] [CrossRef]
  14. Cheng, K.; Yang, H.; Tao, S.; Su, Y.; Guan, H.; Ren, Y.; Hu, T.; Li, W.; Xu, G.; Chen, M.; et al. Carbon Storage through China’s Planted Forest Expansion. Nat. Commun. 2024, 15, 4106. [Google Scholar] [CrossRef] [PubMed]
  15. Jin, L.; Yi, Y.; Xu, J. Forest Carbon Sequestration and China’s Potential: The Rise of a Nature-Based Solution for Climate Change Mitigation. China Econ. J. 2020, 13, 1–23. [Google Scholar] [CrossRef]
  16. del Campo, A.D.; Otsuki, K.; Serengil, Y.; Blanco, J.A.; Yousefpour, R.; Wei, X. A Global Synthesis on the Effects of Thinning on Hydrological Processes: Implications for Forest Management. For. Ecol. Manag. 2022, 519, 120324. [Google Scholar] [CrossRef]
  17. Qian, C.; Shao, L.; Hou, X.; Zhang, B.; Chen, W.; Xia, X. Detection and Attribution of Vegetation Greening Trend across Distinct Local Landscapes under China’s Grain to Green Program: A Case Study in Shaanxi Province. CATENA 2019, 183, 104182. [Google Scholar] [CrossRef]
  18. Zhang, H.; Liu, S.; Yu, J.; Li, J.; Shangguan, Z.; Deng, L. Thinning Increases Forest Ecosystem Carbon Stocks. For. Ecol. Manag. 2024, 555, 121702. [Google Scholar] [CrossRef]
  19. Powers, M.; Kolka, R.; Palik, B.; McDonald, R.; Jurgensen, M. Long-Term Management Impacts on Carbon Storage in Lake States Forests. For. Ecol. Manag. 2011, 262, 424–431. [Google Scholar] [CrossRef]
  20. Ding, Z.; He, Y.; Liu, S.; Zhang, X.; Hu, W.; Yao, S. Assessing the Ecological Effects of Fiscal Investments in Sloping Land Conversion Program for Revegetation: A Case Study of Shaanxi Province, China. Forests 2024, 15, 2. [Google Scholar] [CrossRef]
  21. Deng, L.; Zhao, Y. Investment Lag, Financially Constraints and Company Value—Evidence from China. Emerg. Mark. Financ. Trade 2022, 58, 3034–3047. [Google Scholar] [CrossRef]
  22. Ding, Z.; Yao, S. Ecological Effectiveness of Payment for Ecosystem Services to Identify Incentive Priority Areas: Sloping Land Conversion Program in China. Land Use Policy 2021, 104, 105350. [Google Scholar] [CrossRef]
  23. Gao, G.; Ding, G.; Wang, H.; Zang, Y.; Liang, W. China Needs Forest Management Rather Than Reforestation for Carbon Sequestration. Environ. Sci. Technol. 2011, 45, 10292–10293. [Google Scholar] [CrossRef]
  24. Chuai, X.; Xia, M.; Xiang, A.; Miao, L.; Zhao, R.; Zuo, T. Vegetation Coverage and Carbon Sequestration Changes in China’s Forest Projects Area. Glob. Ecol. Conserv. 2022, 38, e02257. [Google Scholar] [CrossRef]
  25. Hong, S.; Ding, J.; Kan, F.; Xu, H.; Chen, S.; Yao, Y.; Piao, S. Asymmetry of Carbon Sequestrations by Plant and Soil after Forestation Regulated by Soil Nitrogen. Nat. Commun. 2023, 14, 3196. [Google Scholar] [CrossRef] [PubMed]
  26. Murdoch, W.; Polasky, S.; Wilson, K.A.; Possingham, H.P.; Kareiva, P.; Shaw, R. Maximizing Return on Investment in Conservation. Biol. Conserv. 2007, 139, 375–388. [Google Scholar] [CrossRef]
  27. Gao, L.; Li, H. Improving Carbon Sequestration Capacity of Forest Vegetation in China: Afforestation or Forest Management? Forests 2023, 14, 1077. [Google Scholar] [CrossRef]
  28. Yao, Y.; Piao, S.; Wang, T. Future Biomass Carbon Sequestration Capacity of Chinese Forests. Sci. Bull. 2018, 63, 1108–1117. [Google Scholar] [CrossRef]
  29. Clay, L.; Motallebi, M.; Song, B. An Analysis of Common Forest Management Practices for Carbon Sequestration in South Carolina. Forests 2019, 10, 949. [Google Scholar] [CrossRef]
  30. Hou, J.; Yin, R.; Wu, W. Intensifying Forest Management in China: What Does It Mean, Why, and How? For. Policy Econ. 2019, 98, 82–89. [Google Scholar] [CrossRef]
  31. Yang, Y.; Yuan, X.; An, J.; Su, Q.; Chen, B. Drivers of Ecosystem Services and Their Trade-Offs and Synergies in Different Land Use Policy Zones of Shaanxi Province, China. J. Clean. Prod. 2024, 452, 142077. [Google Scholar] [CrossRef]
  32. National Forestry and Grassland Administration. China Forestry and Grassland Statistical Yearbook; China Forestry Publishing House: Beijing, China, 2023; ISBN 978-7-5219-2444-2. (In Chinese) [Google Scholar]
  33. Cheng, F.; Tian, J.; He, J.; He, H.; Bao, G.; Yang, Y.; Liu, G.; Zhang, Z. China’s Future Forest Carbon Sequestration Potential under Different Management Scenarios. Trees For. People 2024, 17, 100621. [Google Scholar] [CrossRef]
  34. Houssoukpèvi, I.A.; le Maire, G.; Aholoukpè, H.N.S.; Fassinou, D.J.M.; Amadji, G.L.; Chapuis-Lardy, L.; Chevallier, T. Effect of Land Use Change on Carbon Stocks in an Agricultural Region of Southern Benin. Land Degrad. Dev. 2023, 34, 1447–1463. [Google Scholar] [CrossRef]
  35. Gu, X.; Zhao, H.; Peng, C.; Guo, X.; Lin, Q.; Yang, Q.; Chen, L. The Mangrove Blue Carbon Sink Potential: Evidence from Three Net Primary Production Assessment Methods. For. Ecol. Manag. 2022, 504, 119848. [Google Scholar] [CrossRef]
  36. Cai, W.; He, N.; Li, M.; Xu, L.; Wang, L.; Zhu, J.; Zeng, N.; Yan, P.; Si, G.; Zhang, X.; et al. Carbon Sequestration of Chinese Forests from 2010 to 2060 Spatiotemporal Dynamics and Its Regulatory Strategies. Sci. Bull. 2022, 67, 836–843. [Google Scholar] [CrossRef] [PubMed]
  37. Hong, S.; Yin, G.; Piao, S.; Dybzinski, R.; Cong, N.; Li, X.; Wang, K.; Penuelas, J.; Zeng, H.; Chen, A. Divergent Responses of Soil Organic Carbon to Afforestation. Nat. Sustain. 2020, 3, 694–700. [Google Scholar] [CrossRef]
  38. Lee, M.T.; Raschke, R.L. Understanding Employee Motivation and Organizational Performance: Arguments for a Set-Theoretic Approach. J. Innov. Knowl. 2016, 1, 162–169. [Google Scholar] [CrossRef]
  39. Michaletz, S.T.; Cheng, D.; Kerkhoff, A.J.; Enquist, B.J. Convergence of Terrestrial Plant Production across Global Climate Gradients. Nature 2014, 512, 39–43. [Google Scholar] [CrossRef]
  40. Schindler, D.; Bauhus, J.; Mayer, H. Wind Effects on Trees. Eur. J. For. Res. 2012, 131, 159–163. [Google Scholar] [CrossRef]
  41. Campos, G.E.P.; Moran, M.S.; Huete, A.; Zhang, Y.; Bresloff, C.; Huxman, T.E.; Eamus, D.; Bosch, D.D.; Buda, A.R.; Gunter, S.A.; et al. Ecosystem Resilience despite Large-Scale Altered Hydroclimatic Conditions. Nature 2013, 494, 349–352. [Google Scholar] [CrossRef]
  42. Liu, S.; Xia, J. Forest Harvesting Restriction and Forest Restoration in China. For. Policy Econ. 2021, 129, 102516. [Google Scholar] [CrossRef]
  43. Chen, J.; Fan, W.; Li, D.; Liu, X.; Song, M. Driving Factors of Global Carbon Footprint Pressure: Based on Vegetation Carbon Sequestration. Appl. Energy 2020, 267, 114914. [Google Scholar] [CrossRef]
  44. Yu, C.; Xu, L.; He, N.; Li, M.; Kang, X. Optimization of Vegetation Carbon Content Parameters and Their Application in Carbon Storage Estimation in China. Sci. Total Environ. 2024, 955, 176912. [Google Scholar] [CrossRef]
  45. Seiler, W.; Crutzen, P.J. Estimates of Gross and Net Fluxes of Carbon between the Biosphere and the Atmosphere from Biomass Burning. Clim. Change 1980, 2, 207–247. [Google Scholar] [CrossRef]
  46. Hansen, B.E. Threshold Effects in Non-Dynamic Panels: Estimation, Testing, and Inference. J. Econom. 1999, 93, 345–368. [Google Scholar] [CrossRef]
  47. Baron, R.M.; Kenny, D.A. The Moderator-Mediator Variable Distinction in Social Psychological Research: Conceptual, Strategic, and Statistical Considerations. J. Pers. Soc. Psychol. 1986, 51, 1173–1182. [Google Scholar] [CrossRef] [PubMed]
Figure 1. Study area.
Forests 16 00060 g001
Figure 2. The annual values of carbon sequestration and SFF investment.
Forests 16 00060 g002
Figure 3. Average carbon sequestration of SFFs within the county.
Forests 16 00060 g003
Figure 4. Confidence interval construction of the single threshold model.
Forests 16 00060 g004
Table 1. Variable design and descriptive statistics.
NameVariable DescriptionUnitMeanStd
c s vegetation carbon sequestration of forests managed by state-owned forest farms (SFFs)103 ton275.2000259.6000
i n v e s t SFF investment in forestry activities104 CNY65.3100122.1000
e m p l o y e e the number of employeesperson64.930055.8400
a r e a the operating area of SFF104 hectare4.1740128.3000
p e r s a l a r y employee salary104 CNY4.52202.4540
p e r s c a l e management scale per employee104 hectare/person0.02940.0263
t e m p average annual temperature°C10.99001.6640
w i n d wind speedm/s2.18600.6040
p r e average annual precipitationmm567.8000144.9000
f o r e s t _ s t o c k forest stock104 m370.370080.4700
f o r i n v SFF forestation investment104 CNY40.284174.8255
f o r a r e a newly added forestation area each yearhectare27.964349.5186
m a n a r e a newly added forest management area each yearhectare233.2923402.9774
Table 2. Immediate and time-lag effects of SFF investment on carbon sequestration.
Dependent VariableModel (1)Model (2)Model (3)
Coef.Std. Err.Coef.Std. Err.Coef.Std. Err.
i n v e s t 0.0134(0.0097)
L 3 . i n v e s t 0.0204 **(0.0080)0.0205 **(0.0080)
e m p l o y e e 0.2938 ***(0.1097)0.1803 **(0.0887)0.1776 **(0.0875)
a r e a 0.0014 ***(0.0001)0.0003 **(0.0002)0.0004 ***(0.0002)
p e r s c a l e 286.5185(243.4076)211.0327(204.9238)209.2659(203.6356)
p e r s a l a r y 3.8632 ***(0.4153)0.5741 *(0.3088)0.5588 *(0.3086)
L . f o r e s t _ s t o c k 0.0776 ***(0.0288)0.0401 *(0.0236)0.0386(0.0240)
t e m p 4.5247 ***(1.2382)8.4828 ***(1.3288)8.5642 ***(1.3389)
w i n d 105.3658 ***(13.4941)169.1637 ***(16.9281)164.4290 ***(16.2244)
p r e −0.0463 ***(0.0051)−0.0494 ***(0.0050)−0.1090 ***(0.0255)
p r e 2 0.47 × 10⁻⁴ **(0.19 × 10⁻⁴)
C o n s t a n t −28.4931(33.1313)−176.2015 ***(38.6152)−148.7546 ***(35.6728)
Note: (1) *** p < 0.01, ** p < 0.05, * p < 0.1; (2) the standard errors in the table are robust standard errors; (3) L 3 . i n v e s t is SFF investment with three-period lags.
Table 3. Robustness test.
Dependent VariableModel (1)Model (2)Model (3)
Coef.Std. Err.Coef.Std. Err.Coef.Std. Err.
L 3 . l n _ i n v e s t 0.0007 **(0.0003)
L 3 . i n v e s t _ p r e 0.0237 **(0.0094)
L 3 . i n v e s t _ t r 0.0194 *(0.0109)
l n _ e m p l o y e e 0.0159(0.0409)
l n _ a r e a 0.0033 ***(0.0012)
l n _ p e r s c a l e 0.0100(0.0229)
l n _ p e r s a l a r y 0.0275 ***(0.0045)
e m p l o y e e 0.1760 **(0.0890)0.1756 *(0.0955)
a r e a 0.0003 *(0.0002)0.0004 **(0.0002)
p e r s c a l e 218.9743(205.5504)208.0520(207.7339)
p e r s a l a r y _ p r e 0.6260(0.4035)
p e r s a l a r y 0.6993 **(0.2937)
L . f o r e s t _ s t o c k −0.0000(0.0001)0.0413 *(0.0240)0.0427 *(0.0257)
t e m p 0.0261 ***(0.0037)8.6899 ***(1.3357)8.3780 ***(1.0936)
w i n d 0.4397 ***(0.0239)169.6308 ***(16.9656)164.1186 ***(16.5692)
p r e −0.0002 ***(0.0000)−0.0492 ***(0.0050)−0.0480 ***(0.0045)
C o n s t a n t 3.8445 ***(0.1159)−179.4045 ***(38.7256)−173.4944 ***(37.1942)
Note: (1) *** p < 0.01, ** p < 0.05, * p < 0.1; (2) the standard errors in the table are robust standard errors; (3) L 3 . l n _ i n v e s t , three-period lag of the logarithm of investment; L 3 . i n v e s t _ p r e , three-period lag in the present value of investment; L 3 . i n v e s t _ t r , three-period lag of investment after the sample has been trimmed down.
Table 4. Spatial heterogeneity in the carbon sequestration effect of investment.
Dependent VariableModel (1) TotalModel (2) LPModel (3) GPModel (4) QMModel (5) QM
Coef.
(Std. Err.)
Coef.
(Std. Err.)
Coef.
(Std. Err.)
Coef.
(Std. Err.)
Coef.
(Std. Err.)
L P # L 3 . i n v e s t 0.0633 **
(0.0244)
G P # L 3 . i n v e s t 0.0154
(0.0094)
Q M # L 3 . i n v e s t −0.0063
(0.0091)
L . i n v e s t 0.0551 **
(0.0243)
L 3 . i n v e s t 0.0182 *
(0.0093)
L 6 . i n v e s t 0.1887 ***
(0.0695)
L 4 . i n v e s t 0.0403 *
(0.0236)
e m p l o y e e 0.1663 *0.2975−0.00250.17910.0887
(0.0883)(0.1928)(0.1471)(0.1355)(0.0737)
a r e a 0.0004 ***0.0018 ***−4.131617.5880 ***5.0524 *
(0.0002)(0.0003)(5.7741)(4.3109)(2.8848)
p e r s c a l e 197.4308519.4576 *0.9823−140.7945−135.0922 **
(202.9090)(276.6049)(328.7091)(86.4219)(51.6657)
p e r s a l a r y 0.6300 **8.6092 ***−0.6903−2.9989 ***5.4195 *
(0.3070)(0.8796)(0.4815)(0.7954)(2.7664)
p e r s a l a r y 2 −0.6878 **
(0.2874)
L . f o r e s t _ s t o c k 0.03740.85670.0476−0.2814 *−0.0492
(0.0239)(0.6139)(0.0334)(0.1664)(0.0468)
t e m p 8.3233 ***−1.89779.4331 ***−2.47610.7075
(1.3080)(2.9184)(2.7819)(1.7293)(1.5747)
w i n d 169.0218 ***115.0373 ***188.3097 ***−42.963610.0726
(16.7848)(16.5836)(35.8951)(26.5840)(22.5065)
p r e −0.0485 ***−0.1213 ***−0.0346 ***0.00540.0271 ***
(0.0049)(0.0110)(0.0090)(0.0067)(0.0081)
C o n s t a n t −173.6377 ***−40.1273−206.6136 **316.8026 ***155.6403 ***
(38.1359)(58.9262)(81.1402)(48.0002)(31.3895)
Sample size21275746363
Note: (1) *** p < 0.01, ** p < 0.05, * p < 0.1; (2) the standard errors in the table are robust standard errors; (3) L P # L 3 . i n v e s t , interaction terms for the LP with L 3 . i n v e s t , G P # L 3 . i n v e s t , and Q M # L 3 . i n v e s t are similar to that; p e r s a l a r y 2 is a square term for employee salary.
Table 5. Threshold effects test results.
Threshold VariablesThreshold TypeF-Valuep-ValueBootstrap TimesThreshold Value95% of Confidence Interval
L 3 . i n v e s t Single threshold ***18.840.006730067.6162[63.0935, 70.0000]
Double threshold5.760.5500300
Ito1 (g1) 67.6162[64.1132, 70.0000]
Ito2 (g2) 4.2402[4.1115, 4.5074]
L 3 . f o r i n v Single threshold **17.400.020030044.9730[39.6172, 48.4746]
Double threshold6.170.4533300
Ito1 (g1) 44.9730[39.6172, 48.4746]
Ito2 (g2) 1.1368[1.0089, 1.2658]
Note: *** and ** indicate significance at the levels of 1% and 5%, respectively.
Table 6. Threshold effects of SFF investment on carbon sequestration.
Dependent VariableModel (1)Model (2)
Coef.Std. Err.Coef.Std. Err.
L 3 . i n v e s t L 3 . i n v e s t 67.6162 0.2005 ***(0.0498)
L 3 . i n v e s t L 3 . i n v e s t > 67.6162 0.0287 ***(0.0085)
L 3 . i n v e s t L 3 . f o r i n v 44.9730 0.1715 ***(0.0429)
L 3 . i n v e s t L 3 . f o r i n v > 44.9730 0.0265 ***(0.0084)
e m p l o y e e 0.1947 **(0.0830)0.1956 **(0.0838)
a r e a 0.0007 ***(0.0002)0.0006 ***(0.0002)
p e r s c a l e 219.7877(181.7626)216.7021(184.7303)
p e r s a l a r y 0.4775(0.3038)0.4821(0.3035)
L . f o r e s t _ s t o c k 0.0388(0.0245)0.0360(0.0243)
t e m p 8.6122 ***(1.3246)8.5985 ***(1.3380)
w i n d 171.5553 ***(17.0094)171.7060 ***(17.0138)
p r e −0.0487 ***(0.0051)−0.0490 ***(0.0050)
C o n s t a n t −186.8902 ***(38.6199)−186.2519 ***(38.7229)
Note: (1) *** p < 0.01, ** p < 0.05; (2) the standard errors in the table are robust standard errors.
Table 7. The Impact Channels of SFF investment on carbon sequestration.
Dependent VariableModel (1) forareaModel (2) csModel (3) manareaModel (4) cs
Coef.Std. Err.Coef.Std. Err.Coef.Std. Err.Coef.Std. Err.
i n v e s t 0.3979 ***(0.0078) 3.2913 ***(0.1739)
L 3 . i n v e s t 0.0214 *(0.0126) 0.0215 *(0.0128)
f o r a r e a 0.0473 *(0.0284)
m a n a r e a 0.0068 **(0.0031)
e m p l o y e e 0.0320(0.0281)0.4319 **(0.1753)0.6539(0.4294)0.4350 **(0.1754)
a r e a −0.0002 ***(0.0001)0.0005 **(0.0002)0.0103 ***(0.0009)0.0004(0.0002)
p e r s c a l e −35.0928(24.4492)480.1693 **(206.4552)−397.2365(364.2288)492.0913 **(203.6209)
p e r s a l a r y −0.4575 ***(0.1251)1.1347 **(0.4427)−8.6398 ***(1.6434)1.1272 **(0.4404)
L . f o r e s t _ s t o c k −0.0081(0.0061)0.0516 **(0.0234)0.0263(0.0789)0.0517 **(0.0232)
t e m p −0.4876(0.6892)9.7702 ***(1.9688)−3.4194(5.9429)9.7898 ***(1.9589)
w i n d −2.9316(2.1796)163.9812 ***(20.0134)−34.0568(28.3978)163.8713 ***(20.0780)
p r e −0.0059 ***(0.0022)−0.0512 ***(0.0073)0.0017(0.0249)−0.0514 ***(0.0073)
C o n s t a n t 19.8754 **(8.0704)−215.4015 ***(51.1824)150.7665 *(89.3798)−216.0878 ***(51.2887)
Note: (1) *** p < 0.01, ** p < 0.05, * p < 0.1; (2) the standard errors in the table are robust standard errors.
Disclaimer/Publisher’s Note: The statements, opinions and data contained in all publications are solely those of the individual author(s) and contributor(s) and not of MDPI and/or the editor(s). MDPI and/or the editor(s) disclaim responsibility for any injury to people or property resulting from any ideas, methods, instructions or products referred to in the content.

