Article

Research on the Spatiotemporal Evolution and Driving Factors of Forest Carbon Sink Increment—Based on Data Envelopment Analysis and Production Theoretical Decomposition Model

1
College of Economics and Management, Fujian Agriculture and Forestry University, Fuzhou 350002, China
2
College of Rural Revitalization Academy, Fujian Agriculture and Forestry University, Fuzhou 350002, China
3
College of Digital Economy, Fujian Agriculture and Forestry University, Quanzhou 362000, China
*
Author to whom correspondence should be addressed.
Forests 2025, 16(1), 104; https://doi.org/10.3390/f16010104
Submission received: 17 December 2024 / Revised: 30 December 2024 / Accepted: 6 January 2025 / Published: 9 January 2025
(This article belongs to the Section Forest Economics, Policy, and Social Science)

Abstract

:
Forest carbon sinks play a crucial role in mitigating global climate change and enhancing ecological sustainability. This study utilizes the production theoretical decomposition analysis (PDA) model to develop a decomposition framework for analyzing the drivers of input–output dynamics within the forest carbon sink system. The study specifically focuses on plant diseases and insect pests as undesirable output indicators. We thoroughly analyzed the development and increment in forest carbon sinks across Chinese provinces and regions from 2010 to 2021, along with the key drivers influencing these changes. Policy recommendations are provided to enhance the scientific management of forest carbon sinks and promote sustainable development. The study results indicate the following: (1) Forest carbon sinks in China and its three major regions have increased annually, with dynamic fluctuations in the carbon sink increments. The overall center of gravity has shifted from southwest to northeast. (2) The rate of change in forest carbon sinks varies across provinces and regions, with 93.548% of provinces and all three major regions showing positive growth. The rate of change in forest carbon sinks in the eastern region is significantly higher than in the western and central regions; (3) Technological changes in carbon sinks positively impacted forest carbon sink enhancement across all provinces and regions of China. However, changes in the technical efficiency of carbon sinks had a significant negative effect, and the intensity of plant diseases and insect pests may become a key driver inhibiting future forest carbon sink enhancement.

1. Introduction

Rapid global economic development has led to ecological and environmental challenges that are now shared worldwide [1,2]. Natural disasters, including sea-level rise and increasingly frequent extreme weather events, have severely disrupted the harmonious relationship between nature and human society [3,4]. The Paris Agreement aims to limit the global temperature increase to well below 2 °C above pre-industrial levels, with efforts to limit it to 1.5 °C. However, data from 2023 indicate that the global average temperature is already 1.48 °C above pre-industrial levels, approaching the safety threshold set by the agreement. The Global Tipping Point Report, also released in 2023, confirmed that some climate disasters may be accelerating [5]. Addressing global climate change and improving the ecological environment has become an urgent challenge for humanity [6,7].
Forests, as a key component of terrestrial ecosystems, account for over 80% of their total carbon sequestration capacity [8]. Forest carbon sinks play a critical role in combatting global climate change, achieving carbon neutrality, and offsetting emissions from fossil fuels [9]. Specifically, forest carbon sinks not only absorb and store large amounts of carbon dioxide, but also perform vital ecological functions, including carbon sequestration, oxygen release, and water conservation. These functions significantly contribute to the sustainable development of both ecology and economy [10]. Compared to industrial emission reductions, forest carbon sinks are a more cost-effective and viable nature-based solution for mitigating climate change [11]. According to the Third Biennial Update Report on Climate Change (2018) by China’s Ministry of Ecology and Environment, China’s forest carbon sinks sequestered 966 million tons of CO2, contributing approximately 85.5% of the national terrestrial carbon sink total [12]. This highlights the dominant role of forest carbon sinks in mitigating climate change. According to China’s Ninth Forest Inventory (2014–2018), the country, as the world’s fifth-largest holder of forest resources, has approximately 3.3 billion square meters of forests and a forest stock of 17.56 billion cubic meters, marking a net increase of 2.423 billion cubic meters compared to the eighth inventory (2009–2013) [13]. According to the Chinese Academy of Forestry, China’s terrestrial ecosystems have a carbon stock of 79.2 billion tons, with forests contributing 30.8 billion tons (39%). It is projected that forest biomass will sequester between 1.9 and 3.4 billion tons of carbon over the next 10 to 20 years. However, this vast carbon sink potential remains underutilized due to drivers such as the challenges in carbon sink technology development, low forest resource quality, pest and disease threats, and uneven regional natural conditions, which have hindered the high-quality development of China’s forest carbon sinks.
Building on the above, this paper uses the production theoretical decomposition analysis (PDA) model to examine the development of forest carbon sequestration and its incremental changes in China’s provinces and regions from 2010 to 2021. Additionally, this paper describes the decomposition framework of input and output driving drivers from the internal structure of the forest carbon sequestration system and analyzes the drivers influencing the rate of change in forest carbon sequestration. The key contributions of this paper are as follows: (1) The study of the temporal and spatial evolution and driving drivers of forest carbon sink increment provides valuable insights into tapping the potential of China’s forest carbon sink. (2) This paper examines the unexpected output indicators, such as plant diseases and insect pests, and explores practical measures to enhance the forest carbon sink. (3) The production theoretical decomposition analysis (PDA) method is applied to the field of forest carbon sequestration, decomposing input and output drivers within the system and incorporating all elements into the decomposition framework. Compared to previous studies, this paper offers a deeper analysis of the driving drivers and efficiency of forest carbon sequestration.
The rest of the paper is structured as follows. Section 2 describes the existing studies on topics related to this study. Section 3 describes the methodology used in this study. Section 4 analyzes the main results. Section 5 and Section 6 discuss the paper, summarize and make relevant policy recommendations.

2. Literature Review

Since the mid-1960s, as global climate change has gained prominence, the study of forest carbon sinks has become a key topic in ecology and environmental science. Many scholars have investigated the various factors influencing forest carbon sinks. Scholars have examined the effects of natural factors, such as climate change, site conditions, forest pests and diseases, fires, and afforestation areas, on forest carbon sinks, as well as the relationship between carbon sinks and economic and social factors [14,15,16,17,18,19,20,21,22,23,24,25]. Additionally, based on input–output theory, scholars have primarily used the data envelopment analysis (DEA) method to assess the input–output efficiency of forest carbon sinks, incorporating economic, social, and ecological benefits [26,27]. These methods range from basic static evaluations, such as CCR with constant returns to scale and BCC with variable returns to scale [28], to non-radial SBM models considering non-desired outputs [29], super-efficient SBM [30], and dynamic analysis of time-varying trends using the M index [31]. A comprehensive static-dynamic analysis provides a scientific basis for proposing targeted policy recommendations for forest carbon sink development and research ideas for the development of forest carbon sinks. These studies offer valuable insights for the development of forest carbon sinks. However, none of these methods have addressed the internal structure of resource factor allocation. Furthermore, few studies on input–output indicators have focused on plant diseases and insect pests, which significantly impact forest carbon sinks. Forest pests and diseases reduce carbon sink capacity by damaging tree species structures and degrading forest quality. Rising global temperatures will increase the frequency of pests and diseases. The controllability of forest pests and diseases, compared to natural factors, makes the study’s findings more relevant.
Decomposition analysis methods are primarily used in the fields of energy and environmental studies. A majority of the literature applies this method to decompose carbon emissions [32,33]. This method decomposes carbon emission indicators into technological changes [34], input factor growth [35], scale efficiency [36], and other components to analyze the driving influence of each factor on the aggregated indicators. Specifically, it includes index decomposition analysis (IDA) based on statistical index theory, structural decomposition analysis (SDA) based on the input–output framework, and production theory decomposition analysis (PDA) based on the production theory framework. Of these, SDA and IDA provide only a framework for analyzing the decomposition effects of factors such as carbon emission intensity and energy consumption structure, without addressing efficiency changes [37]. In contrast, the production theoretical decomposition analysis (PDA) model uses data envelopment analysis (DEA) as an analytical tool to determine whether the decision-making unit is within the production boundary, incorporating technical efficiency into the analysis framework [38]. It measures the distance between the decision-making unit and the optimal production boundary using the shepherd distance function, revealing the impact of changes in technical efficiency on carbon emissions and carbon emission intensity [39]. To date, only a few scholars have applied production theoretical decomposition analysis (PDA) to study the decomposition of drivers of carbon emission intensity [40,41,42,43,44], while no research has been conducted on the decomposition of drivers of incremental forest carbon sinks. The conclusions of these studies are summarized in Table 1.
In summary, while existing literature provides a solid foundation for this study, some gaps remain: (1) Although research on forest carbon sinks is abundant, there is limited exploration of forest carbon sink increments in the spatial-temporal dimension. Forest carbon sink increment, a key indicator of forest carbon sink potential, requires further investigation. (2) While existing studies have explored various drivers influencing forest carbon sinks, few have analyzed the role of technical efficiency in forest carbon sink increments from the input–output perspective. (3) Recent research on forest carbon sink efficiency is relatively extensive, yet input–output indicators often overlook pest-related drivers, which is a notable gap.

3. Research Methodology

3.1. Production Technology

In the actual production process of forest carbon sinks, land ( N ), labor ( L ), and capital ( K ) are usually used as inputs. Each decision-making unit utilizes these inputs to produce a desired output, expressed as a forest carbon sink ( C ). In addition to the generation of desired outputs, the production process is often accompanied by the generation of undesirable output. Considering the plant diseases and insect pests infestations that have a large impact on our forest carbon sinks, the area affected by plant diseases and insect pests’ infestations ( P ) is used to denote the undesirable output. For each decision unit i , its production technology can be expressed as follows [45]:
T i = { ( N i , L i , K i , C i , P i ) : ( N i , L i , K i ) can   produce ( C i , P i ) }
Based on the above production techniques, the inter-period Shephard input and output distance functions are introduced separately and defined as follows:
D n s N i t , L i t , K i t , C i t , P i t = sup β i : N i t / β i , L i t , K i t , C i t , P i t T i s D c s N i t , L i t , K i t , C i t , P i t = inf θ i : N i t , L i t , K i t , C i t / θ i , P i t T i s D p s N i t , L i t , K i t , C i t , P i t = inf θ i : N i t , L i t , K i t , C i t , P i t / θ i T i s
In order to better fit the production process, Färe et al. (1989) introduced weak disposability and “zero-binding” between undesired and desired outputs as assumptions into the production process. This can be expressed as follows [46]:
(1)
If N i , L i , K i , C i , P i T i and 0 θ 1 , then ( N i , L i , K i , θ C i , θ P i ) T i ;
(2)
If N i , L i , K i , C i , P i T i and P = 0 , then C = 0 .
Based on the two assumptions given above, the production technology of decision unit i can be defined as follows:
T i = N i , L i , K i , C i , P i : j λ j N i j N i j λ j L i j L i j λ j K i j K i j λ j C i j C i j λ j P i j = P i λ j 0 , j = 1 , , n }

3.2. Decomposition Algorithm

According to the analytical framework constructed by Kaya (1989) based on the relationship between economy, population, energy, and carbon emissions, this paper applies its equation to the field of forest carbon sinks and constructs the decomposition formula for the rate of change of forest carbon sinks [47]:
Δ C j = C j s C j t = C j s / N j s C j t / N j t N j s / P j s N j t / P j t P j s P j t
Equation (4) shows the rate of change of forest carbon sink from period t to period s in the decision unit, where C denotes forest carbon sink, N denotes the forest area, and P is the area of plant diseases and insect pests infestation.
Taking the production technology in period t as a benchmark, combining the above equation with the distance function, the decomposition of forest carbon sink change can be rewritten as follows:
Δ C j = C j s / D c t N j s , L j s , K j s , C j s , P j s 1 / N j s C j t / D c t N j t , L j t , K j t , C j t , P j t 1 / N j t × N j s / D N t N j s , L j s , K j s , C j s , P j s 1 / P j s N j t / D N t N j t , L j t , K j t , C j t , P j t 1 / P j t × P j s P j t × D c t N j s , L j s , K j s , C j s , P j s D c t N j t , L j t , K j t , C j t , P j t × D N t N j s , L j s , K j s , C j s , P j s D N t N j t , L j t , K j t , C j t , P j t = P C S D C H j t × P I F L I C H j t × A F P D C H j t × F C S P C H j t × F L U P C H j t
where L denotes the number of employees in the forestry system at the end of the year, and K denotes the completion of fixed asset investment in the forestry system. The change of forest carbon sink is decomposed into five parts: the first part is P C S D C H , i.e., the potential carbon sink density change. It indicates the maximum possible carbon sink change per unit forest land input area under a certain forest carbon sink capacity level, based on forest land area input, labor input, capital input, and forest plant diseases and insect pests infestation occurrence area in period t and period s , respectively; and the second part is defined as P I F L I C H , i.e., potential plant diseases and insect pests infestation occurrence intensity change. It indicates the minimum possible change in forest land inputs required for a unit area of forest plant diseases and insect pests infestation under a certain level of forest land area inputs, based on the levels of labor inputs, capital inputs, and outputs in periods t and s , respectively; the third term is defined as A F P D C H , i.e., the rate of change in the area of forest plant diseases and insect pests infestation occurrence; the fourth term is defined as F C S P C H , i.e., the rate of change in the efficiency of the forest carbon sinks; and the fifth term is defined as F L U P C H , i.e., the change in the efficiency of the inputs to the area of forest land.
In order to avoid decomposition errors caused by choosing production technologies from different periods as benchmarks, the geometric mean of the two is taken as shown below:
Δ C j = C j s / D c t N j s , L j s , K j s , C j s , P j s × D c s N j s , L j s , K j s , C j s , P j s 1 / 2 × 1 / N j s C j t / D c t N j t , L j t , K j t , C j t , P j t × D c s N j t , L j t , K j t , C j t , P j t 1 / 2 × 1 / N j t × N j s / D N t N j s , L j s , K j s , C j s , P j s × D N s N j s , L j s , K j s , C j s , P j s 1 / 2 × 1 / P j s N j t / D N t N j t , L j t , K j t , C j t , P j t × D N s N j t , L j t , K j t , C j t , P j t 1 / 2 × 1 / P j t × P j s P j t × D c t N j s , L j s , K j s , C j s , P j s D c t N j t , L j t , K j t , C j t , P j t × D c s N j s , L j s , K j s , C j s , P j s D c s N j t , L j t , K j t , C j t , P j t 1 / 2 × D N t N j s , L j s , K j s , C j s , P j s D N t N j t , L j t , K j t , C j t , P j t × D N s N j s , L j s , K j s , C j s , P j s D N s N j t , L j t , K j t , C j t , P j t 1 / 2 = P C S D C H j × P I F L I C H j × A F P D C H j × F C S P C H j × F L U P C H j
Notice that the last two terms of the above equation are essentially Malmquist productivity indices that can be further decomposed as follows:
F C S P C H j = D c s N j s , L j s , K j s , C j s , P j s D c t N j t , L j t , K j t , C j t , P j t × D c t N j s , L j s , K j s , C j s , P j s D c s N j s , L j s , K j s , C j s , P j s × D c t N j t , L j t , K j t , C j t , P j t D c s N j t , L j t , K j t , C j t , P j t 1 / 2 = C S E F C H j × C C T E C H j
F L U P C H j = D N s N j s , L j s , K j s , C j s , P j s D N t N j t , L j t , K j t , C j t , P j t × D N t N j s , L j s , K j s , C j s , P j s D N s N j s , L j s , K j s , C j s , P j s × D N t N j t , L j t , K j t , C j t , P j t D N s N j t , L j t , K j t , C j t , P j t 1 / 2 = F L U E F C H j × F L D T E C H j
The first term on the right-hand side of Equation (8), C S E F C H , portrays the technical efficiency change of carbon sinks, and the second term, C C T E C H , reflects the technical change of carbon sinks. The first term on the right side of Equation (9), F L U E F C H , reflects the technical efficiency change of forest land utilization, and the second term, F L D T E C H , describes the technical changes in forest land development. At this point, carbon emission changes are decomposed into the seven following drivers:
Δ C j = C j s C j t = P C S D C H j × P I F L I C H j × A F P D C H j × C S E F C H j × C C T E C H j × F L U E F C H j × F L D T E C H j
The Shephard distance function introduced in the above decomposition can be specifically estimated by the following equation:
D C s N i t , L i t , K i t , C i t , P i t 1 = max θ s . t . i = 1 n z i N i s N i t i = 1 n z i L i s L i t i = 1 n z i K i s K i t i = 1 n z i C i s θ C i t i = 1 n z i P i s = P i t z i 0 , i = 1 , , n
D P s N i t , L i t , K i t , C i t , P i t 1 = min β s . t . i = 1 n z i N i s N i t i = 1 n z i L i s L i t i = 1 n z i K i s K i t i = 1 n z i C i s C i t i = 1 n z i P i s = θ P i t z i 0 , i = 1 , , n

3.3. Data Sources

Because some data after 2022 are currently unavailable, and because the driving influence of forest carbon sinks is a long-cycle process, the available data from 31 provinces, municipalities, and districts in China from 2010 to 2021 were selected as the study sample, and due to the large amount of missing data from Taiwan, Hong Kong, and Macao, the above study areas were not involved. According to the “Seventh Five-Year Plan”, China is divided into three economic zones: West, Central, and East. The western region includes 11 provinces: Guangxi, Yunnan, Tibet, Guizhou, Sichuan, Chongqing, Shaanxi, Gansu, Qinghai, Ningxia, and Xinjiang. The central region includes Inner Mongolia, Shanxi, Heilongjiang, Jilin, Anhui, Jiangxi, Henan, Hubei, and Hunan. The eastern region includes 11 provinces: Tianjin, Beijing, Hebei, Liaoning, Shanghai, Jiangsu, Zhejiang, Fujian, Shandong, Guangdong, and Hainan. Input driver data, including forest land area, the number of forestry employees at year-end, and forestry fixed asset investment, are sourced from the Statistical Yearbook of China’s Forestry and Grassland. Data on the area affected by plant diseases and insect pests are obtained from the Statistical Yearbook of China and the Statistical Yearbook of China’s Forestry and Grassland, respectively. Forest carbon sequestration data are derived through the ArcMap transformation of remote sensing data, as no directly available data exist [48].

4. Results

4.1. Analysis of Forest Carbon Sink Measurement in China

Forest carbon sinks serve as key indicators of regional ecosystem protection capacity and resilience against global warming. To evaluate the development of forest carbon sinks across China’s three major regions, their trends from 2010 to 2021 were visualized and analyzed. The details are presented in Figure 1.
The figure on the left shows that forest carbon sinks in China’s three major regions have steadily increased from 2010 to 2021, with an overall growth of 11.2%. In regional comparisons, the western region consistently outperforms the eastern and central regions in forest carbon sinks. This highlights that the western region, represented by Yunnan, Guangxi, and Sichuan, serves as China’s ecological security barrier and is the primary contributor to the country’s forest carbon sinks. The figure on the right shows that the western region accounts for the largest share of China’s total forest carbon sink, at 47.28%. The central region follows with a 38.65% share, while the eastern region accounts for the smallest proportion, 14.07%. These trends reflect the eastern region’s relatively low natural forest cover, driven by rapid industrialization, urbanization, a developed economy, and a dense population. While the climate is conducive to forest growth, the region faces higher land-use pressure. As a result, its total forest carbon sinks are smaller than those in the central and western regions. The dynamic evolution shows an increasing trend in the western region’s share, rising from 44.99% in 2010 to 49.75% in 2021. Meanwhile, the central and eastern regions show a declining trend. The central region decreased from 40.55% in 2010 to 36.58% in 2021, while the eastern region declined from 14.46% to 13.68% over the same period. The central region’s decline rate is higher than the eastern region’s decline rate, possibly due to its role as an important agricultural base, leading to a reduction in forest area from land-use changes. Additionally, accelerated urbanization in the central region has pressured urban construction, shrinking forested areas and limiting forest carbon sink development.

4.2. Measurement and Analysis of Incremental Forest Carbon Sinks in China

To examine the dynamic evolution of China’s forest carbon sinks, incremental forest carbon sinks are used as an indicator to evaluate their development across China and its three major regions from 2010 to 2021. Details are presented in Figure 2.
Figure 2 shows that the evolution of incremental forest carbon sinks in China and its three regions exhibits dynamic fluctuations. The incremental forest carbon sinks fluctuated significantly year-to-year, peaking at 10,379,992 tc/ha in 2014–2015 and reaching a low of −5,087,069 tc/ha in 2018–2019, a difference of 15,467,061 tc/ha. This highlights the instability in the development of China’s overall forest carbon sinks, potentially influenced by various limiting drivers.
Among the three regions, the central region shows the largest variation, with incremental forest carbon sinks ranging from a minimum of −5,890,678 tc/ha in 2018–2019 to a maximum of 6,298,618 tc/ha in 2019–2020. The western region follows, with a minimum of −3,030,485 tc/ha in 2016–2017 and a maximum of 5,290,028 tc/ha in 2014–2015. The eastern region shows the most stable trend, with a low of −1,134,110 tc/ha in 2012–2013 and a high of 1,516,965 tc/ha in 2011–2012. These findings suggest that forest carbon sink development in the western and central regions is highly variable and strongly impacted by driving drivers.

4.3. Trajectory of Incremental Center of Gravity of Forest Carbon Sinks in China

Based on the analysis of the dynamic evolution of incremental forest carbon sinks in China and its three regions from 2010 to 2021, the shift in the center of gravity, and the evolution trajectory are visualized using ArcGIS 10.8 to explore their spatial evolution characteristics. The details are presented in Figure 3.
Figure 3 shows that the center of gravity of China’s incremental forest carbon sinks during the study period ranges from 101.42° E to 115.88° E and 29.09° N to 40.49° N, with an overall southwest–northeast trend. The center of gravity shifts from 101.42° E, 29.38° N during the period 2010–2011 to 115.88° E, 38.17° N during the period 2020–2021, moving northeast by 1100 km. The significant shift in the center of gravity suggests that, despite its rich forest resources, the western region of China does not significantly contribute to incremental forest carbon sinks. This may be due to the underdevelopment of the western region’s economy, land use practices, and other drivers over time. In contrast, the eastern and central regions have gradually come to dominate China’s incremental forest carbon sinks, driven by strong government policies and a growing focus on ecological protection. The trajectory of the center of gravity shift shows that, from 2011 to 2015, it was primarily concentrated at 111.24° E, with significant changes occurring mainly at the latitudinal level. The overall shift in the center of gravity occurred from Sichuan Province to Hebei Province.

4.4. Analysis of Drivers of Forest Carbon Sinks in China

4.4.1. Analysis of the Results of the Decomposition of the Rate of Change of the Forest Carbon Sink and the Index of Change of Its Drivers

This study examines the drivers affecting forest carbon sinks, based on regional differences in carbon sink levels and increments. The rate of change in China’s forest carbon sinks from 2010 to 2021 is decomposed into seven key drivers. A change index greater than 1 indicates a favorable effect on forest carbon sink enhancement, while an index less than 1 indicates an inhibitory effect. For example, consider the non-desired index, which measures the intensity of potential plant diseases and insect pests. If this index is greater than 1, it indicates that the region has better control over plant diseases and insect pests’ intensity compared to other regions. An index less than 1 indicates poorer control. The dotted line graph in Figure 4 illustrates the differences in the rate of change of forest carbon sinks across provinces.
Figure 4 shows that the line graph illustrates the variation in the rate of change of forest carbon sinks across Chinese provinces from 2010 to 2021, with Shandong Province exhibiting the highest rate (1.643) and the Tibet Autonomous Region showing the lowest rate (0.946). The rate of change in forest carbon sinks exceeds 1 in 29 provinces, while it is less than 1 in the Tibet Autonomous Region (TAR) and Qinghai Province, accounting for only 6.452% of the total. Specifically, in the decomposition results, C C T E C H exceeds 1 in 30 provinces (96.77%), and F L U E F C H exceeds 1 in 27 provinces (87.10%). This indicates that technological changes in carbon sinks and improvements in the technical efficiency of forest land use significantly enhance China’s forest carbon sinks. This further highlights the critical role of technological progress in developing forest carbon sinks.
In terms of the drivers that inhibit the rate of change of forest carbon sinks, A F P D C H , P I F L I C H , and C S E F C H inhibit the enhancement of forest carbon sinks in most provinces. Among them, A F P D C H inhibited the increase in forest carbon sinks in 12 provinces, accounting for 38.710%; P I F L I C H inhibited the increase in forest carbon sinks in 15 provinces, accounting for 48.387%; and C S E F C H inhibited the increase in forest carbon sinks in 18 provinces, accounting for 58.065%. The above shows that changes in the intensity of potential plant diseases and insect pests infestation and the rate of change in the area of forest plant diseases and insect pests infestation as undesired output indicators have a significant inhibitory effect on the enhancement of forest carbon sinks in most of the provinces, which further demonstrates that the harmful effects of plant diseases and insect pests infestation on the forest ecological environment and the function of forest carbon sinks can no longer be ignored. In addition, the inhibition of the technical efficiency change of carbon sinks on the increase in forest carbon sinks also indicates that the technical efficiency change of carbon sinks is still weak in many provinces, which needs to be further improved and strengthened.
To further investigate the relationship between the rate of change in forest carbon sinks and the influencing driving drivers across China’s three major regions, the decomposition results from 2010 to 2021 are presented in Figure 5.
Figure 5 reveals significant regional differences in the rate of change of forest carbon sinks across China’s three major regions. The average rate of change in forest carbon sinks across the three regions is greater than 1, with the eastern region showing a significantly higher rate than the western and central regions. This shows that although the proportion of forest carbon sinks in the country has been decreasing in various years, the forest carbon sinks in the eastern region still show a rising trend and the largest increase, and the overall prospects and development trend of forest carbon sinks are better than those in the other two regions. Among the favorable drivers of the rate of change in forest carbon sinks, P C S D C H , C C T E C H , F L U E F C H , and A F P D C H all contribute to the enhancement of forest carbon sinks across the three regions. Notably, C C T E C H and A F P D C H have a greater contribution than P C S D C H and F L U E F C H , with C C T E C H and A F P D C H having a stronger impact in the eastern region compared to the central and western regions. This may be due to the eastern region’s status as an economically developed area in China, where scientific and technological innovation is at its highest, with substantial technological inputs, advanced capabilities, and superior pest and disease control technologies. Consequently, the eastern region has greater overall technological progress, which effectively promotes the enhancement of forest carbon sinks. Additionally, P I F L I C H and F L D T E C H hinder the enhancement of forest carbon sinks in all three regions. The non-desired output indicator, P I F L I C H , has the most significant inhibitory effect in the eastern region. This suggests that despite the better control of pest and disease dynamics in the eastern region, the risk of potential pests and diseases still exists.
In terms of the drivers that inhibit the rate of change of forest carbon sinks, drivers such as F L D T E C H , C S E F C H , and P I F L I C H inhibit the enhancement of forest carbon sinks across all three regions. C S E F C H exerts the most significant inhibitory effect, highlighting the weak technical efficiency of China’s carbon sinks, which requires further improvement. Regarding the undesired output indicators, P I F L I C H negatively impacts the eastern and central regions. From the perspective of forest types and vegetation structure, eastern forests are predominantly plantations with limited species diversity. This results in fragile ecosystems and reduced resilience against plant diseases and insect pests. Furthermore, complex human activities have intensified the artificial spread of forest pests and diseases.

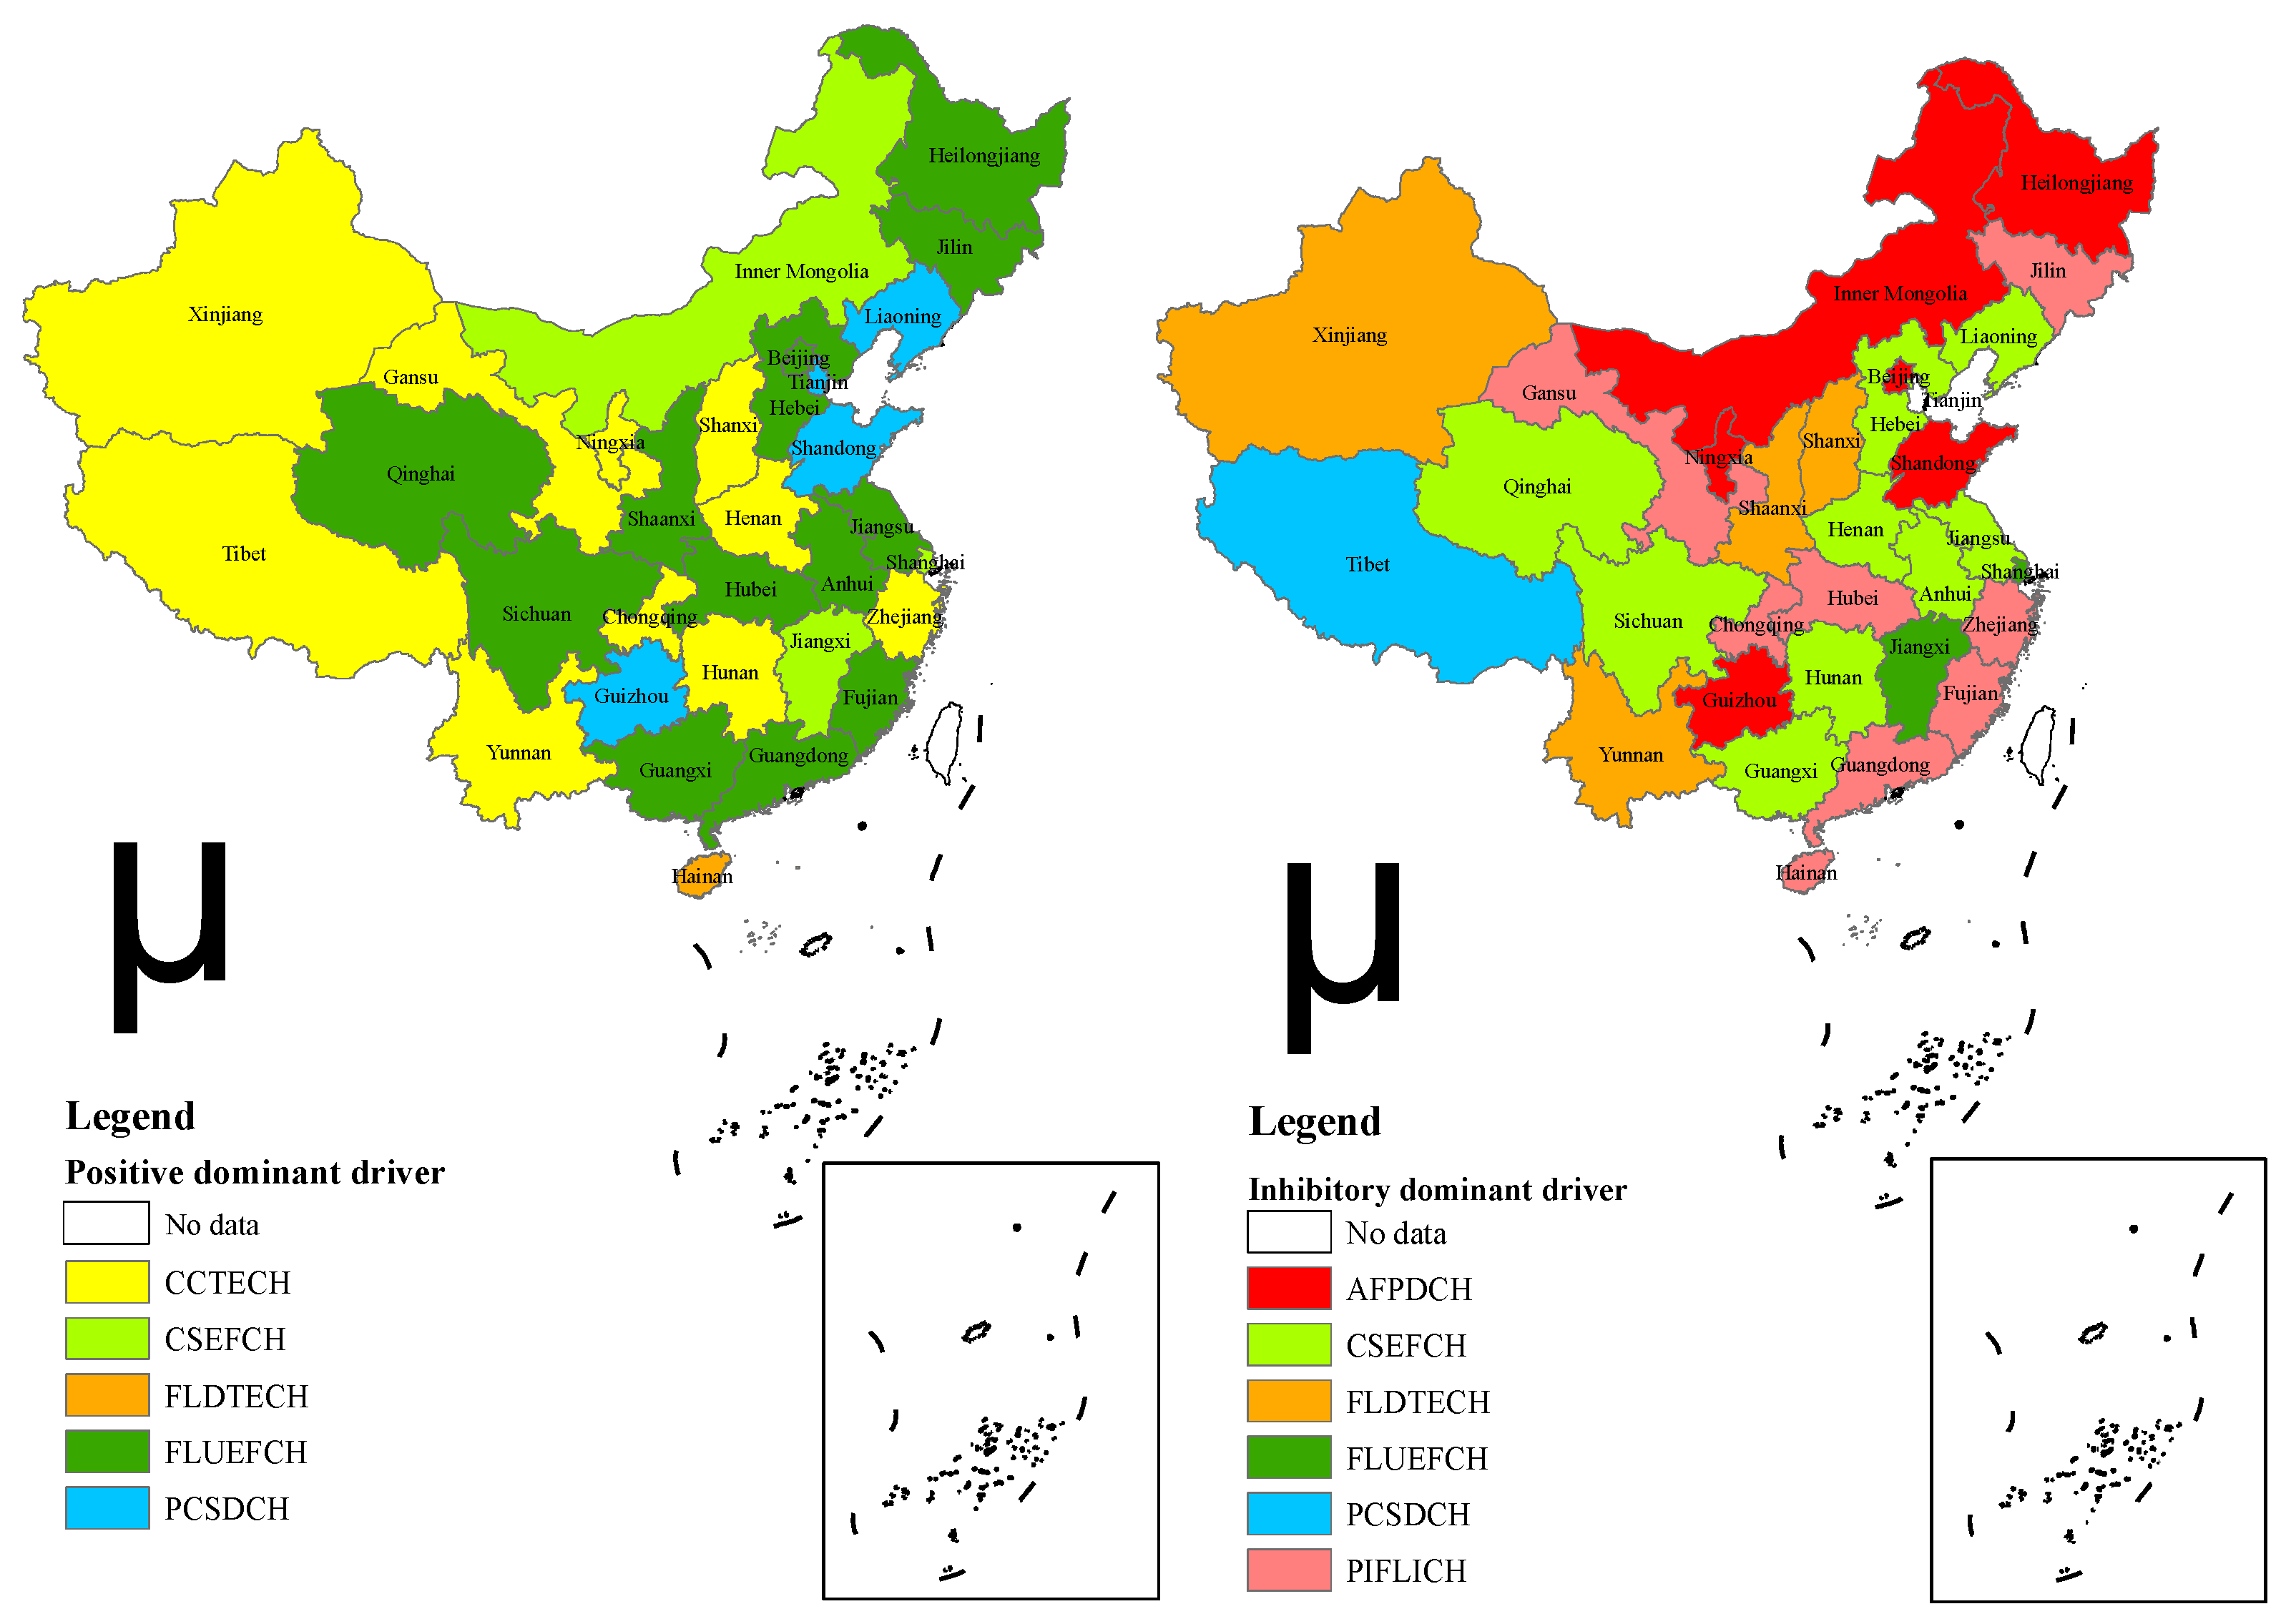
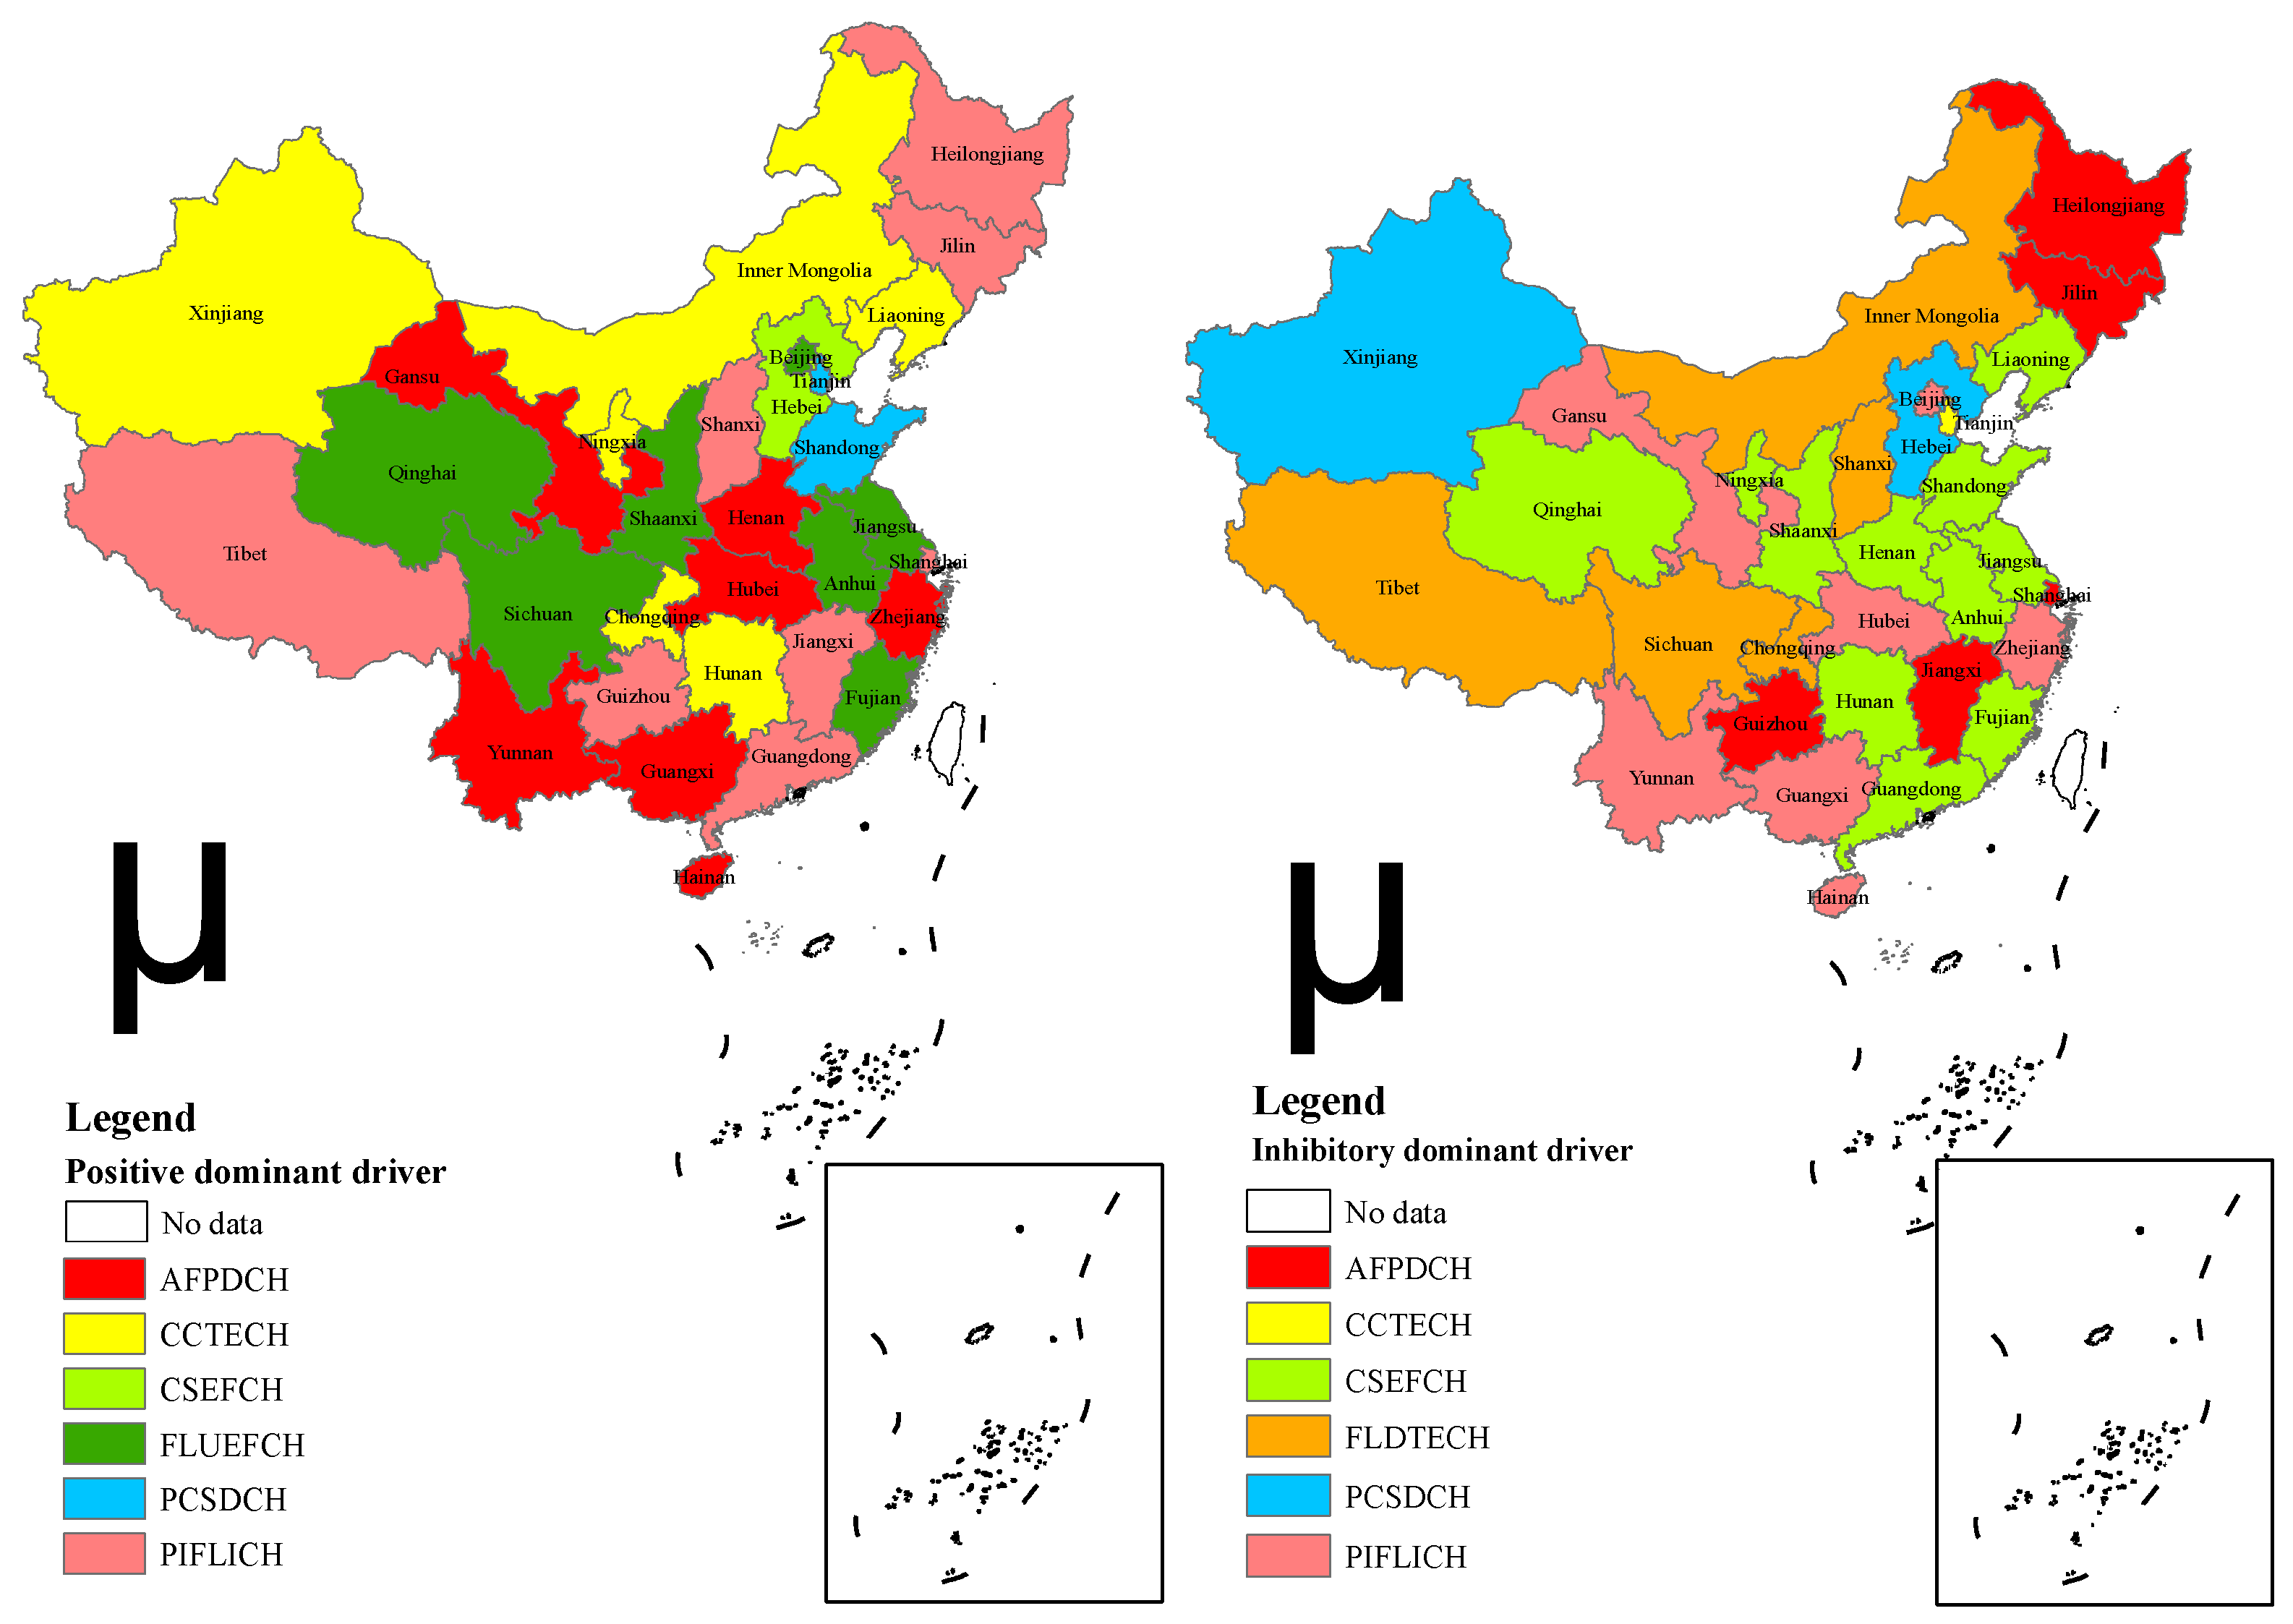
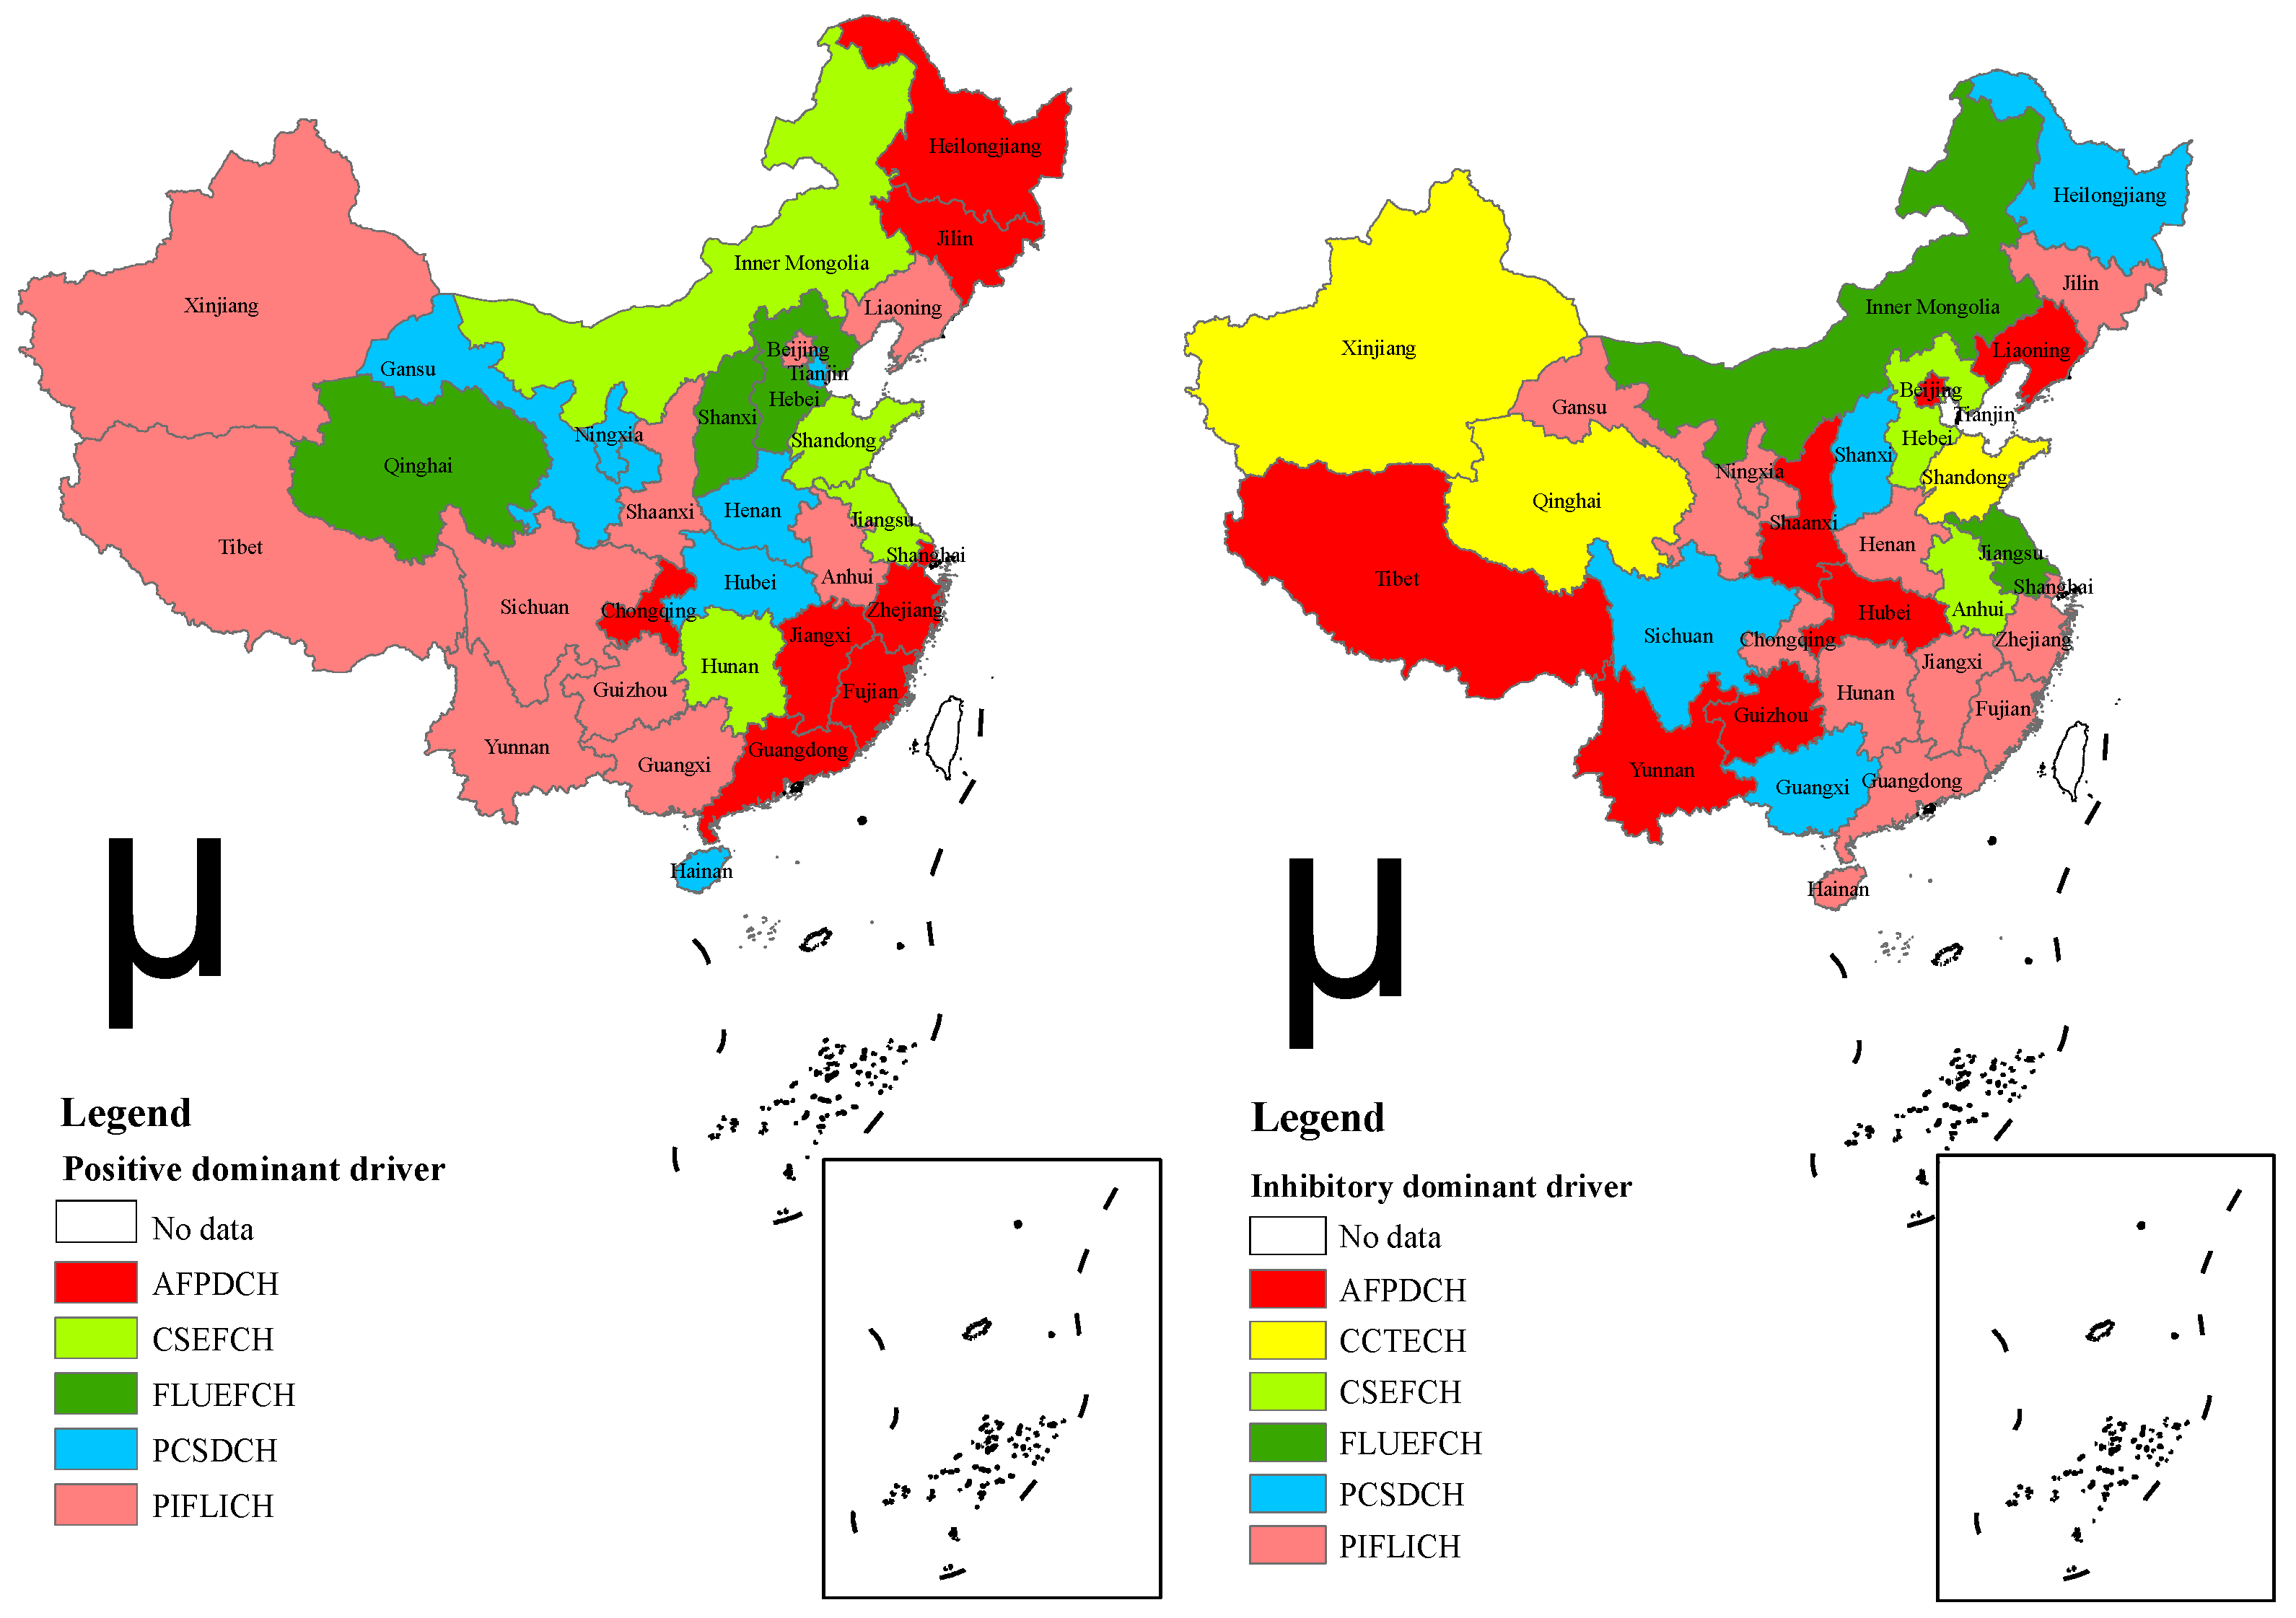
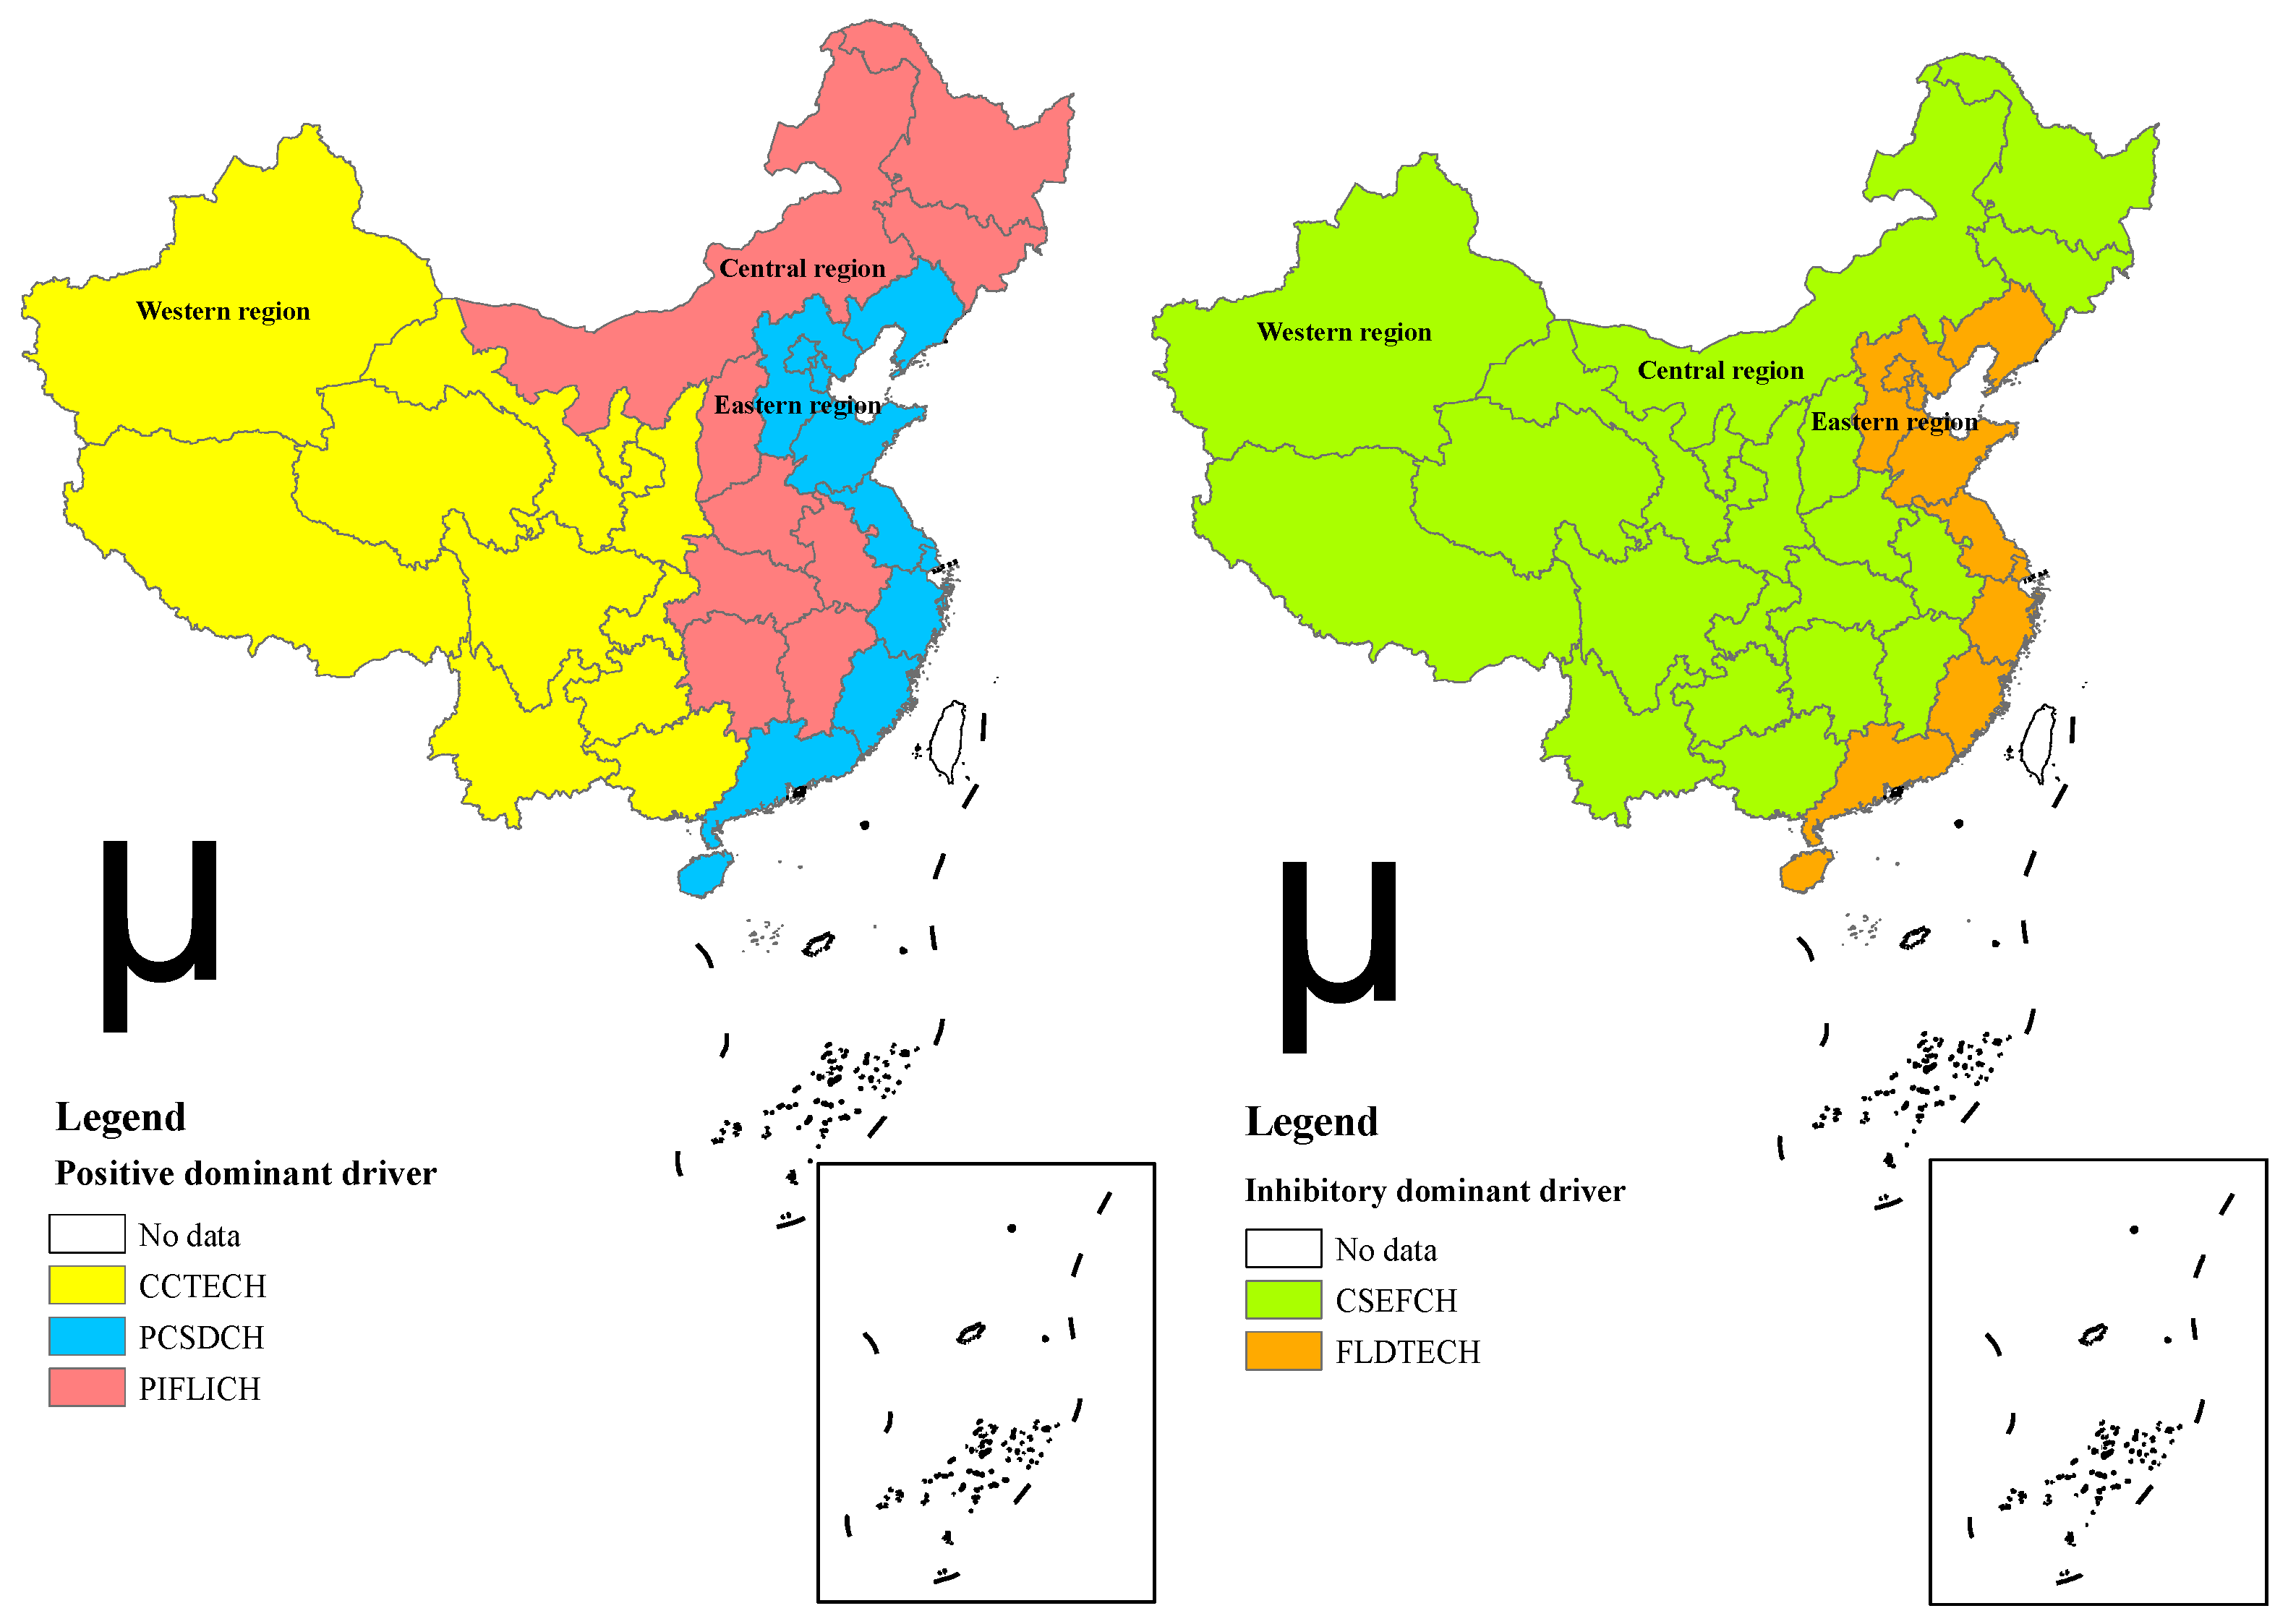
4.4.2. Analysis of the Dynamic Evolution of the Dominant Drivers Affecting Forest Carbon Sinks

Based on the above research content, it was found that the drivers influencing the change of forest carbon sinks in different regions of different provinces in China differed greatly among regions. Therefore, in order to better explore the spatial distribution pattern and dynamic evolution of the above drivers from 2010 to 2021, at the same time, considering the key role of dominant drivers in influencing the change of forest carbon sinks, we chose to use the ArcGIS 10.8 software to carry out the visualization and analysis of the dominant drivers of the rate of change of China’s forest carbon sinks in different time periods. The details are shown in Figure 6, Figure 7 and Figure 8.
As shown in Figure 6, Figure 7 and Figure 8, the dominant drivers of forest carbon sink change vary significantly across different time periods in each province of China. From 2010 to 2015, F L U E F C H was the main favorable driver for the increase in the rate of change of China’s forest carbon sink, while C S E F C H was the primary unfavorable driver. From 2016 to 2021, P I F L I C H emerged as both the primary favorable and unfavorable driver of changes in China’s forest carbon sink rate. During the period from 2010 to 2021, FFF was the main favorable driver of the increase in China’s forest carbon sink rate, while C S E F C H and P I F L I C H were the primary unfavorable drivers.
The dynamic evolution across the three time periods reveals that the primary favorable driver for the increase in China’s forest carbon sink rate shifted from F L U E F C H to C S E F C H , and ultimately back to F L U E F C H . This suggests that changes in the input efficiency of forest land area have been the most important driver of forest carbon sink improvement during various stages of development. As science and technology rapidly advanced, changes in the technical efficiency of carbon sinks became a key driver, with technological innovations playing a crucial role in boosting forest carbon sink growth. Over time, carbon sink technologies have matured and reached a bottleneck. Throughout the observation period, more efficient forest land use management and technical support, along with ongoing changes in climate and the ecological environment, contributed the most to enhancing forest carbon sinks. The main unfavorable drivers of China’s forest carbon sink changes are primarily C S E F C H and P I F L I C H . The dynamic evolution shows that the unfavorable dominant driver shifted from C S E F C H in 2010–2015 to P I F L I C H in 2016–2021, indicating that the increasing intensity of plant diseases and insect pests has become a significant driver inhibiting forest carbon sink growth. Over time, the harmful impact of plant diseases and insect pests has been reduced through government policies and improved pest management technologies. However, complex human activities, drug resistance, and environmental changes that alter pest and disease intensity remain key unfavorable drivers inhibiting the enhancement of China’s forest carbon sinks. Additionally, changes in the technical efficiency of carbon sinks and further breakthroughs in technology are key drivers inhibiting the enhancement of forest carbon sinks in many provinces.
On the basis of analyzing the dynamic evolution of the dominant drivers of the rate of change of forest carbon sinks in each province of China, the dynamic evolution of the dominant drivers of the rate of change of forest carbon sinks in the three major regions of China is further explored. A map is made of the decomposition results of the dominant drivers of the change rate of forest carbon sinks in the three major regions of China during the periods 2010–2021, 2010–2015, and 2016–2021. The details are shown in Figure 9, Figure 10 and Figure 11.
As shown in Figure 9, Figure 10 and Figure 11, the dominant driving factors influencing the rate of change in forest carbon sinks vary across China’s three major regions. From 2010 to 2015, the main favorable factors driving forest carbon sink enhancement were C C T E C H in the western region, P I F L I C H in the central region, and P C S D C H in the eastern region. The inhibiting factors were C S E F C H and F L D T E C H . From 2016 to 2021, the main favorable drivers of forest carbon sink enhancement were P C S D C H in the western region, A F P D C H in the central region, and C S E F C H in the eastern region. Inhibiting factors included P I F L I C H and C C T E C H . During the entire 2010–2021 period, the main favorable drivers of forest carbon sink enhancement were P I F L I C H in the western region and A F P D C H in the central and eastern regions, while the inhibiting factors were C S E F C H and F L D T E C H . These results indicate a similarity in the influence of dominant drivers between the central and eastern regions. Additionally, the decomposition of regional drivers reveals that changes in the technical efficiency of carbon sinks, as well as the intensity and spread of plant diseases and insect pests, were the most significant drivers affecting forest carbon sink enhancement in each region.
These dynamics suggest that environmental conditions, forest quality, economic development, and policy orientation influence the dominant drivers of forest carbon sink enhancement across regions. During the periods 2010–2021 and 2016–2021, the two undesired indicators were not the primary drivers inhibiting overall forest carbon sink growth. However, from 2016 to 2021, increased plant diseases and insect pests’ intensity significantly inhibited the forest carbon sink enhancement in the eastern and central regions. This highlights the need for the enhanced prevention and control of plant diseases and insect pests in the future. Furthermore, the findings suggest that despite technological advancements, the lack of fundamental breakthroughs in carbon sink technology has become a major obstacle to forest carbon sink improvement, particularly in the western region.

5. Discussion

5.1. Research Contributions

This research contributes to current trends by closely aligning with the latest research hotspots. By exploring the development and evolution of incremental forest carbon sinks and analyzing their driving factors, this study provides valuable guidance for achieving high-quality development of forest carbon sinks. Additionally, this paper divides China into three major regions based on an analysis of the 31 provinces, enhancing the scope and relevance of the research findings. Furthermore, the analysis of forest carbon sinks and their incremental changes form the foundation for studying the driving factors. This paper first analyzes the amount, proportion, and increment of forest carbon sinks in each province and region of China, enriching the study’s overall content. In the driver analysis section, the influence of key drivers on forest carbon sink enhancement is examined. This study analyzes the spatial and temporal characteristics of the main driving factors to identify the dominant drivers influencing forest carbon sink enhancement. Additionally, it investigates whether these drivers evolve over space and time.
With regard to the innovation in modeling, previous studies on the drivers of forest carbon sinks have primarily focused on analyzing efficiency and influences through the established relationship between inputs and outputs. This study integrates the decomposition analysis method, commonly used in energy and environmental fields, with the analysis of forest carbon sink drivers, focusing on the internal structure of inputs and outputs.
As for the innovation in the consideration of indicators, this study incorporates all relevant inputs and outputs into the decomposition framework. In considering non-desired indicators, the study also evaluates the enforceability and effectiveness of policies, selecting plant diseases and insect pests—often overlooked in other studies—as non-desired outputs to explore their impact on forest carbon sinks. This study provides a reference for achieving the high-quality development of forest carbon sinks, highlighting whether efforts should focus on controlling plant diseases and insect pests.

5.2. Limitations and Future

This study acknowledges its limitations. Regarding data, due to the challenges in obtaining forest carbon sink data, remote sensing data, and ArcMap transformation were used to derive the data, aiming to ensure maximum accuracy. However, potential data errors may still arise, particularly in areas with complex forest types. Additionally, data and conclusions for the most recent year are absent due to difficulties in data acquisition. Furthermore, the inhibiting influences on forest carbon sinks have not been sufficiently considered. In the future, the exploration of other possible inhibiting influences could be deepened with the support of data, as well as the expansion of the study to more recent years and a wider study area.

6. Conclusions and Policy Recommendations

6.1. Conclusions

This study uses ArcMap remote sensing data to calculate forest carbon sinks for each province in China from 2010 to 2021. Additionally, based on the production theoretical decomposition analysis (PDA) model, this study focuses on non-expected output indicators such as plant diseases and insect pests, and decomposes the driving drivers affecting the rate of change in forest carbon sinks by analyzing the internal structure of inputs and outputs. The main conclusions are as follows:
(1)
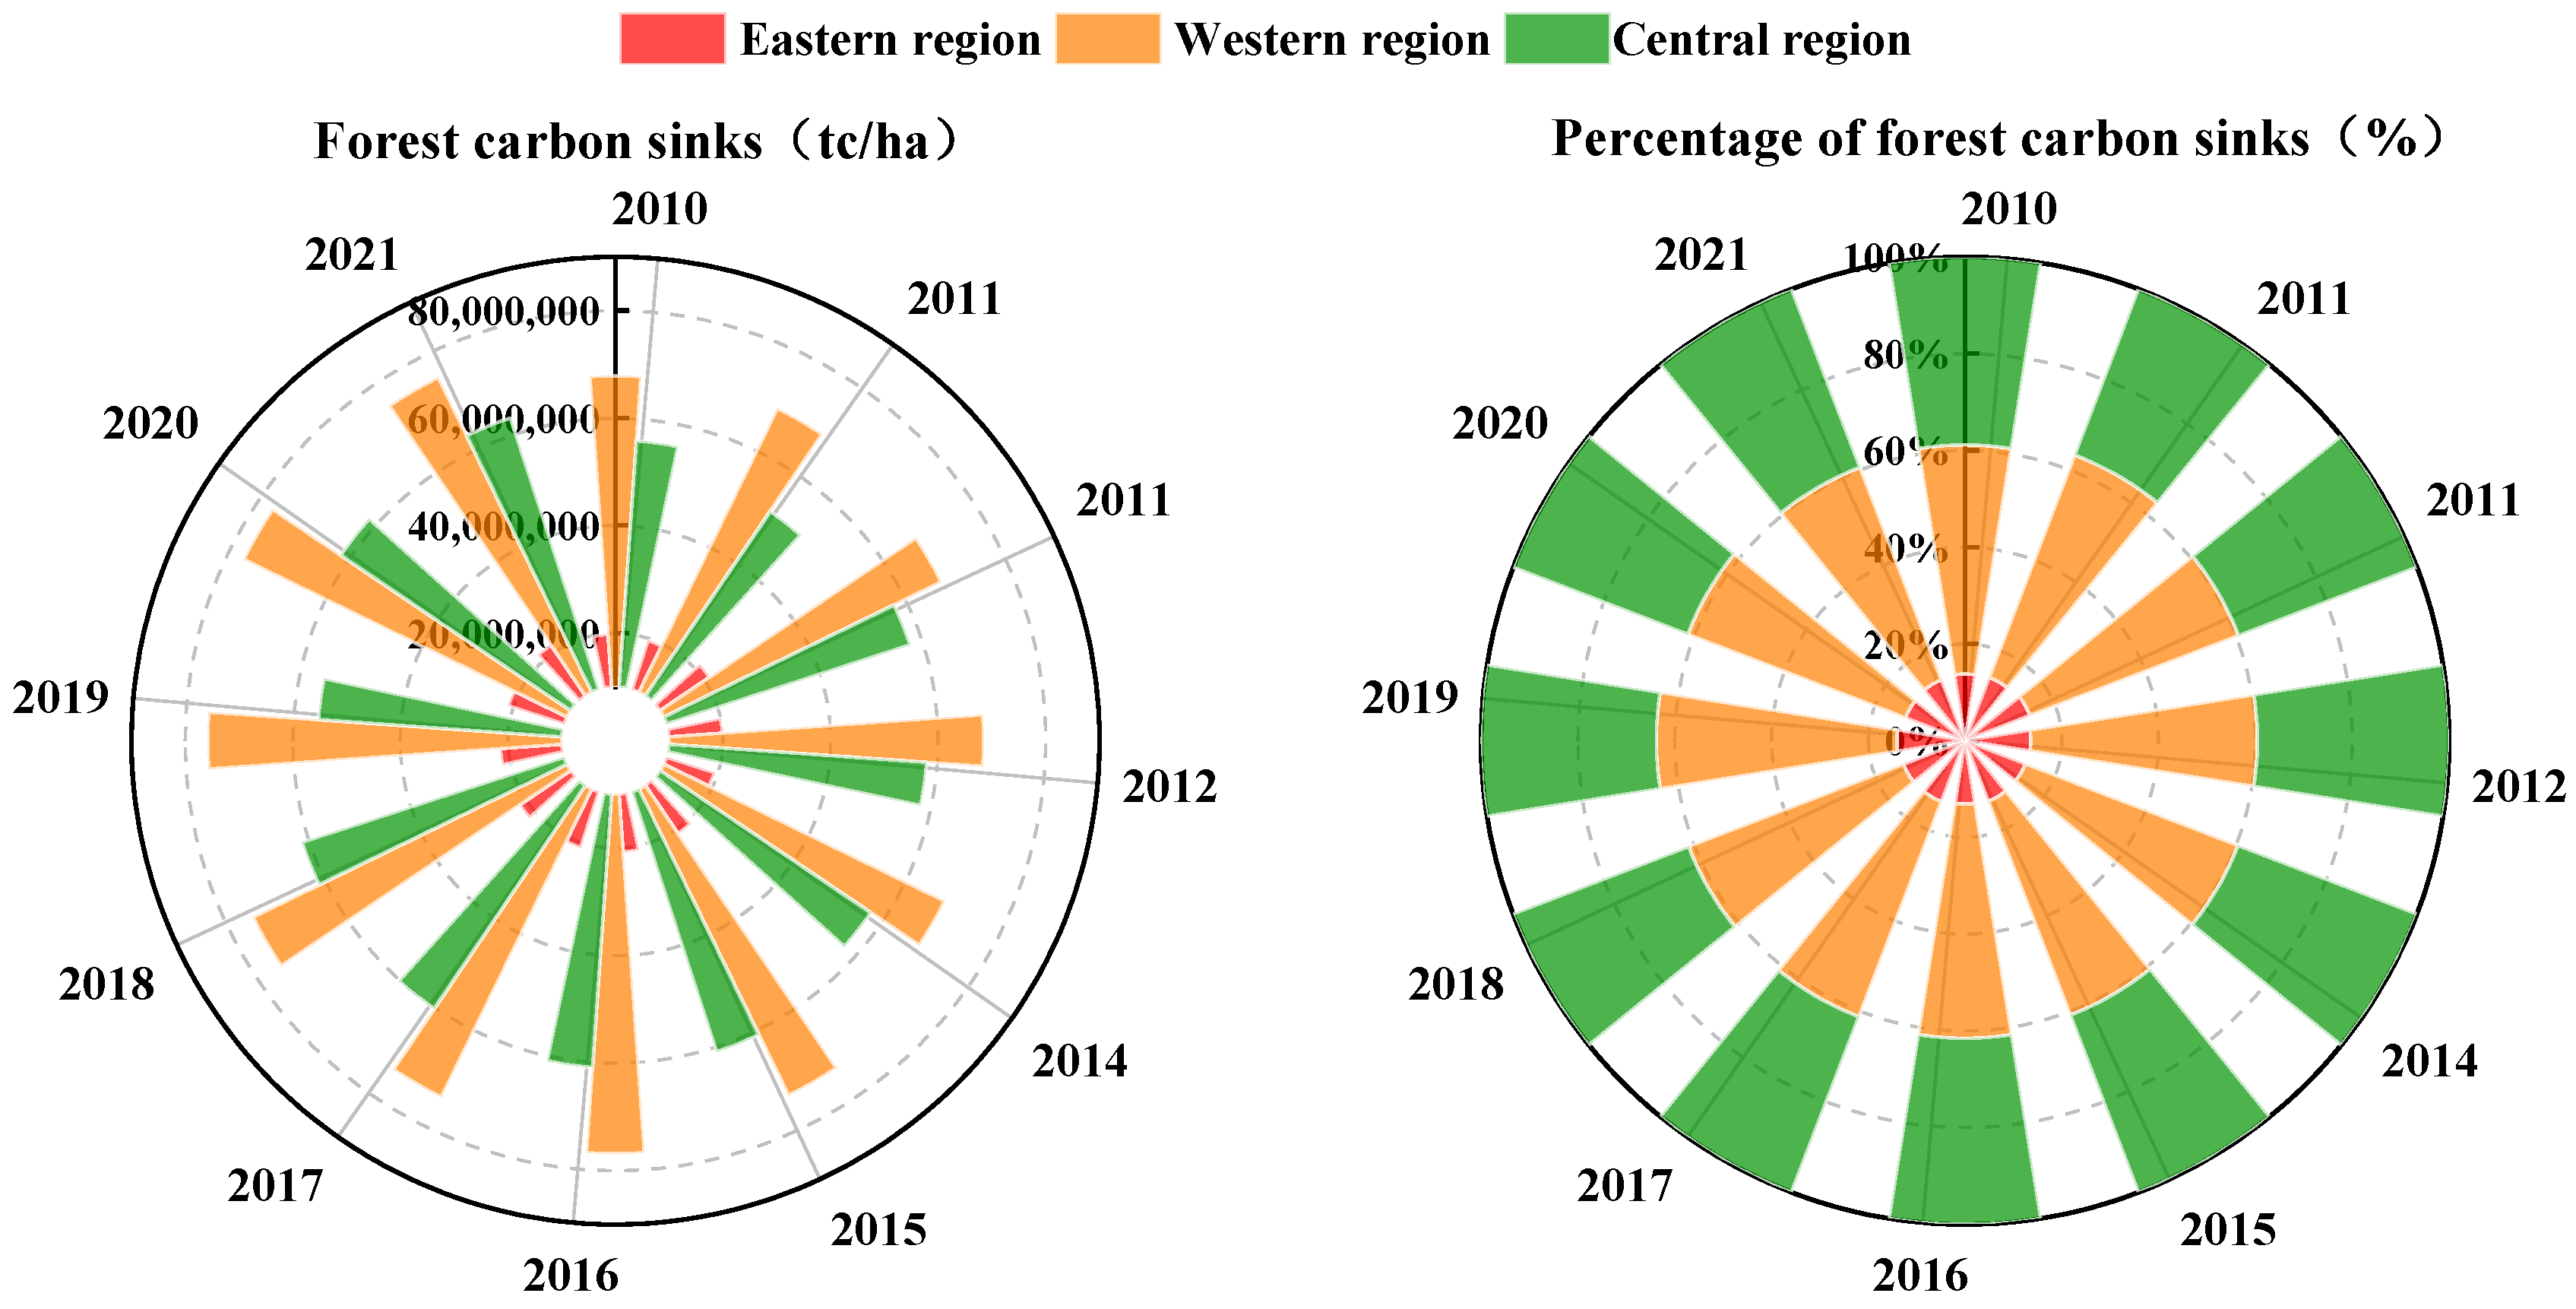
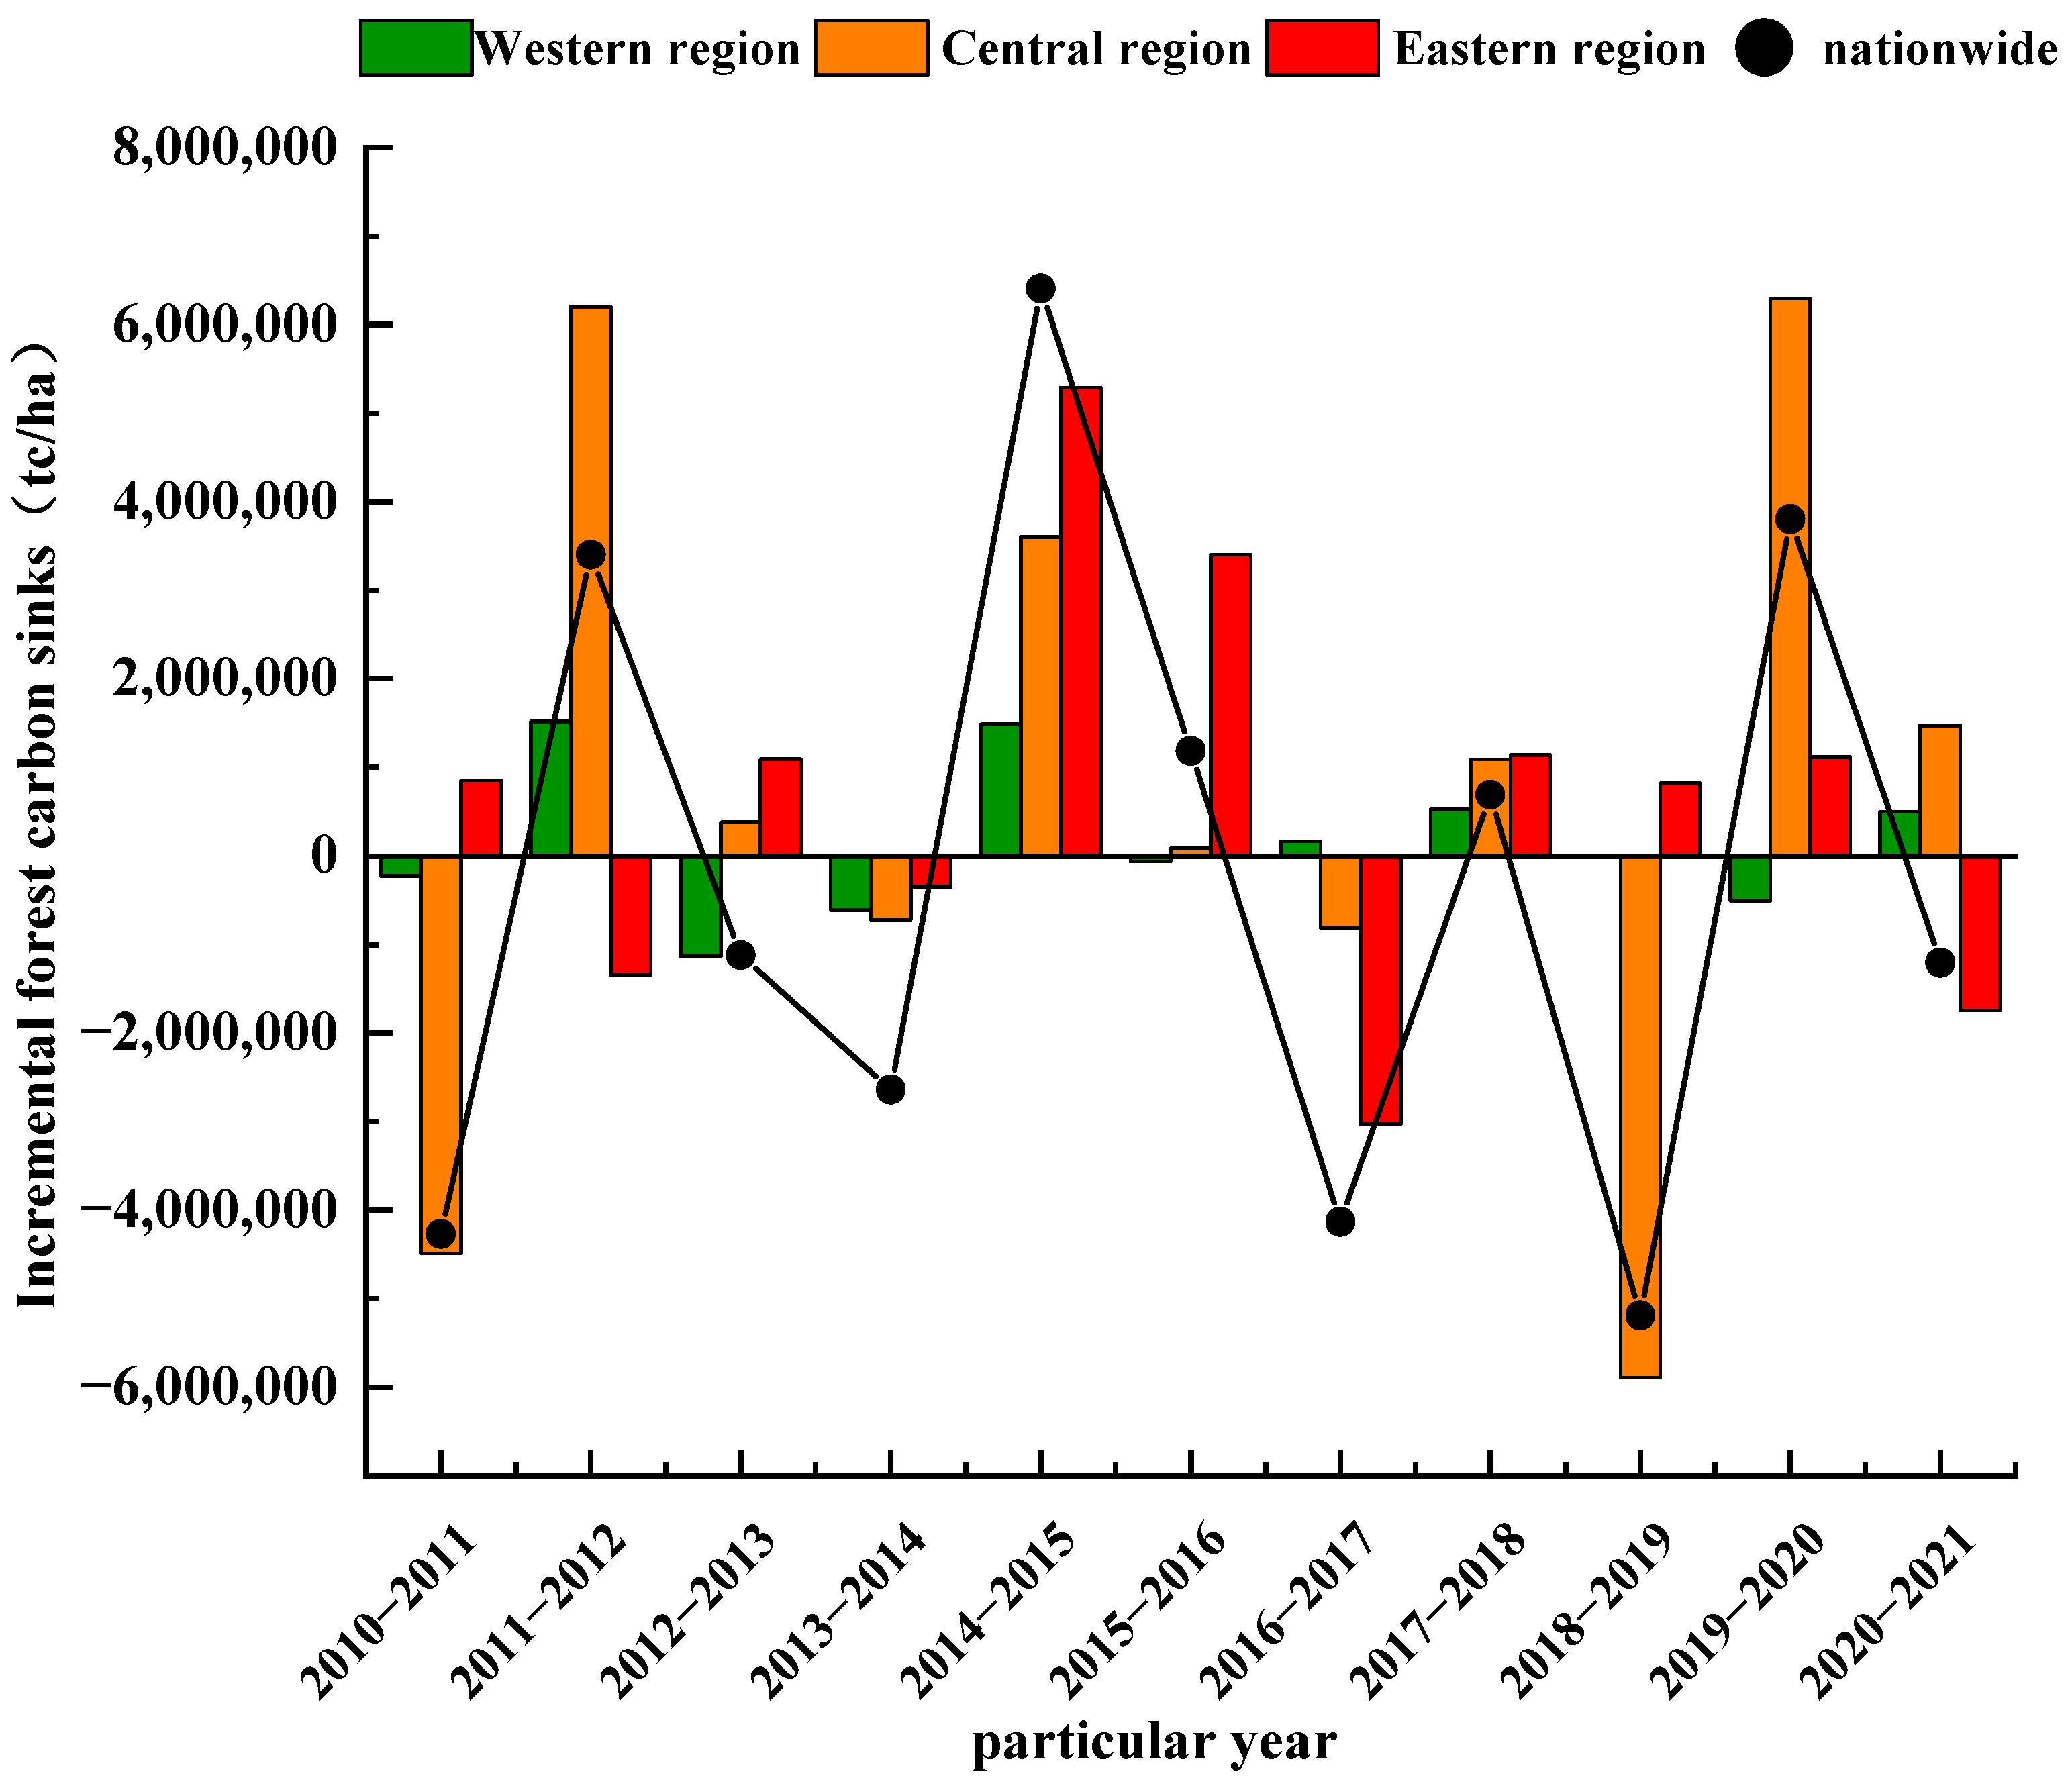
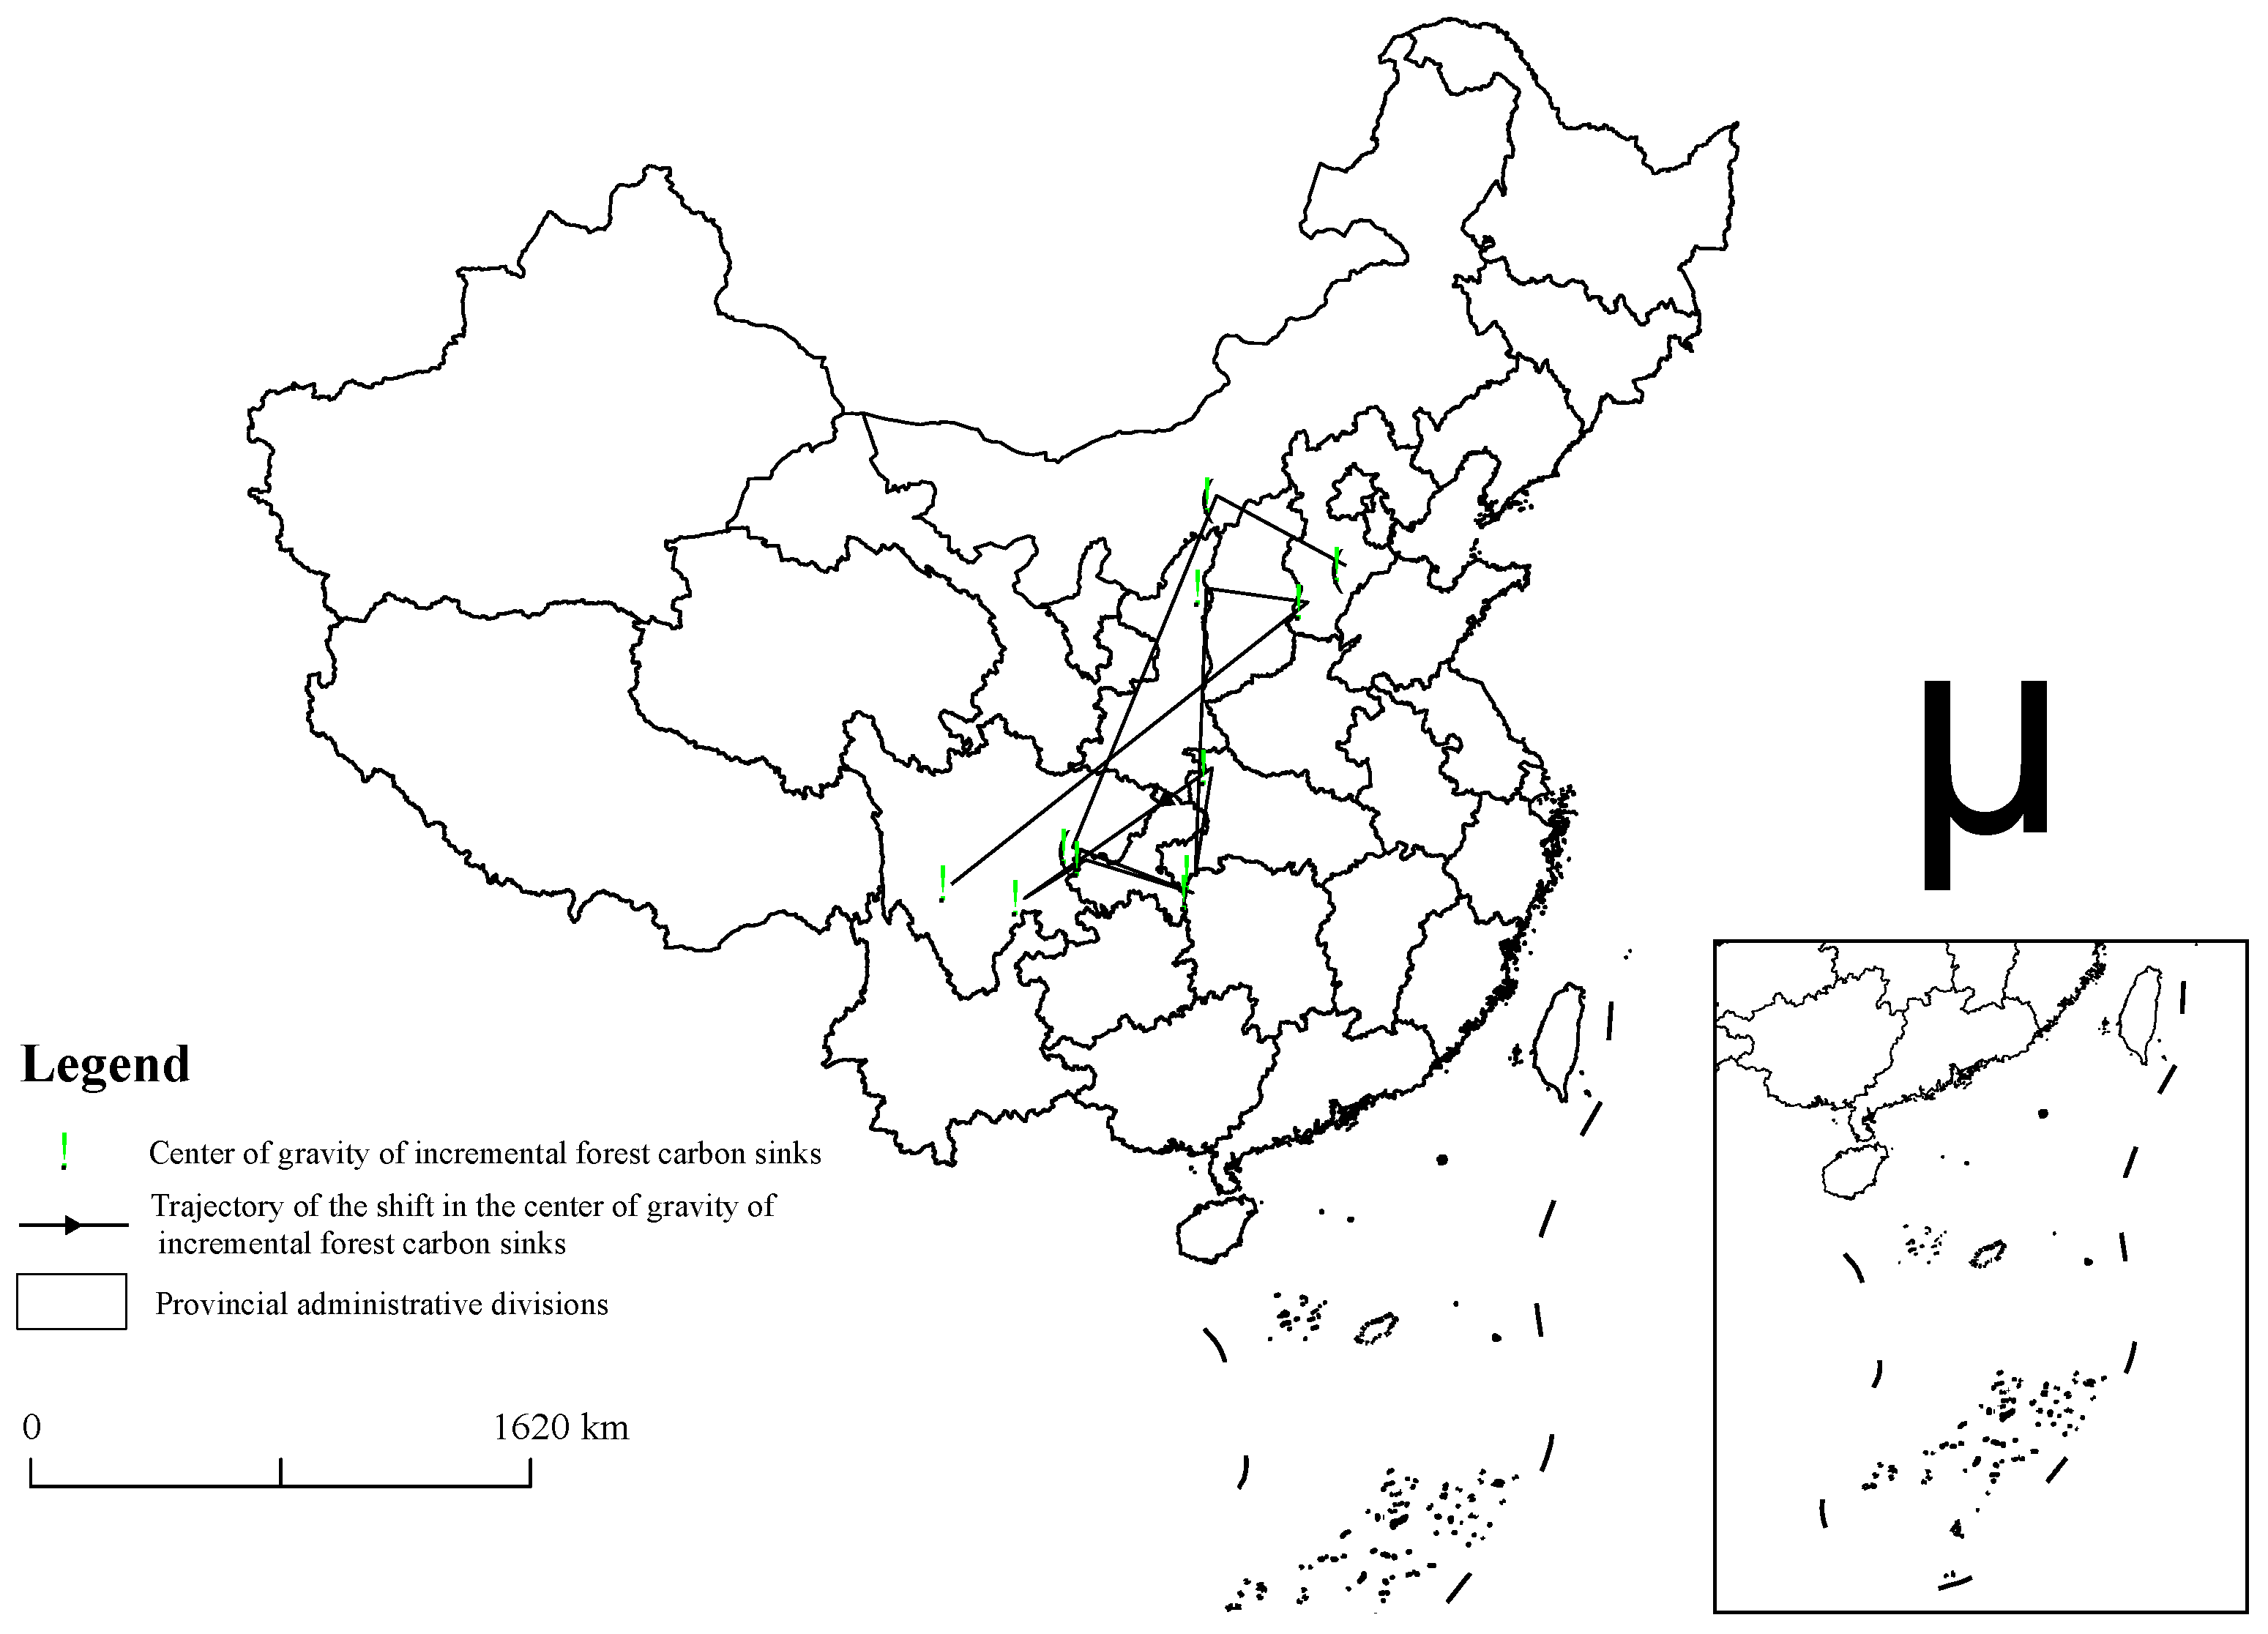
The spatial and temporal evolution of forest carbon sinks from a single indicator perspective includes four aspects: total forest carbon sinks, incremental forest carbon sinks, center of gravity shifts, and the rate of change in forest carbon sinks. From 2010 to 2021, forest carbon stocks in China and its three major regions exhibited a consistent annual increase, with an overall growth of 11.2%. Significant regional differences were observed in the dynamic changes of forest carbon sink increments, with the western and central regions exhibiting larger fluctuations, while the eastern region showed more stable growth. Furthermore, the gravity center of forest carbon sink increments in China shifted overall from the southwest to the northeast. Finally, the forest carbon sink change rate in China showed positive growth across both regions and provinces.
(2)
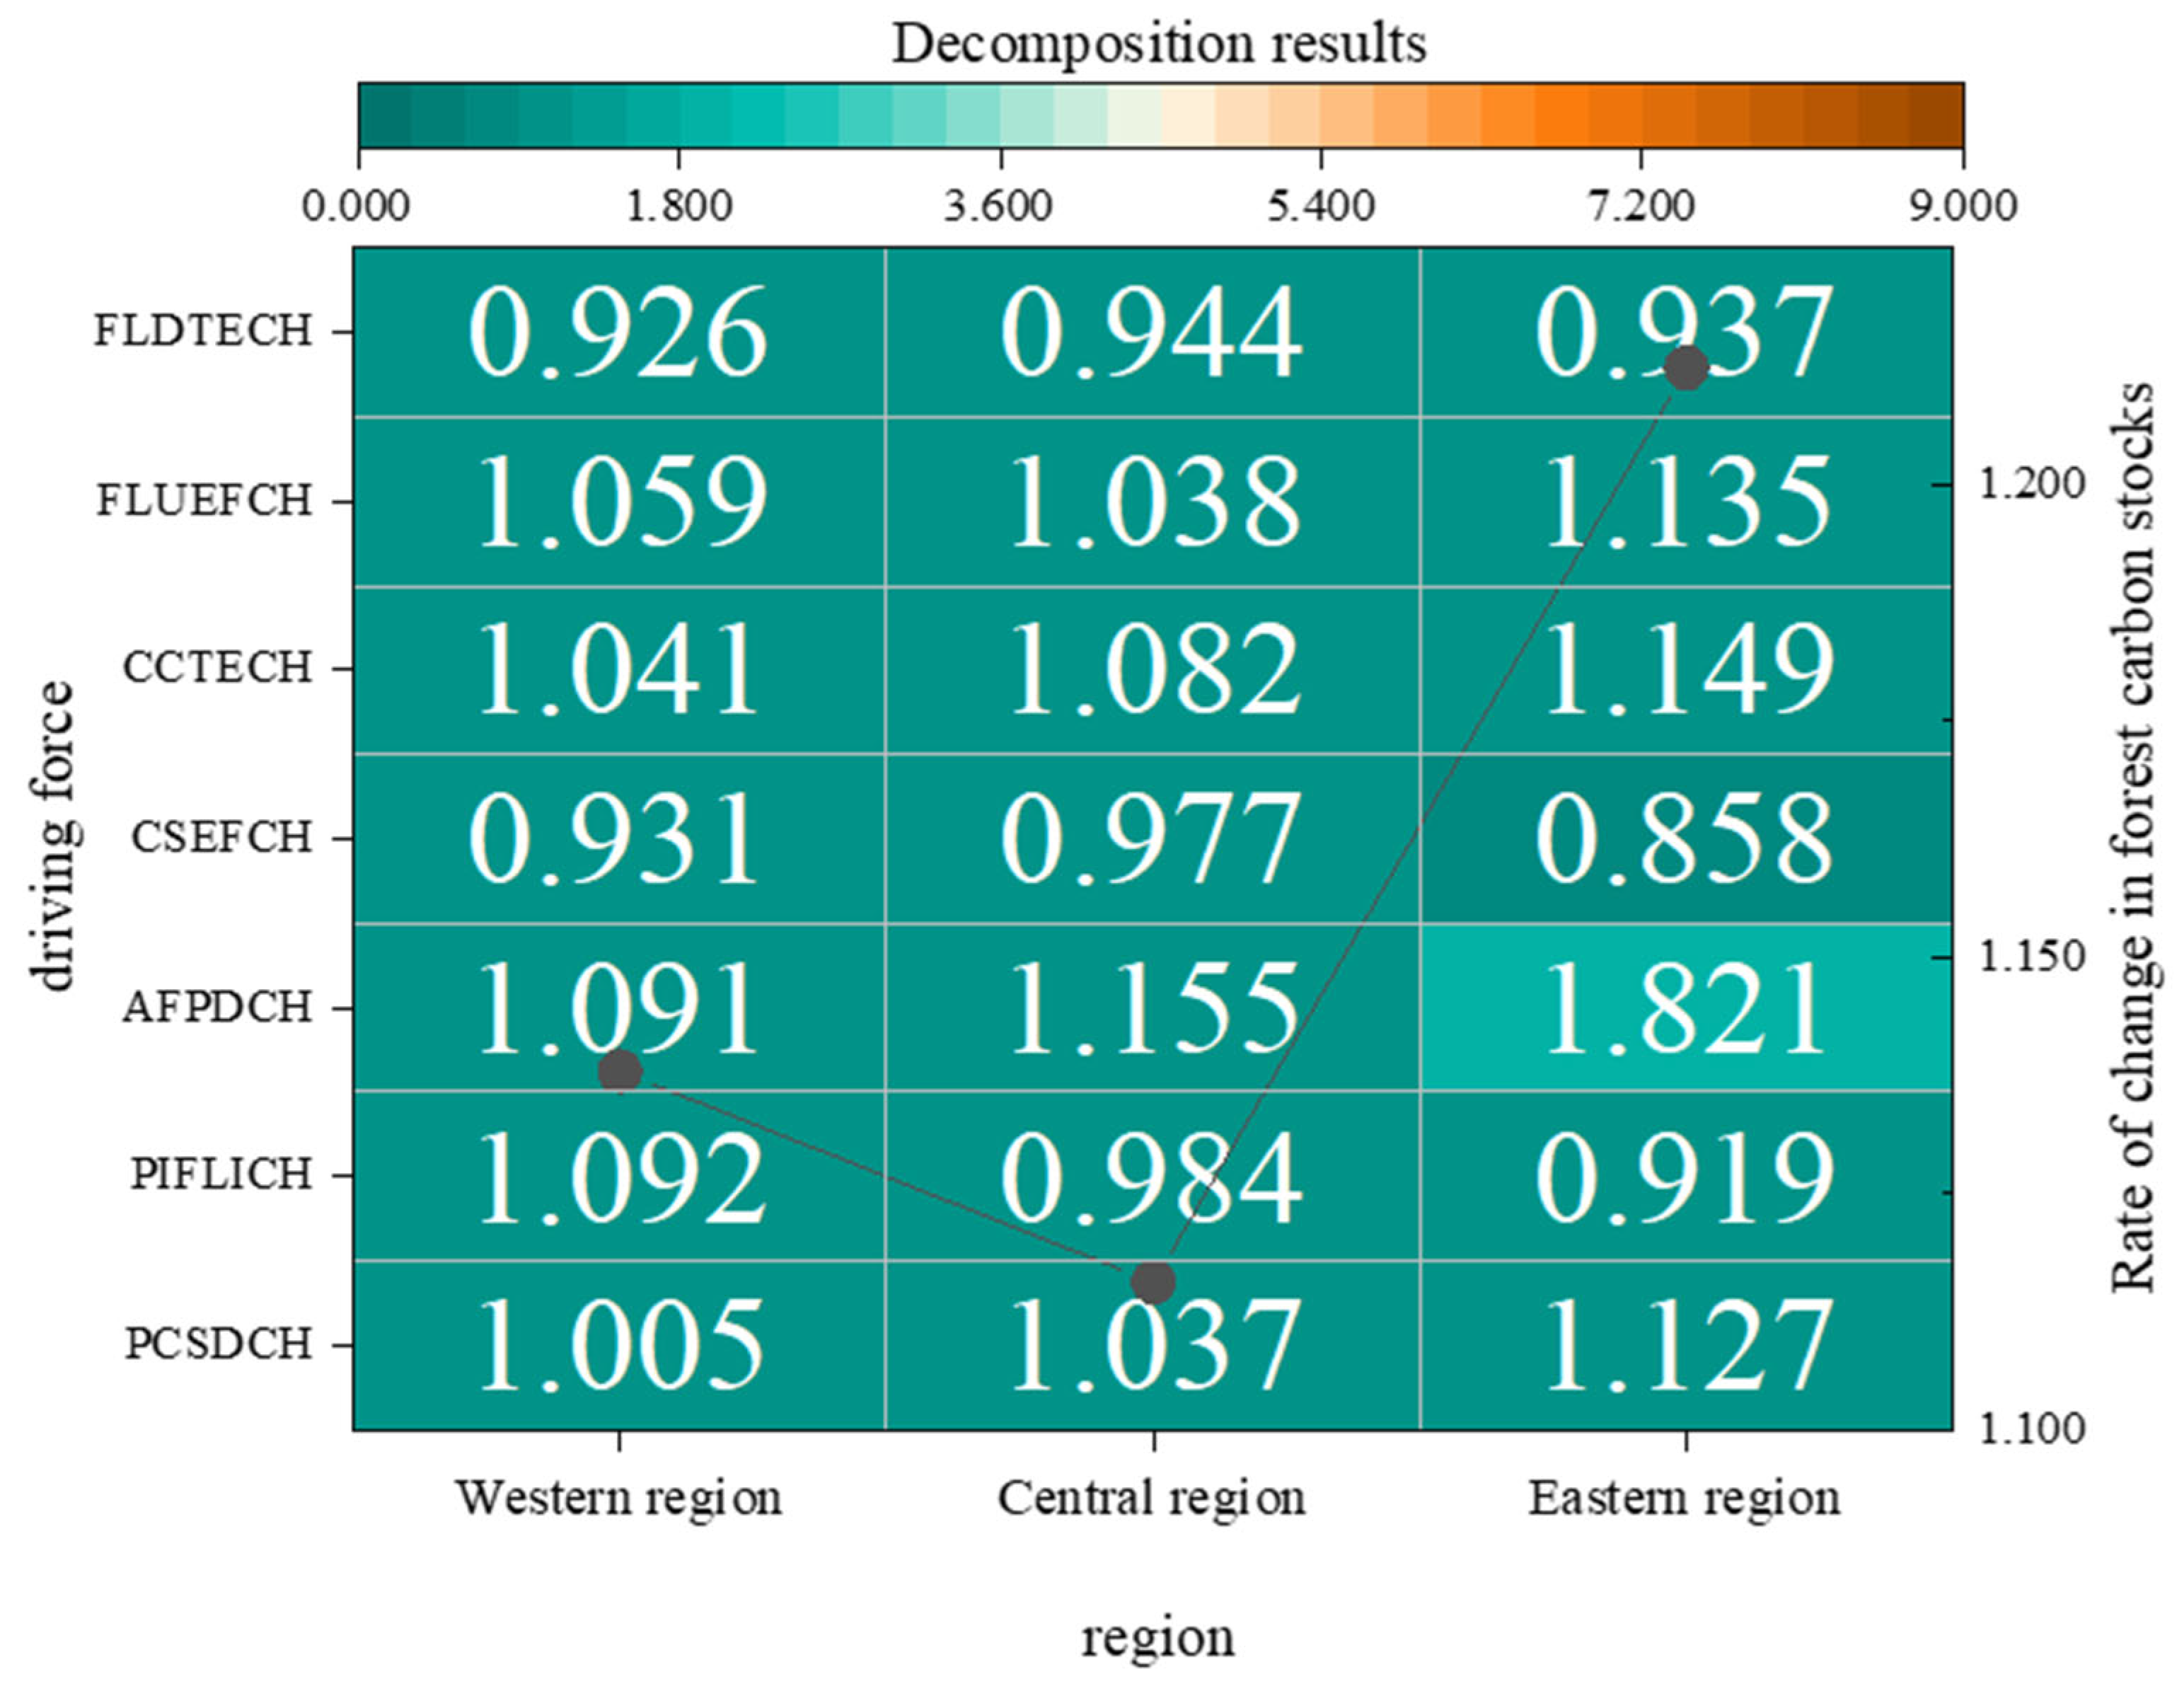
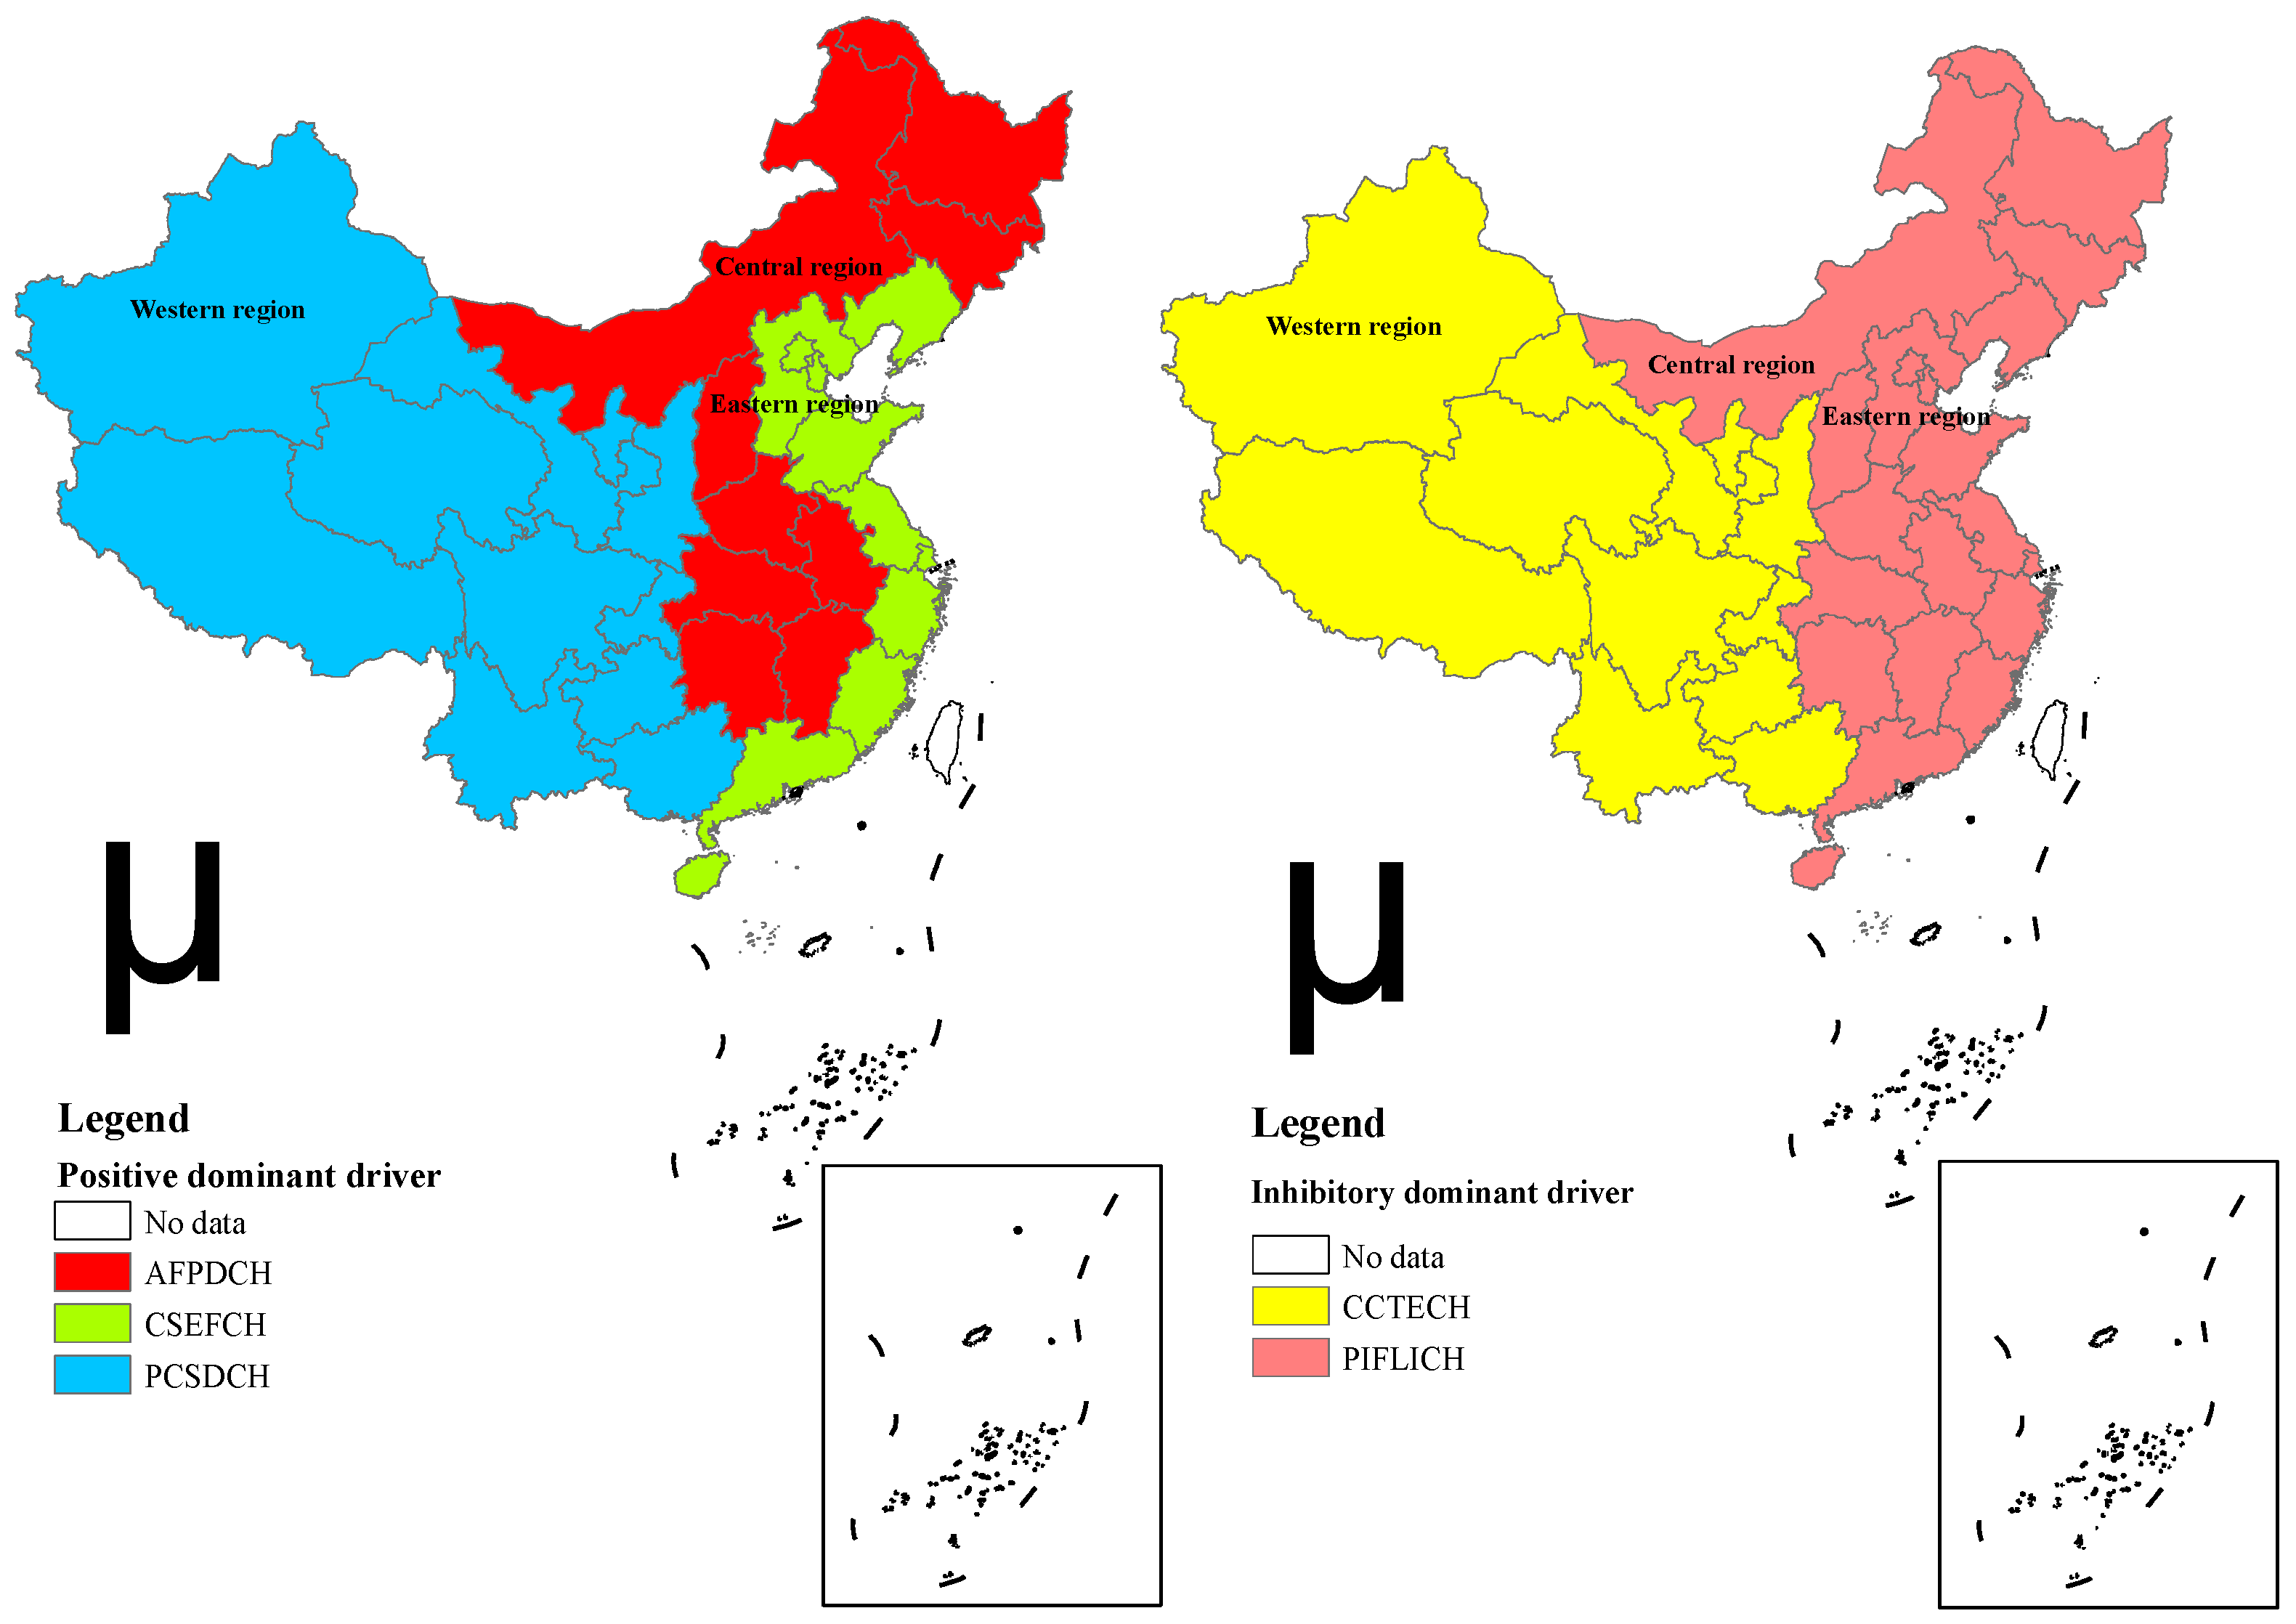
Research on the index decomposition of the rate of change in forest carbon sinks under a multi-dimensional driving mechanism: Using the production theoretical decomposition analysis (PDA) model, an index decomposition model was developed, focusing on changes in the technical efficiency of carbon sinks and the intensity of plant diseases and insect pests, with an exploration of their temporal and spatial evolution. Technical changes in carbon sinks and improvements in the technical efficiency of forest land use significantly enhance forest carbon sinks. In contrast, reductions in carbon sink efficiency, along with changes in the extent and intensity of forest pest and rodent infestations, have a detrimental effect. Notably, the dominant favorable drivers in the eastern and central regions exhibit consistent patterns of evolution. Moreover, the increased intensity of potential pest and rodent infestations may become a critical factor limiting the future enhancement of forest carbon sinks.

6.2. Policy Recommendations

Based on these conclusions, the paper offers the following policy recommendations:
(1)
Strengthening forest protection and ecological restoration. Inter-regional variations in research findings reveal significant differences in both the incremental amounts and rates of change of forest carbon sinks. Regions globally should implement differentiated forest management policies to account for variations in forest carbon sink potential across regions. Targeted protection and restoration strategies should be developed based on the trajectory of the shift in the forest carbon sink increment’s gravity center in each region. In regions with high forest carbon sink potential, ecological protection should be prioritized. Simultaneously, the maintenance and sustainable use of forest ecological benefits must be ensured in economically developed regions.
(2)
Strengthening forest pest and disease control. To counteract the negative impact of increasing forest disease, pest, and rodent intensity on forest carbon sink enhancement, the government should increase investments in prevention and control measures and enhance technology and response capabilities. The government should allocate more resources to forest pest and disease prevention, while enhancing control technologies and response capabilities. A monitoring and early warning system for pests, diseases, and rodents should be established, alongside strengthening the training of grassroots forestry staff in pest control techniques for timely detection and response. Simultaneously, attention should be given to changes in the intensity of potential forest pests and diseases, particularly in densely populated, economically developed regions.
(3)
Innovating and upgrading carbon sink-related technologies. Enhancing the technical efficiency of carbon sinks remains a goal that requires further development in each region. Cooperation and exchange in forest carbon sink management should be strengthened across regions. Successful experiences and technological achievements must be shared, and cross-regional projects should be promoted to ensure the optimal allocation and sharing of carbon sink resources. Simultaneously, the advanced technologies of leading regions should be actively promoted to enhance the technical efficiency of forest management in disadvantaged areas [49]. Investment in forestry research and development should be increased to promote technological upgrades, enhancing the carbon sequestration capacity of forest carbon sinks and ensuring the optimal allocation of resources.

Author Contributions

Conceptualization, J.W.; Data curation, M.Z.; Formal analysis, S.Z.; Investigation, J.W. and M.Z.; Writing—original draft, J.W.; Writing—review and editing, J.W. and Y.H.; Project administration, Y.H.; Supervision, Y.H.; Funding acquisition, Y.H. All authors have read and agreed to the published version of the manuscript.

Funding

This research was founded by the General project of the National Social Science Foundation grant number [24BGL019].

Data Availability Statement

Data will be made available upon request.

Conflicts of Interest

The authors declare no conflicts of interest.

References

  1. Wang, W.; He, T.; Lin, J.; Zhao, H.; Qin, Z.; Dai, K. Sino-US green finance cooperation (2016–2022)—An empirical analysis based on texts. J. Environ. Dev. 2023, 32, 307–322. [Google Scholar] [CrossRef]
  2. Ge, L.; Zhao, H.; Yang, J.; Yu, J.; He, T. Green finance, technological progress, and ecological performance-evidence from 30 Provinces in China. Environ. Sci. Pollut. Res. Int. 2022, 29, 66295–66314. [Google Scholar] [CrossRef] [PubMed]
  3. Vilkov, A.; Tian, G. Efficiency Evaluation of Forest Carbon Sinks: A Case Study of Russia. Forests 2024, 15, 649. [Google Scholar] [CrossRef]
  4. Meng, X.; Li, J.; Jin, M.; Su, X.; Suo, G. Research on Forest Carbon Sink Potential in China. Sustainability 2023, 15, 3589. [Google Scholar] [CrossRef]
  5. Ye, Y. Time-Varying Evolution and Impact Analysis of Forest Tourism Carbon Emissions and Forest Park Carbon Sinks in China. Forests 2024, 15, 1517. [Google Scholar] [CrossRef]
  6. Liu, W.; Guo, Z.; Lu, F.; Wang, X.; Zhang, M.; Liu, B.; Wei, Y.; Cui, L.; Luo, Y.; Zhang, L.; et al. The influence of disturbance and conservation management on the greenhouse gas budgets of China’s forests. J. Clean. Prod. 2020, 261, 121000. [Google Scholar] [CrossRef]
  7. Ge, J.; Lin, B. Convergence or divergence? Unraveling the global development pattern of forest carbon sink. Environ. Impact Assess. Rev. 2024, 105, 107442. [Google Scholar] [CrossRef]
  8. Zhu, J.J.; Gao, T.; Yu, L.Z.; Yang, K.; Sun, T.; Lu, D.L.; Liu, Z.H.; Chu, Y.D.; Zhang, J.X.; Teng, D.X.; et al. Carbon sink of forest ecosystems: Concept, time effect and improvement approaches. Ying Yong Sheng Tai Xue Bao 2024, 35, 2313–2321. [Google Scholar]
  9. Wang, L.; Chen, L.; Long, Y.; Li, C. Spatiotemporal evolution characteristics and spatial spillover effects of forest carbon sink efficiency in China. Env. Dev Sustain 2024, 1–33. [Google Scholar] [CrossRef]
  10. He, X.; Chen, L.; Huang, Y. A Study of Forest Carbon Sink Increment from the Perspective of Efficiency Evaluation Based on an Inverse DEA Model. Forests 2022, 13, 1563. [Google Scholar] [CrossRef]
  11. Wei, J.; Shen, M. Analysis of the Efficiency of, Forest Carbon Sinks and Its Influencing Factors-Evidence from China. Sustainability 2022, 14, 11155. [Google Scholar] [CrossRef]
  12. Bongers, F.; Chazdon, R.; Poorter, L.; Peña-Claros, M. The potential of secondary forests. Science 2015, 348, 642–643. [Google Scholar] [CrossRef]
  13. Haiou, C.; Min, L. Research on resource dynamics in the ninth forest inventory of China. West. For. Sci. 2020, 49, 90–95. [Google Scholar]
  14. Canadell, J.G.; Raupach, M.R. Managing Forests for Climate Change Mitigation. Science 2008, 320, 1456–1457. [Google Scholar] [CrossRef] [PubMed]
  15. Hautier, Y.; Tilman, D.; Isbell, F.; Seabloom, E.W.; Borer, E.T.; Reich, P.B. Anthropogenic environmental changes affect ecosystem stability via biodiversity. Science 2015, 348, 336–340. [Google Scholar] [CrossRef]
  16. Yao, R.; Hu, Z.; Guan, J. Interaction between forest carbon sinks and economic growth. For. Econ. Issues 2022, 42, 73–79. [Google Scholar]
  17. Hao, Y.; Xu, Y.; Zhang, J.; Hu, X.; Huang, J.; Chang, C.P.; Guo, Y. Relationship between forest resources and economic growth: Empirical evidence from China. J. Clean. Prod. 2019, 214, 848–859. [Google Scholar] [CrossRef]
  18. Hubau, W.; Lewis, S.L.; Phillips, O.L.; Affum-Baffoe, K.; Beeckman, H.; Cuní-Sanchez, A.; Daniels, A.K.; Ewango, C.E.; Fauset, S.; Mukinzi, J.M.; et al. Asynchronous carbon sink saturation in African and Amazonian tropical forests. Nature 2020, 579, 80–87. [Google Scholar] [CrossRef]
  19. Maia, V.A.; Santos, A.B.; de Aguiar-Campos, N.; de Souza, C.R.; de Oliveira, M.C.; Coelho, P.A.; Morel, J.D.; da Costa, L.S.; Farrapo, C.L.; Fagundes, N.C.; et al. The carbon sink of tropical seasonal forests in southeastern Brazil can be under threat. Sci. Adv. 2020, 6, eabd4548. [Google Scholar] [CrossRef]
  20. Song, Y.K. An empirical study on the relationship between economic growth and forest carbon sink value based on PVAR model. Front. Energy Res. 2023, 11, 1249144. [Google Scholar] [CrossRef]
  21. Meng, J.; Liang, C.; Chen, W. Research on the influence mechanism of heterogeneous environmental regulation on the growth of forest carbon sinks in China. J. Beijing For. Univ. (Soc. Sci. Ed.) 2024, 23, 42–51. [Google Scholar]
  22. Zhu, H.; Cai, Y.; Lin, H.; Tian, Y. Impacts of Cross-Sectoral Climate Policy on Forest Carbon Sinks and Their Spatial Spillover: Evidence from Chinese Provincial Panel Data. Int. J. Environ. Res. Public Health 2022, 19, 14334. [Google Scholar] [CrossRef] [PubMed]
  23. Zamolodchikov, D.G.; Grabovskii, V.I.; Shulyak, P.P.; Chestnykh, O.V. Recent decrease in carbon sink to Russian forests. Dokl. Biol. Sci. 2017, 476, 200–202. [Google Scholar] [CrossRef]
  24. Zhang, Z.; He, J.; Huang, M.; Zhou, W. Is Regulation Protection? Forest Logging Quota Impact on Forest Carbon Sinks in China. Sustainability 2023, 15, 13740. [Google Scholar] [CrossRef]
  25. Gong, R.F.; Zeng, W.Z. Comprehensive Performance Evaluation of Forestry Carbon Sequestration Projects–Taking Two CDM Forestry Carbon Sequestration Projects of Sichuan Province as Examples. IOP Conf. Ser. Earth Environ. Sci. 2019, 237, 022028. [Google Scholar] [CrossRef]
  26. Lin, B.; Ge, J. Carbon sinks and output of China’s forestry sector: An ecological economic development perspective. Sci. Total Environ. 2019, 655, 1169–1180. [Google Scholar] [CrossRef]
  27. Zhang, Y.; Yang, G.; Li, Z. Analysis of input-output efficiency of Beijing forestry based on DEA model. J. Beijing For. Univ. 2016, 38, 105–112. [Google Scholar]
  28. Zhang, W.; Zhu, Z.; Liu, X. Can green finance improve carbon emission efficiency? Environ. Sci. Pollut. Res. 2022, 29, 68976–68989. [Google Scholar] [CrossRef]
  29. Xu, Z. Research on the Impact of Digital Green Finance on Agricultural Green Total Factor Productivity: Evidence from China. Agriculture 2024, 14, 1151. [Google Scholar] [CrossRef]
  30. Liu, X.; Huang, J.; Zhou, H.; Sun, J.; Wang, Q.; Cheng, X. Dynamic Analysis of Provincial Forest Carbon Storage Efficiency in China Based on DEA Malmquist Index. Forests 2023, 14, 1629. [Google Scholar] [CrossRef]
  31. Zhao, S.; Shi, W.; Qiao, F.; Wang, C.; An, Y.; Zhang, L. Temporal and Spatial Changes and Trend Predictions of Forest Carbon Sequestration Efficiency in China Based on the Carbon Neutrality Goal. Forests 2023, 14, 2387. [Google Scholar] [CrossRef]
  32. Xia, C.; Wang, Z.; Xu, G.; Dong, X. Quantitative decomposition of China’s industrial energy consumption structure based on production-theoretical decomposition method. J. Clean. Prod. 2022, 379, 134467. [Google Scholar] [CrossRef]
  33. Zhang, X.; Zhang, R.; Feng, C.; Wang, Y.; Zhao, M.; Zhao, X. Decomposition analysis of renewable energy demand and coupling effect between renewable energy and energy demand: Evidence from China. Renew. Energy 2024, 237, 121839. [Google Scholar] [CrossRef]
  34. Ding, L.; Zhang, K.; Yang, Y. Carbon emission intensity and biased technical change in China’s different regions: A novel multidimensional decomposition approach. Environ. Sci. Pollut. Res. 2022, 29, 38083–38096. [Google Scholar] [CrossRef]
  35. Chen, L.D.Q. Decomposition analysis of factors driving CO2 emissions in Chinese provinces based on production-theoretical decomposition analysis. Nat. Hazards 2016, 84 (Suppl. S1), 267–277. [Google Scholar] [CrossRef]
  36. Liu, B.; Shi, J.; Wang, H.; Su, X.; Zhou, P. Driving factors of carbon emissions in China: A joint decomposition approach based on meta-frontier. Appl. Energy 2019, 256, 113986.1–113986.11. [Google Scholar] [CrossRef]
  37. Lin, B.; Du, K. What is the driving force of energy productivity growth in China: Decomposition based on distance function. J. Financ. Res. 2013, 9, 84–96. [Google Scholar]
  38. Wang, H.; Zhou, P.; Xie, B.C.; Zhang, N. Assessing drivers of CO2 emissions in China’s electricity sector: A meta frontier production-theoretical decomposition analysis. Eur. J. Oper. Res. 2019, 275, 1096–1107. [Google Scholar] [CrossRef]
  39. Liu, X.; Zhou, D.; Zhou, P.; Wang, Q. What drives CO2 emissions from China’s civil aviation? An exploration using a new generalized PDA method. Transport. Res. Pol. Pract. 2017, 99, 30–45. [Google Scholar] [CrossRef]
  40. Li, J.; Meng, G.; Li, C.; Du, K. Tracking carbon intensity changes between China and Japan: Based on the decomposition technique. J. Clean. Prod. 2022, 349, 131090. [Google Scholar] [CrossRef]
  41. Wang, H.; Li, R.; Zhang, N.; Zhou, P.; Wang, Q. Assessing the role of technology in global manufacturing energy intensity change: A production-theoretical decomposition analysis. Technol. Forecast. Soc. Change 2020, 160, 120245. [Google Scholar] [CrossRef]
  42. Liu, X.; Chen, H.; Peng, C.; Li, M. Assessing the Drivers of Carbon Intensity Change in China: A Dynamic Spatial–Temporal Production-Theoretical Decomposition Analysis Approach. Sustainability 2022, 14, 12359. [Google Scholar] [CrossRef]
  43. Chen, H.; Qi, S.; Tan, X. Decomposition and prediction of China’s carbon emission intensity towards carbon neutrality: From perspectives of national, regional and sectoral level. Sci. Total Environ. 2022, 825, 153839. [Google Scholar] [CrossRef] [PubMed]
  44. Liu, B.; Meng, L.; Nie, B.; Shi, J.; Li, Y. Regional disparities and drivers of carbon emissions in China: A temporal-spatial production-theoretical decomposition analysis. Sci. Prog. 2023, 106, 368504231163145. [Google Scholar] [CrossRef]
  45. Wang, Y.; Huang, H. Decoupling effect, spatial-temporal characteristics and driving factors of carbon emissions in China. Acta Ecol. Sin. 2024, 44, 2228–2243. [Google Scholar]
  46. Bai, J.; Jiang, F. Research on regional innovation efficiency considering environmental factors: Based on three-stage DEA method. Financ. Trade Econ. 2011, 10, 104–112+136. [Google Scholar]
  47. Kaya, Y. Impact of Carbon Dioxide Emission Control on GNP Growth: Interpretation of Proposed Scenarios; IPCC Energy and Industry Subgroup, Response Strategies Working Group: Geneva, Switzerland, 1990. [Google Scholar]
  48. Lesiv, L.F.S. A spatial assessment of the forest carbon budget for Ukraine. Mitig. Adapt. Strateg. Glob. Change 2019, 24, 985–1006. [Google Scholar] [CrossRef]
  49. Huang, Y.; Wang, J.; Yu, H. Evaluation of forest carbon sink value in collective forest area: Based on evidence reasoning method. For. Econ. Issues 2024, 44, 32–41. [Google Scholar]
Figure 1. Forest carbon sinks in China’s three major regions and their share, during the period 2010–2021.
Forests 16 00104 g001
Figure 2. Incremental forest carbon sinks in China and the three major regions, during the period 2010–2021.
Forests 16 00104 g002
Figure 3. Shift in the center of gravity of incremental forest carbon sinks in China, during the period 2010–2021.
Forests 16 00104 g003
Figure 4. Decomposition results of the rate of change and drivers of China’s forest carbon sinks, during the period 2010–2021.
Forests 16 00104 g004
Figure 5. Decomposition results of the rate of change and drivers of forest carbon sinks in the three major regions of China, during the period 2010–2021.
Forests 16 00104 g005
Figure 6. Dominant drivers affecting the rate of change of forest carbon sinks by province in China, during the period 2010–2021.
Forests 16 00104 g006
Figure 7. Dominant drivers affecting the rate of change of forest carbon sinks by province in China, during the period 2010–2015.
Forests 16 00104 g007
Figure 8. Dominant drivers affecting the rate of change of forest carbon sinks by province in China, during the period 2016–2021.
Forests 16 00104 g008
Figure 9. Dominant drivers of the rate of change of forest carbon sinks in three major regions of China, during the period 2010–2021.
Forests 16 00104 g009
Figure 10. Dominant drivers of the rate of change of forest carbon sinks in three major regions of China, during the period 2010–2015.
Forests 16 00104 g010
Figure 11. Dominant drivers of the rate of change of forest carbon sinks in China’s three major regions, during the period 2016–2021.
Forests 16 00104 g011
Table 1. Main summary of selected literature.
Author(s) (Year)Main ConclusionMethodology
Hubau et al. [18]Carbon loss caused by tree death is the cause of divergent responses of carbon sinks in tropical forests.Multi-parameter models
Song et al. [20]Economic growth has a positive impact on forest carbon sink.Empirical test
Zhu et al. [22]Cross sectoral climate policies have a positive impact on forest carbon sinks.Empirical test
Zhang et al. [27]From 1993 to 2013, Beijing’s forestry input–output comprehensive efficiency was high, and the input–output status was good, the efficiency was generally stable, and the fluctuation was small.DEA
Lingui et al. [9]Digital green finance contributes to the improvement of agricultural green total factor productivity.SBM
Duan and Chen [35]Changes in scale effect and change in inputs were the main factors driving CO2 emissions growth.PDA
Lili et al. [40]Output biased technical change and the magnitude of technical change are the critical factors in China’s carbon emission intensity.PDA and IDA
Xiaolei et al. [42]Energy intensity was the dominant driver to reduce carbon intensity, and technological changes also played a great role in decreasing carbon intensity. Conversely, carbon emissions efficiency had negative effects on reducing carbon intensity.DST-PDA
Bingquan et al. [36]Carbon emission efficiency and potential carbon factor were the two important factors related to increase carbon emissions.PDA and IDA
Disclaimer/Publisher’s Note: The statements, opinions and data contained in all publications are solely those of the individual author(s) and contributor(s) and not of MDPI and/or the editor(s). MDPI and/or the editor(s) disclaim responsibility for any injury to people or property resulting from any ideas, methods, instructions or products referred to in the content.

