
Detection Model and Spectral Disease Indices for Poplar (Populus L.) Anthracnose Based on Hyperspectral Reflectance


Abstract
1. Introduction
2. Materials and Methods
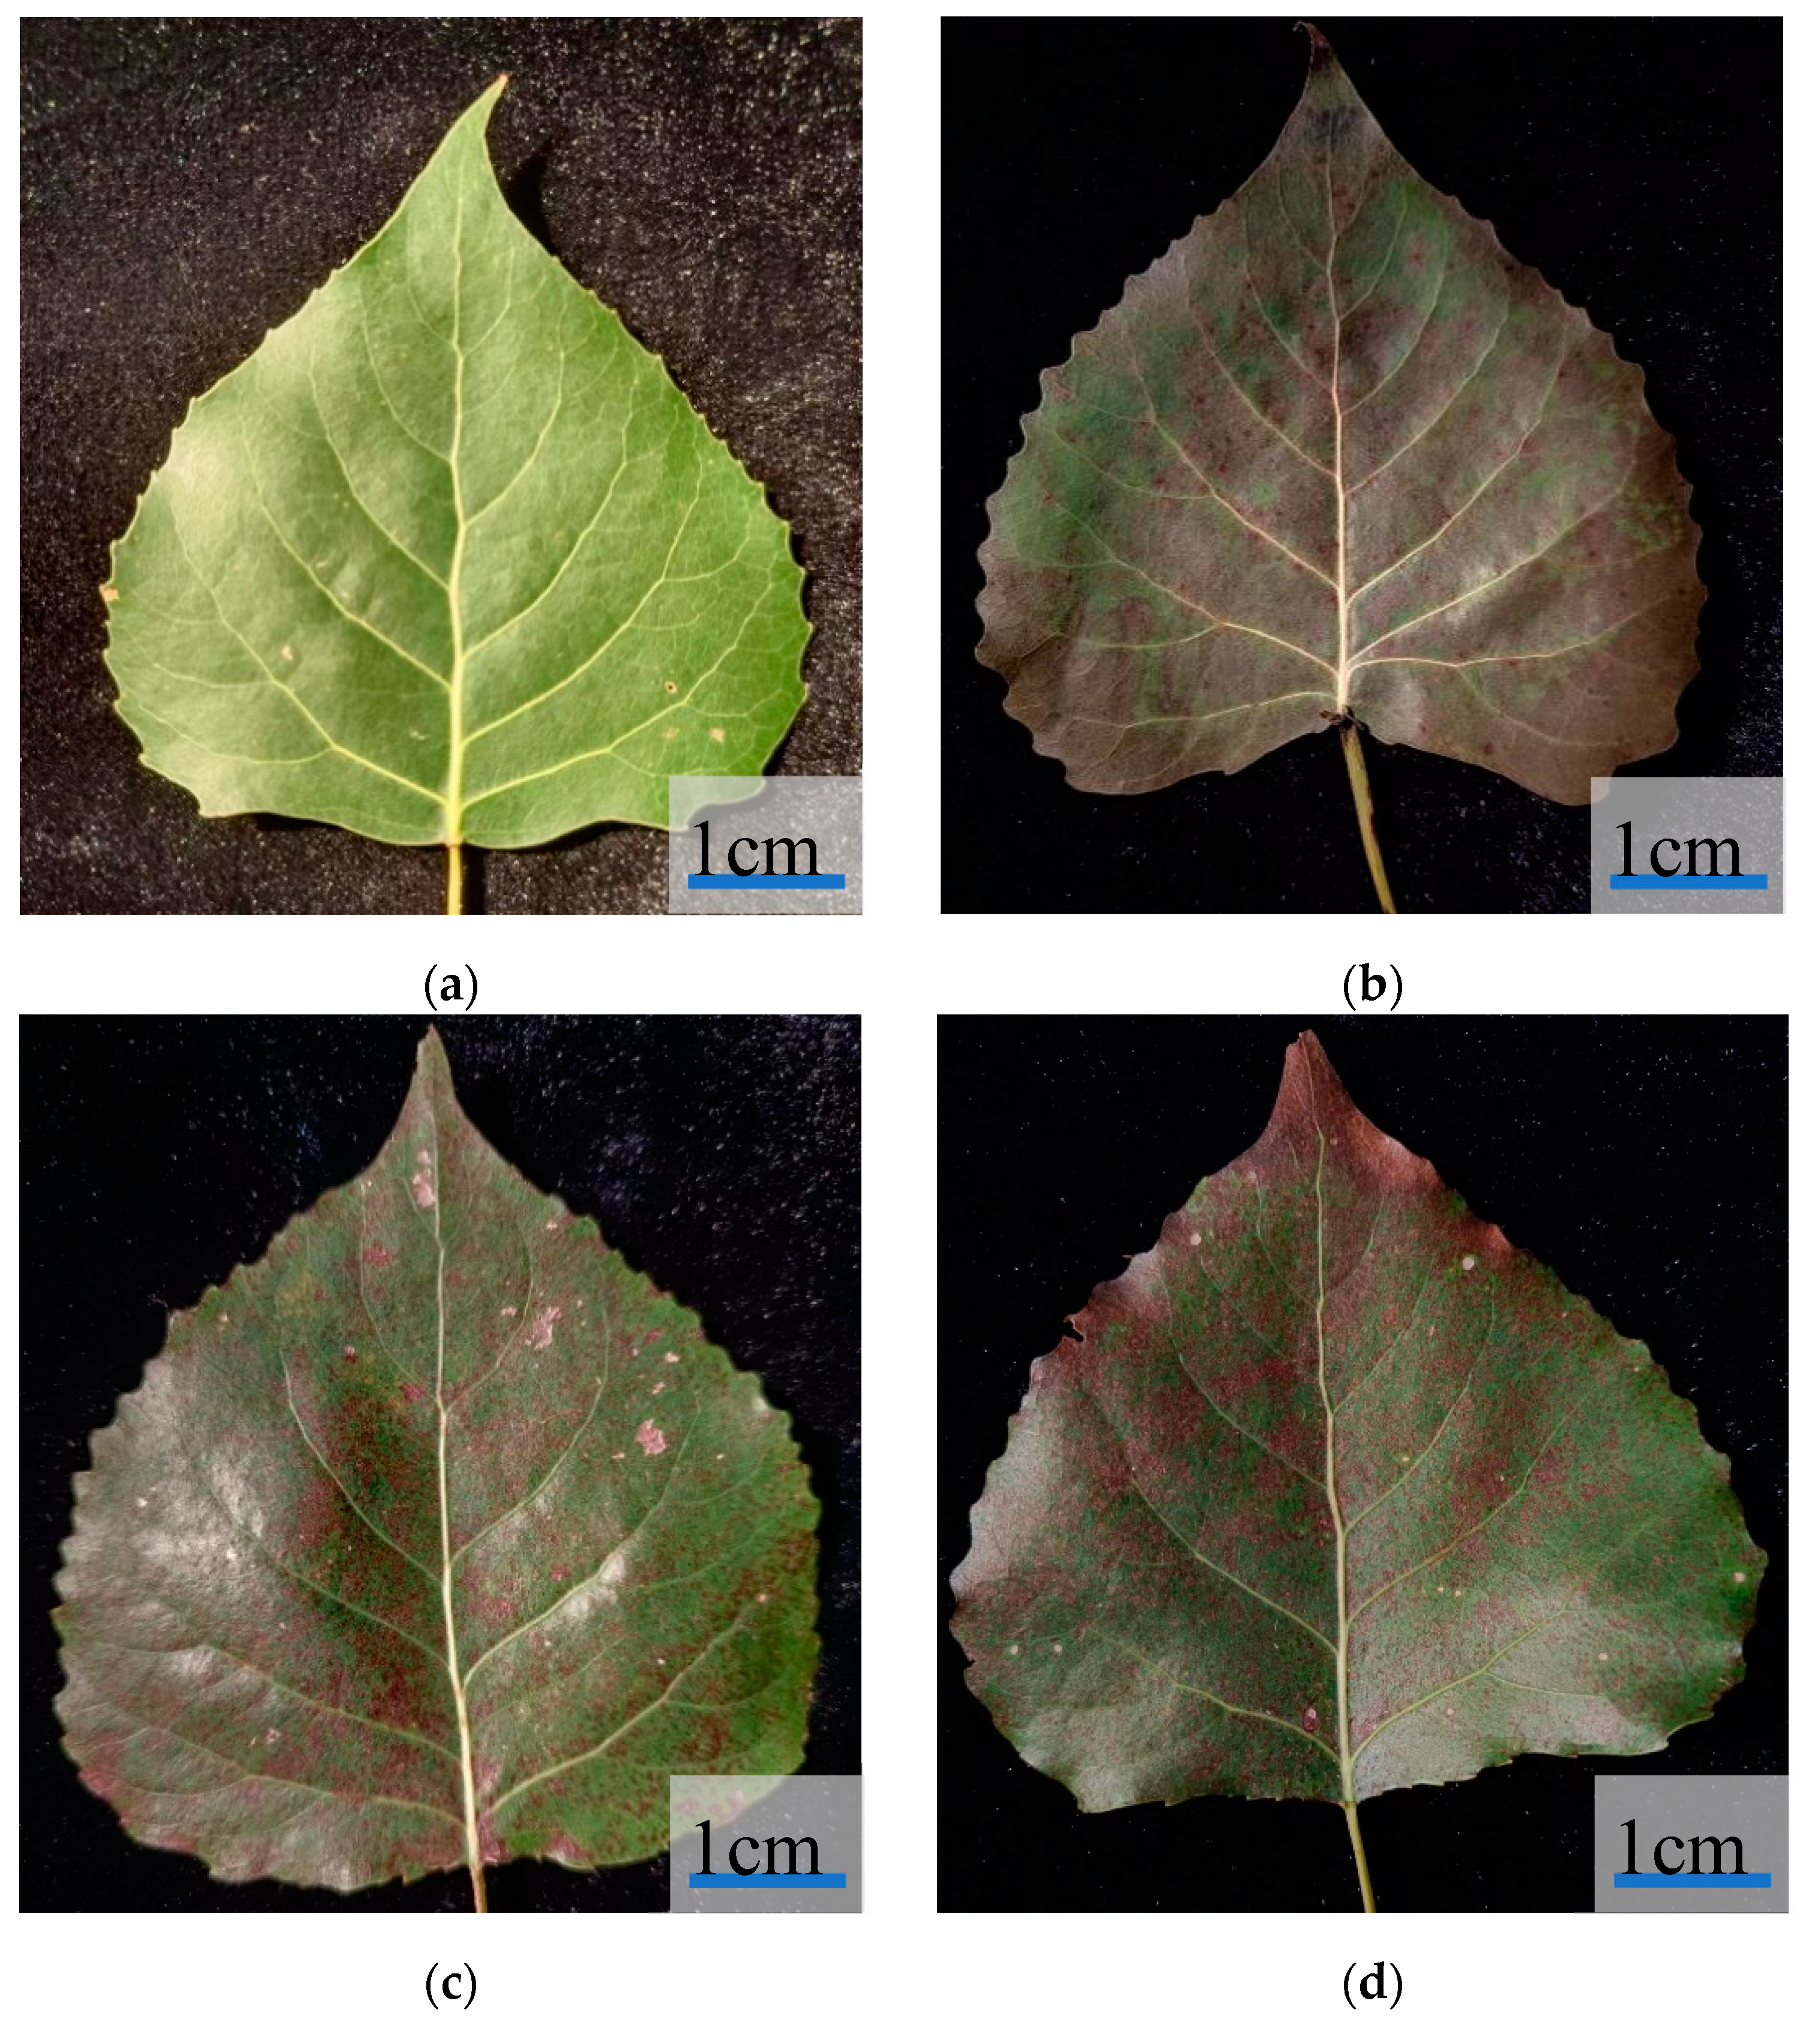
2.1. Study Area and Plant Material
2.2. Data Acquisition
2.3. Data Analysis
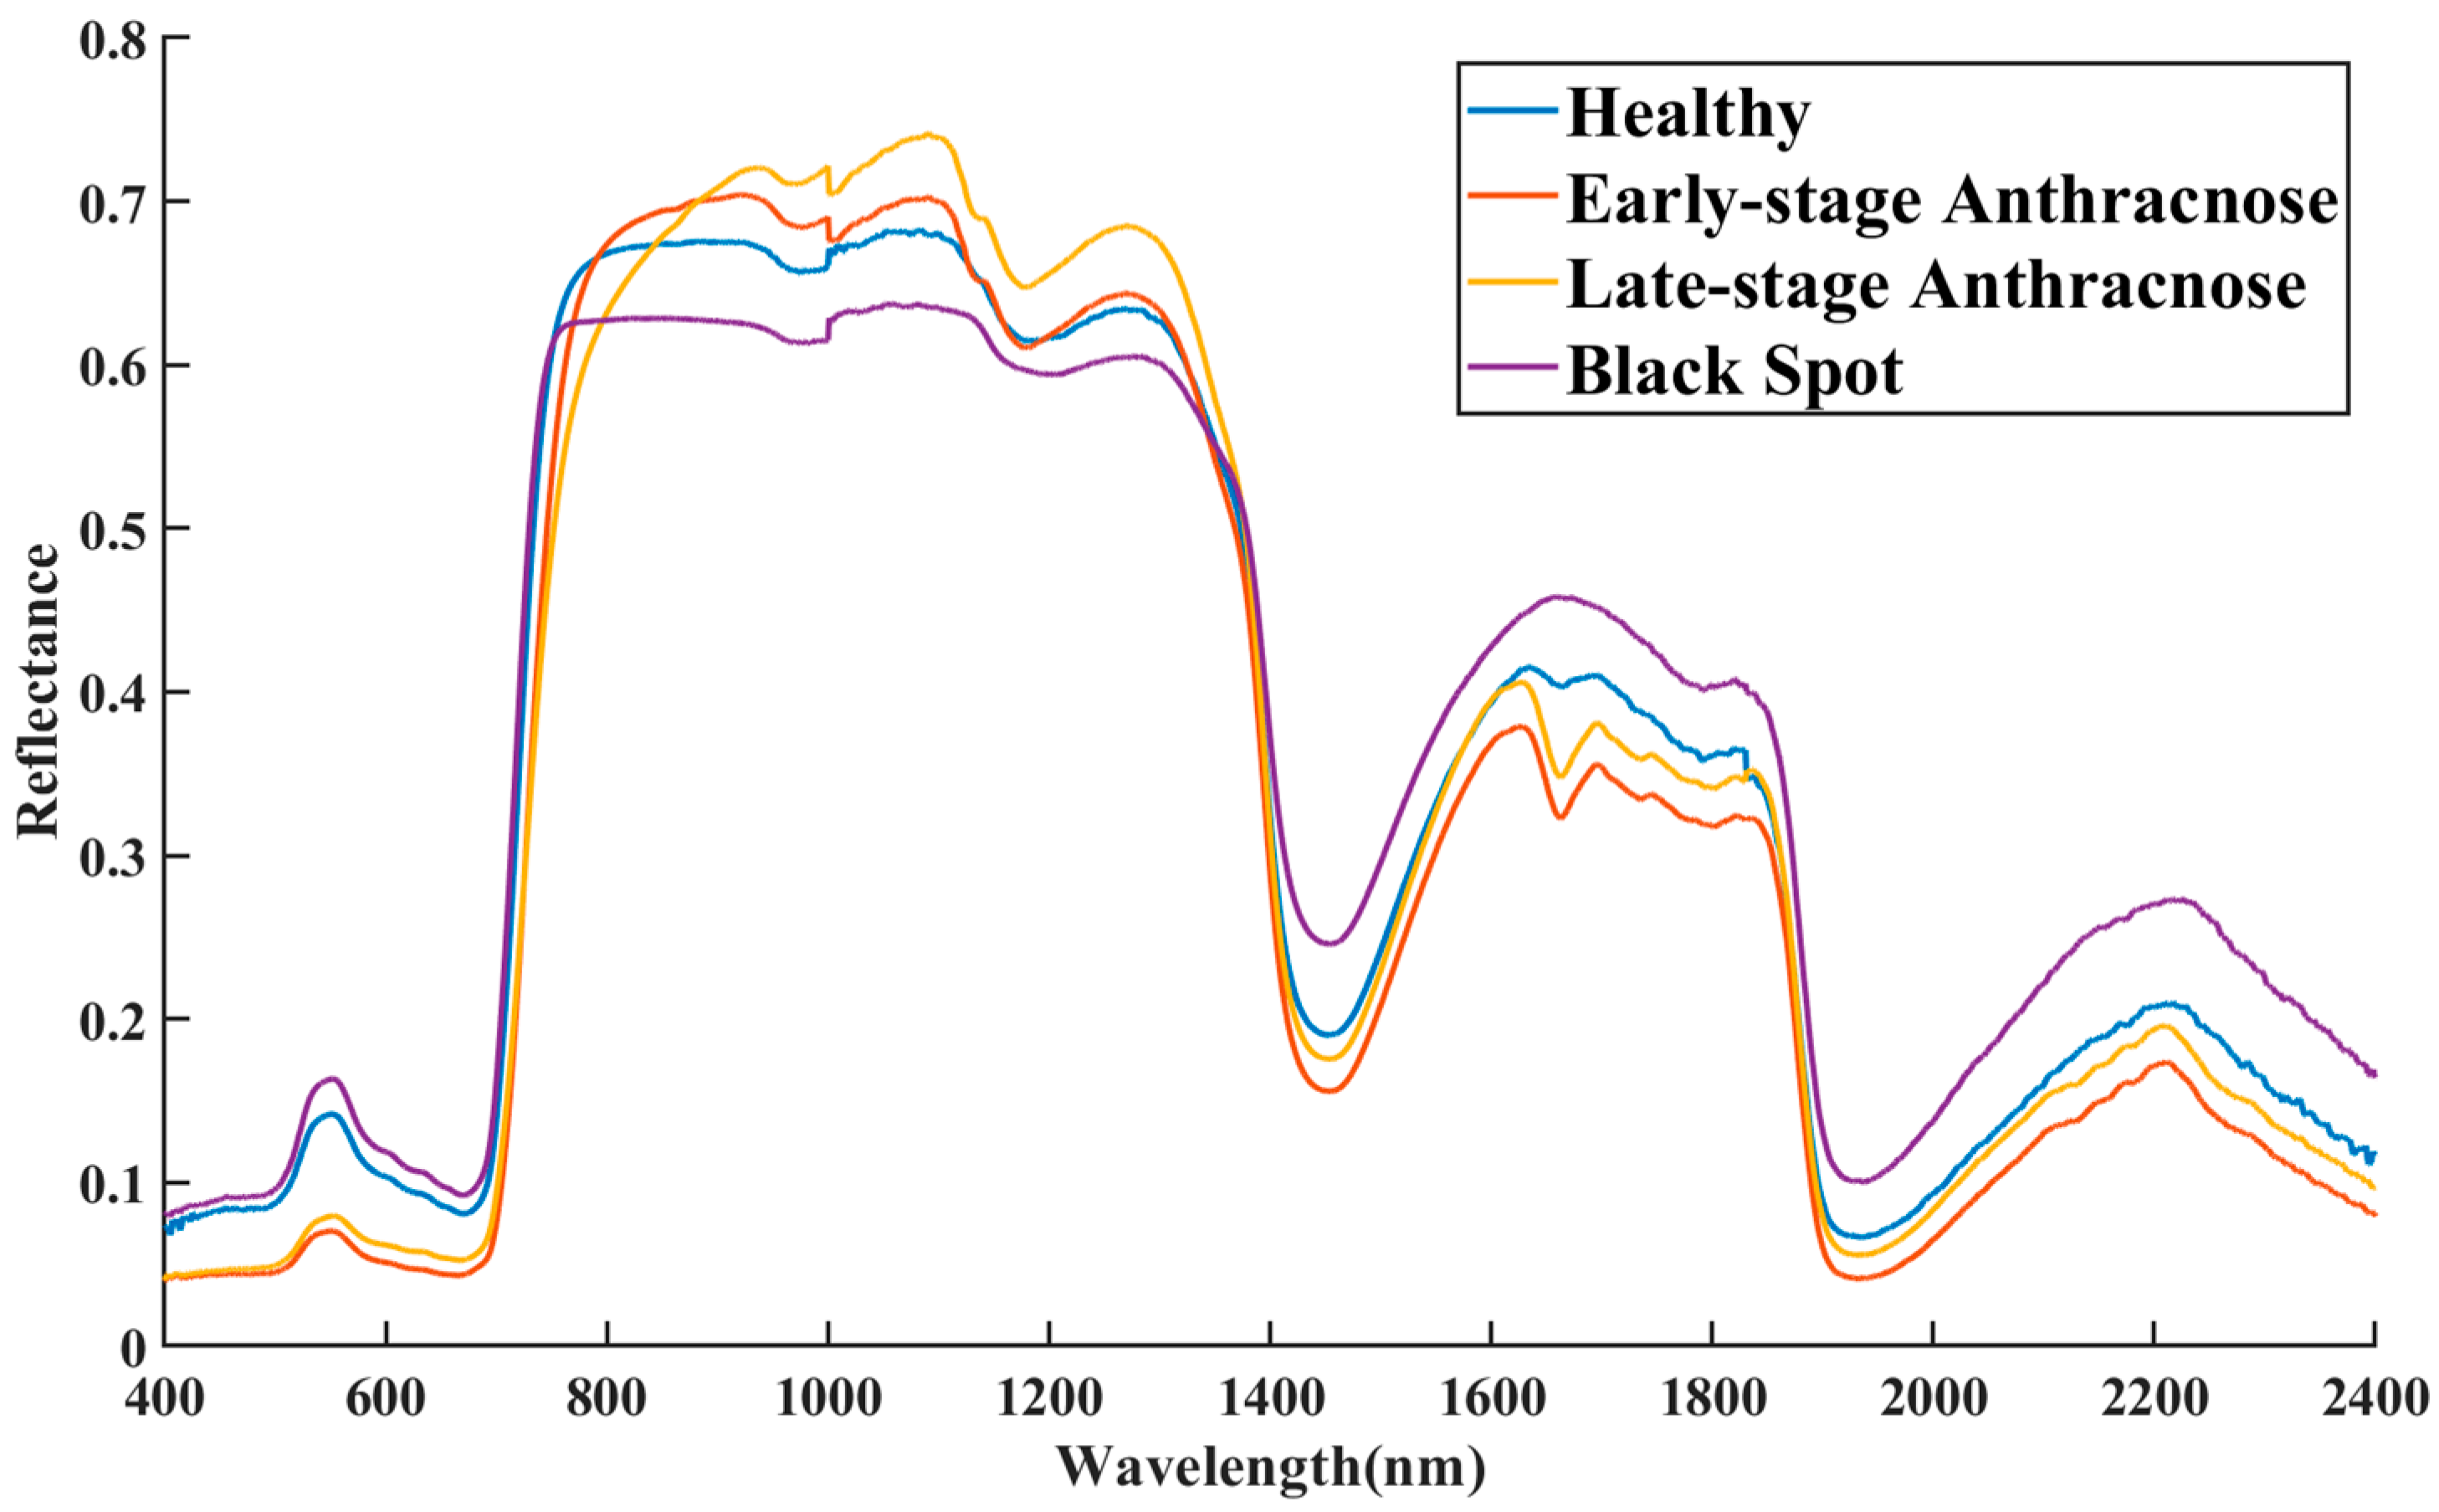
2.3.1. Reflection Curve Analysis
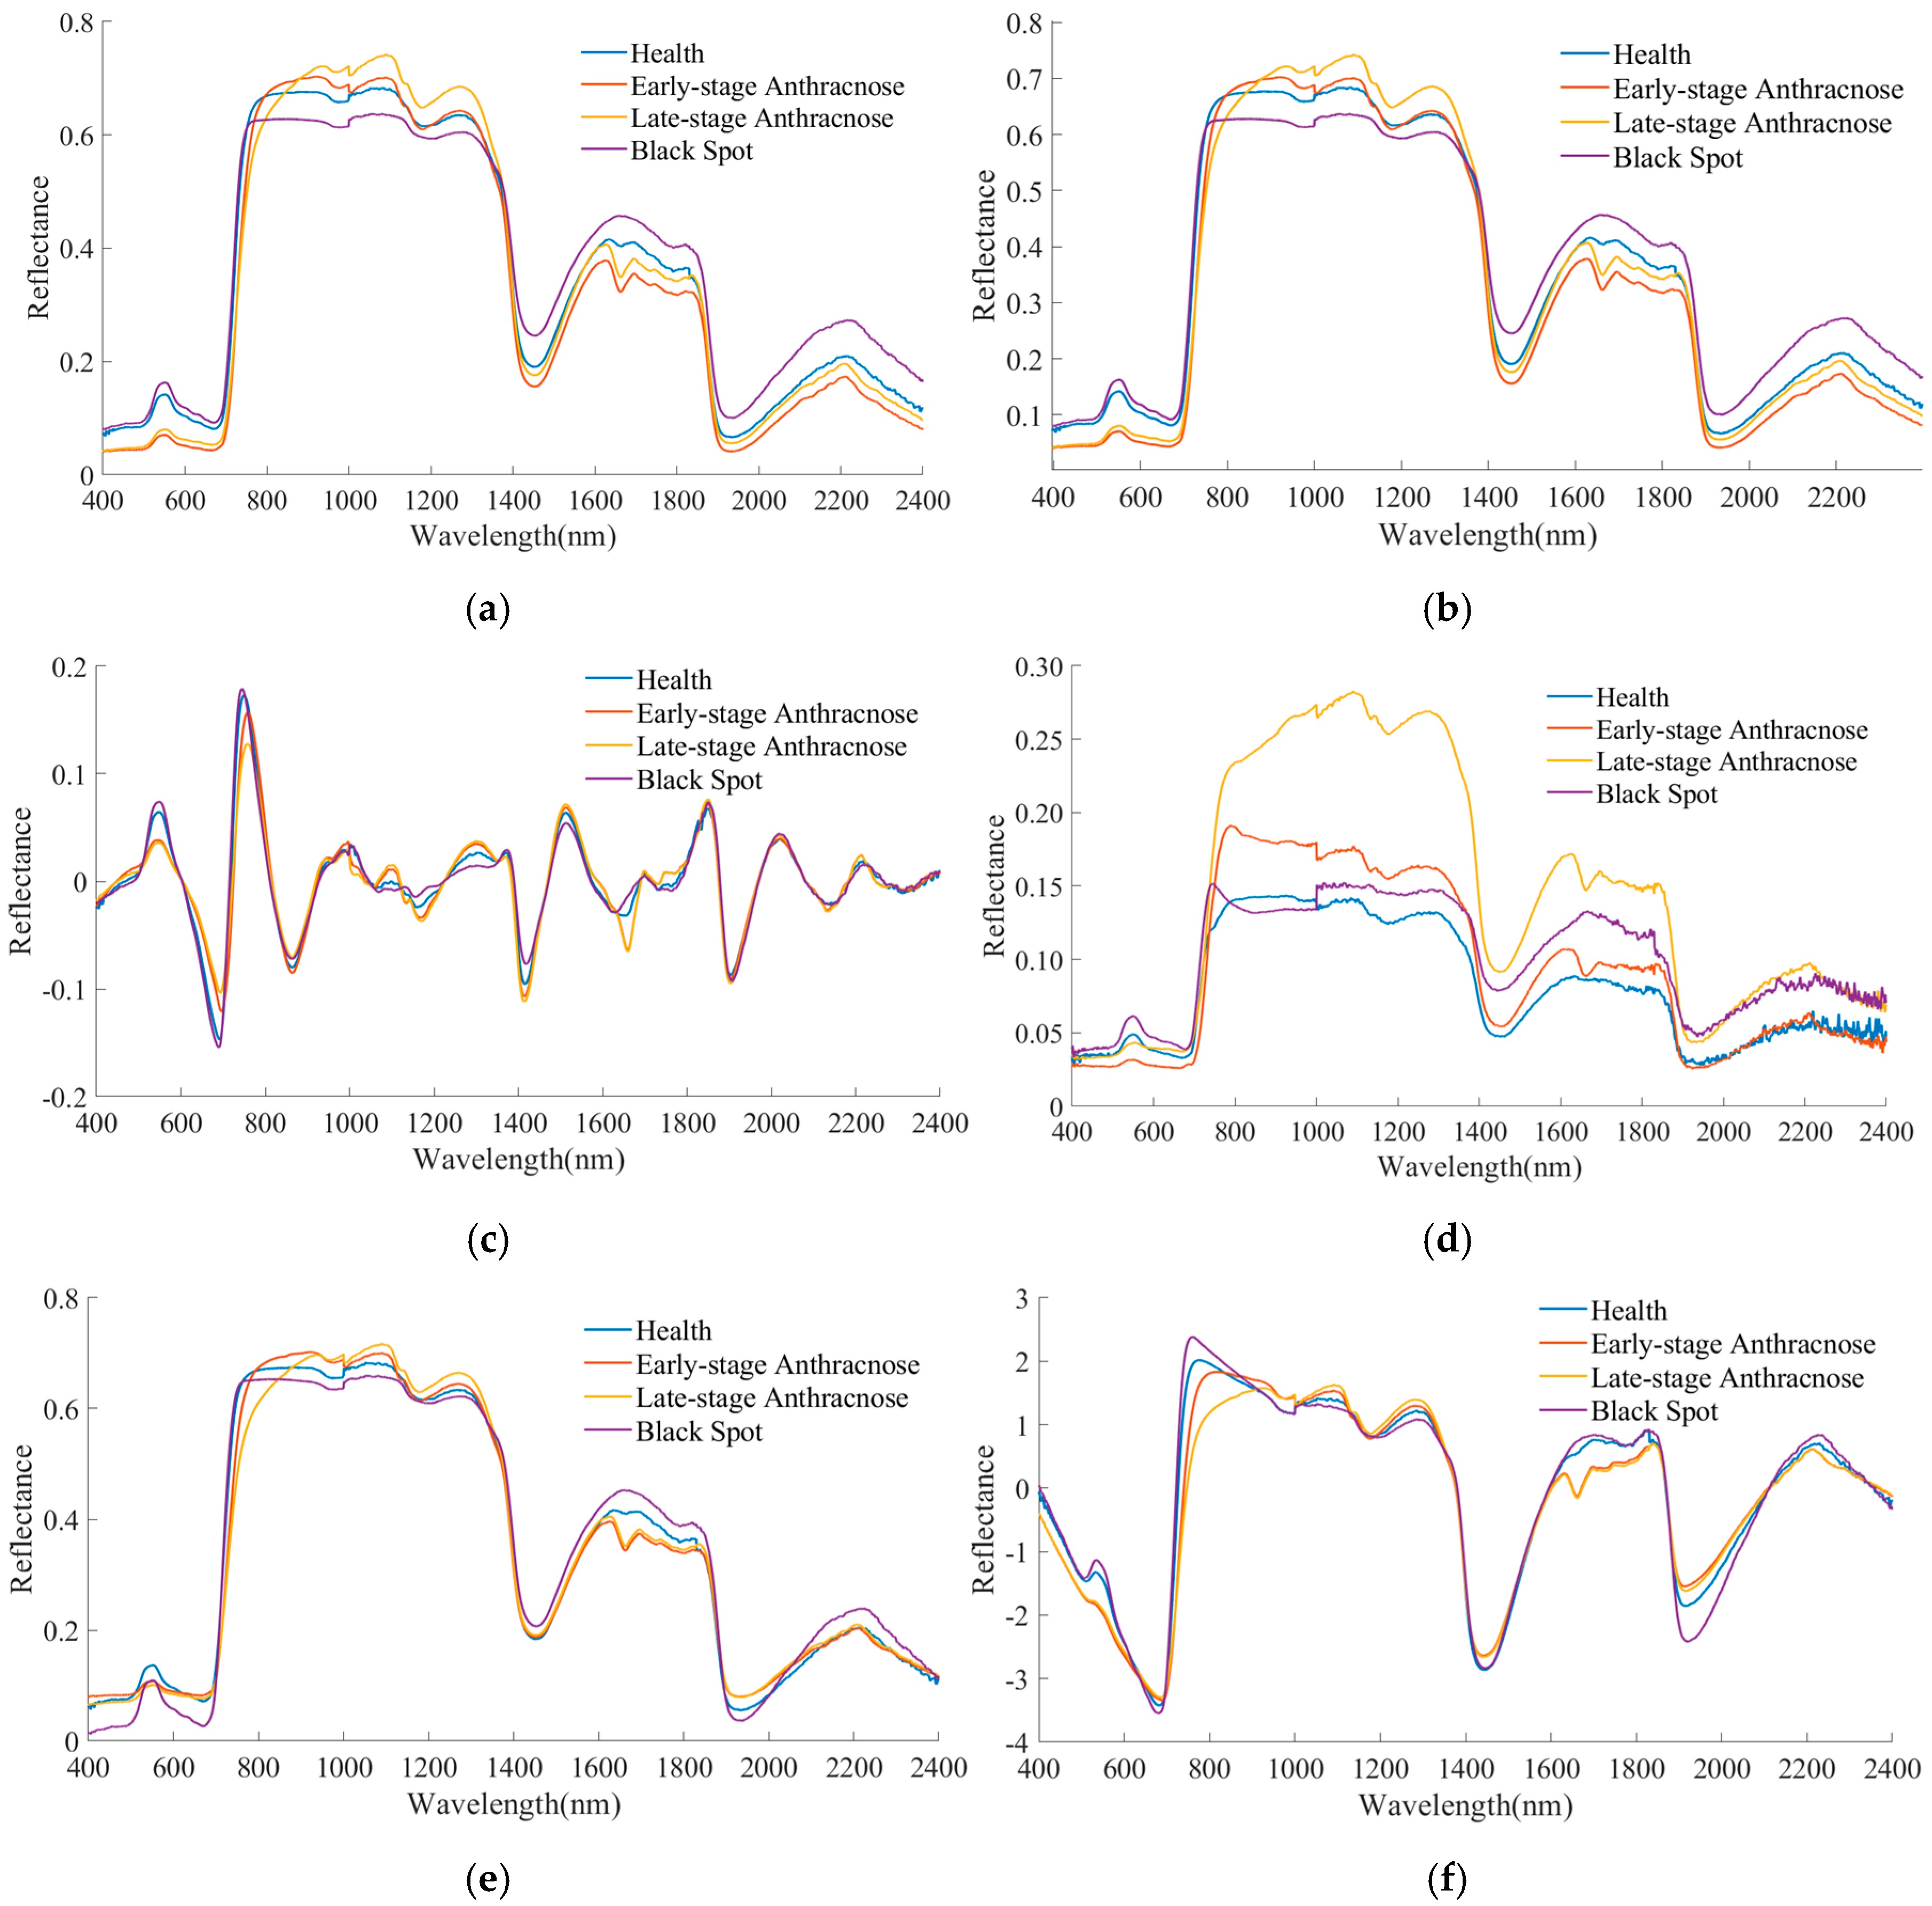
2.3.2. Preprocessing
- (1)
- Smoothing
- (2)
- Baseline correction
- (3)
- Scatter correction
- (4)
- Scaling
- (5)
- Optimal preprocessing combination (OPC)
2.3.3. Feature Extraction
- (1)
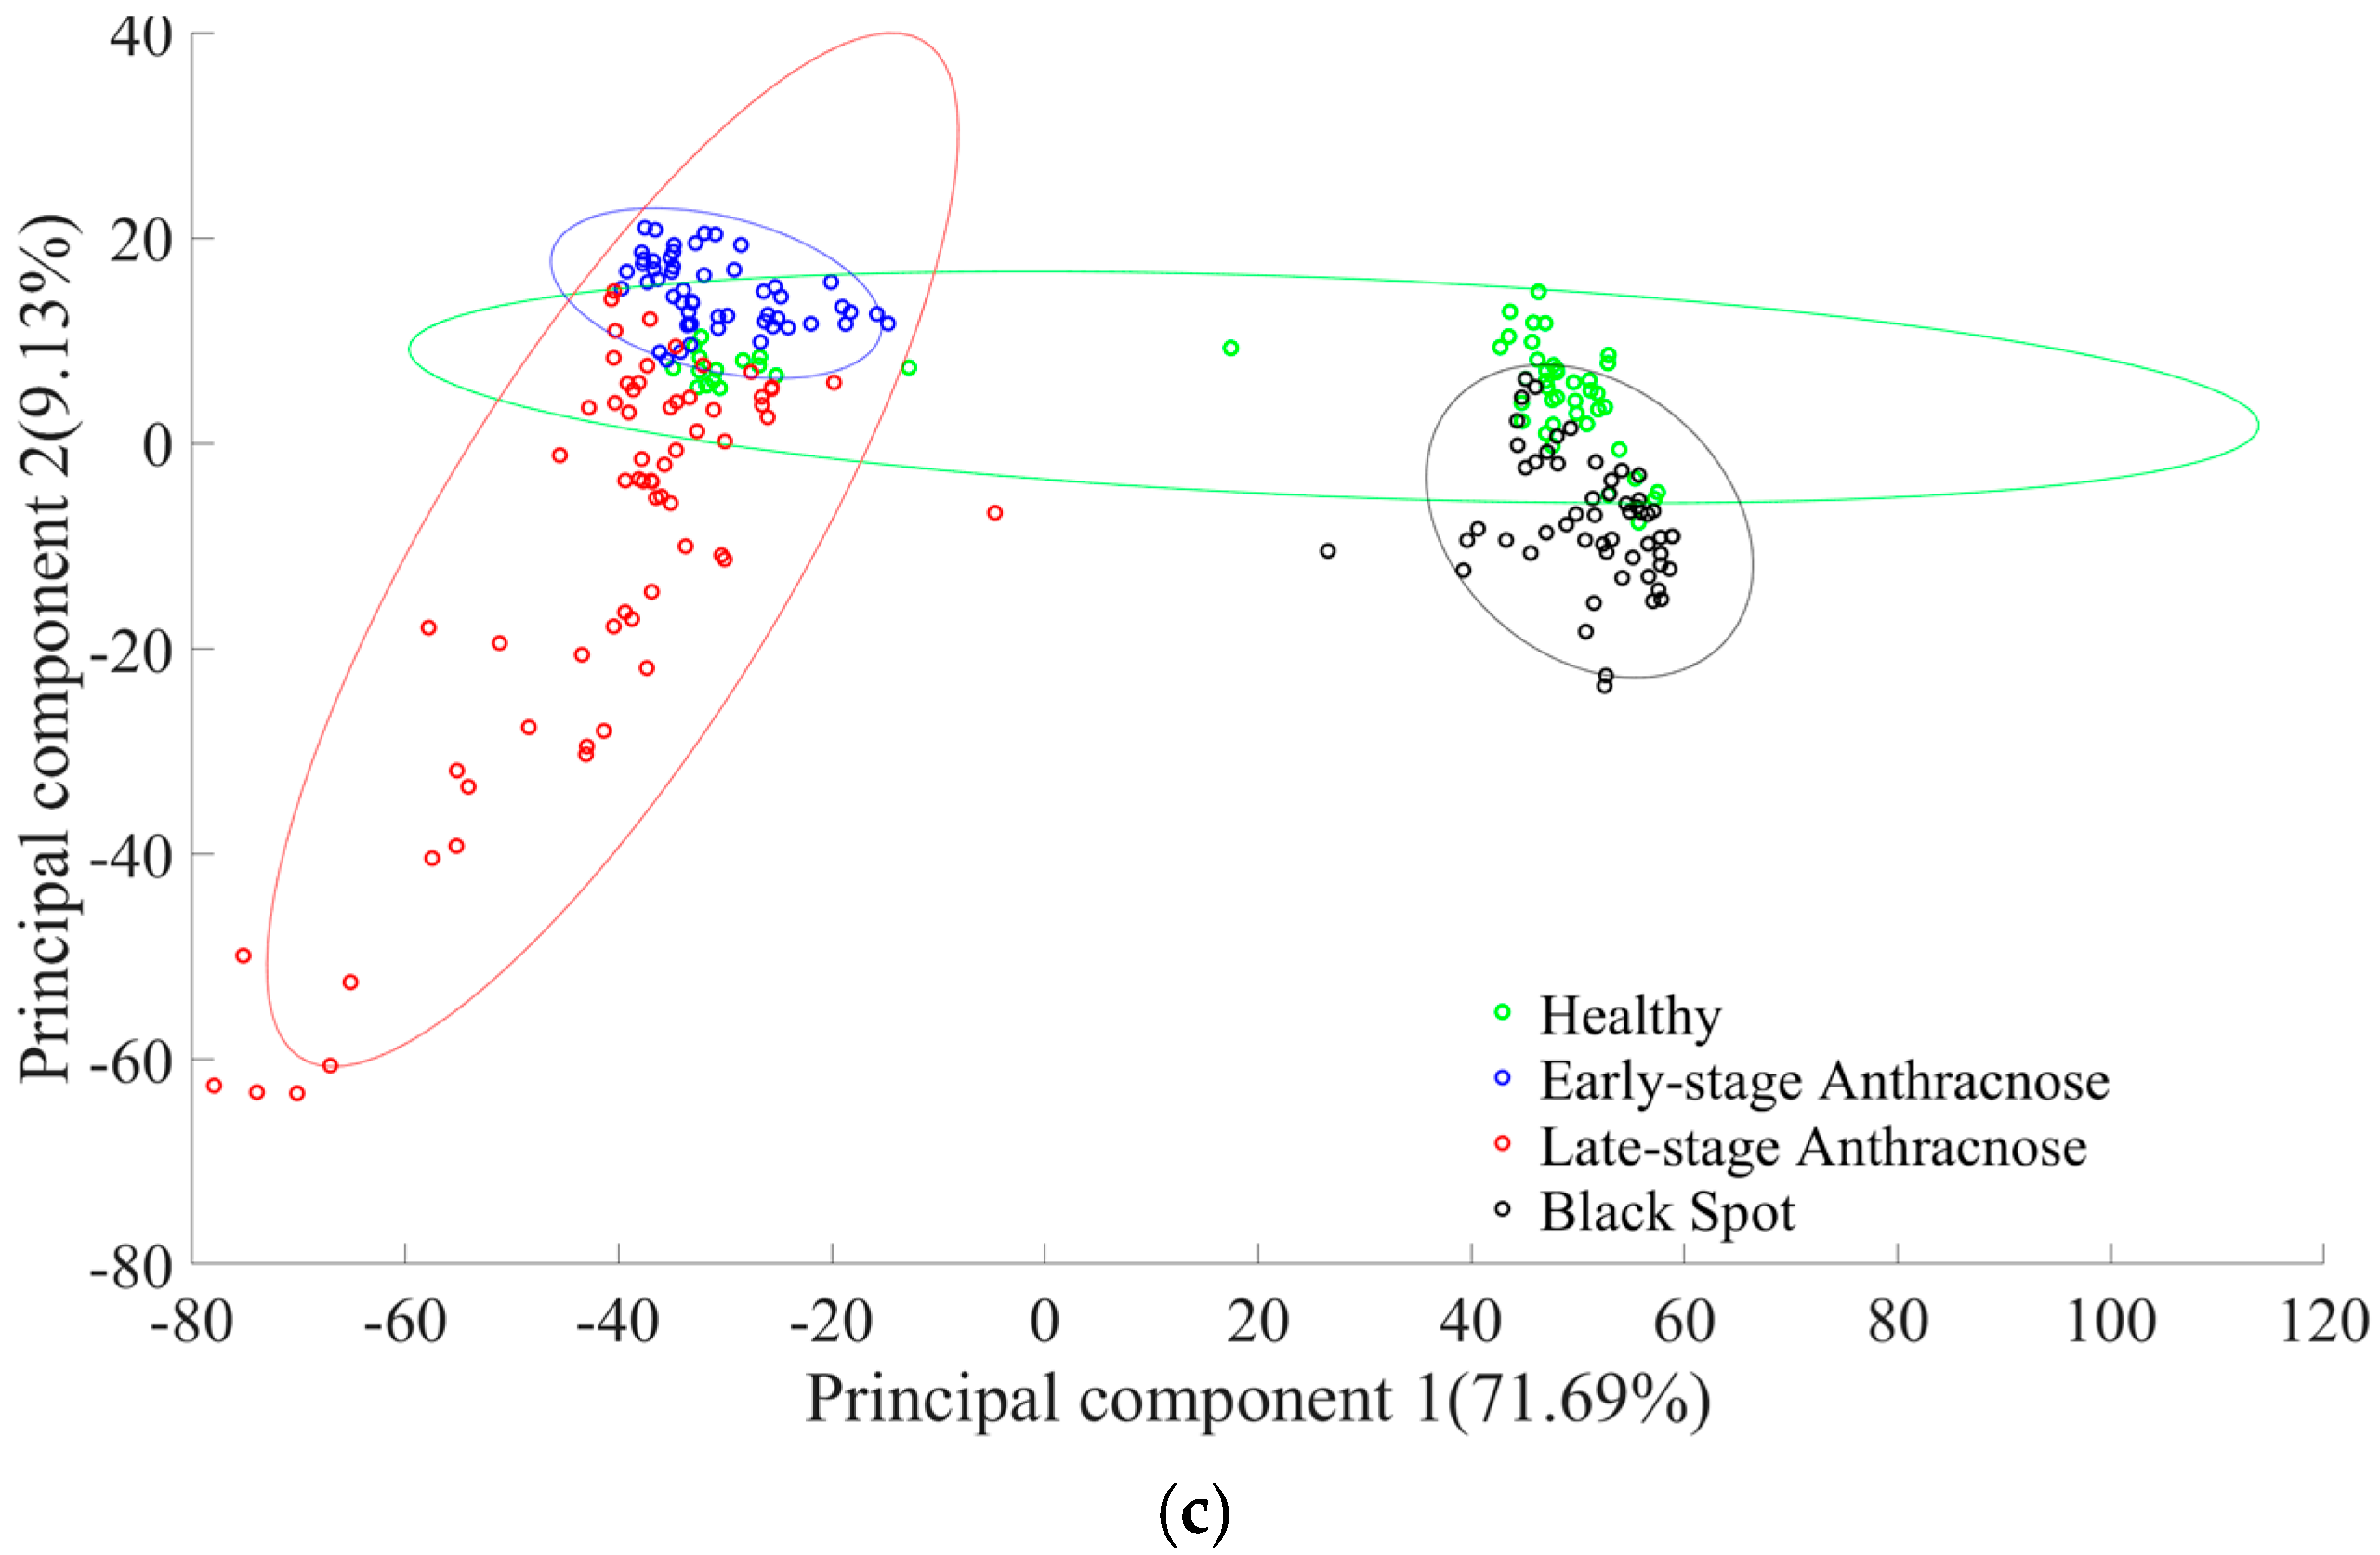
- Principal component analysis (PCA) reduces the dimensionality of datasets by identifying the principal components and the directions in which the data changes the most in the original feature space. Only the principal components contributing to a cumulative rate of more than 95% are retained to construct a new feature dataset.
- (2)
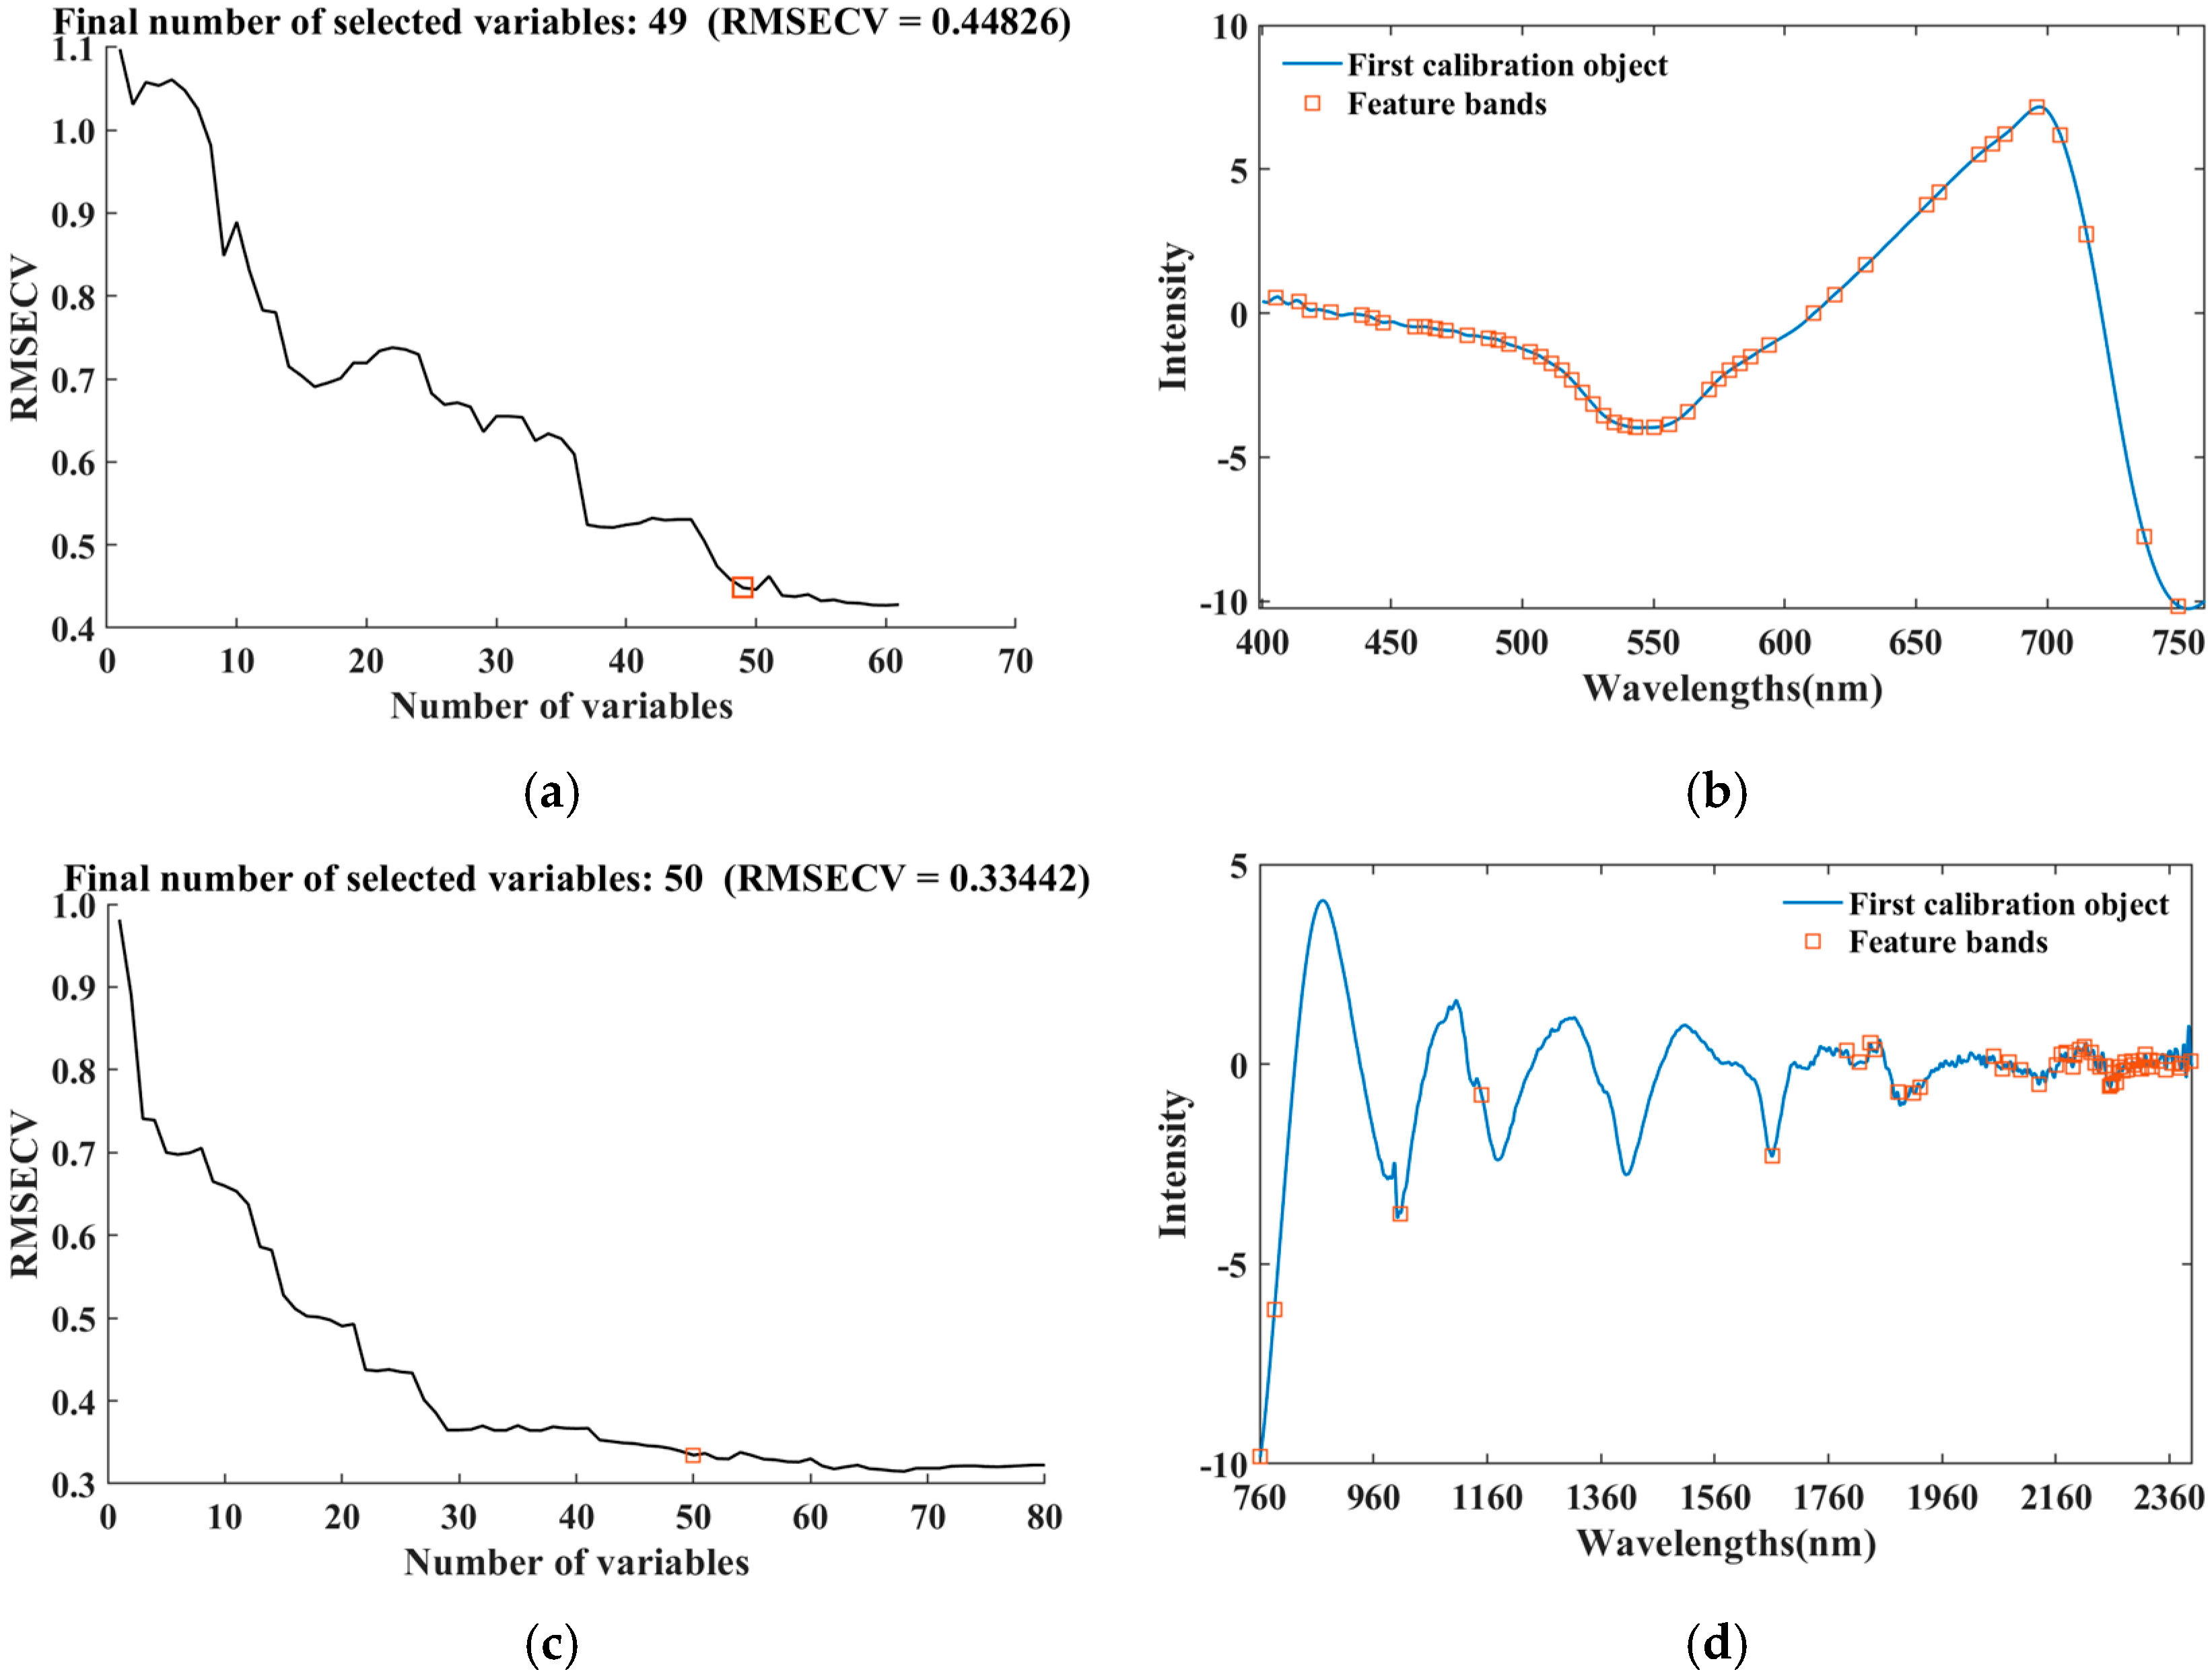
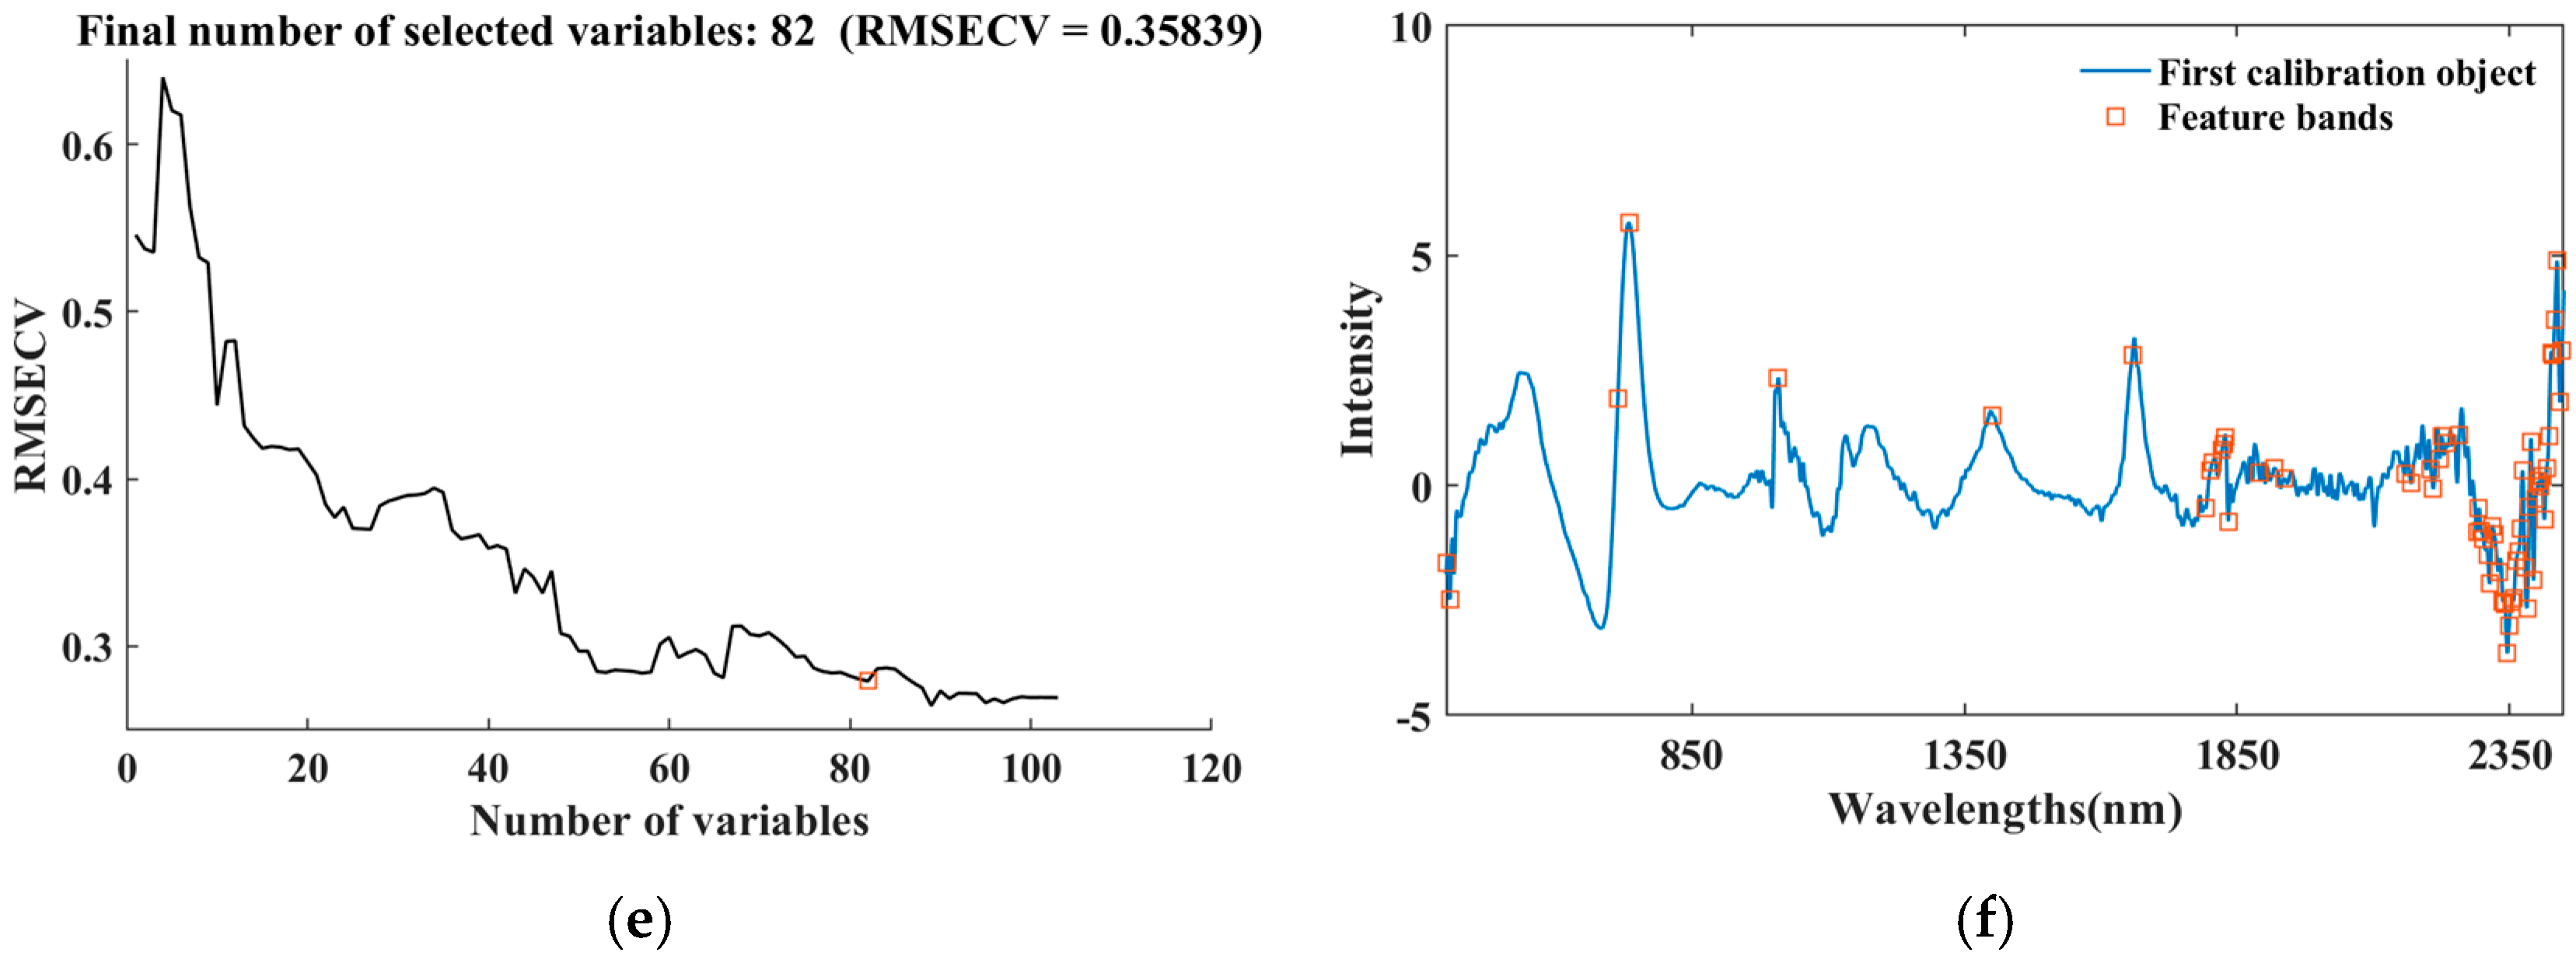
- The essence of the successive projection algorithm (SPA) is to perform forward feature selection for multiple features to reduce the collinearity in the vector space [60]. After a limited number of iterations of the SPA, the set of feature bands with the lowest RMSE is selected.
- (3)
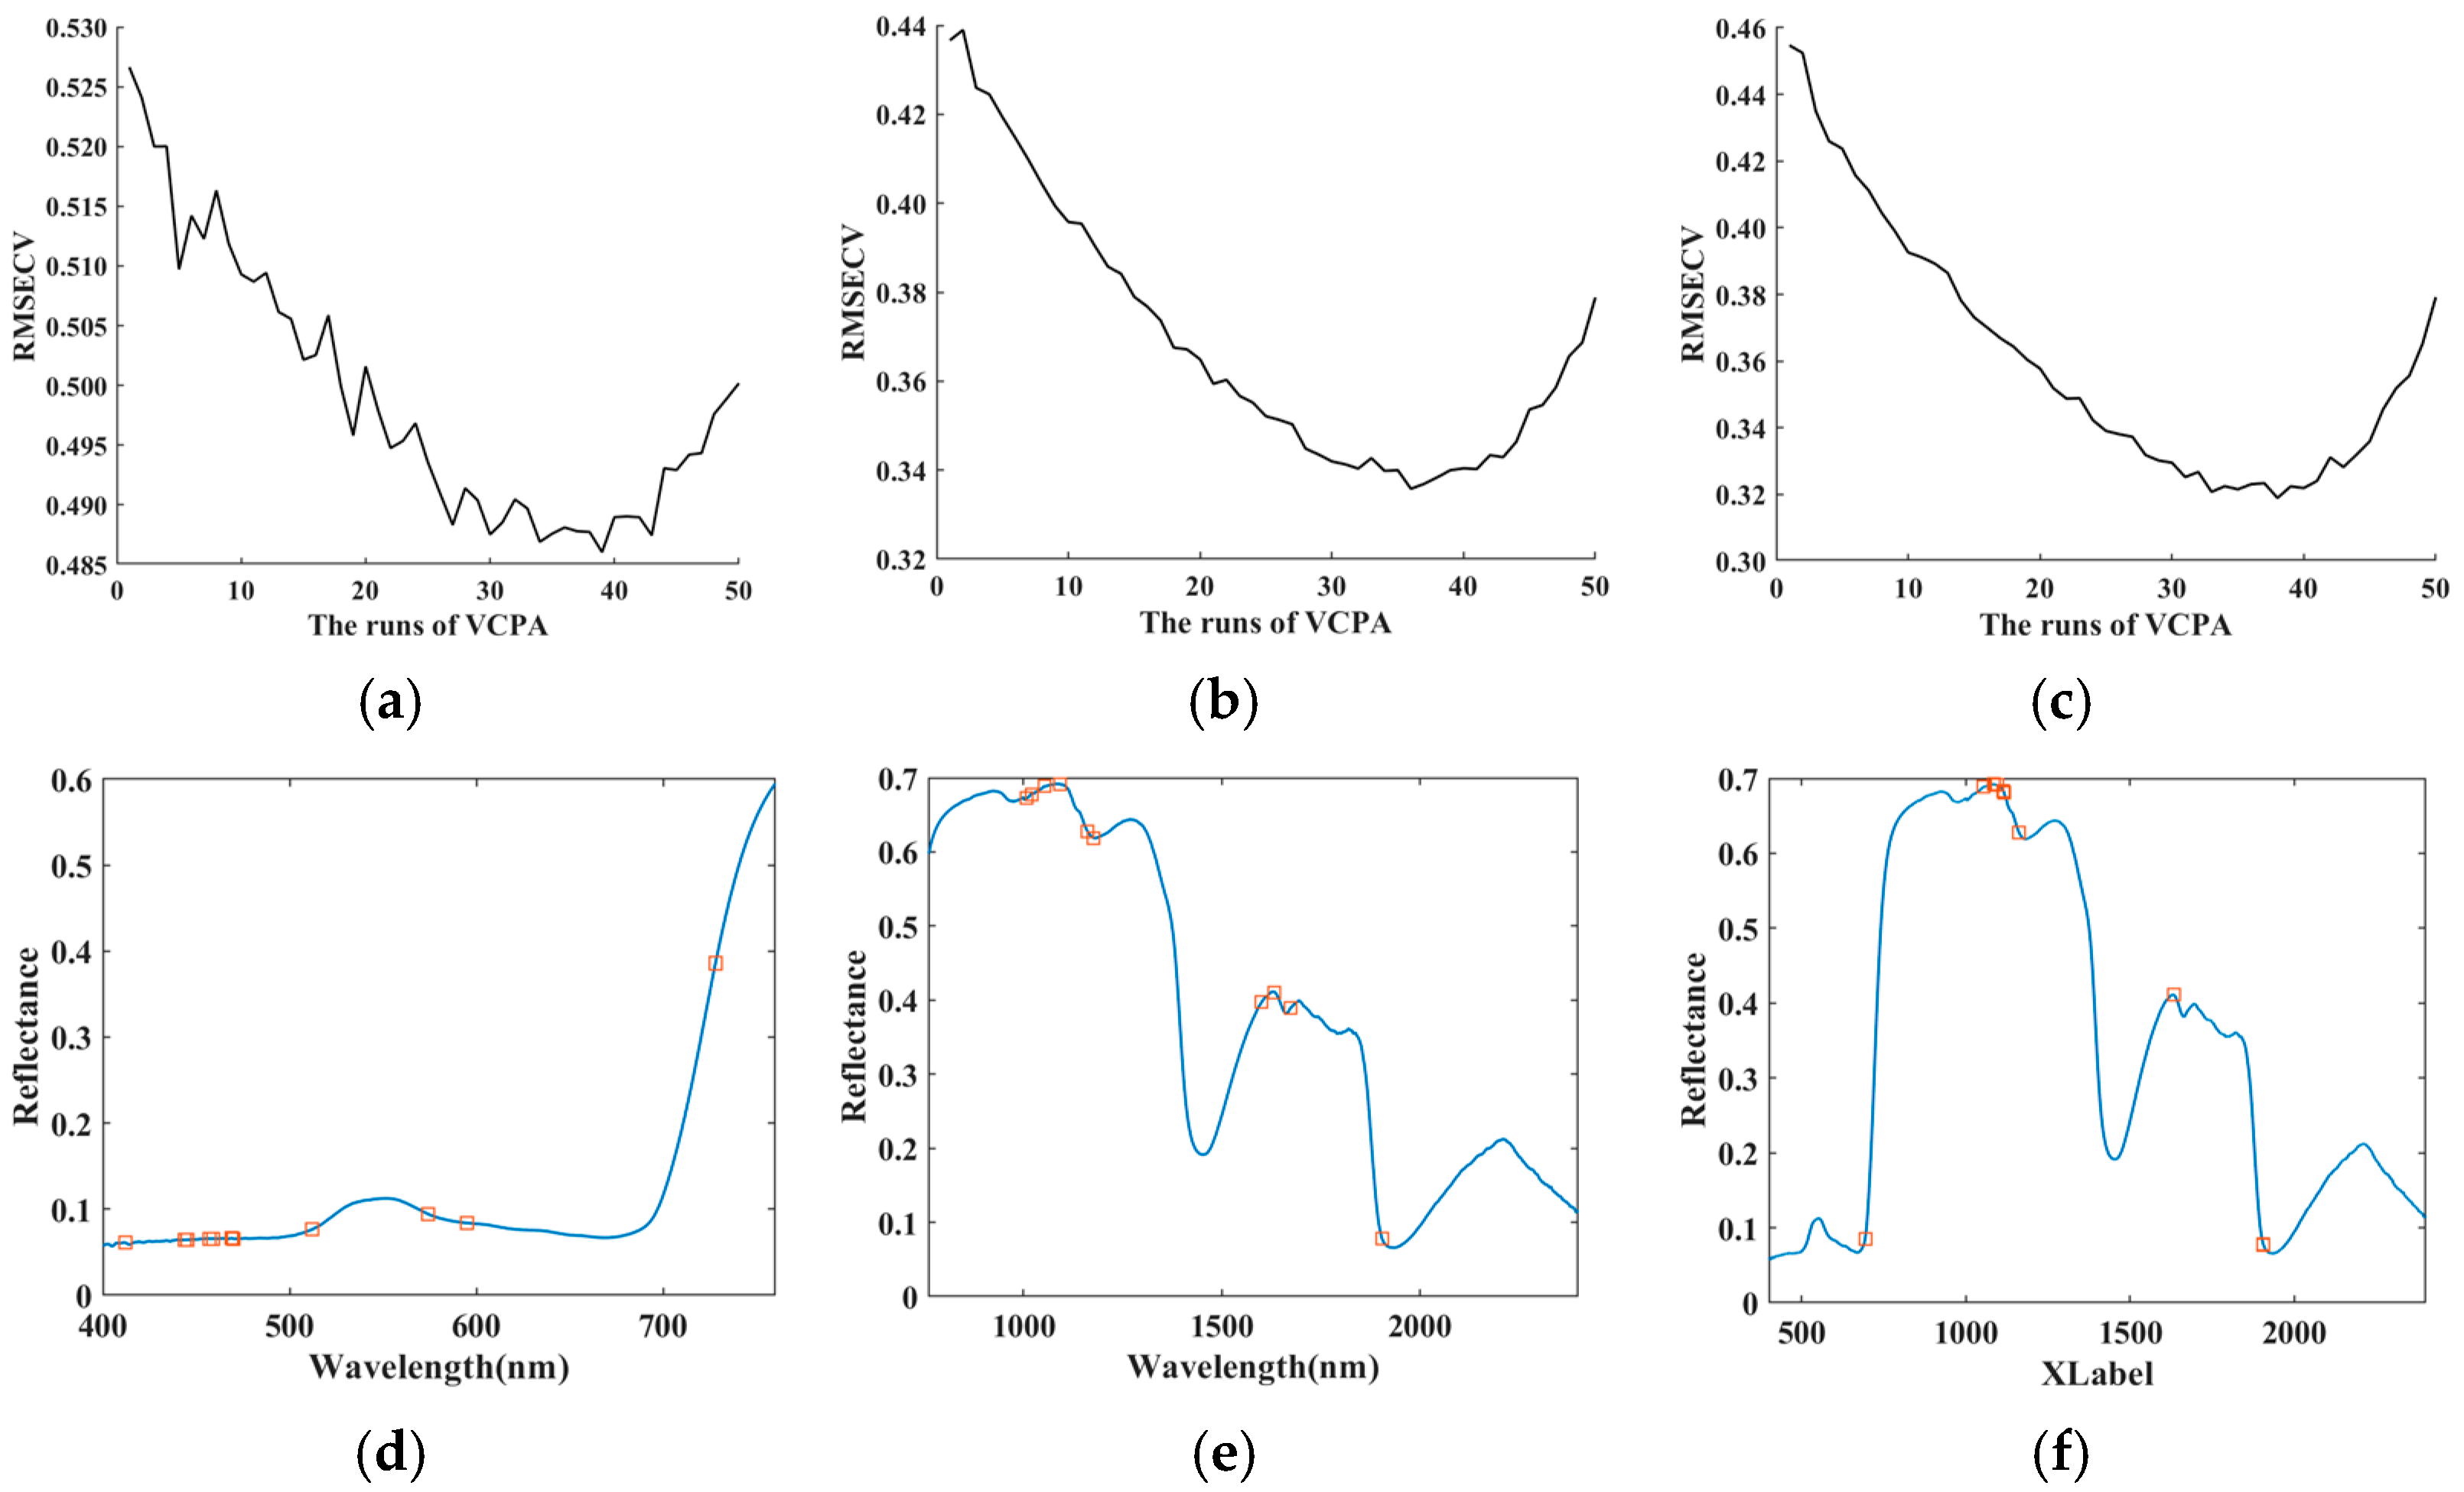
- Variable combination population analysis (VCPA) uses the exponential decreasing function (EDF) to determine the space of the feature subset. At the same time, binary matrix sampling (BMS) analyzes the interactions between features in the randomly combined subset to select important features. Finally, the optimal subset with the lowest RMSECV value is obtained via model population analysis (MPA) and PLS regression [61].
- (4)
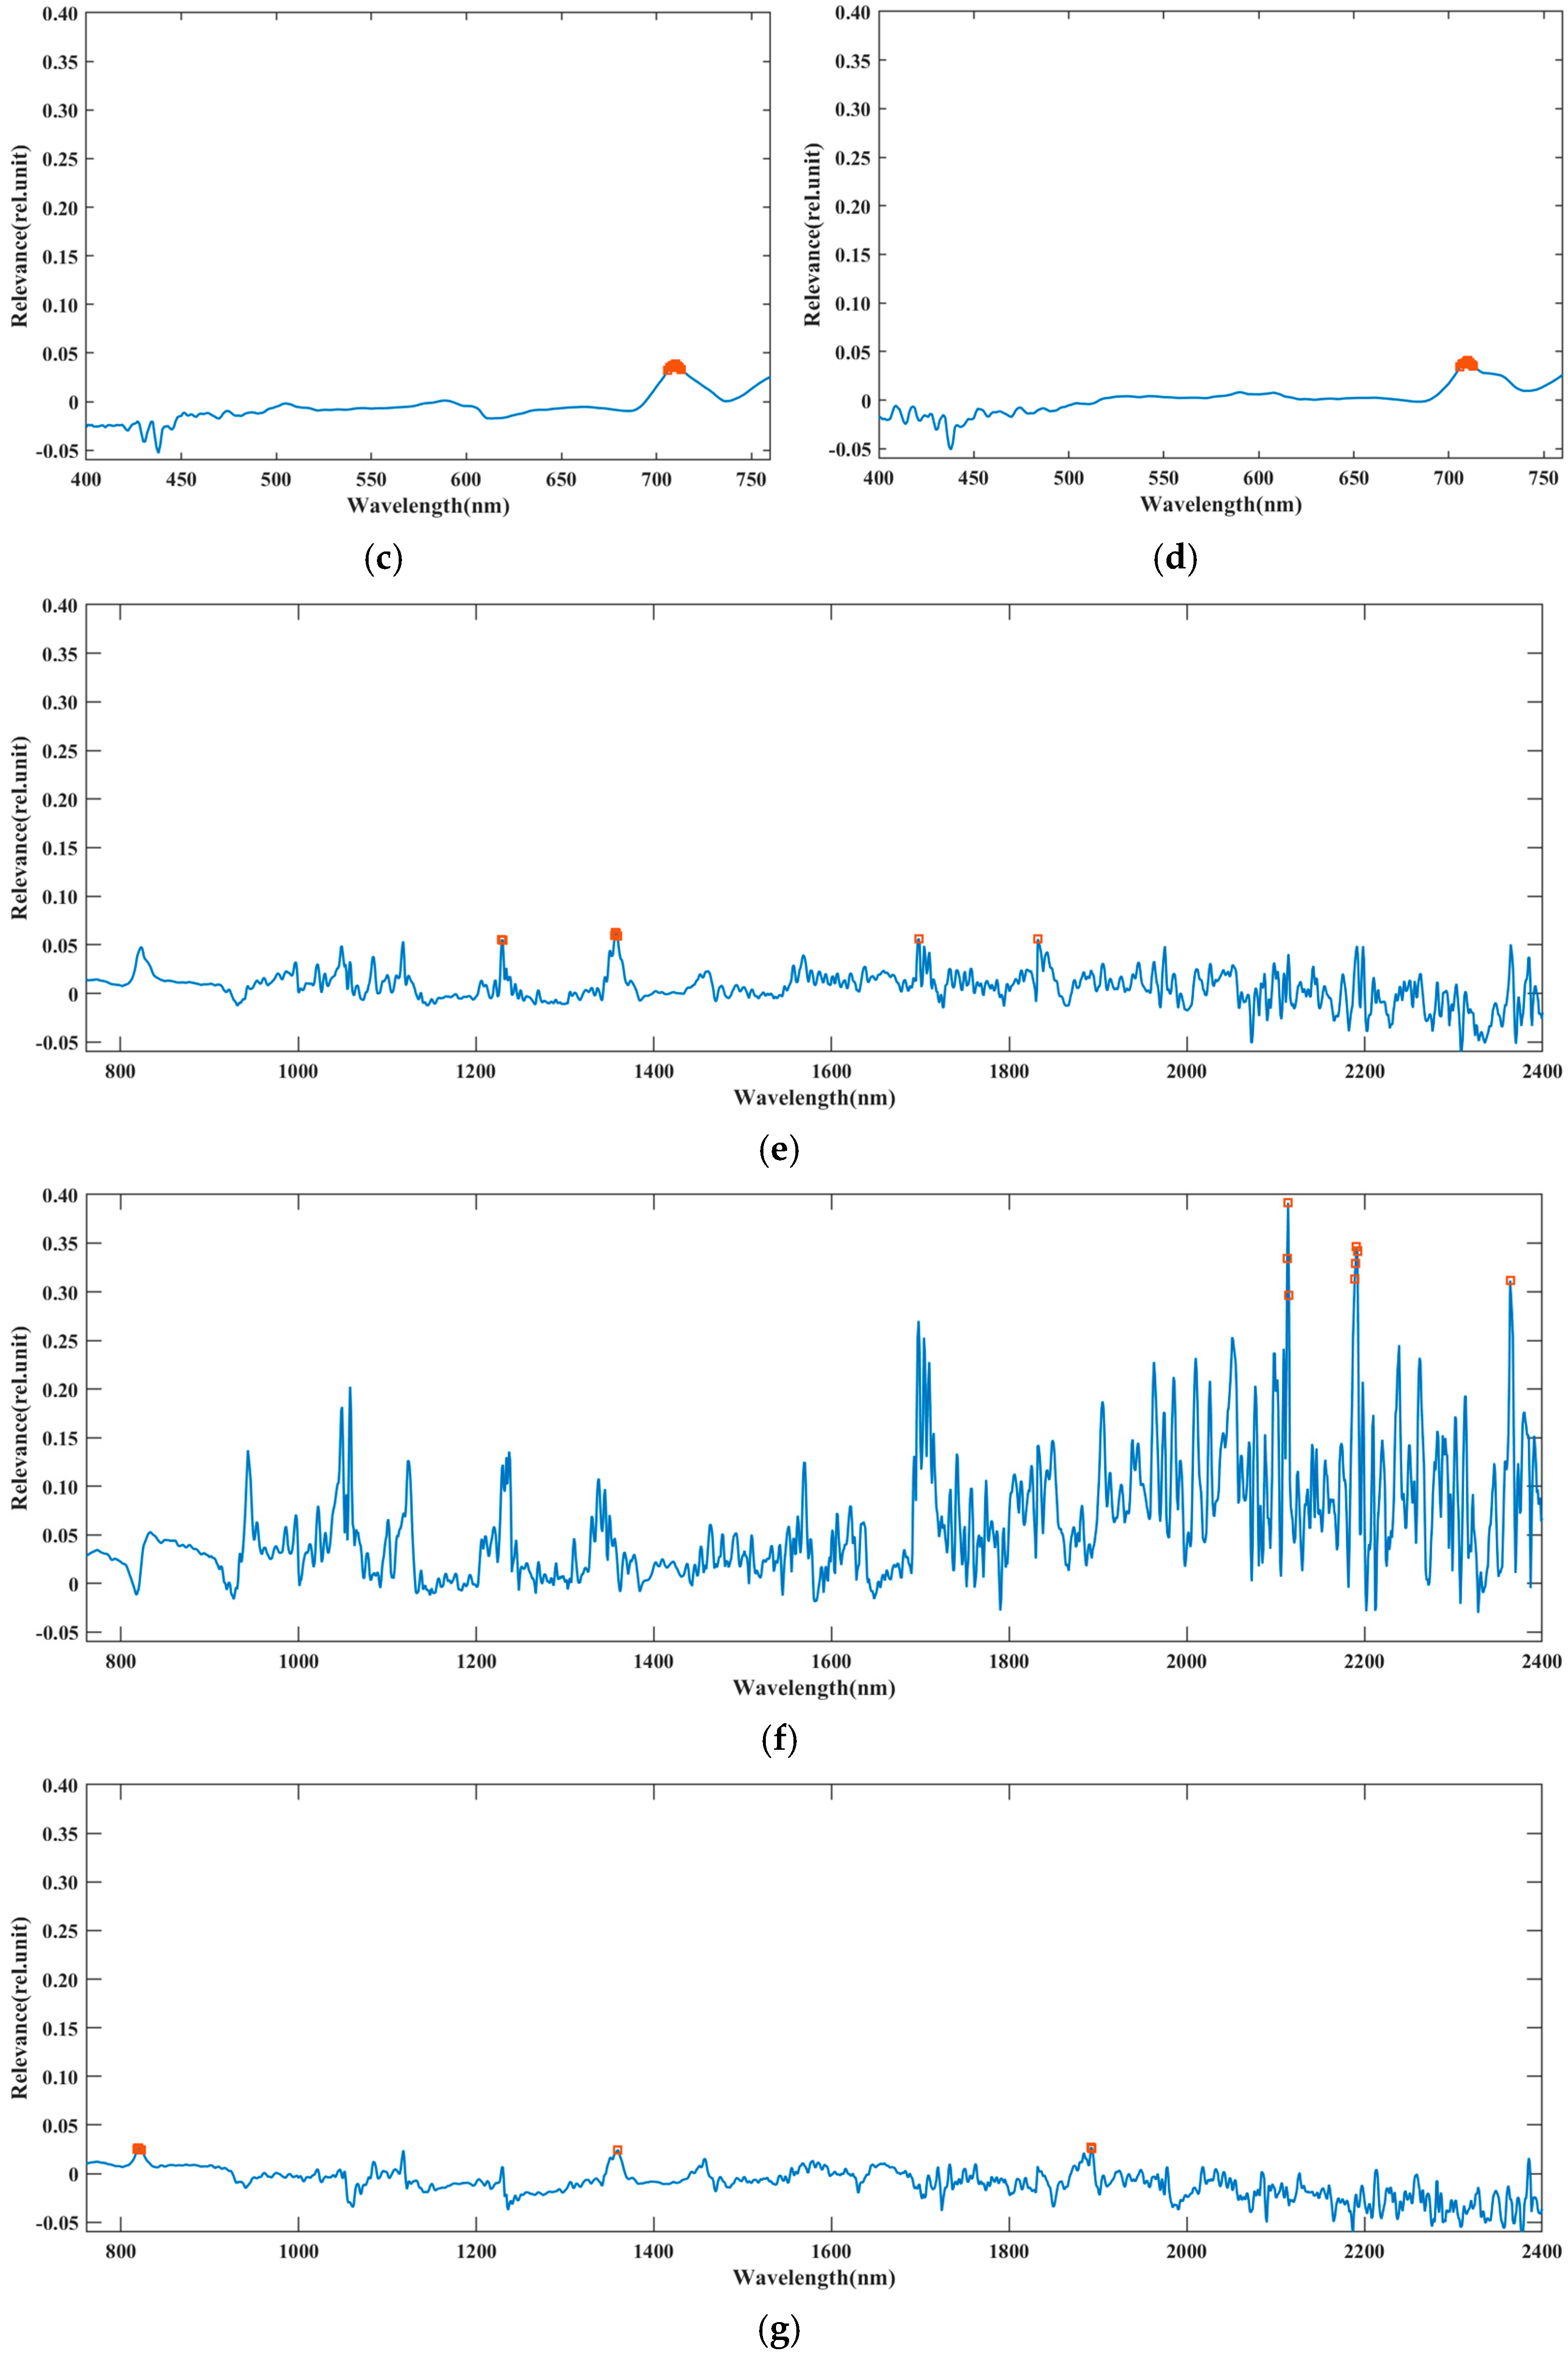
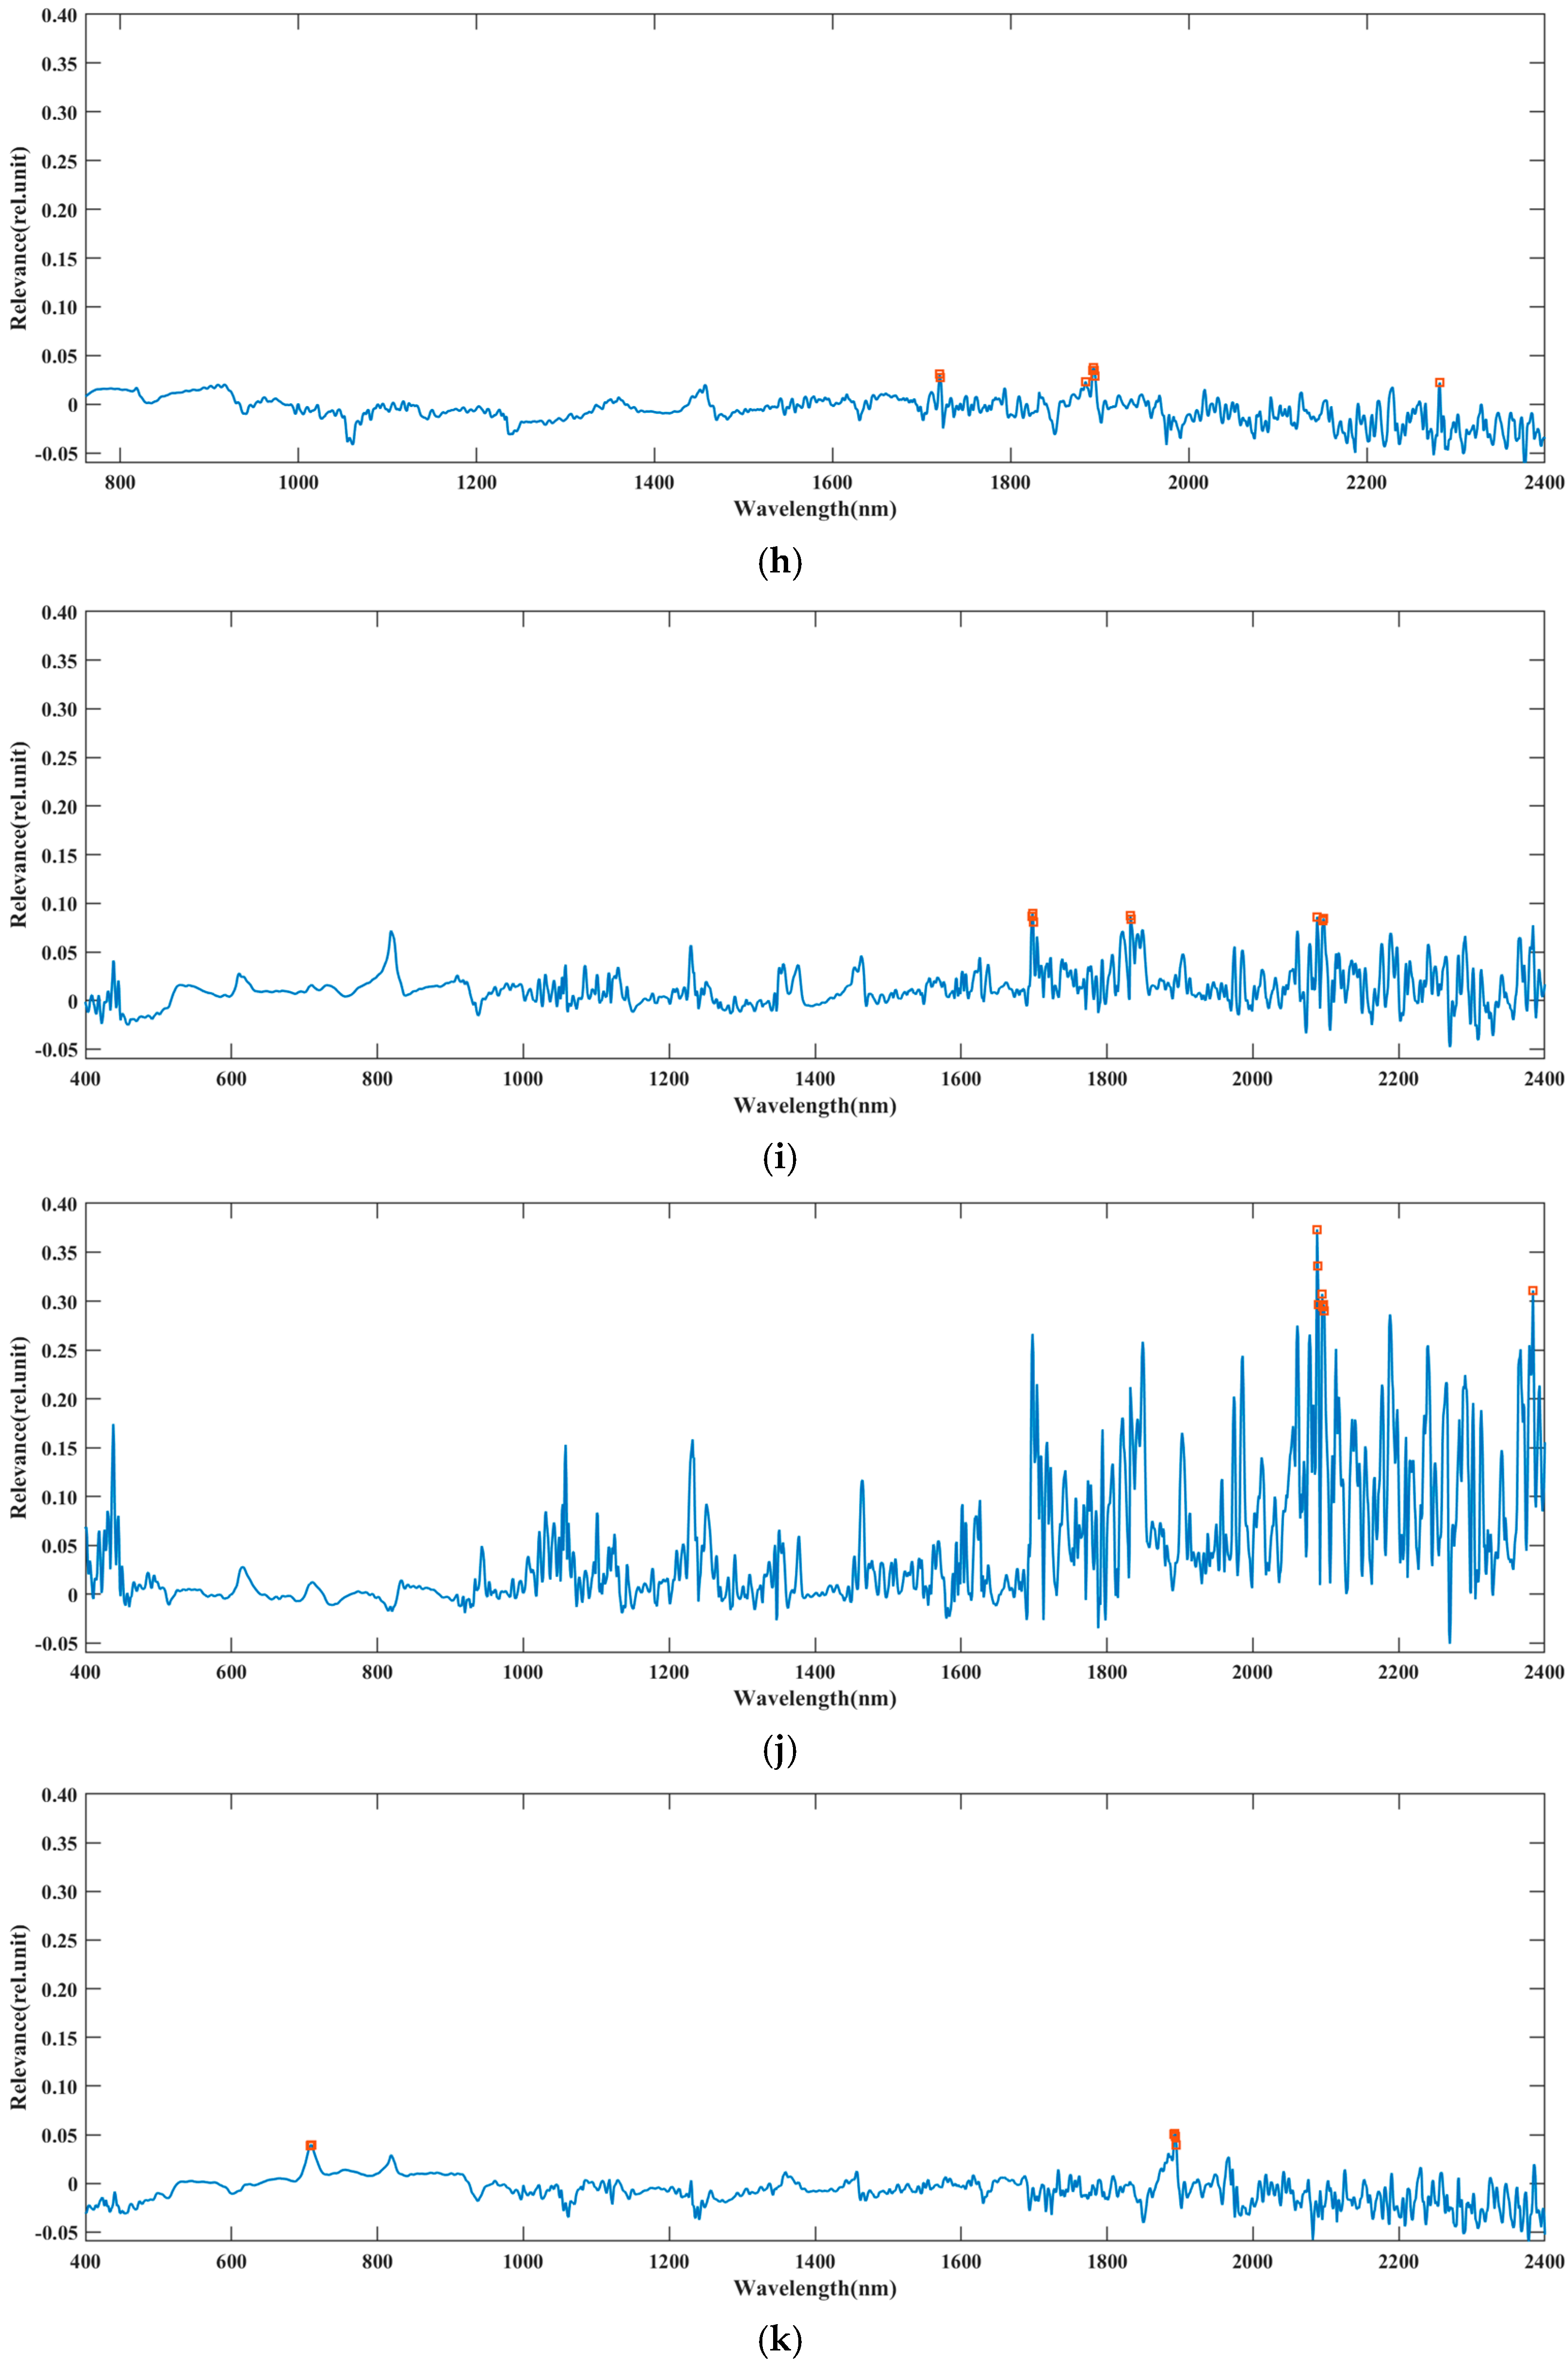
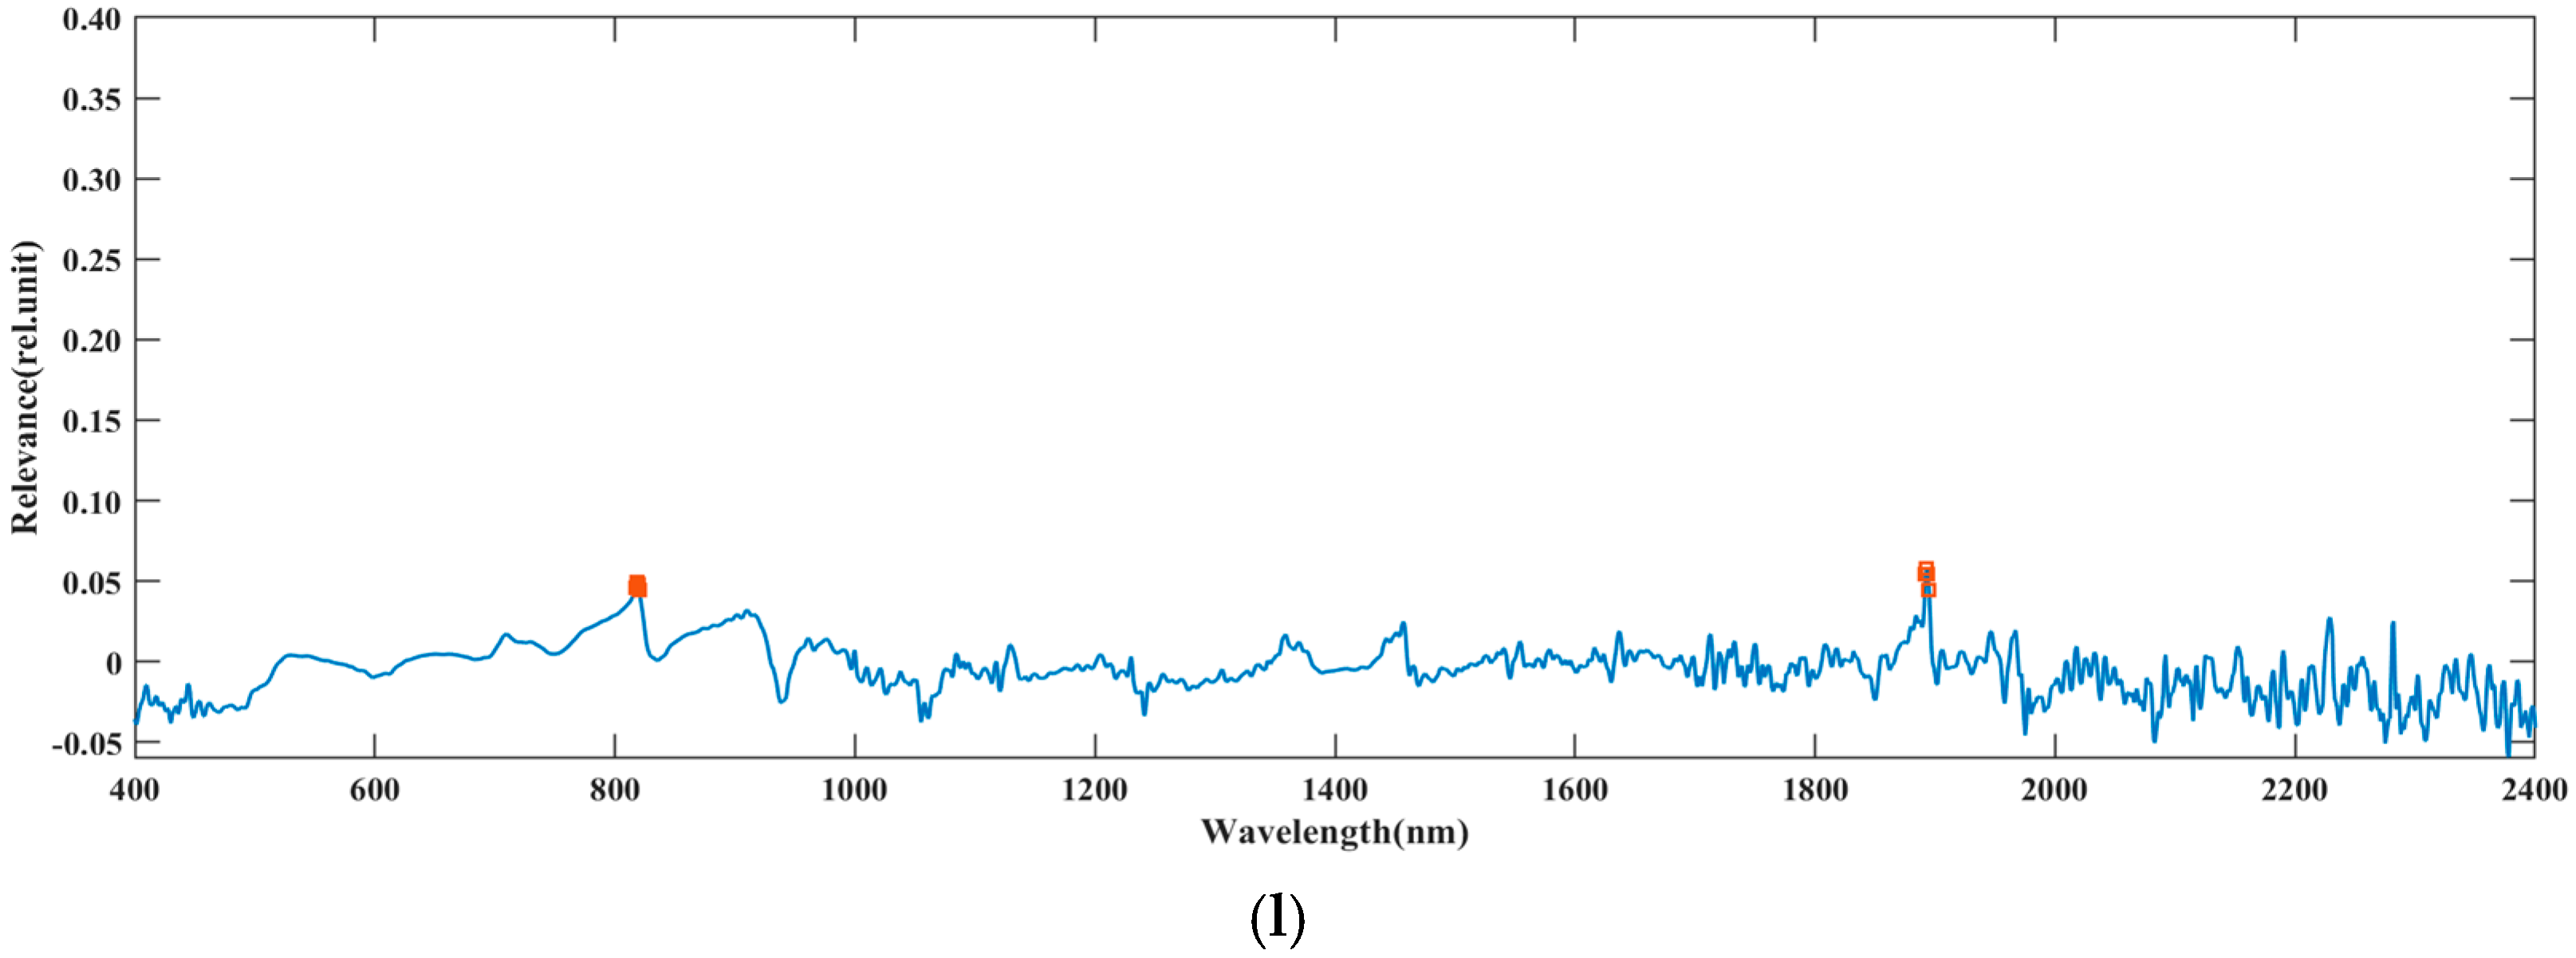
- The construction of the spectral disease indices (SDIs) consists of two steps: first, the RELIEF-F algorithm is used to estimate the discrimination ability of certain features based on their performance in separating different classes of samples near each other [46,62,63]. (1) For a feature, find a neighbor sample of the same type and a different class of samples from a given sample set and record them as the most recently hit sample and the most recently missed sample, respectively. (2) Calculate the sum of the Euclidean distances of the most recently hit and the most recently missed samples of the feature to represent the weight of the feature.
2.3.4. Classification Algorithm
- (1)
- Random forest (RF) is a classification model that integrates learning ideas by creating many decision trees to train the model on a random subset of the training data. The final classification results are generated based on the discriminative results of the decision trees.
- (2)
- Support vector machine (SVM) is a suitable method for the solution of classification tasks involving small-sample, high-dimensional feature datasets [64]. It has been shown to perform well in hyperspectral classification research. SVM achieves the separation of different sample classes by constructing an optimal hyperplane. The decision to build the hyperplane involves mapping the data to a high-dimensional space using a kernel function and maximizing the distance between the nearest data points of the two different classes in the high-dimensional space (known as the support vector). Using kernel functions, SVM can handle both linear and non-linearly separable data.
- (3)
- Long short-term memory (LSTM) is a type of recurrent neural network (RNN) that is particularly effective in dealing with long-term dependencies, as opposed to a traditional RNN. The key idea of LSTM is that it can remember information over long periods using a memory unit. The memory unit acts as a storage unit, allowing the model to selectively add, delete, and update information as it processes the input sequence. The LSTM layer is configured with 30 memory units, and Adam is used as the optimization algorithm during training [65,66].
- (4)
- A typical CNN consists of a convolutional layer, a pooling layer, and a fully connected layer, with the neurons in each layer connected by an activation function. The convolutional layer extracts data features, while the pooling layer reduces the data dimensionality. The non-linear activation function allows the network to learn complex and abstract features and patterns in the data. The fully connected layer completes the classification task. We constructed a 1DCNN based on the working principle of the CNN to classify hyperspectral data. Each layer specifies its configuration, indicating how the data are processed and transformed throughout the network in the sequence classification task.
2.3.5. Model Evaluation
3. Results
3.1. Spectral Reflectance Curve Analysis
3.2. Preferred Pretreatment Combinations
3.3. Feature Extraction
- (1)
- Principal component analysis (PCA)
- (2)
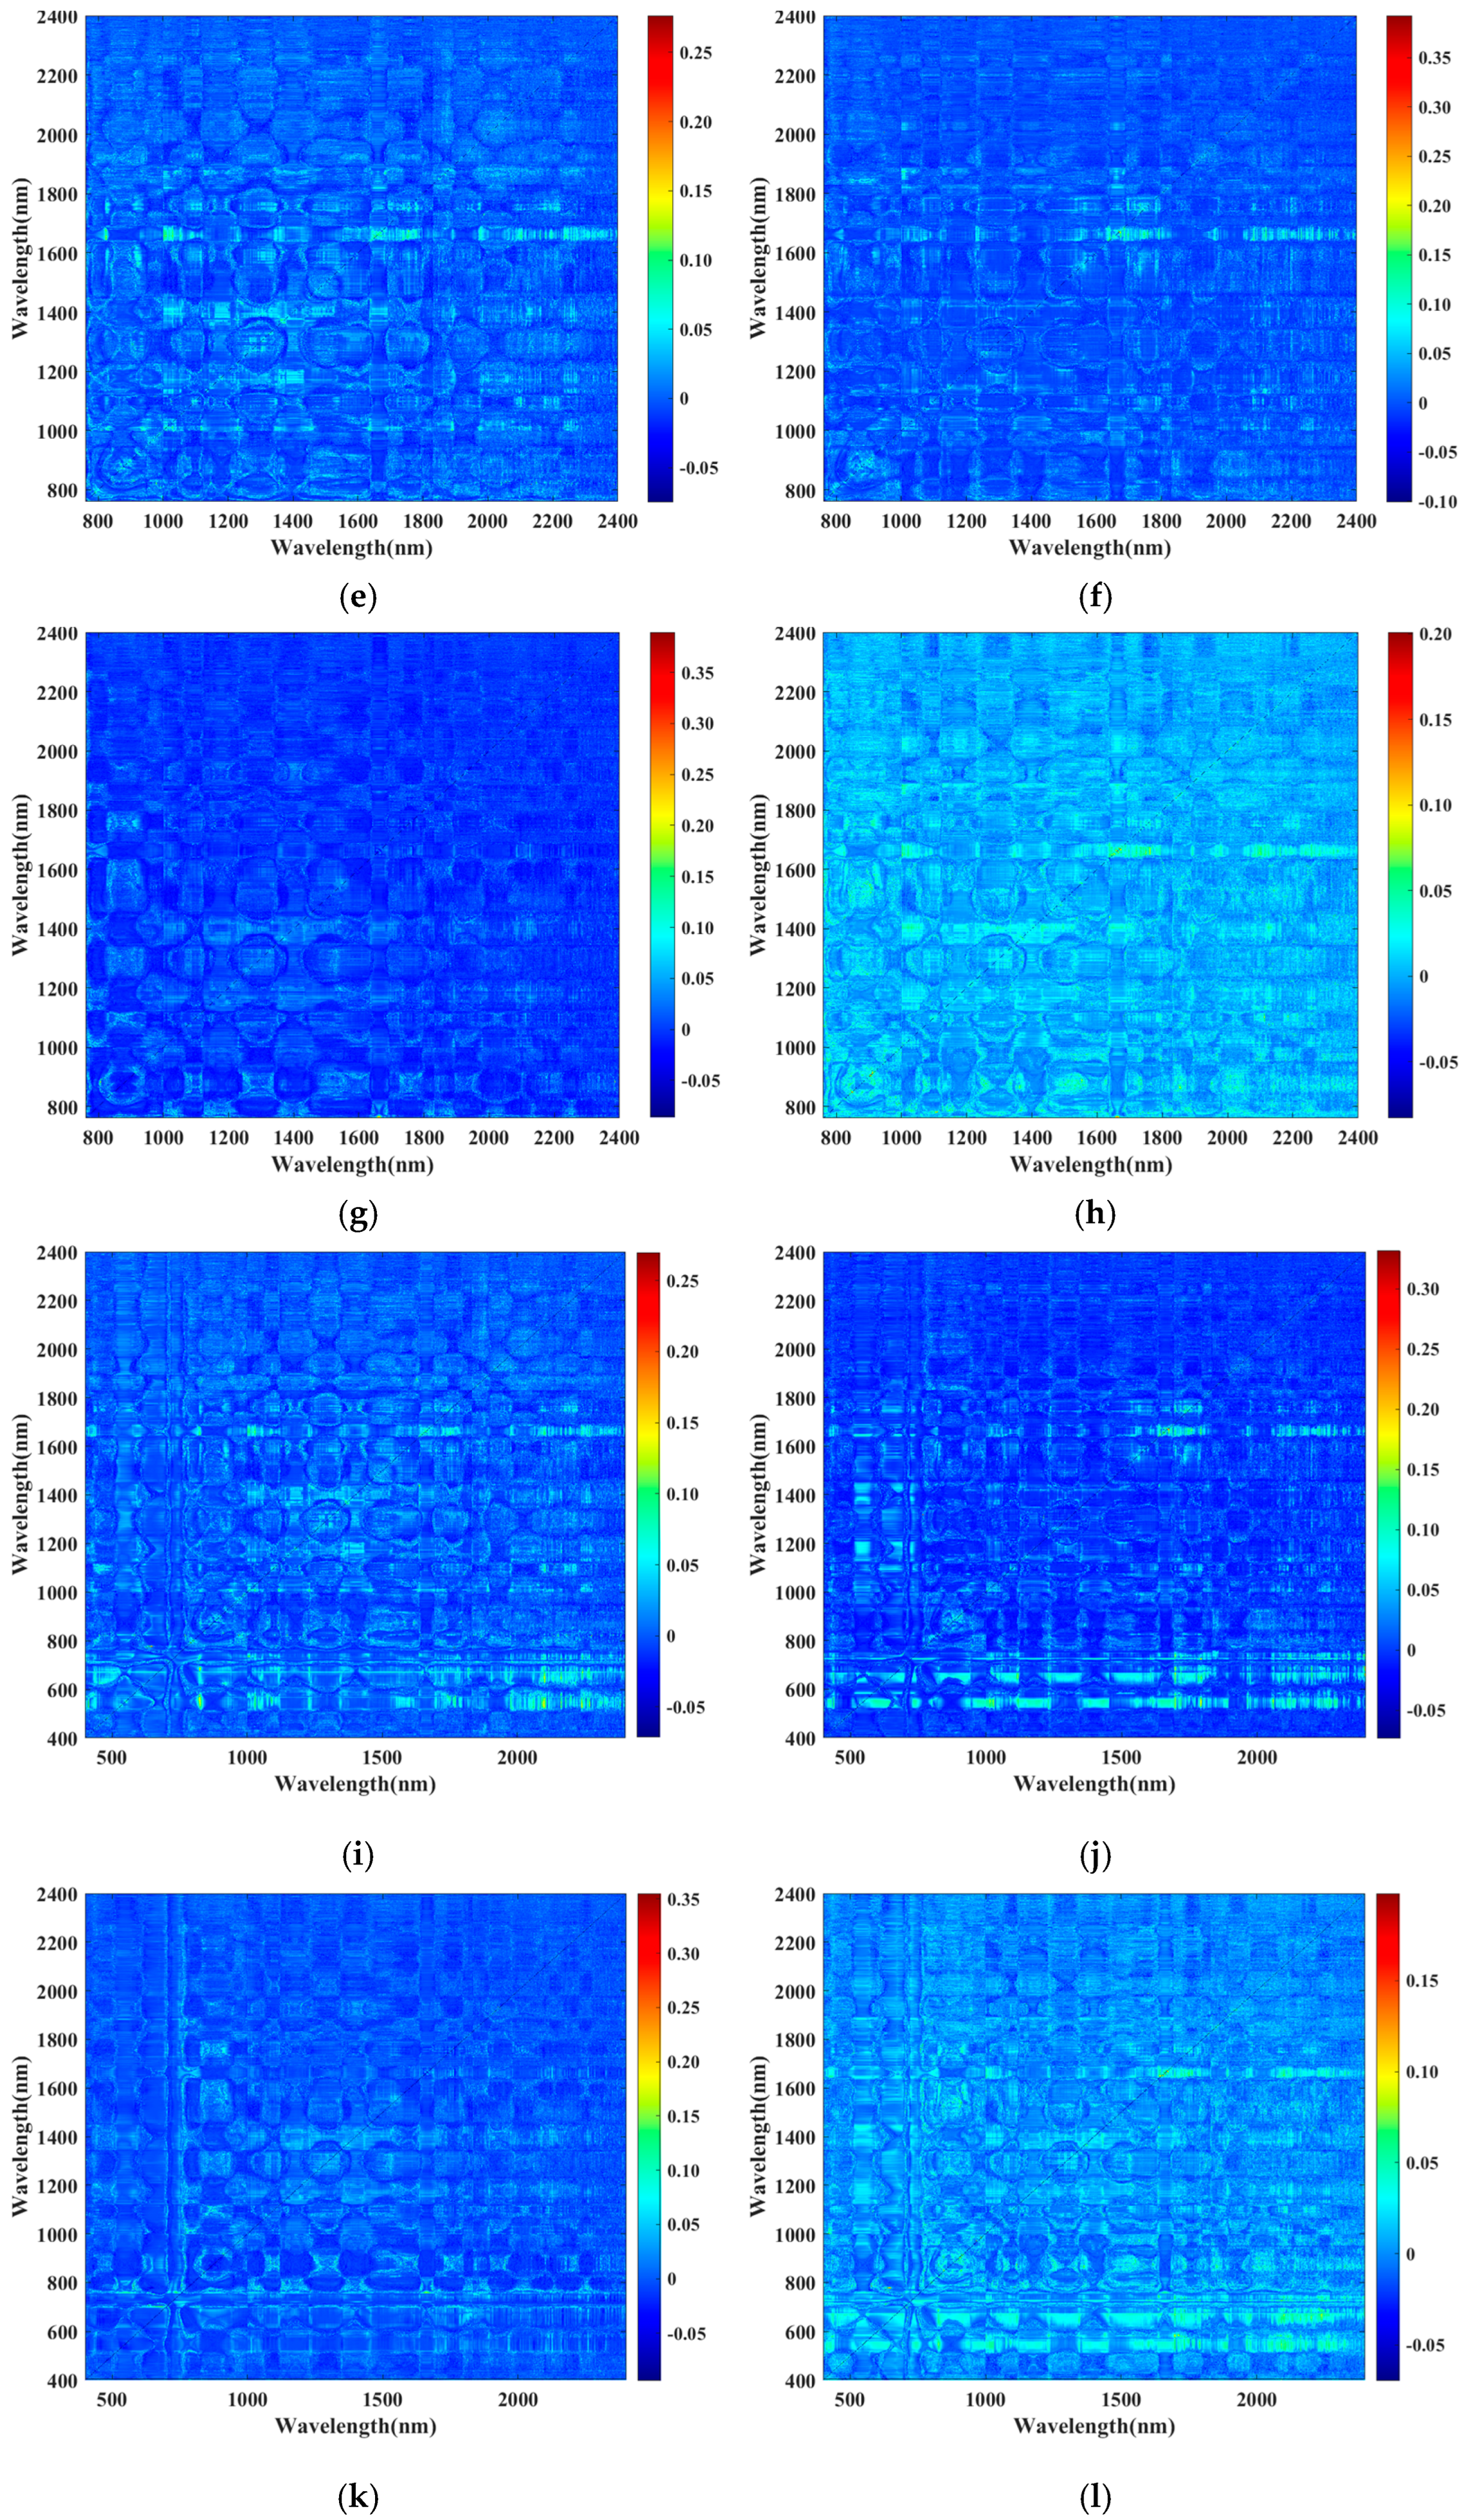
- Spectral disease indices (SDIs)
- (3)
- VCPA
- (4)
- SPA
3.4. Machine Learning
- (1)
- The visible spectrum
- (2)
- Near-infrared spectrum
- (3)
- All spectra
3.5. Deep Learning
4. Discussion and Future Work
5. Conclusions
Supplementary Materials
Author Contributions
Funding
Data Availability Statement
Conflicts of Interest
References
- Wang, G.; Dong, Y.; Liu, X.; Yao, G.; Yu, X.; Yang, M. The current status and development of insect-resistant genetically engineered poplar in China. Front. Plant Sci. 2018, 9, 328449. [Google Scholar] [CrossRef] [PubMed]
- Hu, J.; Wang, L.; Yan, D.; Lu, M.-Z. Research and application of transgenic poplar in China. In Challenges and Opportunities for the World’s Forests in the 21st Century; Springer: Dordrecht, The Netherlands, 2014; pp. 567–584. [Google Scholar] [CrossRef]
- Mazurek, S.; Wlodarczyk, M.; Pielorz, S.; Okinczyc, P.; Kus, P.M.; Dlugosz, G.; Vidal-Yanez, D.; Szostak, R. Quantification of Salicylates and Flavonoids in Poplar Bark and Leaves Based on IR, NIR, and Raman Spectra. Molecules 2022, 27, 3954. [Google Scholar] [CrossRef] [PubMed]
- Meshkova, V.; Zhupinska, K.; Borysenko, O.; Zinchenko, O.; Skrylnyk, Y.; Vysotska, N. Possible Factors of Poplar Susceptibility to Large Poplar Borer Infestation. Forests 2024, 15, 882. [Google Scholar] [CrossRef]
- Tyśkiewicz, K.; Konkol, M.; Kowalski, R.; Rój, E.; Warmiński, K.; Krzyżaniak, M.; Gil, Ł.; Stolarski, M.J. Characterization of bioactive compounds in the biomass of black locust, poplar and willow. Trees 2019, 33, 1235–1263. [Google Scholar] [CrossRef]
- Gordon, H.; Fellenberg, C.; Lackus, N.D.; Archinuk, F.; Sproule, A.; Nakamura, Y.; Köllner, T.G.; Gershenzon, J.; Overy, D.P.; Constabel, C.P. CRISPR/Cas9 disruption of UGT71L1 in poplar connects salicinoid and salicylic acid metabolism and alters growth and morphology. Plant Cell 2022, 34, 2925–2947. [Google Scholar] [CrossRef] [PubMed]
- Wang, Z.; Yan, W.; Peng, Y.; Wan, M.; Farooq, T.H.; Fan, W.; Lei, J.; Yuan, C.; Wang, W.; Qi, Y. Biomass production and carbon stocks in poplar-crop agroforestry chronosequence in subtropical central China. Plants 2023, 12, 2451. [Google Scholar] [CrossRef]
- Huang, H.; Tian, C.; Huang, Y.; Huang, H. Biological control of poplar anthracnose caused by Colletotrichum gloeosporioides (Penz.) Penz. & Sacc. Egypt. J. Biol. Pest Control 2020, 30, 1–9. [Google Scholar] [CrossRef]
- Popp, M.; Nalley, L.; Fortin, C.; Smith, A.; Brye, K. Estimating net carbon emissions and agricultural response to potential carbon offset policies. Agron. J. 2011, 103, 1132–1143. [Google Scholar] [CrossRef]
- National Forestry and Grassland Administration of China. The Ninth National Forest Resources Inventory Report. 2019. Available online: http://digitalpaper.stdaily.com/http_www.kjrb.com/kjwzb/html/2023-06/16/content_554941.htm (accessed on 16 June 2023).
- Wang, X.; Lu, D.; Tian, C. Mucin Msb2 cooperates with the transmembrane protein Sho1 in various plant surface signal sensing and pathogenic processes in the poplar anthracnose fungus Colletotrichum gloeosporioides. Mol. Plant Pathol. 2021, 22, 1553–1573. [Google Scholar] [CrossRef]
- Liu, N.; Meng, F.; Tian, C. Transcriptional network in Colletotrichum gloeosporioides mutants lacking Msb2 or Msb2 and Sho1. J. Fungi 2022, 8, 207. [Google Scholar] [CrossRef]
- Li, X.; Sun, H.; Pei, J.; Dong, Y.; Wang, F.; Chen, H.; Sun, Y.; Wang, N.; Li, H.; Li, Y. De novo sequencing and comparative analysis of the blueberry transcriptome to discover putative genes related to antioxidants. Gene 2012, 511, 54–61. [Google Scholar] [CrossRef]
- Qin, X.; Tian, C.; Meng, F. Comparative Transcriptome Analysis Reveals the Effect of the DHN Melanin Biosynthesis Pathway on the Appressorium Turgor Pressure of the Poplar Anthracnose-Causing Fungus Colletotrichum gloeosporioides. Int. J. Mol. Sci. 2023, 24, 7411. [Google Scholar] [CrossRef] [PubMed]
- Pobłocka-Olech, L.; Głód, D.; Jesionek, A.; Łuczkiewicz, M.; Krauze-Baranowska, M. Studies on the polyphenolic composition and the antioxidant properties of the leaves of poplar (Populus spp.) various species and hybrids. Chem. Biodivers. 2021, 18, e2100227. [Google Scholar] [CrossRef] [PubMed]
- Huang, H. Research on Antimicrobial Activity of Antagonistic Endophytic Bacterium against Colletotrichum gloeosporioides. Ph.D. Thesis, Beijing Forestry University, Beijing, China, 2020. [Google Scholar]
- Zhang, L.; Bao, H.; Meng, F.; Ren, Y.; Tian, C. Transcriptome and metabolome reveal the role of flavonoids in poplar resistance to poplar anthracnose. Ind. Crops Prod. 2023, 197, 116537. [Google Scholar] [CrossRef]
- Wang, X.; Lu, D.; Tian, C. CgEnd3 regulates endocytosis, appressorium formation, and virulence in the poplar anthracnose fungus Colletotrichum gloeosporioides. Int. J. Mol. Sci. 2021, 22, 4029. [Google Scholar] [CrossRef] [PubMed]
- Zhang, Y.; He, W.; Yan, D.-H. Histopathologic characterization of the process of Marssonina brunnea infection in poplar leaves. Can. J. For. Res. 2018, 48, 1302–1310. [Google Scholar] [CrossRef]
- Wang, J. The occurrence pattern and comprehensive prevention and control techniques of poplar black spot disease. Contemp. Hortic. 2023, 46, 121–123. [Google Scholar] [CrossRef]
- Cellerino, G.P. Review of Fungal Diseases in Poplar; AC492/E; Food and Agriculture Organization of The United Nations: Rome, Italy, 1999. [Google Scholar]
- Wang, F.; Zhao, C.; Yang, H.; Jiang, H.; Li, L.; Yang, G. Non-destructive and in-site estimation of apple quality and maturity by hyperspectral imaging. Comput. Electron. Agric. 2022, 195, 106843. [Google Scholar] [CrossRef]
- Zhang, Z.; Yin, X.; Ma, C. Development of simplified models for the nondestructive testing of rice with husk starch content using hyperspectral imaging technology. Anal. Methods 2019, 11, 5910–5918. [Google Scholar] [CrossRef]
- Jia, B.; Wang, W.; Ni, X.; Lawrence, K.C.; Zhuang, H.; Yoon, S.-C.; Gao, Z. Essential processing methods of hyperspectral images of agricultural and food products. Chemom. Intell. Lab. Syst. 2020, 198, 103936. [Google Scholar] [CrossRef]
- Zhang, S.; Yin, Y.; Liu, C.; Li, J.; Sun, X.; Wu, J. Discrimination of wheat flour grade based on PSO-SVM of hyperspectral technique. Spectrochim. Acta Part A Mol. Biomol. Spectrosc. 2023, 302, 123050. [Google Scholar] [CrossRef] [PubMed]
- Siripatrawan, U.; Makino, Y. Hyperspectral imaging coupled with machine learning for classification of anthracnose infection on mango fruit. Spectrochim. Acta Part A Mol. Biomol. Spectrosc. 2024, 309, 123825. [Google Scholar] [CrossRef] [PubMed]
- Kim, S.-R.; Lee, W.-K.; Lim, C.-H.; Kim, M.; Kafatos, M.C.; Lee, S.-H.; Lee, S.-S. Hyperspectral analysis of pine wilt disease to determine an optimal detection index. Forests 2018, 9, 115. [Google Scholar] [CrossRef]
- Xie, C.; He, Y. Spectrum and image texture features analysis for early blight disease detection on eggplant leaves. Sensors 2016, 16, 676. [Google Scholar] [CrossRef] [PubMed]
- Śmigaj, M. Hyperspectral, Thermal and LiDAR Remote Sensing for Red Band Needle Blight Detection in Pine Plantation Forests; Newcastle University: Newcastle upon Tyne, UK, 2018. [Google Scholar]
- Zahir, S.A.D.M.; Omar, A.F.; Jamlos, M.F.; Azmi, M.A.M.; Muncan, J. A review of visible and near-infrared (Vis-NIR) spectroscopy application in plant stress detection. Sens. Actuators A Phys. 2022, 338, 113468. [Google Scholar] [CrossRef]
- Morellos, A.; Tziotzios, G.; Orfanidou, C.; Pantazi, X.E.; Sarantaris, C.; Maliogka, V.; Alexandridis, T.K.; Moshou, D. Non-destructive early detection and quantitative severity stage classification of Tomato Chlorosis Virus (ToCV) infection in young tomato plants using vis–NIR Spectroscopy. Remote Sens. 2020, 12, 1920. [Google Scholar] [CrossRef]
- Salehi, B.; Mireei, S.A.; Jafari, M.; Hemmat, A.; Majidi, M.M. Integrating in-field Vis-NIR leaf spectroscopy and deep learning feature extraction for growth-stage dependent and independent genotyping of wheat plants. Biosyst. Eng. 2024, 238, 188–199. [Google Scholar] [CrossRef]
- Hossain, M.A. UV–Visible–NIR camouflage textiles with natural plant based natural dyes on natural fibre against woodland combat background for defence protection. Sci. Rep. 2023, 13, 5021. [Google Scholar] [CrossRef]
- Rong, D.; Wang, H.; Ying, Y.; Zhang, Z.; Zhang, Y. Peach variety detection using VIS-NIR spectroscopy and deep learning. Comput. Electron. Agric. 2020, 175, 105553. [Google Scholar] [CrossRef]
- Meng, Y.; Zhang, Y.; Li, C.; Zhao, J.; Wang, Z.; Wang, C.; Li, Y. Prediction of the Carbon Content of Six Tree Species from Visible-Near-Infrared Spectroscopy. Forests 2021, 12, 1233. [Google Scholar] [CrossRef]
- Shen, L.; Gao, M.; Yan, J.; Li, Z.-L.; Leng, P.; Yang, Q.; Duan, S.-B. Hyperspectral estimation of soil organic matter content using different spectral preprocessing techniques and PLSR method. Remote Sens. 2020, 12, 1206. [Google Scholar] [CrossRef]
- Bian, X. Spectral preprocessing methods. In Chemometric Methods in Analytical Spectroscopy Technology; Springer: Berlin/Heidelberg, Germany, 2022; pp. 111–168. [Google Scholar]
- Helin, R.; Indahl, U.G.; Tomic, O.; Liland, K.H. On the possible benefits of deep learning for spectral preprocessing. J. Chemom. 2022, 36, e3374. [Google Scholar] [CrossRef]
- Shen, L.; Gao, M.; Yan, J.; Wang, Q.; Shen, H. Winter Wheat SPAD Value Inversion Based on Multiple Pretreatment Methods. Remote Sens. 2022, 14, 4660. [Google Scholar] [CrossRef]
- Gerretzen, J.; Szymańska, E.; Bart, J.; Davies, A.N.; van Manen, H.-J.; van den Heuvel, E.R.; Jansen, J.J.; Buydens, L.M. Boosting model performance and interpretation by entangling preprocessing selection and variable selection. Anal. Chim. Acta 2016, 938, 44–52. [Google Scholar] [CrossRef] [PubMed]
- Mishra, P.; Biancolillo, A.; Roger, J.M.; Marini, F.; Rutledge, D.N. New data preprocessing trends based on ensemble of multiple preprocessing techniques. TrAC Trends Anal. Chem. 2020, 132, 116045. [Google Scholar] [CrossRef]
- Bian, X.; Wang, K.; Tan, E.; Diwu, P.; Zhang, F.; Guo, Y. A selective ensemble preprocessing strategy for near-infrared spectral quantitative analysis of complex samples. Chemom. Intell. Lab. Syst. 2020, 197, 103916. [Google Scholar] [CrossRef]
- Khalid, S.; Khalil, T.; Nasreen, S. A survey of feature selection and feature extraction techniques in machine learning. In Proceedings of the 2014 Science and Information Conference, London, UK, 27–329 August 2014; pp. 372–378. [Google Scholar]
- Cen, H.; Lu, R.; Zhu, Q.; Mendoza, F. Nondestructive detection of chilling injury in cucumber fruit using hyperspectral imaging with feature selection and supervised classification. Postharvest Biol. Technol. 2016, 111, 352–361. [Google Scholar] [CrossRef]
- Golhani, K.; Balasundram, S.K.; Vadamalai, G.; Pradhan, B. A review of neural networks in plant disease detection using hyperspectral data. Inf. Process. Agric. 2018, 5, 354–371. [Google Scholar] [CrossRef]
- Meng, R.; Lv, Z.; Yan, J.; Chen, G.; Zhao, F.; Zeng, L.; Xu, B. Development of spectral disease indices for southern corn rust detection and severity classification. Remote Sens. 2020, 12, 3233. [Google Scholar] [CrossRef]
- Kouadio, L.; El Jarroudi, M.; Belabess, Z.; Laasli, S.-E.; Roni, M.Z.K.; Amine, I.D.I.; Mokhtari, N.; Mokrini, F.; Junk, J.; Lahlali, R. A Review on UAV-Based Applications for Plant Disease Detection and Monitoring. Remote Sens. 2023, 15, 4273. [Google Scholar] [CrossRef]
- Cucho-Padin, G.; Loayza, H.; Palacios, S.; Balcazar, M.; Carbajal, M.; Quiroz, R. Development of low-cost remote sensing tools and methods for supporting smallholder agriculture. Appl. Geomat. 2020, 12, 247–263. [Google Scholar] [CrossRef]
- Sherstinsky, A. Fundamentals of recurrent neural network (RNN) and long short-term memory (LSTM) network. Phys. D Nonlinear Phenom. 2020, 404, 132306. [Google Scholar] [CrossRef]
- Selvin, S.; Vinayakumar, R.; Gopalakrishnan, E.; Menon, V.K.; Soman, K. Stock price prediction using LSTM, RNN and CNN-sliding window model. In Proceedings of the 2017 International Conference on Advances in Computing, Communications and Informatics (ICACCI), Udupi, India, 13–16 September 2017; pp. 1643–1647. [Google Scholar]
- He, T.; Xie, C.; Liu, Q.; Guan, S.; Liu, G. Evaluation and comparison of random forest and A-LSTM networks for large-scale winter wheat identification. Remote Sens. 2019, 11, 1665. [Google Scholar] [CrossRef]
- LeCun, Y.; Bengio, Y.; Hinton, G. Deep learning. Nature 2015, 521, 436–444. [Google Scholar] [CrossRef] [PubMed]
- Mozaffari, M.H.; Tay, L.-L. Overfitting One-Dimensional convolutional neural networks for Raman spectra identification. Spectrochim. Acta Part A Mol. Biomol. Spectrosc. 2022, 272, 120961. [Google Scholar] [CrossRef]
- Pang, L.; Men, S.; Yan, L.; Xiao, J. Rapid vitality estimation and prediction of corn seeds based on spectra and images using deep learning and hyperspectral imaging techniques. IEEE Access 2020, 8, 123026–123036. [Google Scholar] [CrossRef]
- Janiesch, C.; Zschech, P.; Heinrich, K. Machine learning and deep learning. Electron. Mark. 2021, 31, 685–695. [Google Scholar] [CrossRef]
- Salman, Z.; Muhammad, A.; Piran, M.J.; Han, D. Crop-saving with AI: Latest trends in deep learning techniques for plant pathology. Front. Plant Sci. 2023, 14, 1224709. [Google Scholar] [CrossRef]
- Danner, M.; Locherer, M.; Hank, T.; Richter, K. Spectral Sampling with the ASD FIELDSPEC 4. 2015. Available online: https://gfzpublic.gfz-potsdam.de/rest/items/item_1388298/component/file_1388299/content (accessed on 16 June 2023).
- Abdulridha, J.; Ampatzidis, Y.; Kakarla, S.C.; Roberts, P. Detection of target spot and bacterial spot diseases in tomato using UAV-based and benchtop-based hyperspectral imaging techniques. Precis. Agric. 2020, 21, 955–978. [Google Scholar] [CrossRef]
- Rabatel, G.; Marini, F.; Walczak, B.; Roger, J.M. VSN: Variable sorting for normalization. J. Chemom. 2019, 34, e3164. [Google Scholar] [CrossRef]
- Yao, Z.; Lei, Y.; He, D. Early visual detection of wheat stripe rust using visible/near-infrared hyperspectral imaging. Sensors 2019, 19, 952. [Google Scholar] [CrossRef] [PubMed]
- Ma, L.; Zhang, Y.; Zhang, Y.; Wang, J.; Li, J.; Gao, Y.; Wang, X.; Wu, L. Rapid Nondestructive Detection of Chlorophyll Content in Muskmelon Leaves under Different Light Quality Treatments. Agronomy 2022, 12, 3223. [Google Scholar] [CrossRef]
- Mahlein, A.-K.; Rumpf, T.; Welke, P.; Dehne, H.-W.; Plümer, L.; Steiner, U.; Oerke, E.-C. Development of spectral indices for detecting and identifying plant diseases. Remote Sens. Environ. 2013, 128, 21–30. [Google Scholar] [CrossRef]
- Wu, G.; Fang, Y.; Jiang, Q.; Cui, M.; Li, N.; Ou, Y.; Diao, Z.; Zhang, B. Early identification of strawberry leaves disease utilizing hyperspectral imaging combing with spectral features, multiple vegetation indices and textural features. Comput. Electron. Agric. 2023, 204, 107553. [Google Scholar] [CrossRef]
- Liu, X.; Gao, C.; Li, P. A comparative analysis of support vector machines and extreme learning machines. Neural Netw. 2012, 33, 58–66. [Google Scholar] [CrossRef]
- Soydaner, D. A comparison of optimization algorithms for deep learning. Int. J. Pattern Recognit. Artif. Intell. 2020, 34, 2052013. [Google Scholar] [CrossRef]
- Saleem, M.H.; Potgieter, J.; Arif, K.M. Plant disease classification: A comparative evaluation of convolutional neural networks and deep learning optimizers. Plants 2020, 9, 1319. [Google Scholar] [CrossRef]
- Zhang, J.; Huang, Y.; Pu, R.; Gonzalez-Moreno, P.; Yuan, L.; Wu, K.; Huang, W. Monitoring plant diseases and pests through remote sensing technology: A review. Comput. Electron. Agric. 2019, 165, 104943. [Google Scholar] [CrossRef]
- Gillon, D.; Houssard, C.; Joffre, R. Using near-infrared reflectance spectroscopy to predict carbon, nitrogen and phosphorus content in heterogeneous plant material. Oecologia 1999, 118, 173–182. [Google Scholar] [CrossRef]
- Petisco, C.; García-Criado, B.; Mediavilla, S.; Vázquez de Aldana, B.R.; Zabalgogeazcoa, I.; García-Ciudad, A. Near-infrared reflectance spectroscopy as a fast and non-destructive tool to predict foliar organic constituents of several woody species. Anal. Bioanal. Chem. 2006, 386, 1823–1833. [Google Scholar] [CrossRef]
- Asner, G.P.; Martin, R.E. Spectral and chemical analysis of tropical forests: Scaling from leaf to canopy levels. Remote Sens. Environ. 2008, 112, 3958–3970. [Google Scholar] [CrossRef]
- Kleinebecker, T.; Schmidt, S.R.; Fritz, C.; Smolders, A.J.; Hölzel, N. Prediction of δ13C and δ15N in plant tissues with near-infrared reflectance spectroscopy. New Phytol. 2009, 184, 732–739. [Google Scholar] [CrossRef] [PubMed]
- Martín-Tornero, E.; de Jorge Páscoa, R.N.M.; Espinosa-Mansilla, A.; Martín-Merás, I.D.; Lopes, J.A. Comparative quantification of chlorophyll and polyphenol levels in grapevine leaves sampled from different geographical locations. Sci. Rep. 2020, 10, 6246. [Google Scholar] [CrossRef] [PubMed]
- Ceccato, P.; Flasse, S.; Gregoire, J.-M. Designing a spectral index to estimate vegetation water content from remote sensing data: Part 2. Validation and applications. Remote Sens. Environ. 2002, 82, 198–207. [Google Scholar] [CrossRef]
- Sinha, R.; Khot, L.R.; Rathnayake, A.P.; Gao, Z.; Naidu, R.A. Visible-near infrared spectroradiometry-based detection of grapevine leafroll-associated virus 3 in a red-fruited wine grape cultivar. Comput. Electron. Agric. 2019, 162, 165–173. [Google Scholar] [CrossRef]
- Rasheed, F.; Delagrange, S.; Lorenzetti, F. Detection of plant water stress using leaf spectral responses in three poplar hybrids prior to the onset of physiological effects. Int. J. Remote Sens. 2020, 41, 5127–5146. [Google Scholar] [CrossRef]
- Ojo, M.O.; Zahid, A. Improving deep learning classifiers performance via preprocessing and class imbalance approaches in a plant disease detection pipeline. Agronomy 2023, 13, 887. [Google Scholar] [CrossRef]
- Al-Saddik, H.; Simon, J.-C.; Cointault, F. Development of spectral disease indices for ‘Flavescence Dorée’grapevine disease identification. Sensors 2017, 17, 2772. [Google Scholar] [CrossRef] [PubMed]
- Guo, A.; Huang, W.; Ye, H.; Dong, Y.; Ma, H.; Ren, Y.; Ruan, C. Identification of wheat yellow rust using spectral and texture features of hyperspectral images. Remote Sens. 2020, 12, 1419. [Google Scholar] [CrossRef]
- Zhang, J.; Pu, R.; Huang, W.; Yuan, L.; Luo, J.; Wang, J. Using in-situ hyperspectral data for detecting and discriminating yellow rust disease from nutrient stresses. Field Crops Res. 2012, 134, 165–174. [Google Scholar] [CrossRef]
- Xu, K.; Sun, L.-L.; Wang, J.; Liu, S.-X.; Yang, H.-W.; Xu, N.; Zhang, H.-J.; Wang, J.-X. Potassium deficiency diagnosis method of apple leaves based on MLR-LDA-SVM. Front. Plant Sci. 2023, 14, 1271933. [Google Scholar] [CrossRef] [PubMed]
- Tang, X.; Zheng, P.; Li, X.; Wu, H.; Wei, D.-Q.; Liu, Y.; Huang, G. Deep6mAPred: A CNN and Bi-LSTM-based deep learning method for predicting DNA N6-methyladenosine sites across plant species. Methods 2022, 204, 142–150. [Google Scholar] [CrossRef] [PubMed]
- Turkoglu, M.; Hanbay, D.; Sengur, A. Multi-model LSTM-based convolutional neural networks for detection of apple diseases and pests. J. Ambient Intell. Humaniz. Comput. 2022, 13, 3335–3345. [Google Scholar] [CrossRef]
- Crisóstomo de Castro Filho, H.; Abílio de Carvalho Júnior, O.; Ferreira de Carvalho, O.L.; Pozzobon de Bem, P.; dos Santos de Moura, R.; Olino de Albuquerque, A.; Rosa Silva, C.; Guimaraes Ferreira, P.H.; Fontes Guimarães, R.; Trancoso Gomes, R.A. Rice crop detection using LSTM, Bi-LSTM, and machine learning models from Sentinel-1 time series. Remote Sens. 2020, 12, 2655. [Google Scholar] [CrossRef]
- Padmavathi, B.; BhagyaLakshmi, A.; Vishnupriya, G.; Datchanamoorthy, K. IoT-based prediction and classification framework for smart farming using adaptive multi-scale deep networks. Expert Syst. Appl. 2024, 254, 124318. [Google Scholar] [CrossRef]


| Poplar Sample Category | Sample Size |
|---|---|
| Healthy | 55 |
| Black spot disease | 55 |
| Early-stage anthracnose | 54 |
| Late-stage anthracnose | 65 |
| Experiment | Smoothing | Baseline Correction | Scatter Correction |
|---|---|---|---|
| 1 | SG | airPLS | VSN |
| 2 | SG | airPLS | MSC |
| 3 | SG | airPLS | No processing |
| 4 | SG | CWT | VSN |
| 5 | SG | CWT | MSC |
| 6 | SG | CWT | No processing |
| 7 | SG | No processing | VSN |
| 8 | SG | No processing | MSC |
| 9 | SG | No processing | No processing |
| 10 | Gaussian | airPLS | VSN |
| 11 | Gaussian | airPLS | MSC |
| 12 | Gaussian | airPLS | No processing |
| 13 | Gaussian | CWT | VSN |
| 14 | Gaussian | CWT | MSC |
| 15 | Gaussian | CWT | No processing |
| 16 | Gaussian | No processing | VSN |
| 17 | Gaussian | No processing | MSC |
| 18 | Gaussian | No processing | No processing |
| 19 | No processing | airPLS | VSN |
| 20 | No processing | airPLS | MSC |
| 21 | No processing | airPLS | No processing |
| 22 | No processing | CWT | VSN |
| 23 | No processing | CWT | MSC |
| 24 | No processing | CWT | No processing |
| 25 | No processing | No processing | VSN |
| 26 | No processing | No processing | MSC |
| 27 | No processing | No processing | No processing |
| Confusion Matrix | Predicted Class | ||||
|---|---|---|---|---|---|
| Early-Stage Anthracnose | Late-Stage Anthracnose | Healthy | Black Spot | ||
| Actual Class | Early-stage Anthracnose | TEarly | FEarly-Late | FEarly-Healthy | FEarly-Black |
| Late-stage Anthracnose | FLate-Early | TLate | FLate-Healthy | FLate-Black | |
| Healthy | FHealthy-Early | FHealthy-Late | THealthy | FHealthy-Black | |
| Black Spot Disease | FBlack-Early | FBlack-Late | FBlack-Healthy | TBlack | |
| Preprocessing | Gaussian | airPLS | CWT | VSN | MSC | Mean Value |
|---|---|---|---|---|---|---|
| (a) No processing | × | × | × | × | × | 0.7040 |
| (b) Gaussian + CWT + VSN | √ | × | √ | √ | × | 0.9497 |
| (c) Gaussian + CWT + MSC | √ | × | √ | × | √ | 0.9392 |
| (d) Gaussian + CWT | √ | × | √ | × | × | 0.8954 |
| (e) with only airPLS | × | √ | × | × | × | 0.6892 |
| ej | dj | wj (%) | |
|---|---|---|---|
| RF-ACC | 0.959 | 0.041 | 13.596 |
| RF-F1-score | 0.961 | 0.039 | 12.906 |
| SVM-ACC | 0.959 | 0.041 | 13.658 |
| SVM-F1-score | 0.958 | 0.042 | 13.893 |
| RNN-ACC | 0.961 | 0.039 | 12.754 |
| RNN-F1-score | 0.962 | 0.038 | 12.593 |
| 1DCNN-ACC | 0.968 | 0.032 | 10.621 |
| 1DCNN-F1-score | 0.97 | 0.03 | 9.979 |
| Data | Healthy Index (HI) | Black Spot Index (BI) |
|---|---|---|
| VIS | HI = (R633 − R432)/(R633 + R432) + R432 | BI = (R539 − R438)/(R539 + R438) + R440 |
| NIR | HI = (R823 − R1832)/(R823 + R1832) + R769 | BI = (R2007 − R2192)/(R2007 + R2192) + R947 |
| ALL | HI = (R1188 − R2244)/(R1188 + R2244) + R1056 | BI = (R1691 − R2385)/(R1691 + R2385) − 0.4∙R1114 |
| Data | Early-Stage Anthracnose Index (ESAI) | Late-Stage Anthracnose Index (LSAI) |
|---|---|---|
| VIS | ESAI = (R760 − R713)/(R760 + R713) − R608 | LSAI = (R696 − R706)/(R696 + R706) − R710 |
| NIR | ESAI = (R856 − R818)/(R856 + R818) − R806 | LSAI = (R906 − R1892)/(R906 + R1892) + R905 |
| ALL | ESAI = (R2170 − R1121)/(R2170 + R1121) − R1170 | LSAI = (R1259 − R2303)/(R1259 + R2303) + R1260 |
| Dataset | Number | Wavelength (nm) | RMSECV | |||
|---|---|---|---|---|---|---|
| VIS | 11 | 412 | 444 | 445 | 457 | 0.4860 |
| 459 | 469 | 470 | 512 | |||
| 574 | 595 | 728 | ||||
| NIR | 10 | 1008 | 1020 | 1053 | 1092 | 0.3358 |
| 1161 | 1177 | 1601 | 1634 | |||
| 1675 | 1905 | |||||
| ALL | 10 | 693 | 1053 | 1084 | 1094 | 0.3189 |
| 1114 | 1116 | 1161 | 1633 | |||
| 1905 | 1906 | |||||
| Dataset | Number | RMSECV |
|---|---|---|
| VIS | 49 | 0.44826 |
| NIR | 50 | 0.33442 |
| ALL | 82 | 0.35839 |
| Data | Classifier | OA (%) | (%) | (%) | (%) | (%) |
|---|---|---|---|---|---|---|
| OPC | RF | 92.75 | 100.00 | 96.15 | 100.00 | 77.78 |
| SVM | 95.65 | 90.91 | 96.15 | 94.12 | 100.00 | |
| PCA | RF | 86.96 | 100.00 | 80.77 | 77.78 | 88.89 |
| SVM | 79.71 | 90.91 | 80.77 | 70.59 | 80.00 | |
| SDI | RF | 71.01 | 93.75 | 57.69 | 77.78 | 66.67 |
| SVM | 66.67 | 90.91 | 53.85 | 76.47 | 60.00 | |
| SPA | RF | 89.86 | 100.00 | 92.31 | 100.00 | 72.22 |
| SVM | 92.75 | 90.91 | 92.31 | 94.12 | 93.33 | |
| VCPA | RF | 84.06 | 87.50 | 84.62 | 88.89 | 77.78 |
| SVM | 97.10 | 100.00 | 92.31 | 100.00 | 100.00 |
| Data | Classifier | OA (%) | (%) | (%) | (%) | (%) |
|---|---|---|---|---|---|---|
| OPC | RF | 95.65 | 93.75 | 92.31 | 100.00 | 100.00 |
| SVM | 98.55 | 90.91 | 100.00 | 100.00 | 100.00 | |
| PCA | RF | 92.75 | 93.75 | 96.15 | 88.89 | 88.89 |
| SVM | 89.86 | 90.91 | 88.46 | 82.35 | 100.00 | |
| SDI | RF | 69.57 | 75.00 | 53.85 | 100.00 | 72.22 |
| SVM | 63.77 | 54.55 | 57.69 | 76.47 | 66.67 | |
| SPA | RF | 100.00 | 100.00 | 100.00 | 100.00 | 100.00 |
| SVM | 94.20 | 80.00 | 96.15 | 100.00 | 100.00 | |
| VCPA | RF | 94.20 | 100.00 | 84.62 | 100.00 | 100.00 |
| SVM | 94.20 | 81.82 | 92.31 | 100.00 | 100.00 |
| Data | Classifier | OA (%) | (%) | (%) | (%) | (%) |
|---|---|---|---|---|---|---|
| OPC | RF | 95.65 | 93.75 | 92.31 | 100.00 | 100.00 |
| SVM | 98.55 | 100.00 | 96.15 | 100.00 | 100.00 | |
| PCA | RF | 88.41 | 87.50 | 84.62 | 100.00 | 88.89 |
| SVM | 95.65 | 100.00 | 88.46 | 100.00 | 100.00 | |
| SDI | RF | 89.86 | 100.00 | 76.92 | 88.89 | 100.00 |
| SVM | 68.12 | 100.00 | 50.00 | 64.71 | 80.00 | |
| SPA | RF | 94.20 | 100.00 | 85.19 | 100.00 | 100.00 |
| SVM | 100.00 | 100.00 | 100.00 | 100.00 | 100.00 | |
| VCPA | RF | 95.65 | 93.75 | 92.31 | 100.00 | 100.00 |
| SVM | 89.86 | 90.91 | 84.62 | 88.24 | 100.00 |
| Data | Classifier | OA (%) | (%) | (%) | (%) | (%) |
|---|---|---|---|---|---|---|
| VIS | LSTM | 92.75 | 90.91 | 92.31 | 88.24 | 100.00 |
| CNN | 75.36 | 80.00 | 80.77 | 40.00 | 100.00 | |
| NIR | LSTM | 100.00 | 100.00 | 100.00 | 100.00 | 100.00 |
| CNN | 91.30 | 80.00 | 100.00 | 80.00 | 100.00 | |
| ALL | LSTM | 100.00 | 100.00 | 100.00 | 100.00 | 100.00 |
| CNN | 84.06 | 80.00 | 84.62 | 80.00 | 92.31 |
Disclaimer/Publisher’s Note: The statements, opinions and data contained in all publications are solely those of the individual author(s) and contributor(s) and not of MDPI and/or the editor(s). MDPI and/or the editor(s) disclaim responsibility for any injury to people or property resulting from any ideas, methods, instructions or products referred to in the content. |
© 2024 by the authors. Licensee MDPI, Basel, Switzerland. This article is an open access article distributed under the terms and conditions of the Creative Commons Attribution (CC BY) license (https://creativecommons.org/licenses/by/4.0/).
Share and Cite
Jia, Z.; Duan, Q.; Wang, Y.; Wu, K.; Jiang, H. Detection Model and Spectral Disease Indices for Poplar (Populus L.) Anthracnose Based on Hyperspectral Reflectance. Forests 2024, 15, 1309. https://doi.org/10.3390/f15081309
Jia Z, Duan Q, Wang Y, Wu K, Jiang H. Detection Model and Spectral Disease Indices for Poplar (Populus L.) Anthracnose Based on Hyperspectral Reflectance. Forests. 2024; 15(8):1309. https://doi.org/10.3390/f15081309
Chicago/Turabian StyleJia, Zhicheng, Qifeng Duan, Yue Wang, Ke Wu, and Hongzhe Jiang. 2024. "Detection Model and Spectral Disease Indices for Poplar (Populus L.) Anthracnose Based on Hyperspectral Reflectance" Forests 15, no. 8: 1309. https://doi.org/10.3390/f15081309
APA StyleJia, Z., Duan, Q., Wang, Y., Wu, K., & Jiang, H. (2024). Detection Model and Spectral Disease Indices for Poplar (Populus L.) Anthracnose Based on Hyperspectral Reflectance. Forests, 15(8), 1309. https://doi.org/10.3390/f15081309