
The Impact of Urban Forest Landscape on Thermal Environment Based on Deep Learning: A Case of Three Main Cities in Southeastern China

Abstract
1. Introduction
2. Methods
2.1. Study Area
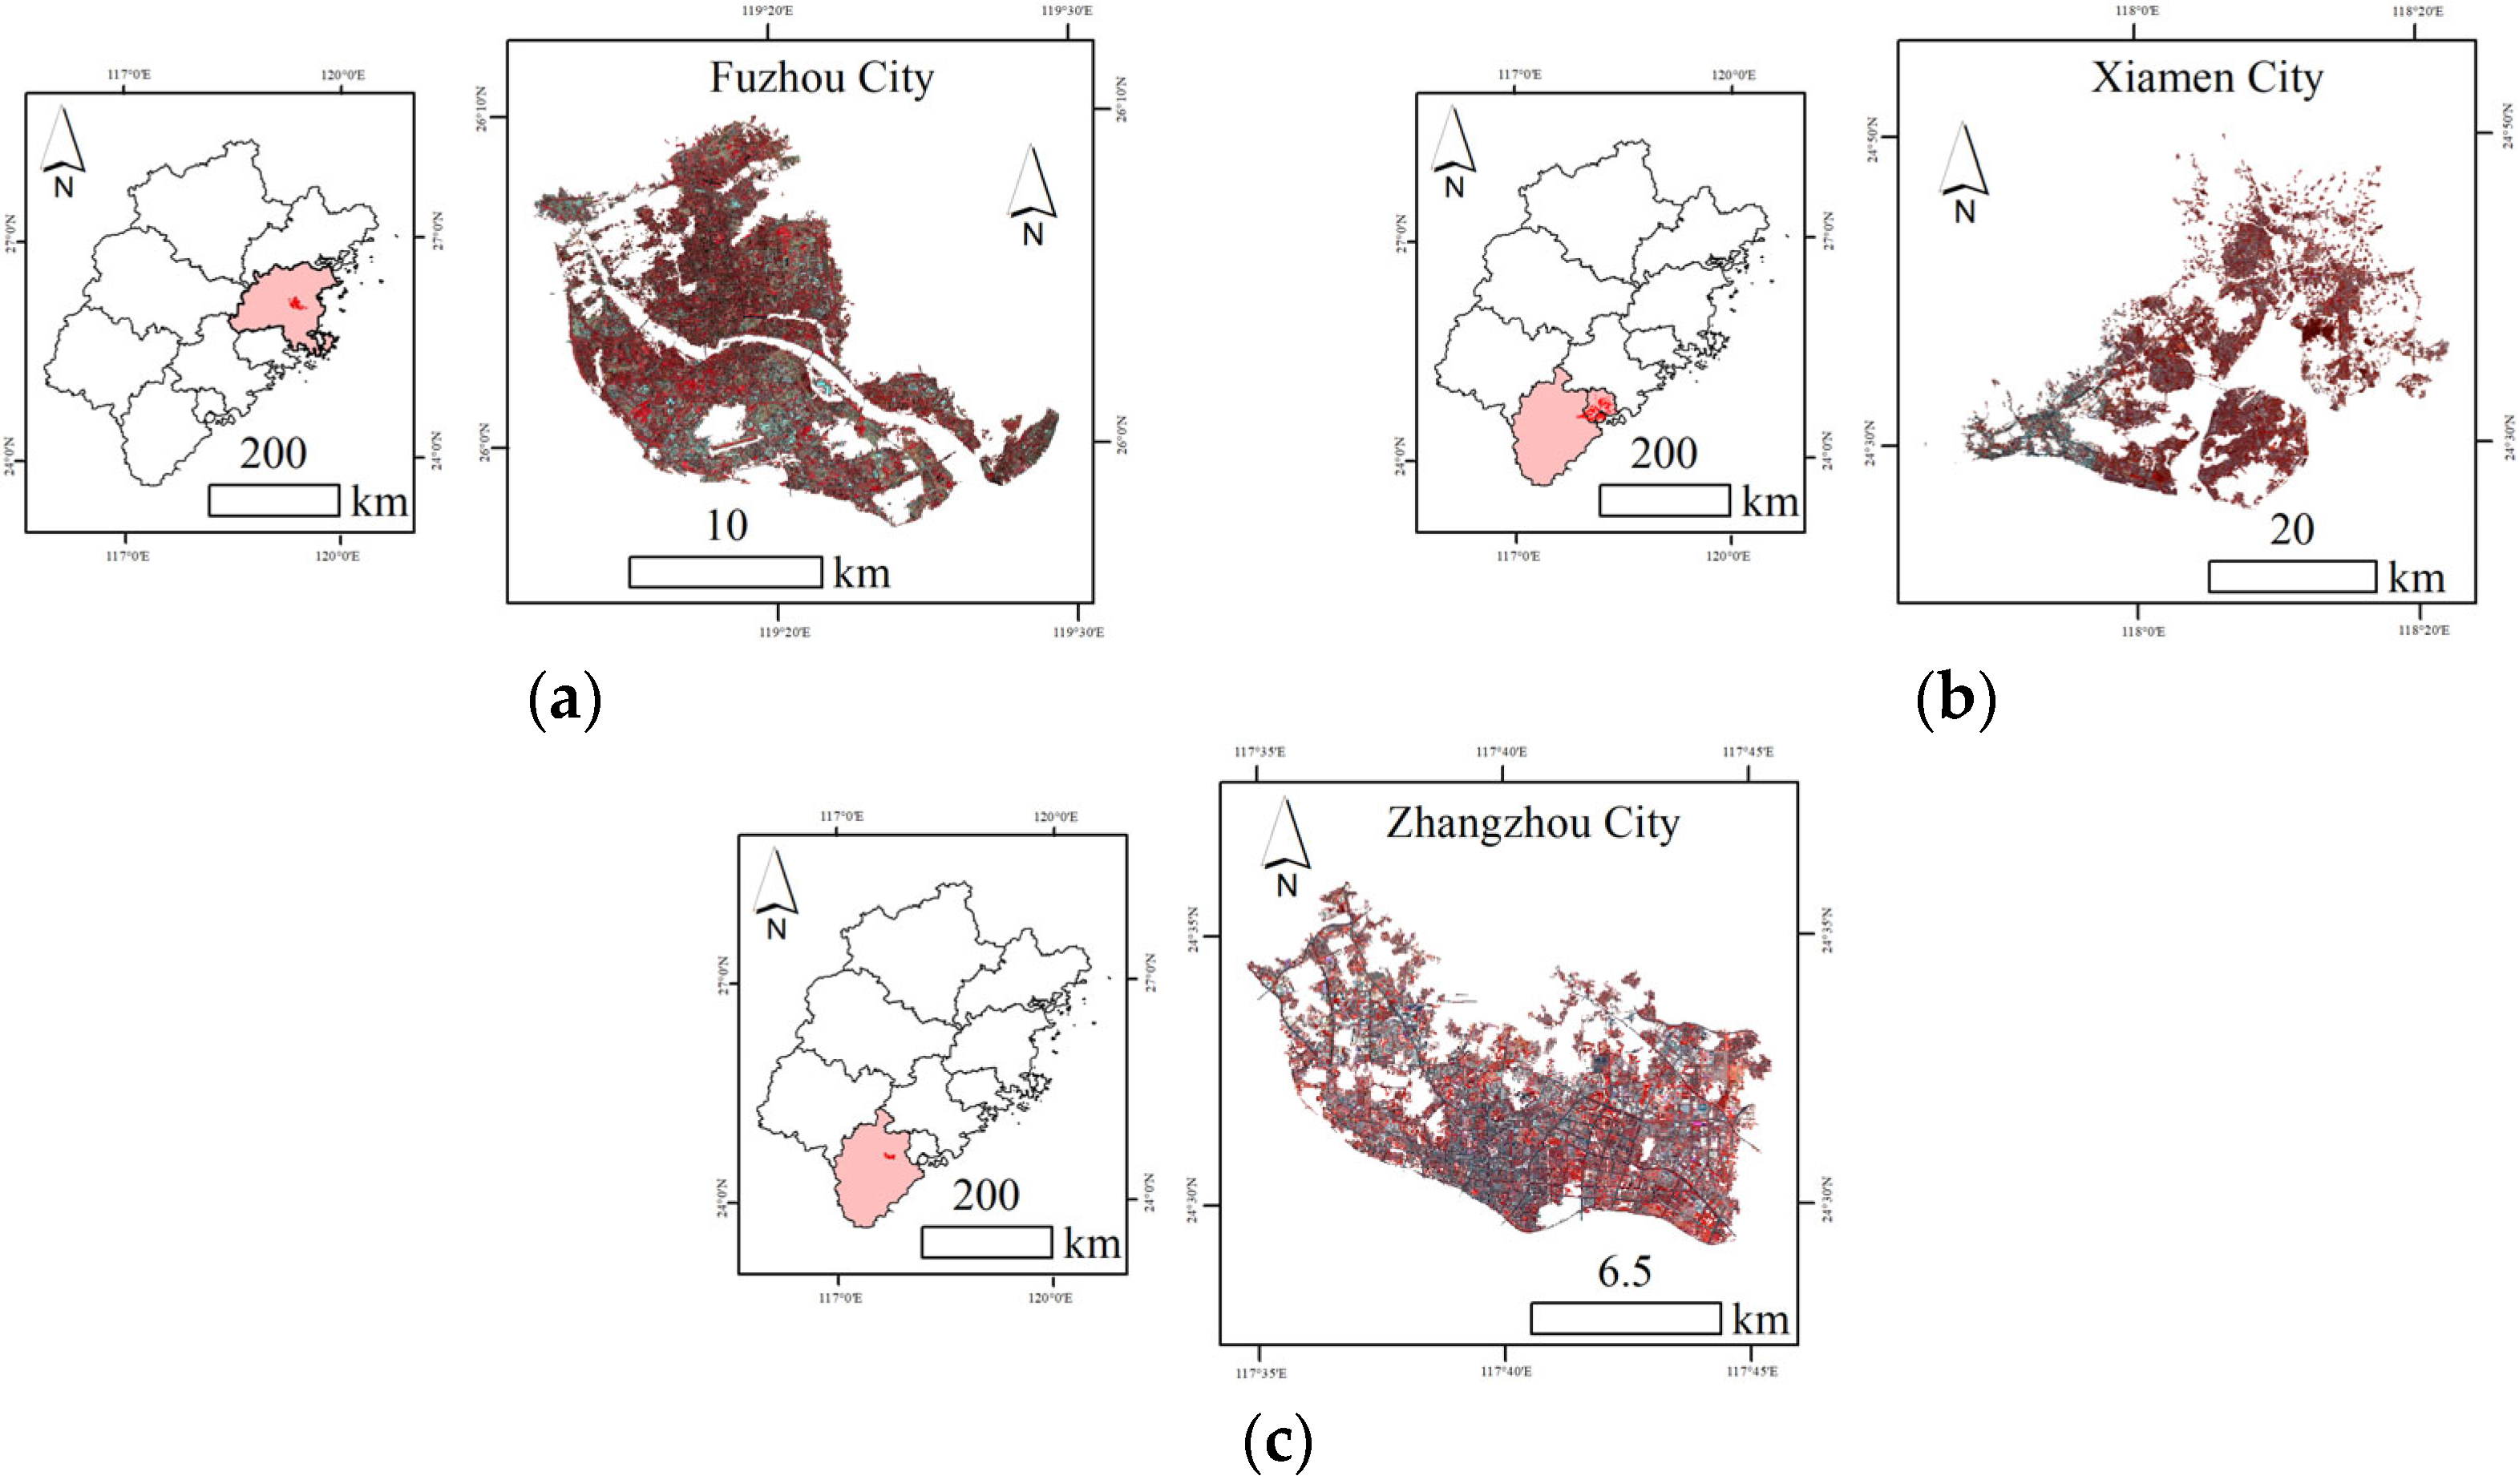
2.1.1. Application Area
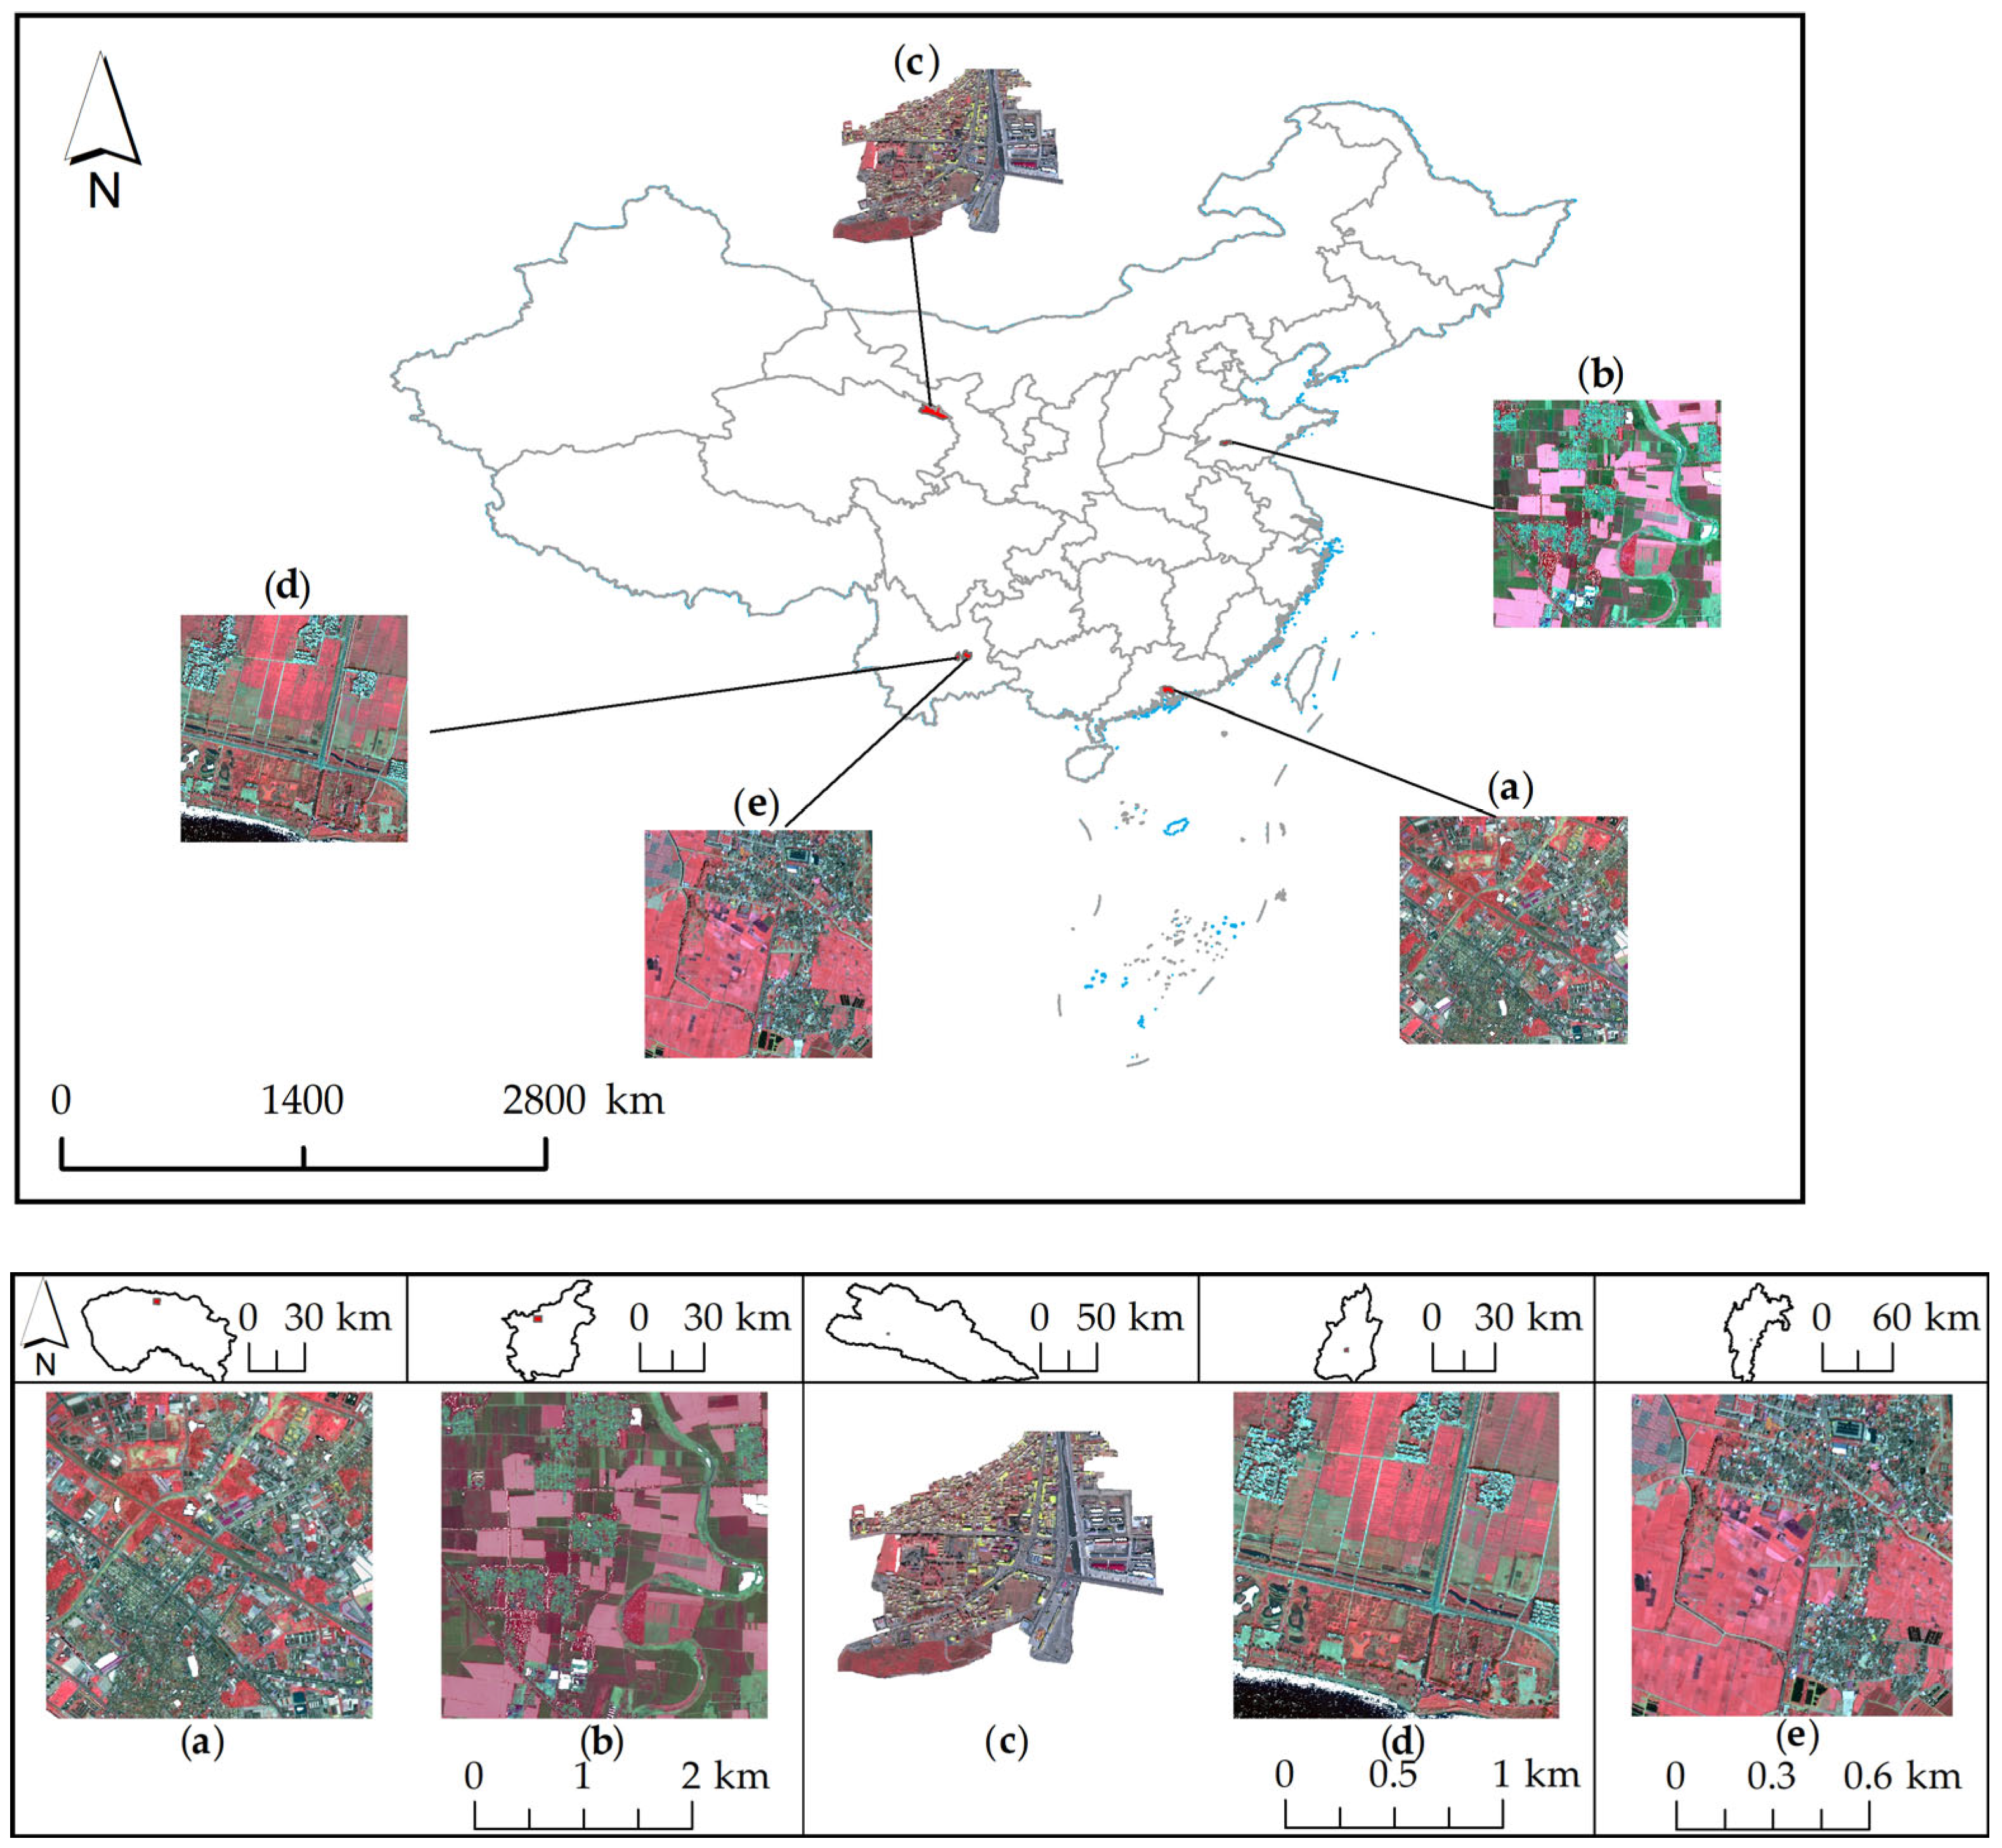
2.1.2. Training Sample Area
2.2. Deep Learning Model Framework-Based Urban Forest Extraction
2.2.1. ResSE-UNet Model Architecture
- (1)
- Integration of residual networks:
- (2)
- Incorporating attention mechanisms:
- (3)
- Overall framework:
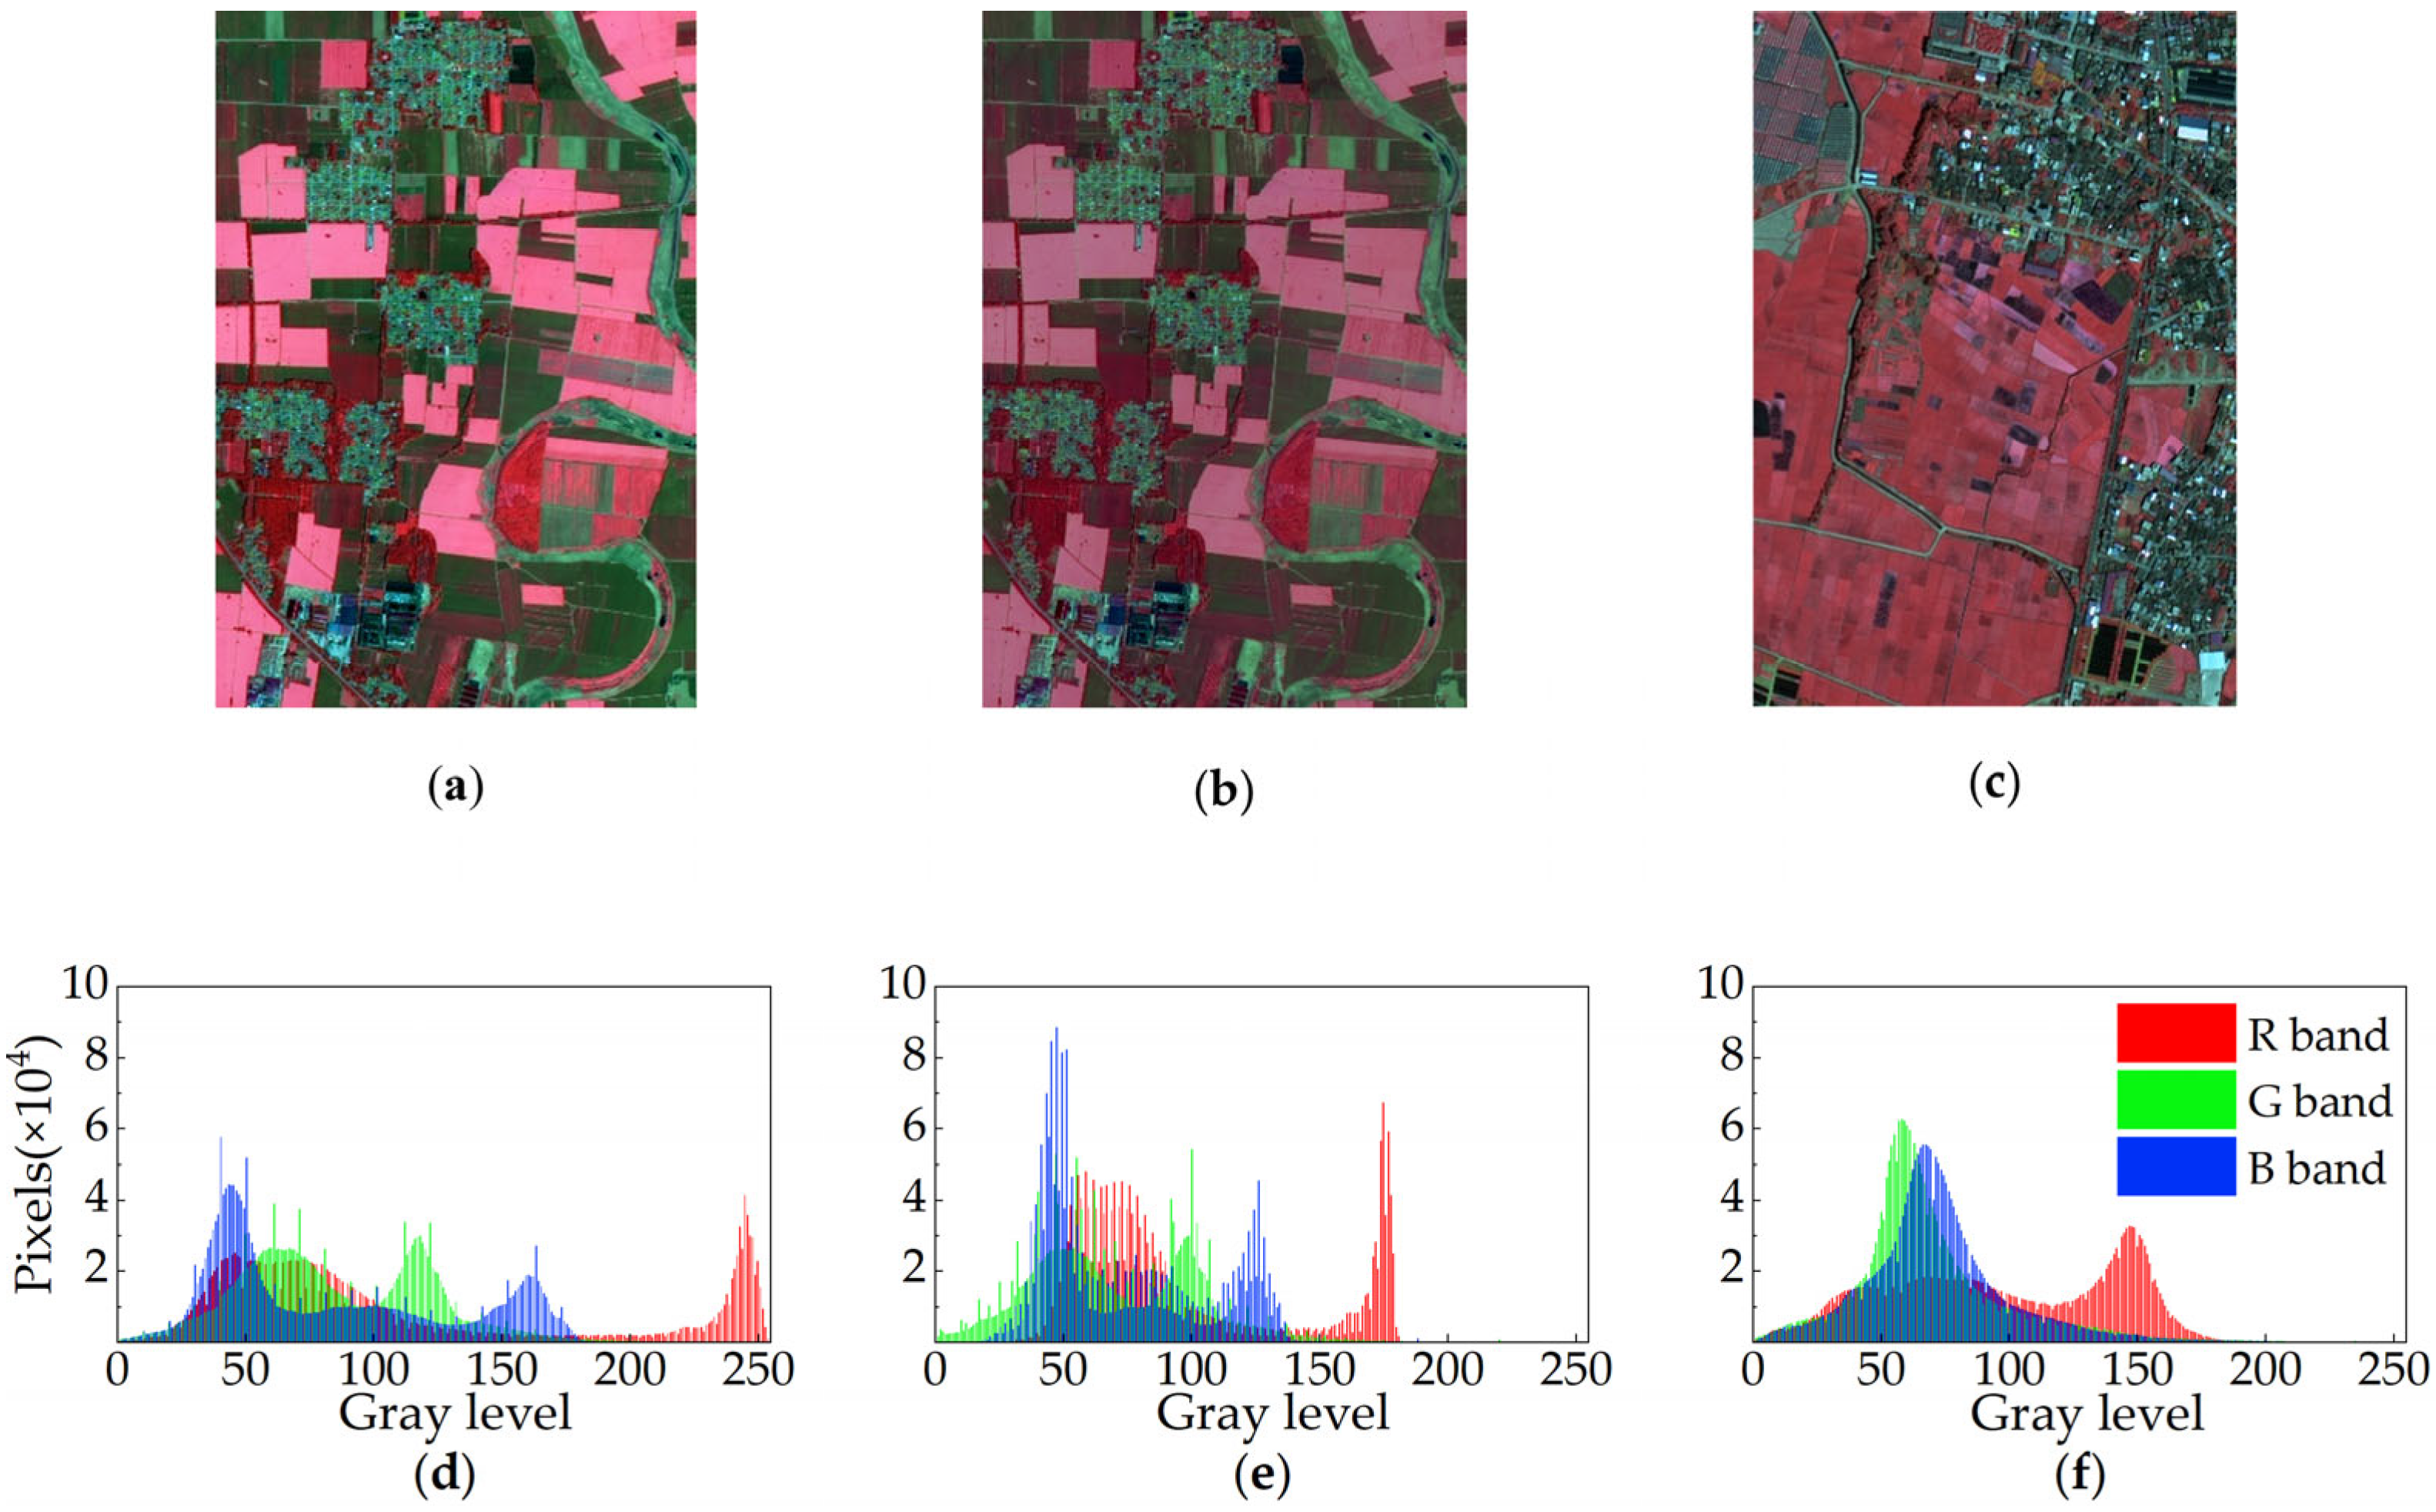
2.2.2. Relative Radiometric Correction and Other Preprocessing
2.2.3. Experimental Setup
2.3. Land Surface Temperature Retrieval
2.4. Landscape Pattern Analysis
2.5. Deep Neural Network Regression Model
3. Results
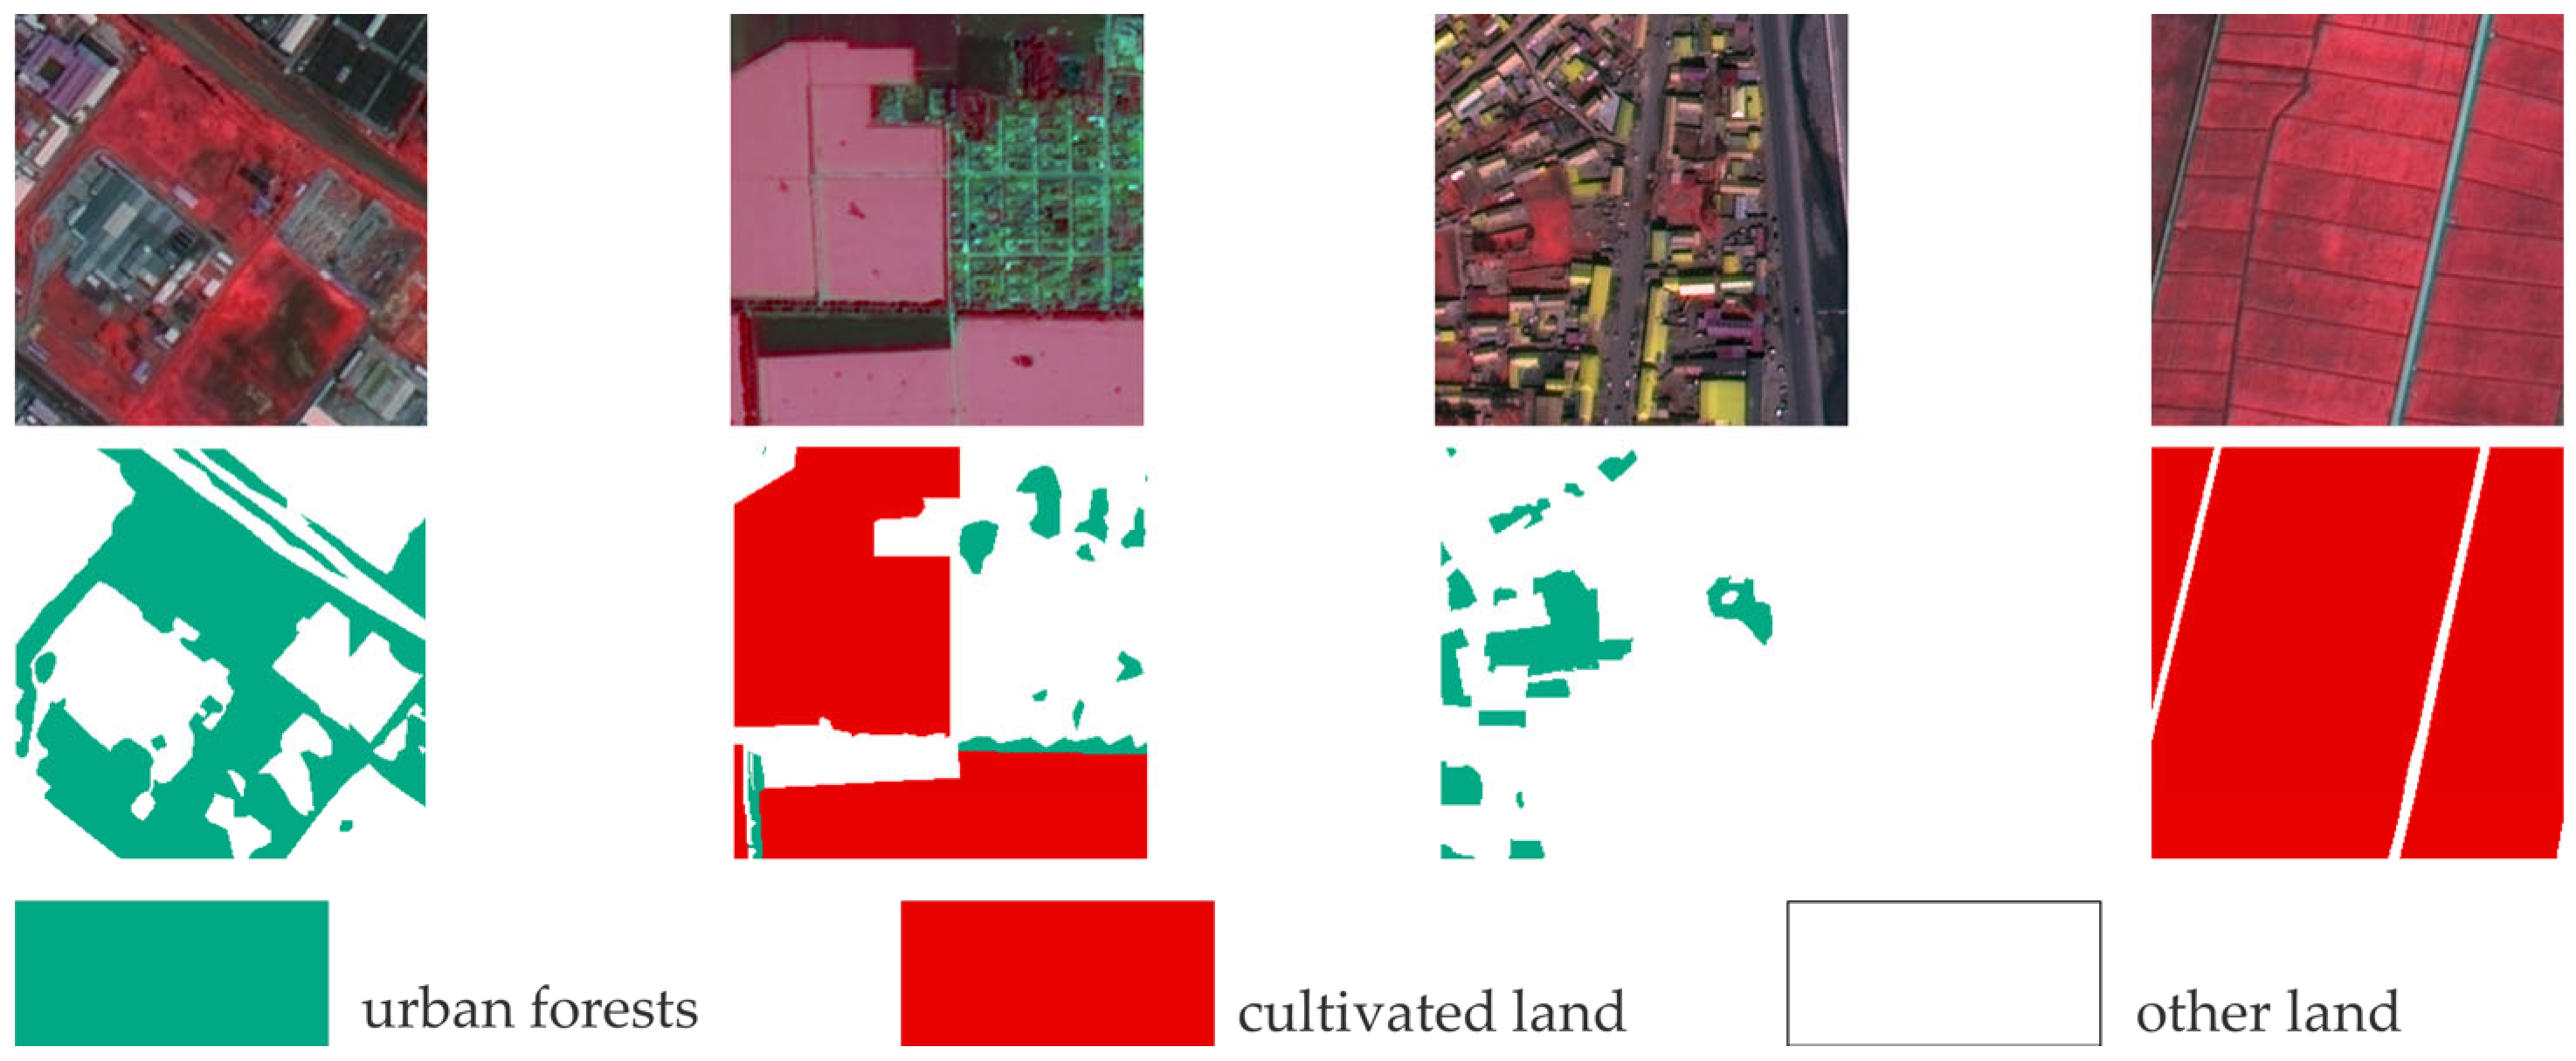
3.1. Accuracy Assessments
3.1.1. Ablation Experiments
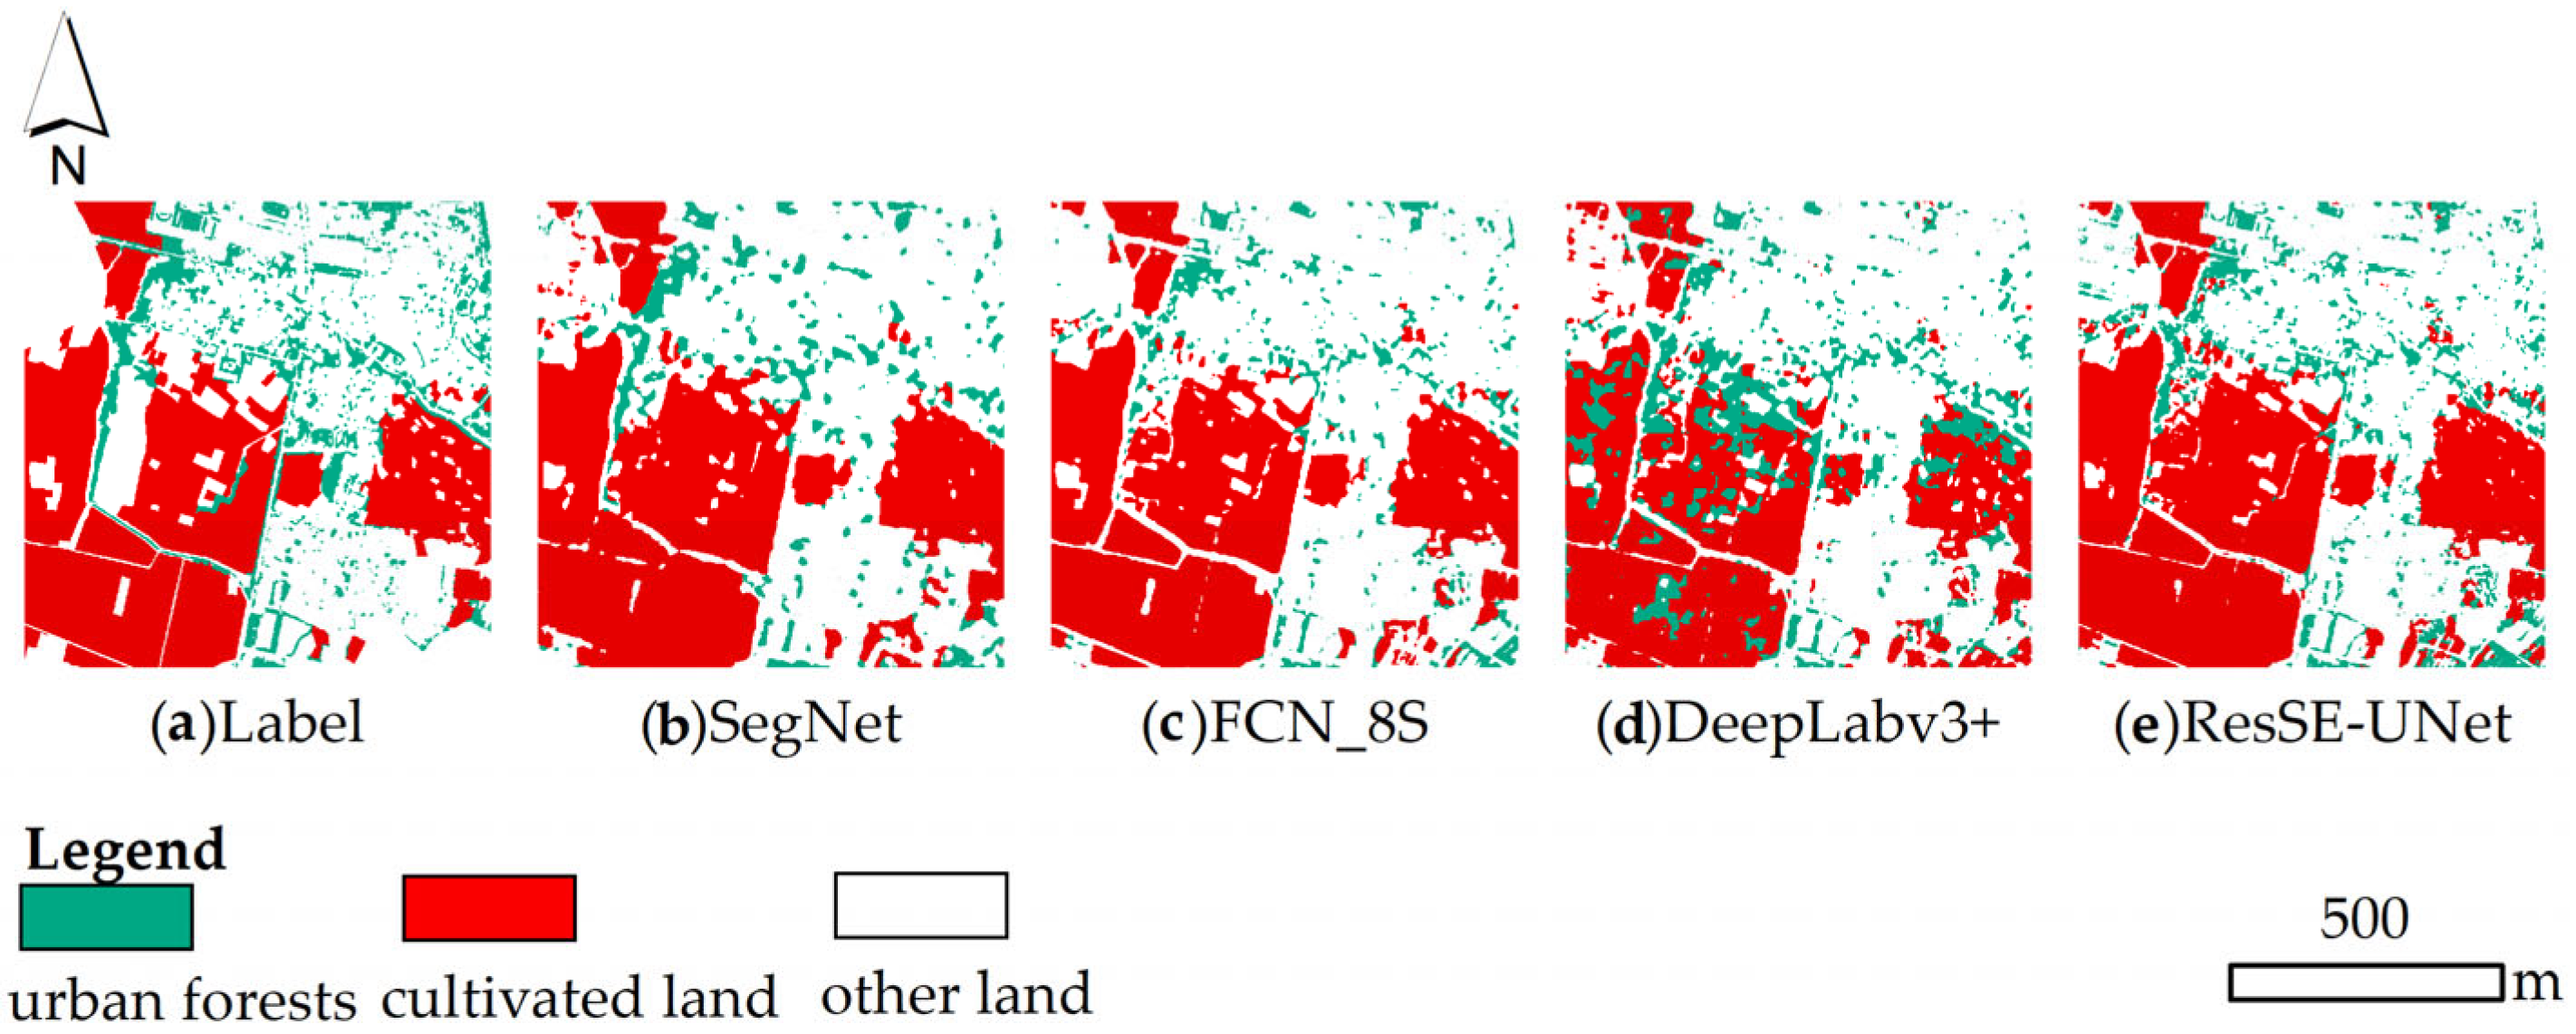
3.1.2. Comparative Experiments
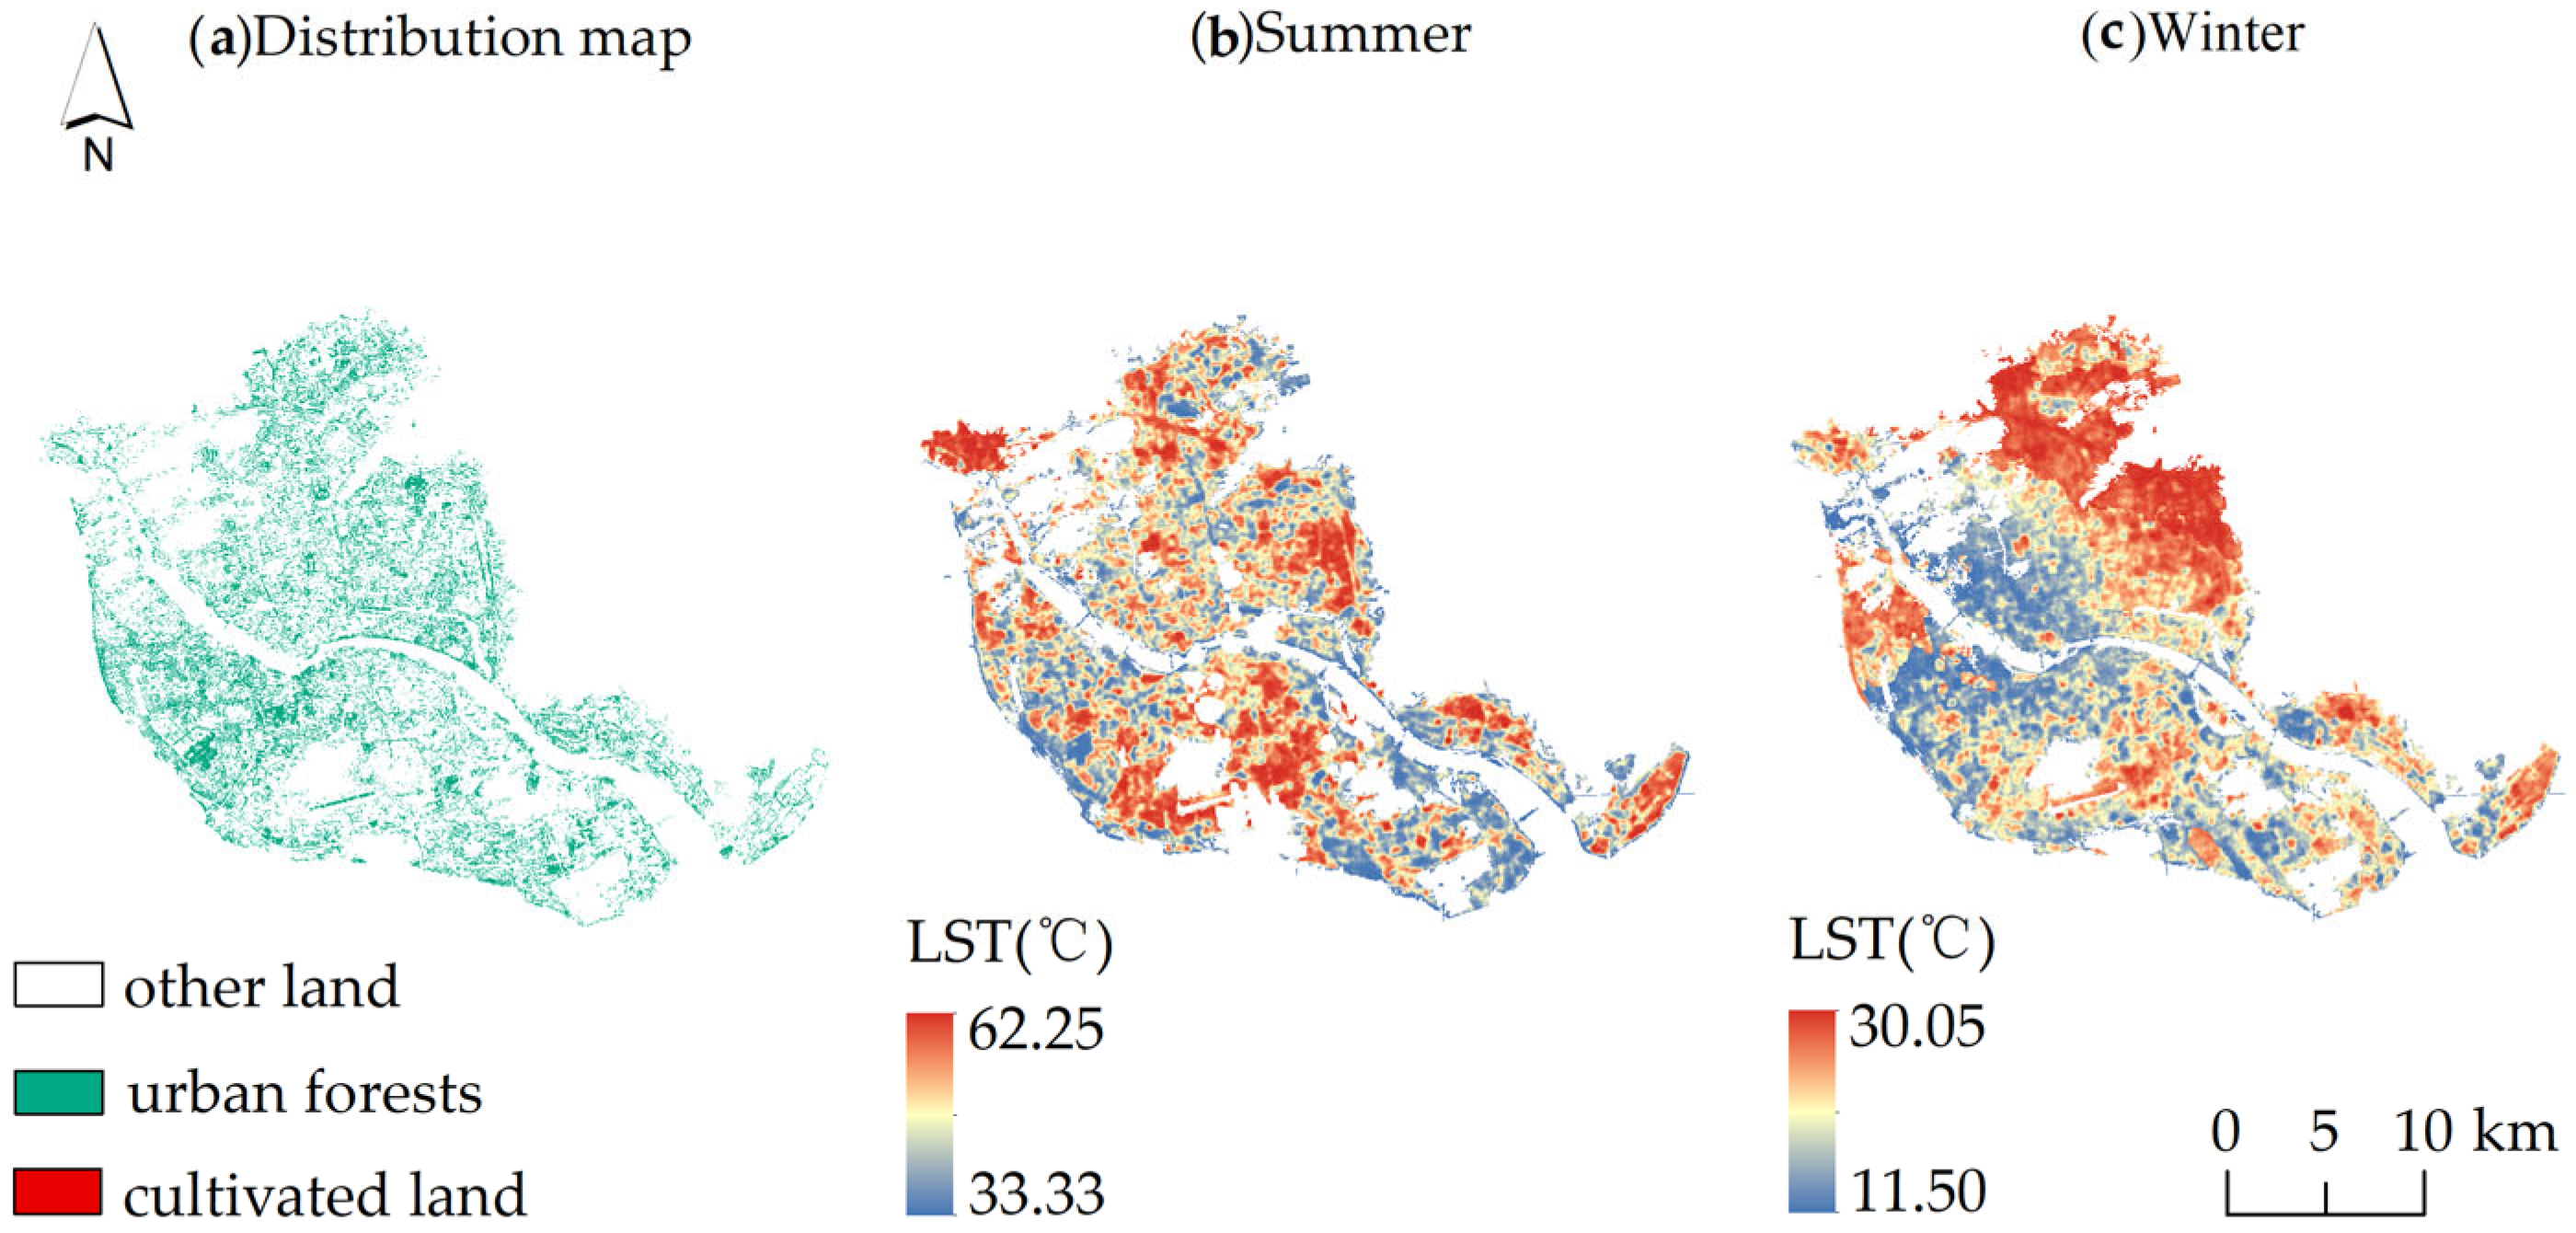
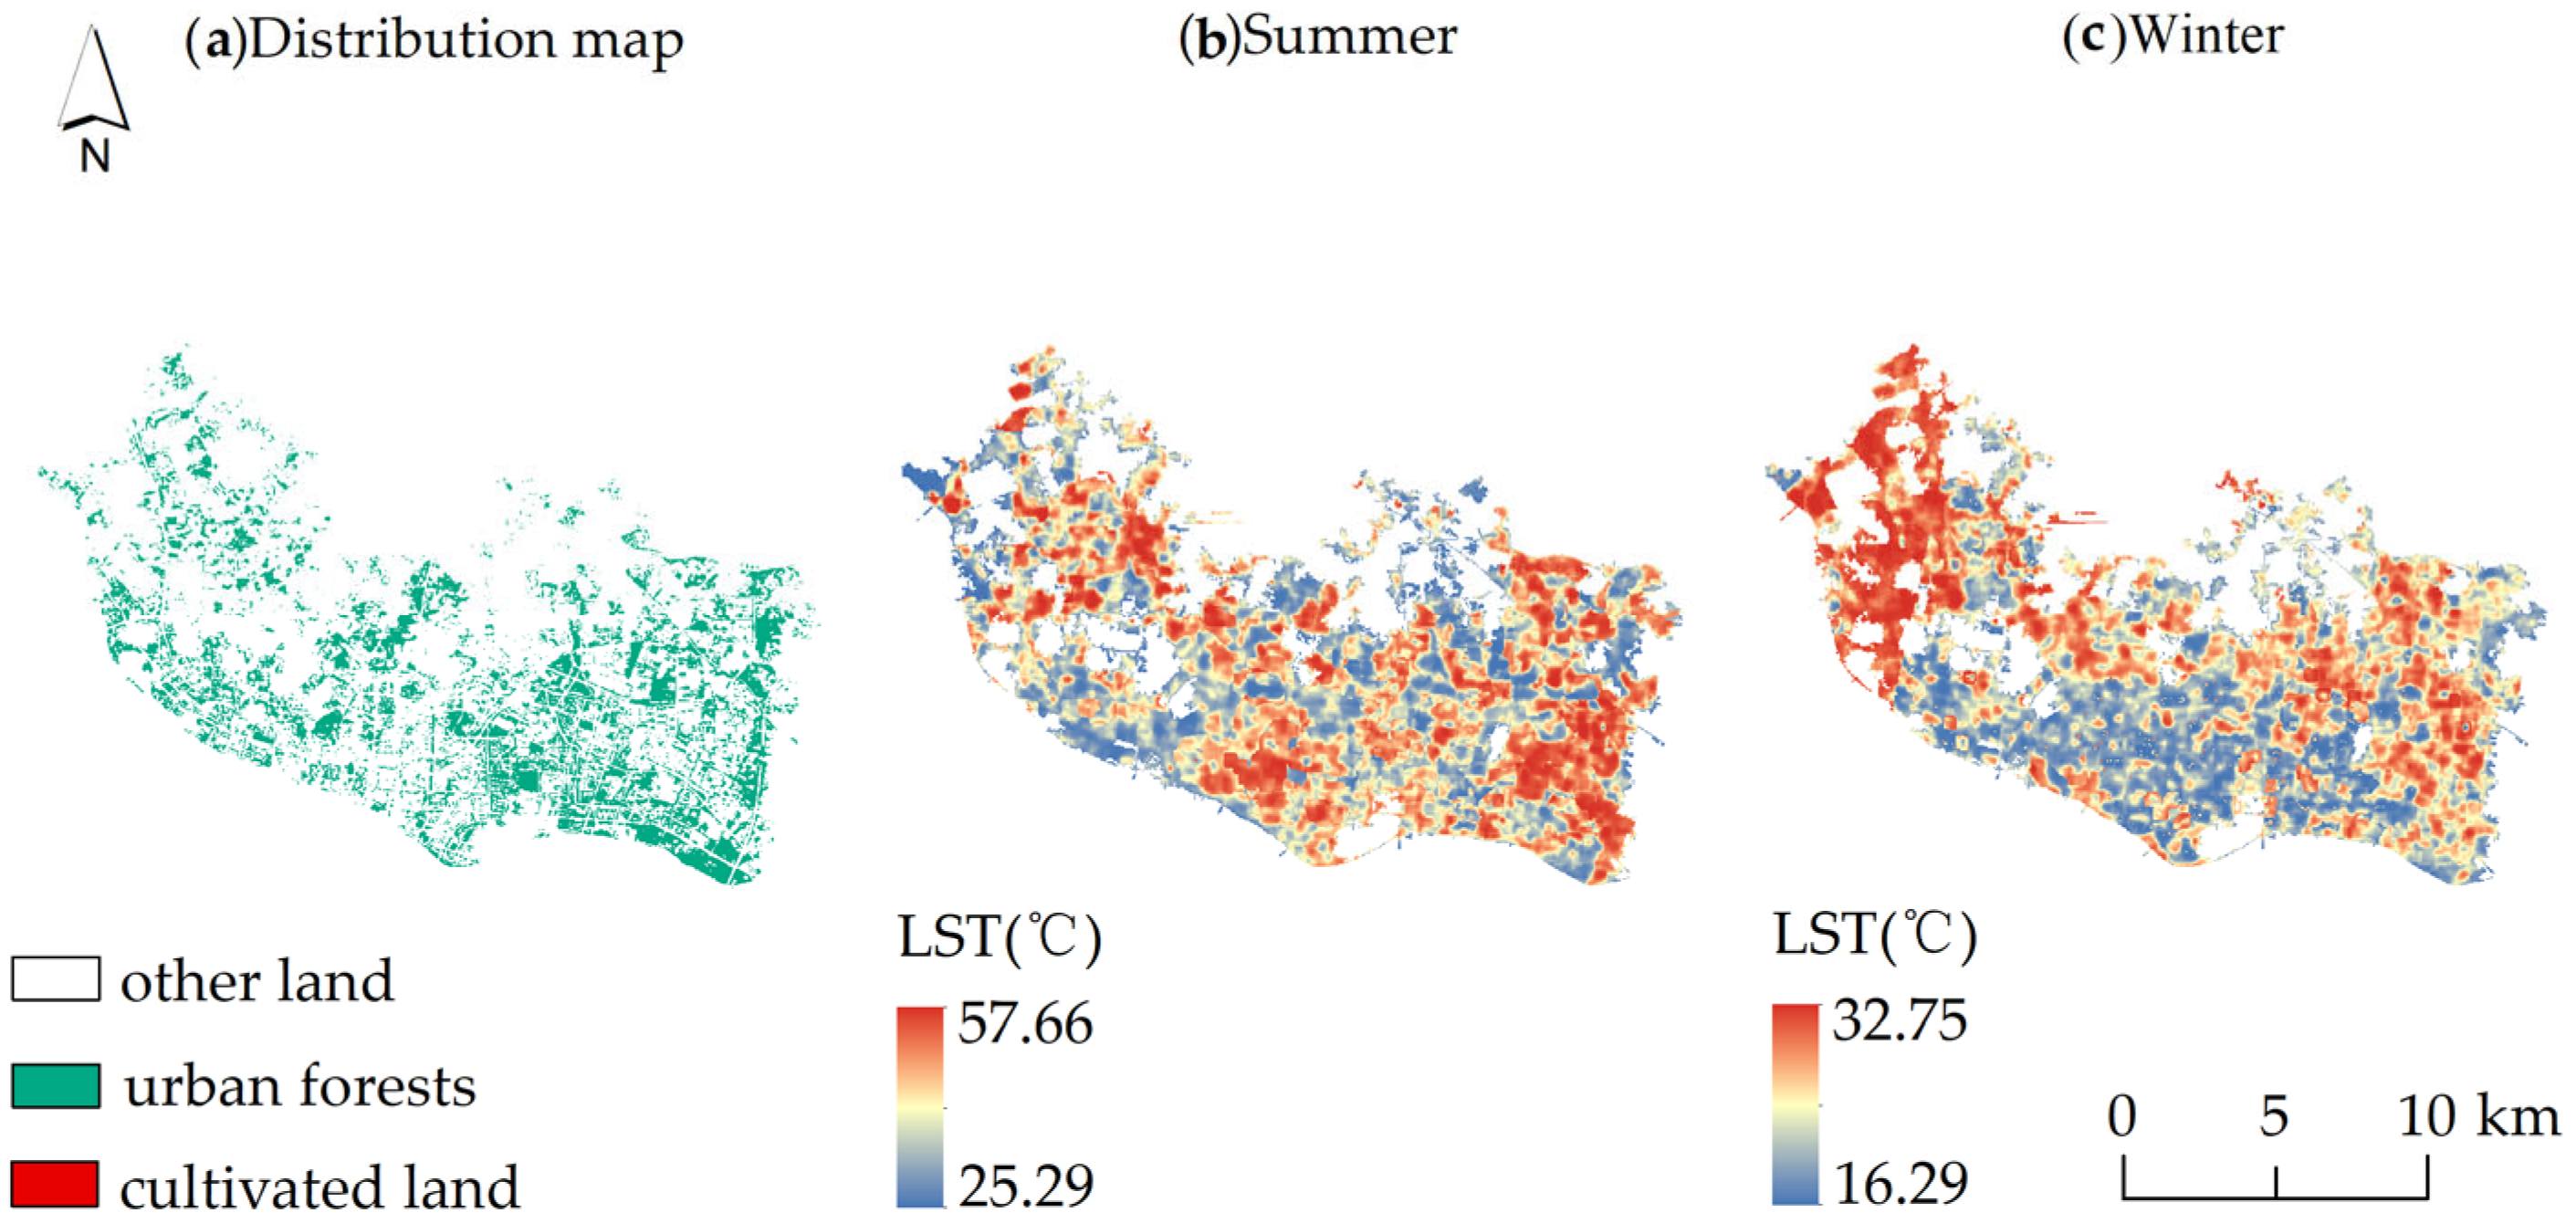
3.2. Distribution Characteristics of Urban Forests and Thermal Environment in Three Cities
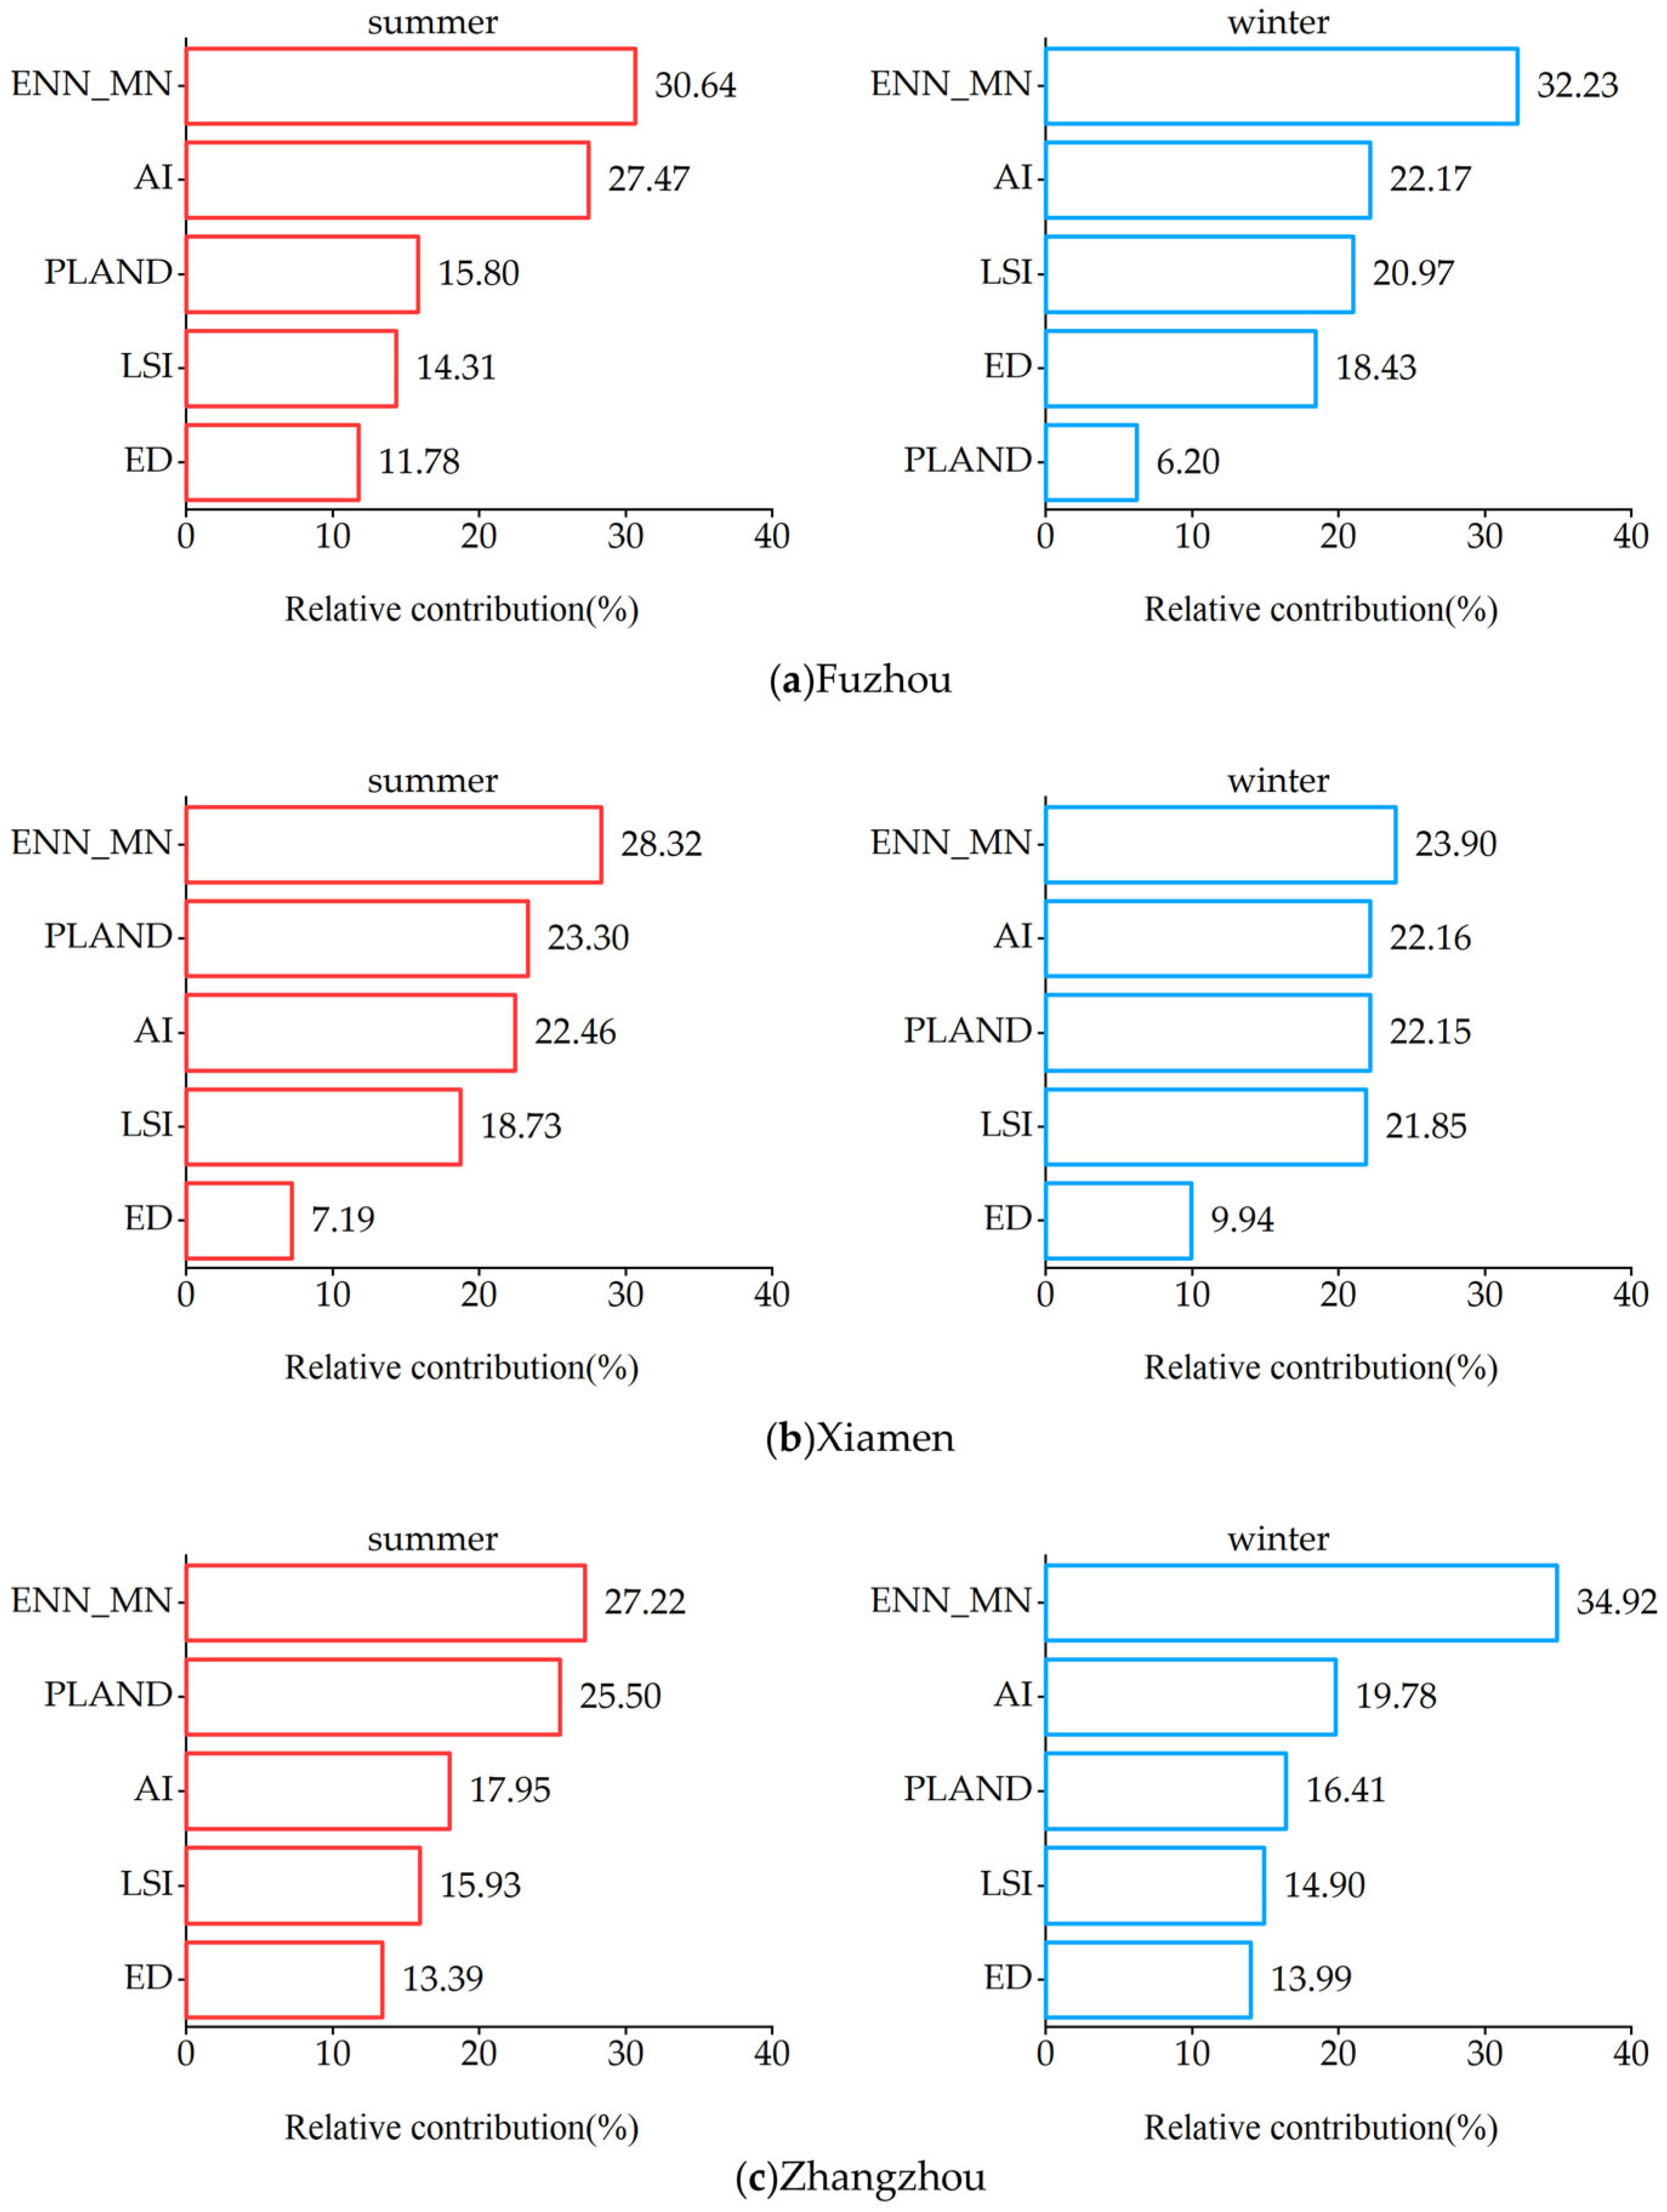
3.3. The Relative Contributions of Urban Forest Landscape Pattern Indices to Seasonal LSTs in the Three Cities
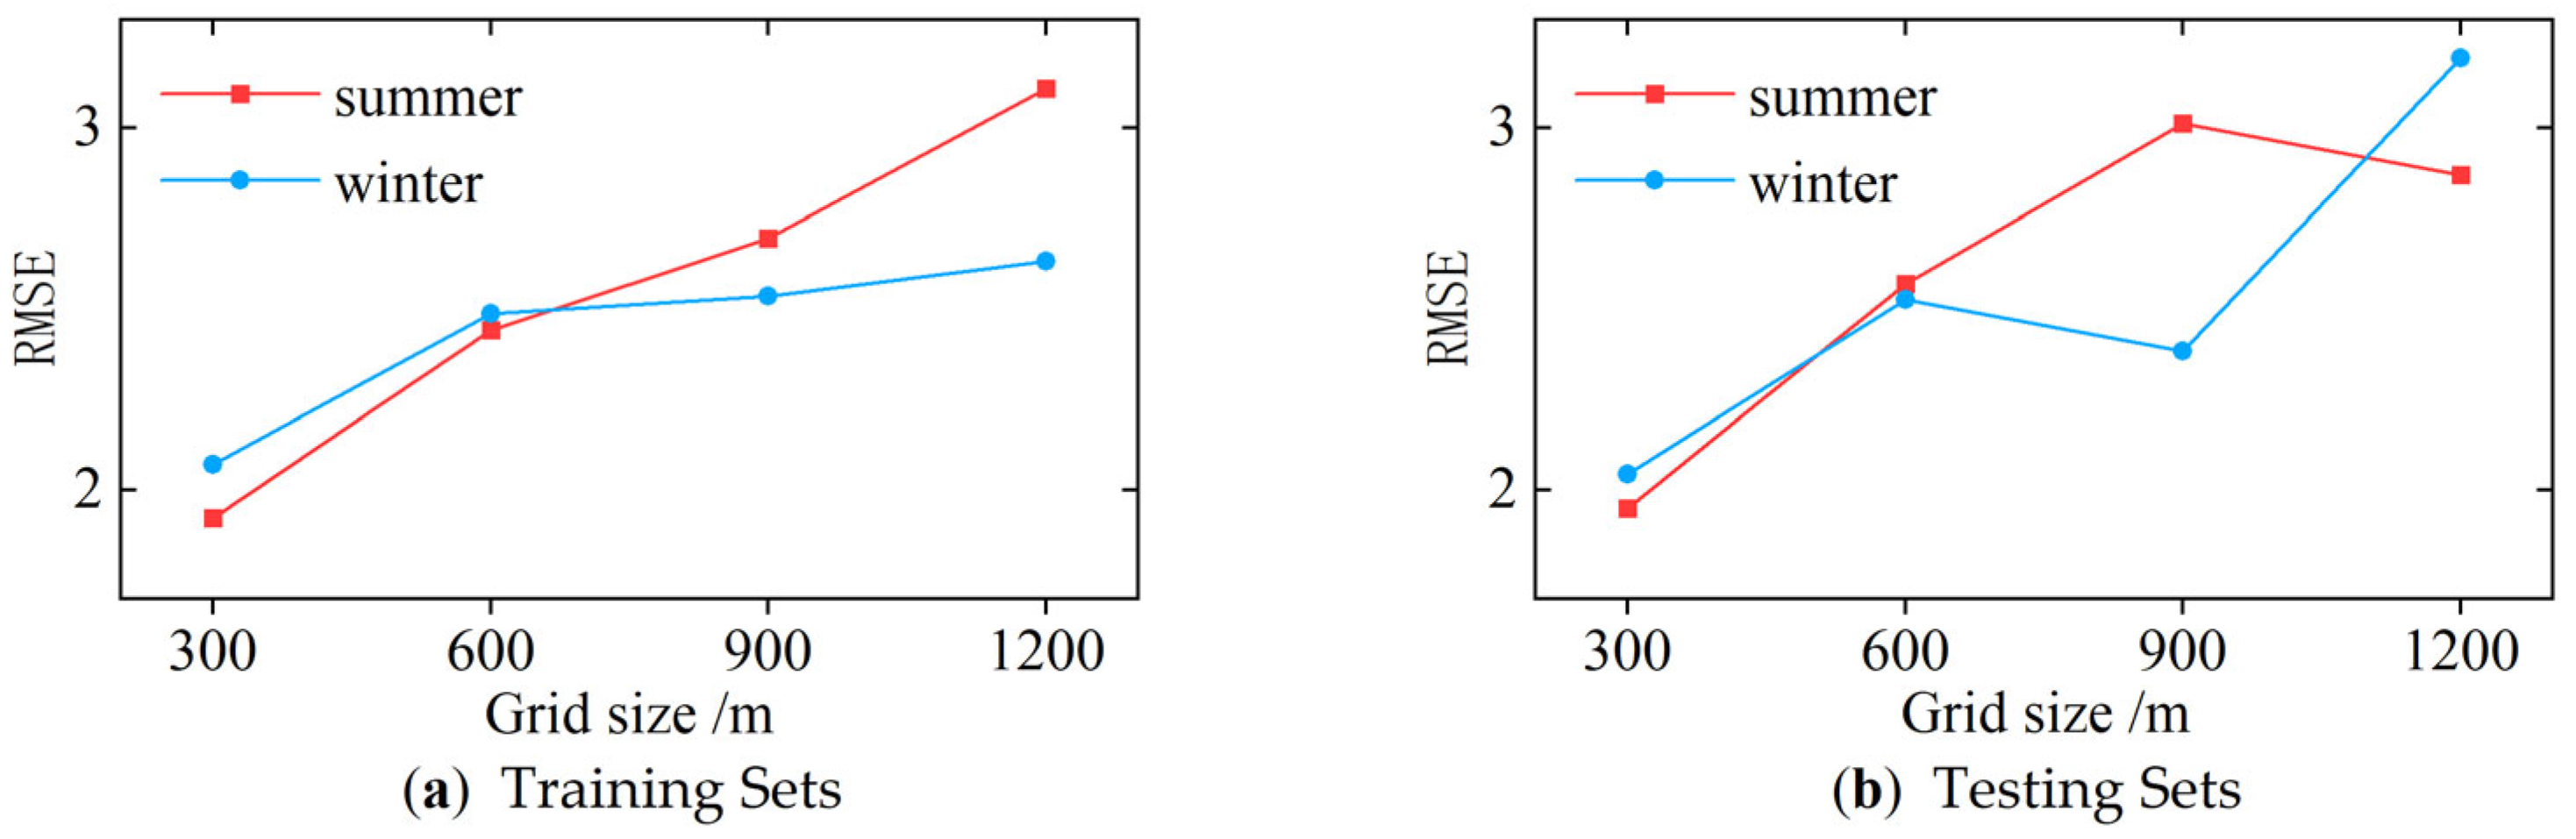
3.4. The Marginal Effects of Urban Forest Landscape Pattern Indices on Seasonal LSTs in the Three Cities
4. Discussion
4.1. The ResSE-UNet Model
4.2. Effect of Urban Forest Landscape Pattern Index on LST
4.3. Implications and Limitations
- (1)
- In this study, we focused solely on urban forests, but urban forest composition—e.g., tree species diversity, age structure, canopy coverage, and the mix of trees and shrubs—also significantly impacts the urban thermal environment. Future research will need to incorporate urban forest composition into the analysis.
- (2)
- The conclusions drawn from this study, which are based on remote sensing inversion of the urban green space thermal environment, have certain limitations. These limitations are not due to the accuracy of remote sensing inversion but stem from the fundamental differences between surface temperature and air temperature [55]. On the one hand, the mechanisms of surface temperature and air temperature differ; air temperature changes more rapidly than surface temperature and is more influenced by atmospheric movements, weather, and radiative convection. Consequently, it is necessary to investigate whether studies based on air temperature will yield similar or opposite conclusions to those based on surface temperature, such as optimal research scales, relative importance, and threshold characteristics. The conclusions of these two types of studies should not be conflated and require further exploration. On the other hand, as thermal comfort research advances, human comfort has become an important metric for assessing the cooling effects of green spaces. Air temperature serves as a direct indicator in this context and shows greater research value compared to surface temperature. For instance, Schatz et al. [56] used continuous temperature measurements from 151 fixed sensors to characterize the thermal environment of different land cover types throughout the year. However, conducting large-scale thermal environment studies based on air temperature is challenging due to the time, manpower, and financial costs involved. Notably, some researchers have developed models to estimate near-surface air temperature from surface temperature, combining remote sensing with field measurements [57]. This method could facilitate a more comprehensive understanding of the interactions and mechanisms between air temperature and the thermal environment of green spaces.
- (3)
- This study selected only one region with data collected from different sensors for validation, resulting in a limited number of validation areas. Future research should focus on examining the model’s transferability across more validation areas with different sensor types and geographical factors. Additionally, this study utilized visual interpretation instead of field surveys. Although field surveys for recording urban forest labels require a significant amount of labor, they offer greater accuracy and rigor compared to our visual interpretation. In the future, we will consider incorporating this method for label construction.
- (4)
- In regions of low spectral value and similar spectral zones, the ResSE-UNet architecture proposed in this paper, like other popular semantic segmentation models, exhibits some misclassifications and omissions. The performance of deep learning models is intimately connected to the quality of sample data. Considering the effective number of bands in high-resolution satellites, future efforts might involve augmenting the number of sample data channels, such as incorporating vegetation features and texture characteristics to enhance models’ extraction accuracy.
- (5)
- We focused solely on the summer (June to September) and winter (December to March) seasons as the periods of interest. In the future, we plan to include spring and autumn, representing the transitional seasons from cold to warm and vice versa, respectively.
- (6)
- We did not consider factors such as vertical greening and rooftop gardens—i.e., small green spaces—within the context of limited urban land resources. Properly establishing these small green spaces could increase the total urban forest cover and, combined with ventilation corridors and hydrological conditions, amplify the cooling effects of forests, thereby benefiting the optimization of urban heat environments. Finally, we only considered the impact of urban forests on the thermal environment. Moving forward, we plan to extend our research to encompass other elements, such as bodies of water.
5. Conclusions
Supplementary Materials
Author Contributions
Funding
Data Availability Statement
Acknowledgments
Conflicts of Interest
References
- Santamouris, M.; Kolokotsa, D. Passive cooling dissipation techniques for buildings and other structures: The state of the art. Energy Build. 2013, 57, 74–94. [Google Scholar] [CrossRef]
- Dong, Y.; Liu, H.; Qi, J. Progress of Studies on the Relationship between Urban Green Space and Public Health. Urban Plan. Int. 2020, 35, 70–79. [Google Scholar] [CrossRef]
- Chiesura, A. The role of urban parks for the sustainable city. Landsc. Urban Plan. 2004, 68, 129–138. [Google Scholar] [CrossRef]
- Bowler, D.E.; Buyung-Ali, L.; Knight, T.M.; Pullin, A.S. Urban greening to cool towns and cities: A systematic review of the empirical evidence. Landsc. Urban Plan. 2010, 97, 147–155. [Google Scholar] [CrossRef]
- Chang, C.; Li, M.; Chang, S. A preliminary study on the local cool-island intensity of Taipei city parks. Landsc. Urban Plan. 2007, 80, 386–395. [Google Scholar] [CrossRef]
- Yuan, Z.; Wu, X.; Zang, S.; Wu, C.; Li, M. Cooling Effect of Green Patche Based on TM Image in Harbin Downtown City. Sci. Geogr. Sin. 2017, 37, 1600–1608. [Google Scholar] [CrossRef]
- Jiao, M.; Zhou, W.; Qian, Y.; Wang, J.; Zheng, Z.; Hu, X.; Wang, W. Influences of patch size on the cooling capacity of urban greenspace: Progresses, problems and perspectives. Acta Ecol. Sin. 2021, 41, 9154–9163. [Google Scholar] [CrossRef]
- Li, K.; Li, X.; Yao, K. Outdoor thermal environments of main types of urban areas during summer: A field study in Wuhan, China. Sustainability 2022, 14, 952. [Google Scholar] [CrossRef]
- Lai, Y.; Ning, Q.; Ge, X.; Fan, S. Thermal regulation of coastal urban forest based on Envi-Met Model—A case study in Qinhuangdao, China. Sustainability 2022, 14, 7337. [Google Scholar] [CrossRef]
- Du, H.; Cai, W.; Xu, Y.; Wang, Z.; Wang, Y.; Cai, Y. Quantifying the cool island effects of urban green spaces using remote sensing Data. Urban For. Urban Green. 2017, 27, 24–31. [Google Scholar] [CrossRef]
- Wang, X.; Wei, X.; Zou, H. Research progress about the impact of urban green space spatial pattern on urban heat island. Ecol. Environ. Sci. 2020, 29, 1904–1911. [Google Scholar] [CrossRef]
- Yao, L.; Li, T.; Xu, M.; Xu, Y. How the landscape features of urban green space impact seasonal land surface temperatures at a city-block-scale: An urban heat island study in Beijing, China. Urban For. Urban Green. 2020, 52, 126704. [Google Scholar] [CrossRef]
- Zhou, W.; Cao, F.; Zhang, R.; Wang, G. Multi-scale analysis of the effects of green space pattern on the urban surface thermal environment. J. Nanjing For. Univ. (Nat. Sci. Ed.) 2020, 44, 134–142. [Google Scholar] [CrossRef]
- Wang, Y.; Huang, J.; Chen, C.; Shen, J.; Sheng, S. The cooling intensity dependent on landscape complexity of green infrastructure in the metropolitan area. J. Environ. Eng. Landsc. Manag. 2021, 29, 318–336. [Google Scholar] [CrossRef]
- Kianmehr, A.; Lim, T.C.; Li, X. Comparison of different spatial temperature data sources and resolutions for use in understanding intra-urban heat variation. Sustain. Cities Soc. 2023, 96, 104619. [Google Scholar] [CrossRef]
- Wang, C.; Ren, Z.; Chang, X.; Wang, G.; Hong, X.; Dong, Y.; Guo, Y.; Zhang, P.; Ma, Z.; Wang, W. Understanding the cooling capacity and its potential drivers in urban forests at the single tree and cluster scales. Sustain. Cities Soc. 2023, 93, 104531. [Google Scholar] [CrossRef]
- Liu, J.; Liu, S.; Tang, X.; Ding, Z.; Ma, M.; Yu, P. The response of land surface temperature changes to the vegetation dynamics in the Yangtze River Basin. Remote Sens. 2022, 14, 5093. [Google Scholar] [CrossRef]
- Shen, W.; He, J.; He, T.; Hu, X.; Tao, X.; Huang, C. Biophysical effects of afforestation on land surface temperature in Guangdong Province, southern China. J. Geophys. Res. Biogeosciences 2022, 127, e2022JG006913. [Google Scholar] [CrossRef]
- Liu, Y.; Huang, X.; Yang, Q.; Cao, Y. The turning point between urban vegetation and artificial surfaces for their competitive effect on land surface temperature. J. Clean. Prod. 2021, 292, 126034. [Google Scholar] [CrossRef]
- Zylshal; Sulma, S.; Yulianto, F.; Nugroho, J.T.; Sofan, P. A support vector machine object based image analysis approach on urban green space extraction using Pleiades-1A imagery. Model. Earth Syst. Environ. 2016, 2, 54. [Google Scholar] [CrossRef]
- Xu, L.; Ming, D.; Zhou, W.; Bao, H.; Chen, Y.; Ling, X. Farmland extraction from high spatial resolution remote sensing images based on stratified scale pre-estimation. Remote Sens. 2019, 11, 108. [Google Scholar] [CrossRef]
- Zujovic, J.; Pappas, T.N.; Neuhoff, D.L. Structural texture similarity metrics for image analysis and retrieval. IEEE Trans. Image Process. 2013, 22, 2545–2558. [Google Scholar] [CrossRef]
- Ronneberger, O.; Fischer, P.; Brox, T. U-Net: Convolutional Networks for Biomedical Image Segmentation. In Medical Image Computing and Computer-Assisted Intervention—MICCAI 2015; Springer: Berlin/Heidelberg, Germany, 2015. [Google Scholar] [CrossRef]
- Zhang, Z.; Liu, Q.; Wang, Y. Road Extraction by Deep Residual U-Net. IEEE Geosci. Remote Sens. Lett. 2018, 15, 749–753. [Google Scholar] [CrossRef]
- Leng, S.; Qiao, J.; Wang, L.; Wang, J.; Zou, L. Rapid Qualitative Analysis of Wool Content Based on Improved U-Net++and Near-Infrared Spectroscopy. Spectrosc. Spectr. Anal. 2023, 43, 303–309. [Google Scholar] [CrossRef]
- Zhou, Z.; Siddiquee, M.M.R.; Tajbakhsh, N.; Liang, J. UNet++: Redesigning Skip Connections to Exploit Multiscale Features in Image Segmentation. IEEE Trans. Med. Imaging 2020, 39, 1856–1867. [Google Scholar] [CrossRef]
- Shi, T.; Guo, Z.; Yan, X.; Wei, T. Water body segmentation in remote sensing images based on multi-scale fusion attention module improved UNet. Chin. J. Liq. Cryst. Disp. 2023, 38, 397–408. [Google Scholar] [CrossRef]
- Li, J.; Qiao, R.; Wang, X.; Lv, X. Effect of Green Space on Urban Thermal Environment and Seasonal Variations: A Case Study based on the Main Urban Area of Hefei. South Archit. 2023, 12, 40–48. [Google Scholar] [CrossRef]
- Shi, Q.; Liu, M.; Marinoni, A.; Liu, X. UGS-1m: Fine-grained urban green space mapping of 34 major cities in China based on the deep learning framework. Earth Syst. Sci. Data Discuss. 2022, 2022, 555–577. [Google Scholar] [CrossRef]
- He, K.; Zhang, X.; Ren, S.; Sun, J. Deep Residual Learning for Image Recognition. In Proceedings of the IEEE Conference on Computer Vision and Pattern Recognition (CVPR), Las Vegas, NV, USA, 27–30 June 2016. [Google Scholar] [CrossRef]
- Hu, J.; Shen, L.; Sun, G. Squeeze-and-Excitation Networks. In Proceedings of the IEEE Conference on Computer Vision and Pattern Recognition (CVPR), Salt Lake City, UT, USA, 18–23 June 2018; pp. 7132–7141. [Google Scholar] [CrossRef]
- Cai, Z.; He, Z.; Wang, W.; Yang, Q.; Wei, H.; Wang, C.; Xu, B. Mapping cropland at metric resolution using the spatiotemporal information from multi-source GF satellite data. J. Remote Sens. 2022, 26, 1368–1382. [Google Scholar] [CrossRef]
- Jiang, Y.; Zhang, L.; Yan, M.; Qi, J.; Fu, T.; Fan, S.; Chen, B. High-resolution mangrove forests classification with machine learning using worldview and UAV hyperspectral data. Remote Sens. 2021, 13, 1529. [Google Scholar] [CrossRef]
- Fan, W.; Sun, S.; Wang, J. Comparison of Relative Radiometric Correction Methods for Multi-temporal Remote Sensing Imagery. Remote Sens. Inf. 2016, 31, 142–149. [Google Scholar] [CrossRef]
- Dun, Y.; Zhang, L.; Yan, L.; Wu, T.; Liu, Y.; Tong, S. Relative radiometric correction methods for remote sensing images and their applicability analysis. J. Remote Sens. 2014, 18, 597–617. [Google Scholar] [CrossRef]
- Xu, Z.; Zhou, Y.; Wang, S.; Wang, L.; Wang, Z. U-Net for urban green space classification in Gaofen-2 remote sensing images. J. Image Graph. 2021, 26, 700–713. [Google Scholar] [CrossRef]
- Tian, X.; Wang, L.; Ding, Q. Review of Image Semantic Segmentation Based on Deep Learning. J. Softw. 2019, 30, 440–468. [Google Scholar] [CrossRef]
- An, H.; Cai, H.; Xu, X.; Qiao, Z.; Han, D. Impacts of urban green space on land surface temperature from urban block perspectives. Remote Sens. 2022, 14, 4580. [Google Scholar] [CrossRef]
- Zhou, W.; Cao, F. Effects of changing spatial extent on the relationship between urban forest patterns and land surface temperature. Ecol. Indic. 2020, 109, 105778. [Google Scholar] [CrossRef]
- Xu, Z.; Zhao, S. Scale dependence of urban green space cooling efficiency: A case study in Beijing metropolitan area. Sci. Total Environ. 2023, 898, 165563. [Google Scholar] [CrossRef]
- Zhang, S.; Tian, J.; Lu, X.; Tian, Q. Temporal and spatial dynamics distribution of organic carbon content of surface soil in coastal wetlands of Yancheng, China from 2000 to 2022 based on Landsat images. Catena 2023, 223, 106961. [Google Scholar] [CrossRef]
- Rakoto, P.Y.; Deilami, K.; Hurley, J.; Amati, M.; Sun, Q.C. Revisiting the cooling effects of urban greening: Planning implications of vegetation types and spatial configuration. Urban For. Urban Green. 2021, 64, 127266. [Google Scholar] [CrossRef]
- Masoudi, M.; Tan, P.Y. Multi-year comparison of the effects of spatial pattern of urban green spaces on urban land surface temperature. Landsc. Urban Plan. 2019, 184, 44–58. [Google Scholar] [CrossRef]
- Lundberg, S.M.; Nair, B.; Vavilala, M.S.; Horibe, M.; Eisses, M.J.; Adams, T.; Liston, D.E.; Low, D.K.; Newman, S.; Kim, J. Explainable machine-learning predictions for the prevention of hypoxaemia during surgery. Nat. Biomed. Eng. 2018, 2, 749–760. [Google Scholar] [CrossRef] [PubMed]
- Liu, W.; Yue, A.; Ji, J.; Shi, W.; Deng, R.; Liang, Y.; Xiong, L. Urban green space extraction from GF—2 remote sensing image based on DeepLabv3+ semantic segmentation model. Remote Sens. Nat. Resour. 2020, 32, 120–129. [Google Scholar] [CrossRef]
- Huerta, R.E.; Yépez, F.D.; Lozano-García, D.F.; Guerra Cobián, V.H.; Ferriño Fierro, A.L.; de León Gómez, H.; Cavazos González, R.A.; Vargas-Martínez, A. Mapping Urban Green Spaces at the Metropolitan Level Using Very High Resolution Satellite Imagery and Deep Learning Techniques for Semantic Segmentation. Remote Sens. 2021, 13, 2031. [Google Scholar] [CrossRef]
- Liu, F.F.; Yan, W.J.; Kong, F.H.; Yin, H.W.; Ban, Y.L.; Xu, W.B. A review on the urban green space cooling effect based on field measurement of air temperature. J. Appl. Ecol. 2017, 28, 1387–1396. [Google Scholar] [CrossRef]
- Guo, G.; Wu, Z.; Chen, Y. Complex mechanisms linking land surface temperature to greenspace spatial patterns: Evidence from four southeastern Chinese cities. Sci. Total Environ. 2019, 674, 77–87. [Google Scholar] [CrossRef]
- Zhou, W.; Cao, F.; Wang, G. Effects of spatial pattern of forest vegetation on urban cooling in a compact megacity. Forests 2019, 10, 282. [Google Scholar] [CrossRef]
- Sodoudi, S.; Zhang, H.; Chi, X.; Müller, F.; Li, H. The influence of spatial configuration of green areas on microclimate and thermal comfort. Urban For. Urban Green. 2018, 34, 85–96. [Google Scholar] [CrossRef]
- Ribeiro, M.P.; Menezes, G.P.; Figueiredo, G.K.; de Mello, K.; Valente, R.A. Impacts of urban landscape pattern changes on land surface temperature in Southeast Brazil. Remote Sens. Appl. Soc. Environ. 2024, 33, 101142. [Google Scholar] [CrossRef]
- Wesley, E.J.; Brunsell, N.A. Greenspace pattern and the surface urban heat island: A biophysically-based approach to investigating the effects of urban landscape configuration. Remote Sens. 2019, 11, 2322. [Google Scholar] [CrossRef]
- Han, S.; Hou, H.; Estoque, R.C.; Zheng, Y.; Shen, C.; Murayama, Y.; Pan, J.; Wang, B.; Hu, T. Seasonal effects of urban morphology on land surface temperature in a three-dimensional perspective: A case study in Hangzhou, China. Build. Environ. 2023, 228, 109913. [Google Scholar] [CrossRef]
- Li, X.; Zhou, W.; Ouyang, Z. Relationship between land surface temperature and spatial pattern of greenspace: What are the effects of spatial resolution? Landsc. Urban Plan. 2013, 114, 1–8. [Google Scholar] [CrossRef]
- Sun, T.; Sun, R.; Chen, L. The trend inconsistency between land surface temperature and near surface air temperature in assessing urban heat island effects. Remote Sens. 2020, 12, 1271. [Google Scholar] [CrossRef]
- Schatz, J.; Kucharik, C.J. Seasonality of the urban heat island effect in Madison, Wisconsin. J. Appl. Meteorol. Climatol. 2014, 53, 2371–2386. [Google Scholar] [CrossRef]
- Amani-Beni, M.; Chen, Y.; Vasileva, M.; Zhang, B. Quantitative-spatial relationships between air and surface temperature, a proxy for microclimate studies in fine-scale intra-urban areas? Sustain. Cities Soc. 2022, 77, 103584. [Google Scholar] [CrossRef]


| Data | Spatial Resolution | Date | Usage | Differences | |
|---|---|---|---|---|---|
| GF-6 | 2 m | 04/13/2020 | Fuzhou city main urban area imagery | Multispectral sensor covering blue, green, red, and near-infrared bands, suitable for agricultural and environmental monitoring. | |
| JL-1 | 5 m | 04/08/2022 | Xiamen and Zhangzhou city main urban area imagery | Sensor covers visible and near-infrared bands, suitable for urban planning and resource management. | |
| GF-1 | 2 m | 06/04/2021 07/23/2021 | Training sample experimental areas: Areas A and B (from Guangdong Province and Shandong Province) | High-resolution panchromatic and multispectral sensors covering blue, green, red, and near-infrared bands. | |
| GF-2 | 1 m | 10/18/2016 12/13/2020 | Training sample experimental areas: Areas C and D (from Qinghai Province and Yunnan Province) | Panchromatic resolution better than 1 m, multispectral resolution better than 4 m, covering visible and near-infrared bands. | |
| GF-7 | 0.65 m | 04/14/2021 | Training sample experimental area: Area E (from Yunnan Province) | Capable of stereo mapping, panchromatic resolution better than 0.8 m, multispectral resolution of 3.2 m. | |
| Landsat 8 | 100 m | 06/01/2020–09/01/2020 | 12/01/2020–03/01/2021 | Constructing summer and winter LST for Fuzhou, Xiamen, and Zhangzhou | Eleven bands covering visible, near-infrared, shortwave infrared, and thermal infrared bands. |
| 06/01/2022–09/01/2022 | 12/01/2022–03/01/2023 | ||||
| Experimental Environment | Detailed Information |
|---|---|
| Software environment | Programming language: Python 3.8 |
| Deep learning framework: Keras 2.10.0, TensorFlow 2.10.0 | |
| Development environment: Anaconda, PyCharm 2021 | |
| Results visualization: ArcGIS 10.7 | |
| Hardware environment | CPU: AMD Ryzen 7 5800H with Radeon Graphics |
| GPU: NVIDIA GeForce RTX 3080 Laptop GPU |
| Landscape Pattern Index | Description | Unit |
|---|---|---|
| Aggregation index (AI) | The connectivity of a given patch type within the landscape, reflecting the degree of patch aggregation | % |
| Edge density (ED) | The ratio of patch boundary length to area within the landscape, reflecting the edge effect of landscape patches | m/ha |
| Mean Euclidean nearest-neighbor distance (ENN_MN) | The shortest straight-line distance between a focal patch and its nearest neighbor, reflecting the connectivity of landscape patches | m |
| Landscape shape index (LSI) | The complexity of patch shapes compared to a simple geometric shape, reflecting landscape complexity | m |
| Percentage of landscape (PLAND) | The percentage of total landscape area covered by a specific patch type, reflecting the scale of landscape patches | % |
| Feature Separation | OA/% | MIoU/% | Kappa | ||
|---|---|---|---|---|---|
| Res Model | SE Model | Relative Radiometric Correction | |||
| × | × | √ | 86.51 | 67.49 | 0.77 |
| √ | × | √ | 87.00 | 68.27 | 0.78 |
| × | √ | √ | 87.20 | 68.97 | 0.78 |
| √ | √ | × | 87.52 | 69.00 | 0.79 |
| √ | √ | √ | 87.57 | 69.47 | 0.79 |
| Method | OA/% | MIoU/% | Kappa |
|---|---|---|---|
| SegNet | 84.21 | 62.50 | 0.73 |
| FCN_8S | 86.65 | 66.07 | 0.77 |
| DeepLabv3+ | 80.97 | 58.87 | 0.68 |
| ResSE-UNet | 87.57 | 69.47 | 0.79 |
| Temperature Regulation (°C) | Summer | Winter |
|---|---|---|
| The average surface temperature of the Fuzhou city area | 47.59 | 19.70 |
| The average surface temperature of urban forests in Fuzhou city | 46.31 | 19.28 |
| The cooling intensity of Fuzhou city | 1.29 | 0.41 |
| The average surface temperature of the Xiamen city area | 44.34 | 21.69 |
| The average surface temperature of urban forests in Xiamen city | 43.21 | 21.34 |
| The cooling intensity of Xiamen city | 1.13 | 0.35 |
| The average surface temperature of the Zhangzhou city area | 44.00 | 22.11 |
| The average surface temperature of urban forests in Zhangzhou city | 42.66 | 21.50 |
| The cooling intensity of Zhangzhou city | 1.34 | 0.61 |
Disclaimer/Publisher’s Note: The statements, opinions and data contained in all publications are solely those of the individual author(s) and contributor(s) and not of MDPI and/or the editor(s). MDPI and/or the editor(s) disclaim responsibility for any injury to people or property resulting from any ideas, methods, instructions or products referred to in the content. |
© 2024 by the authors. Licensee MDPI, Basel, Switzerland. This article is an open access article distributed under the terms and conditions of the Creative Commons Attribution (CC BY) license (https://creativecommons.org/licenses/by/4.0/).
Share and Cite
Zhang, S.; Wu, Z.; Wu, Z.; Lin, S.; Hu, X.; Zheng, L. The Impact of Urban Forest Landscape on Thermal Environment Based on Deep Learning: A Case of Three Main Cities in Southeastern China. Forests 2024, 15, 1304. https://doi.org/10.3390/f15081304
Zhang S, Wu Z, Wu Z, Lin S, Hu X, Zheng L. The Impact of Urban Forest Landscape on Thermal Environment Based on Deep Learning: A Case of Three Main Cities in Southeastern China. Forests. 2024; 15(8):1304. https://doi.org/10.3390/f15081304
Chicago/Turabian StyleZhang, Shenye, Ziyi Wu, Zhilong Wu, Sen Lin, Xisheng Hu, and Lifeng Zheng. 2024. "The Impact of Urban Forest Landscape on Thermal Environment Based on Deep Learning: A Case of Three Main Cities in Southeastern China" Forests 15, no. 8: 1304. https://doi.org/10.3390/f15081304
APA StyleZhang, S., Wu, Z., Wu, Z., Lin, S., Hu, X., & Zheng, L. (2024). The Impact of Urban Forest Landscape on Thermal Environment Based on Deep Learning: A Case of Three Main Cities in Southeastern China. Forests, 15(8), 1304. https://doi.org/10.3390/f15081304