
Stepwise Multidimensional Climate Envelop Modeling of Pitch Pine (Pinus rigida)


Abstract
1. Introduction
2. Materials and Methods
2.1. Data Mining and Climate Envelop Modeling
2.2. Multivariate Statistical Analysis
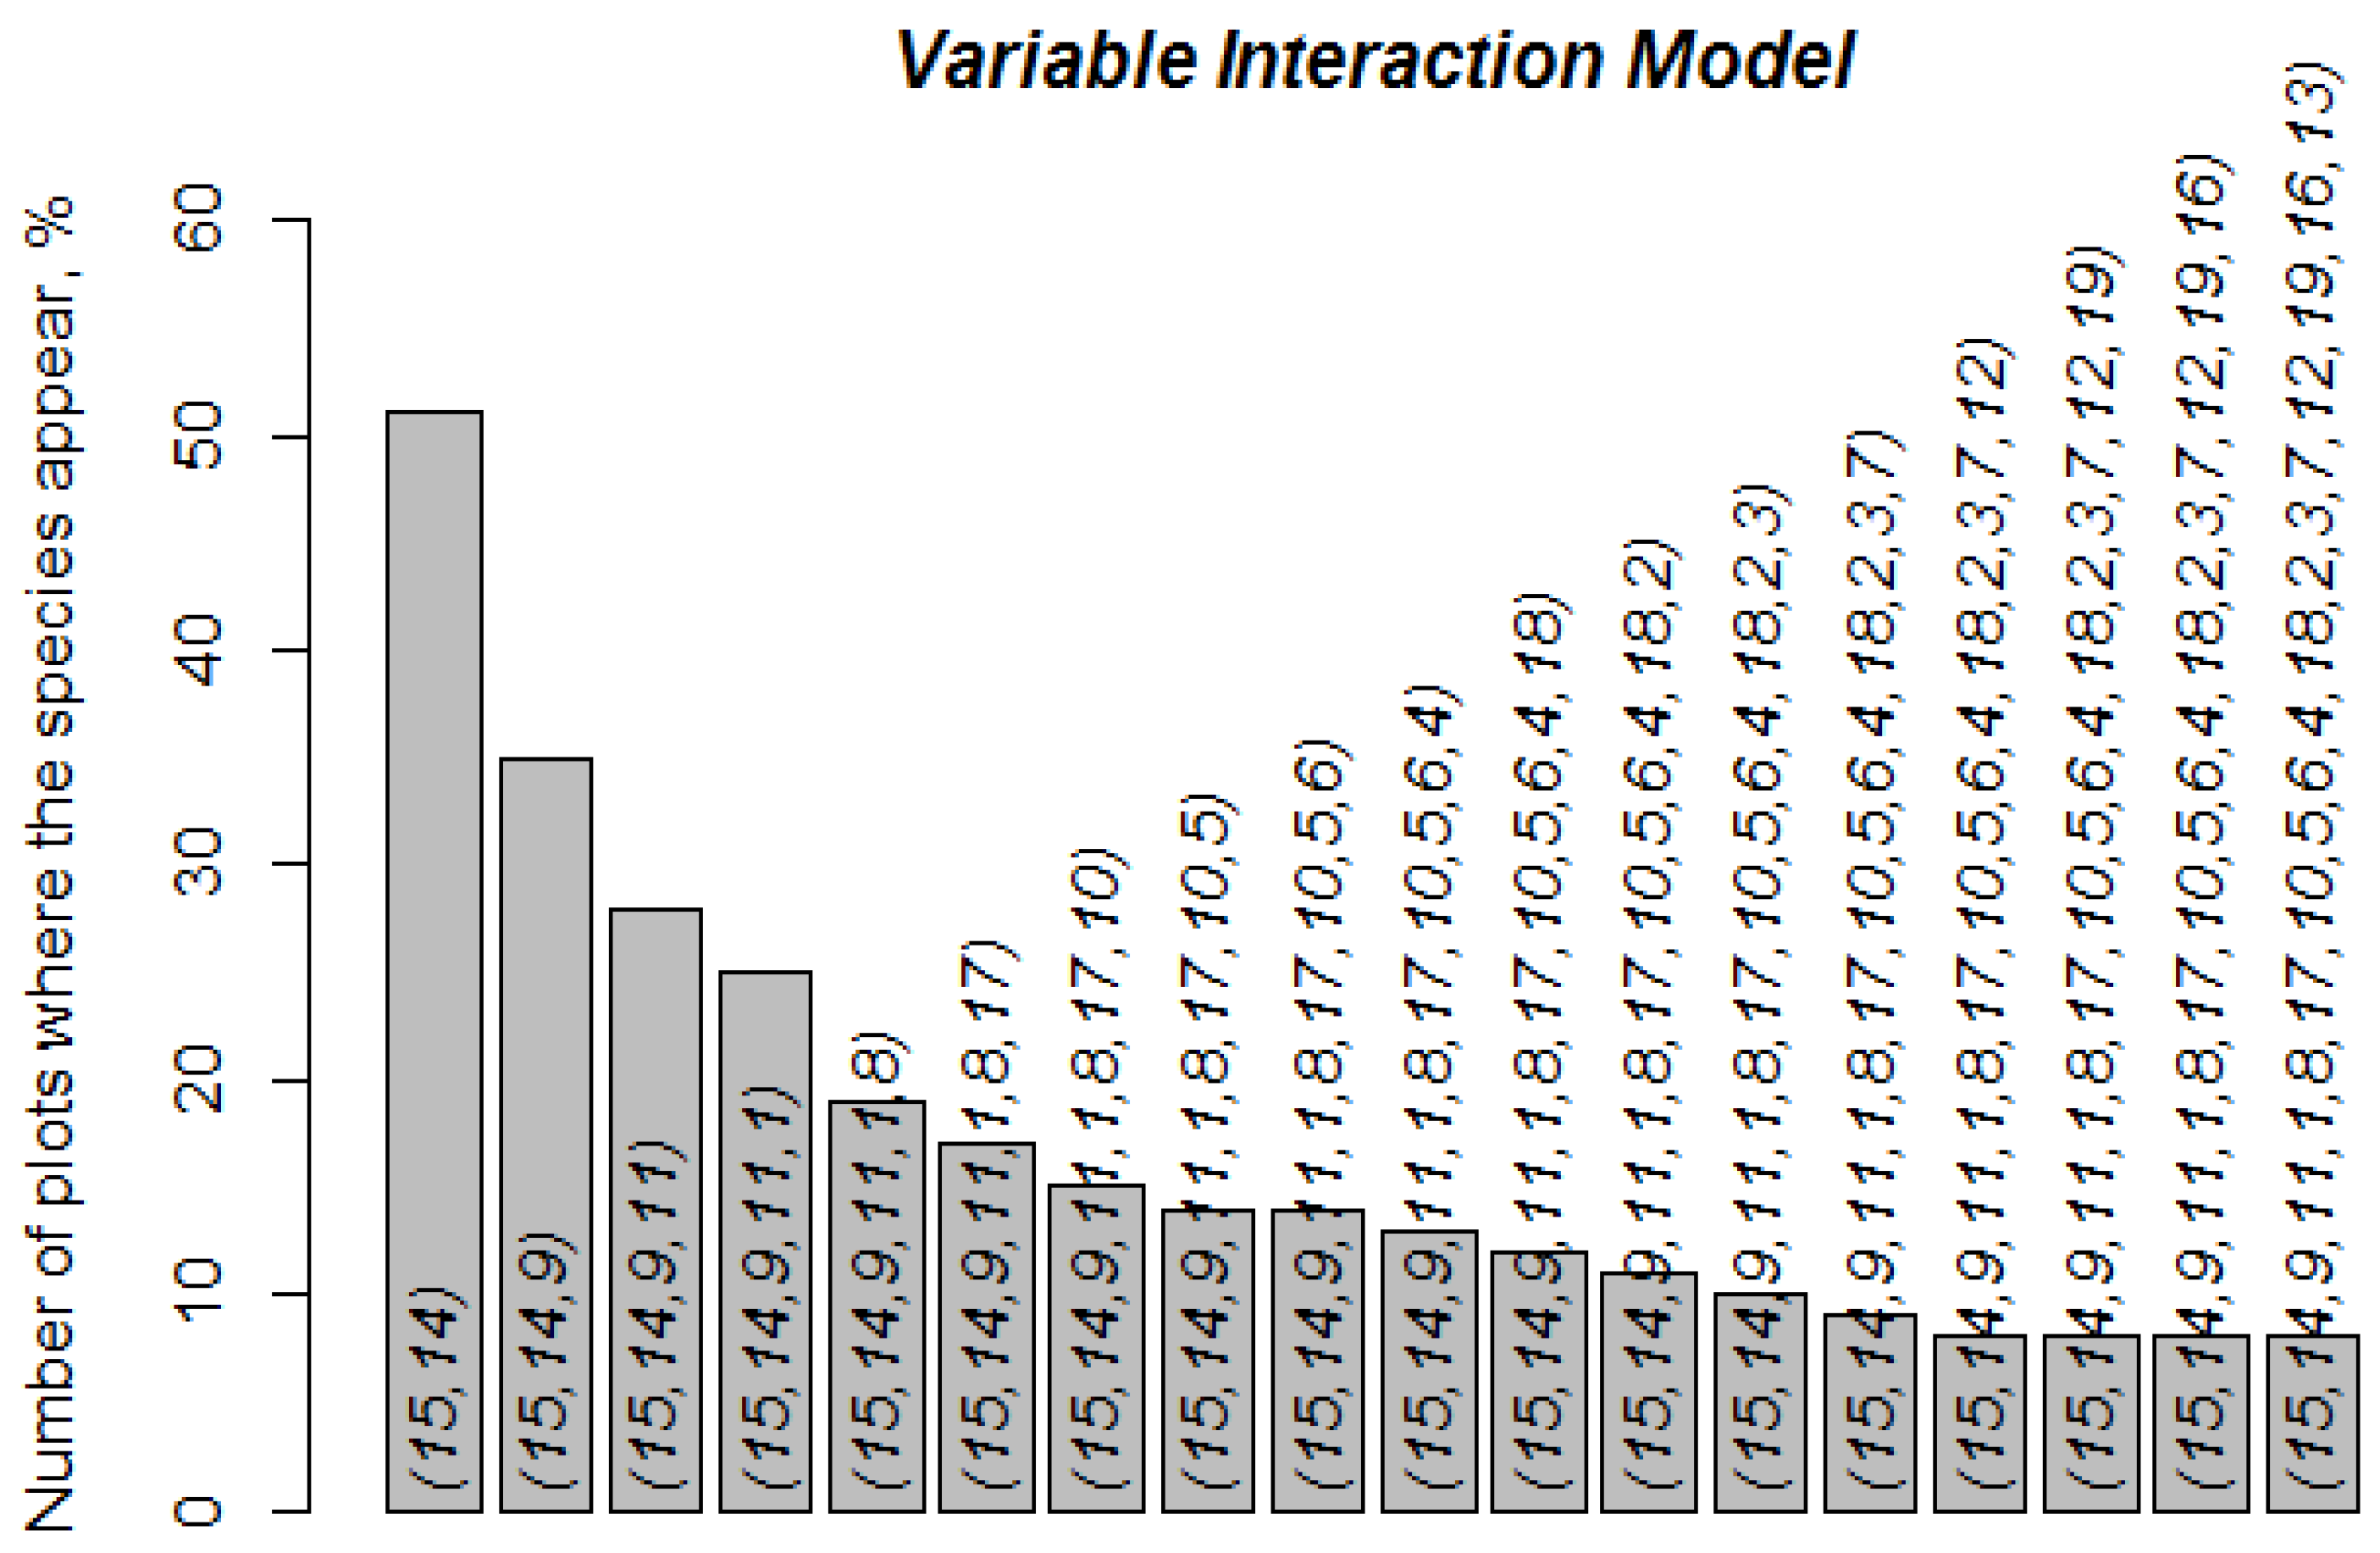
2.3. Variable Interaction Model (VIM)
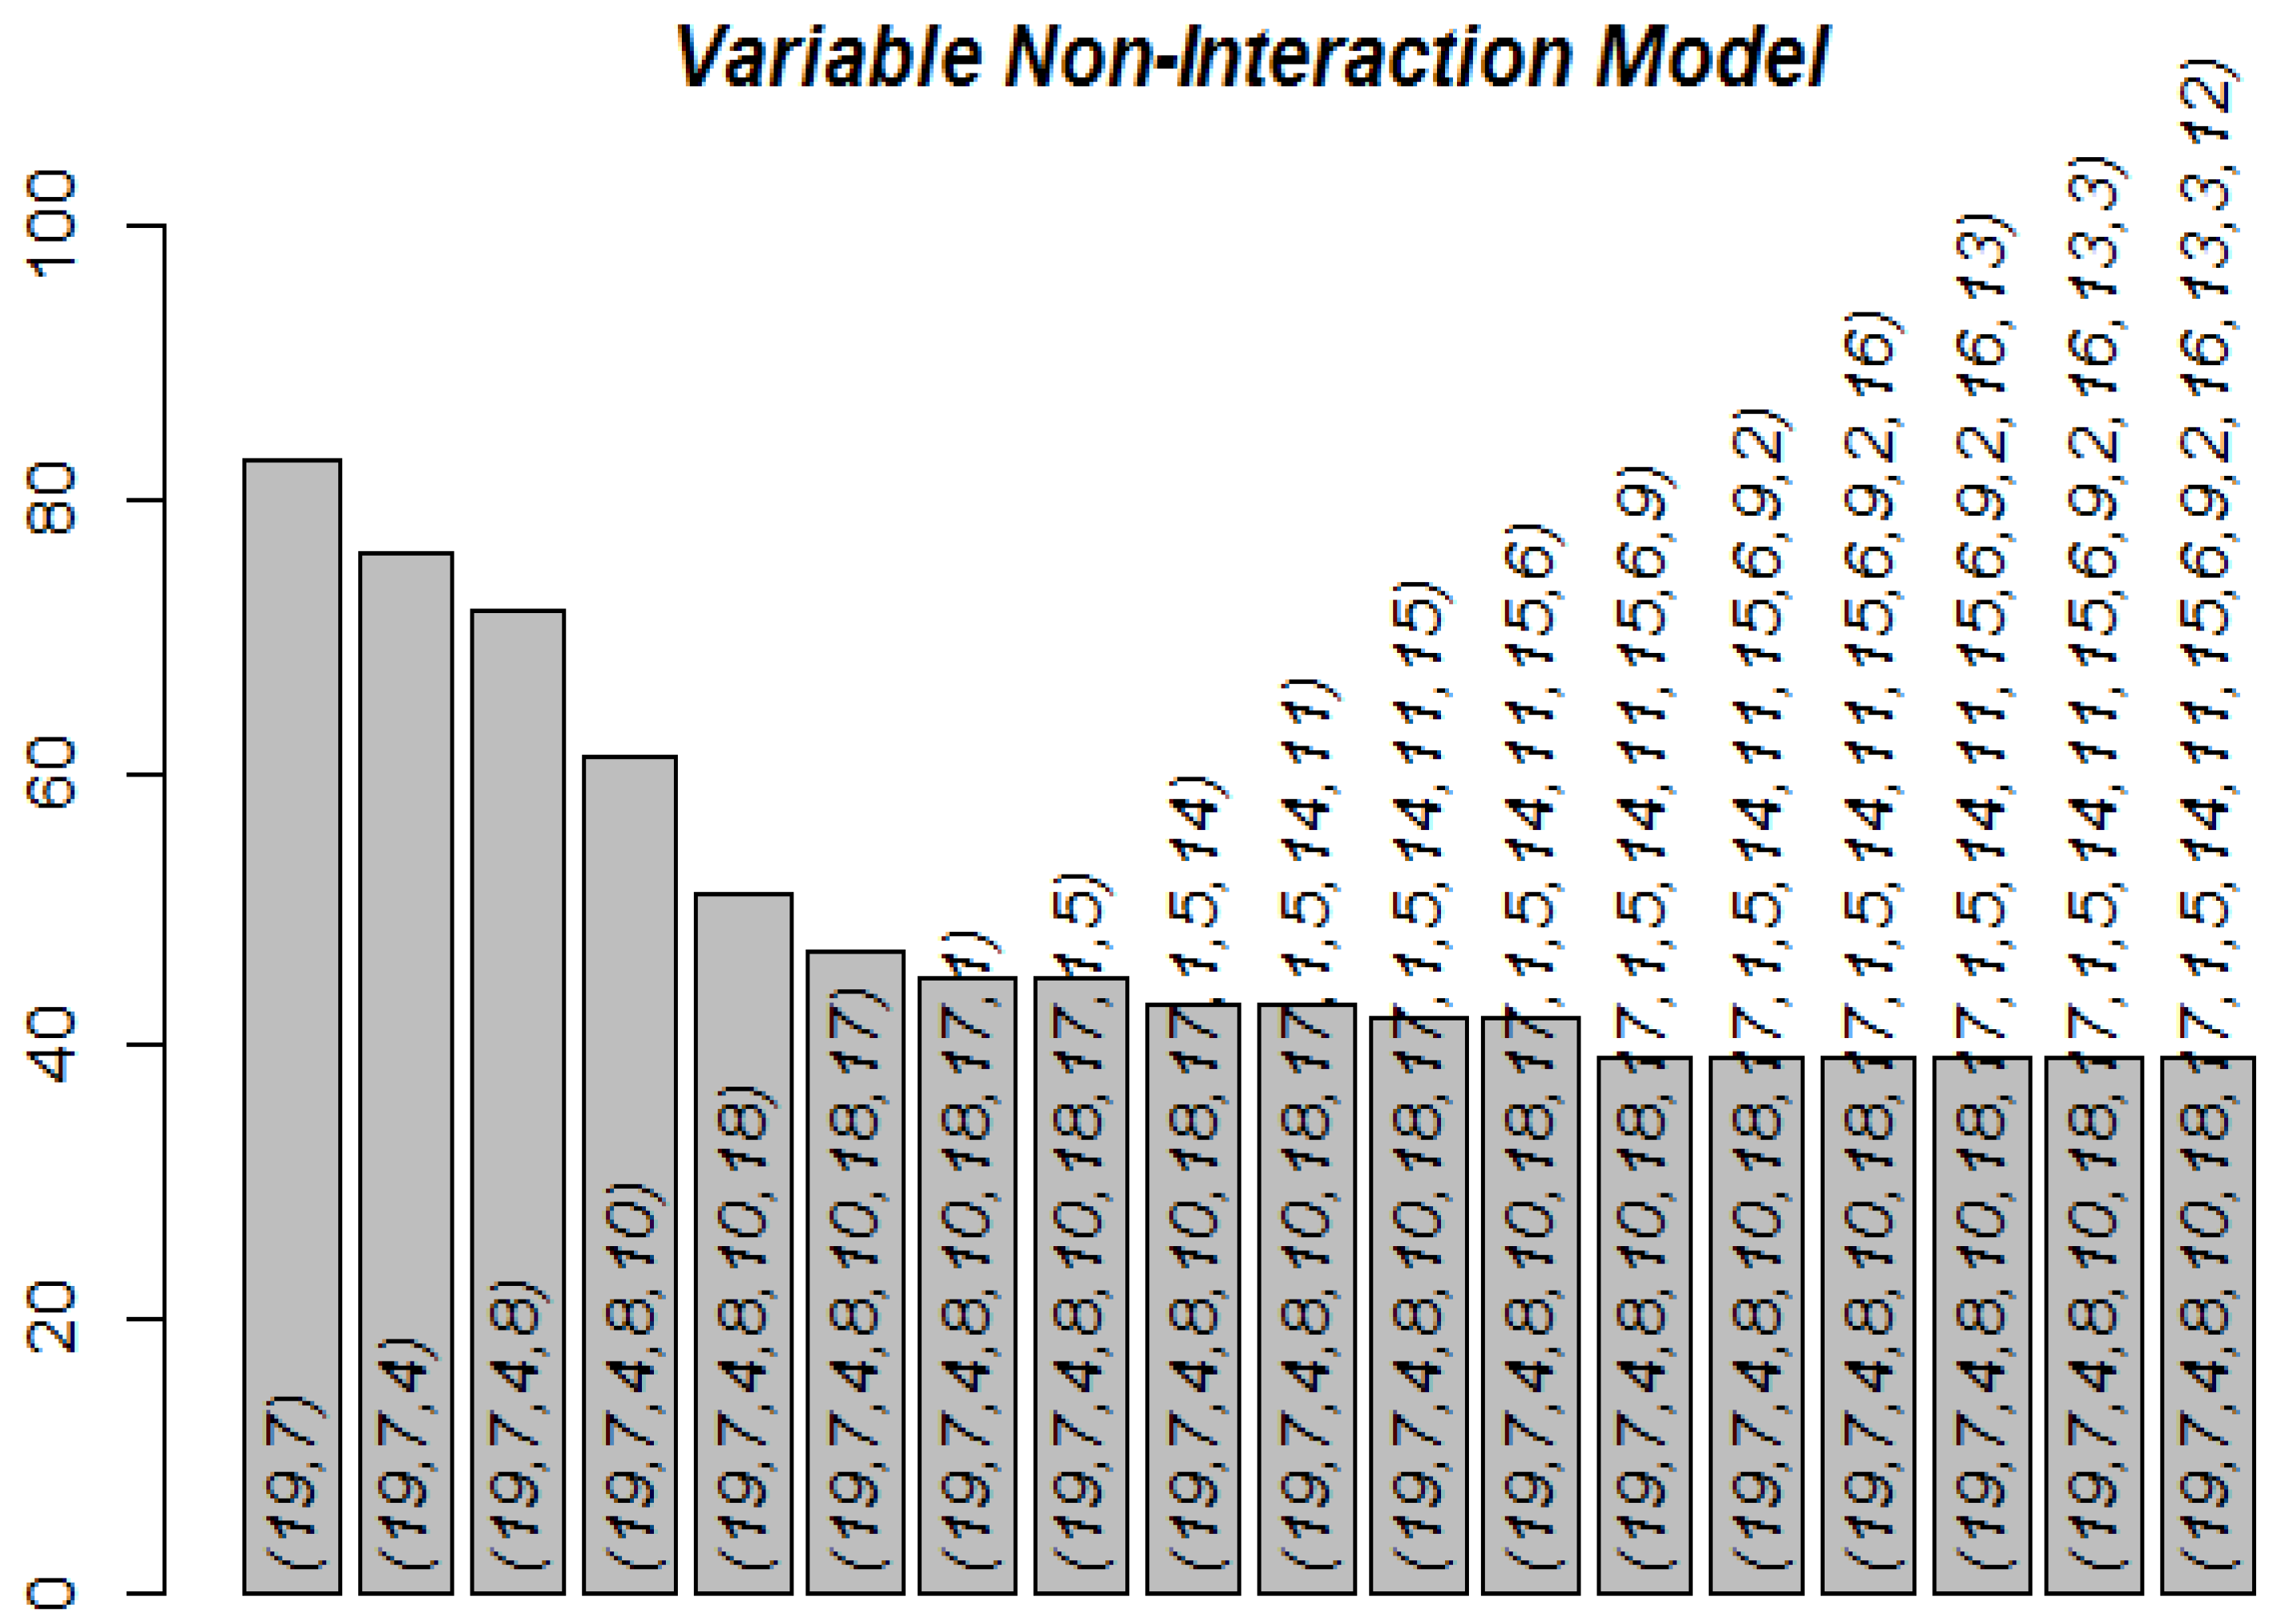
2.4. Variable Non-Interaction Model (VNM)
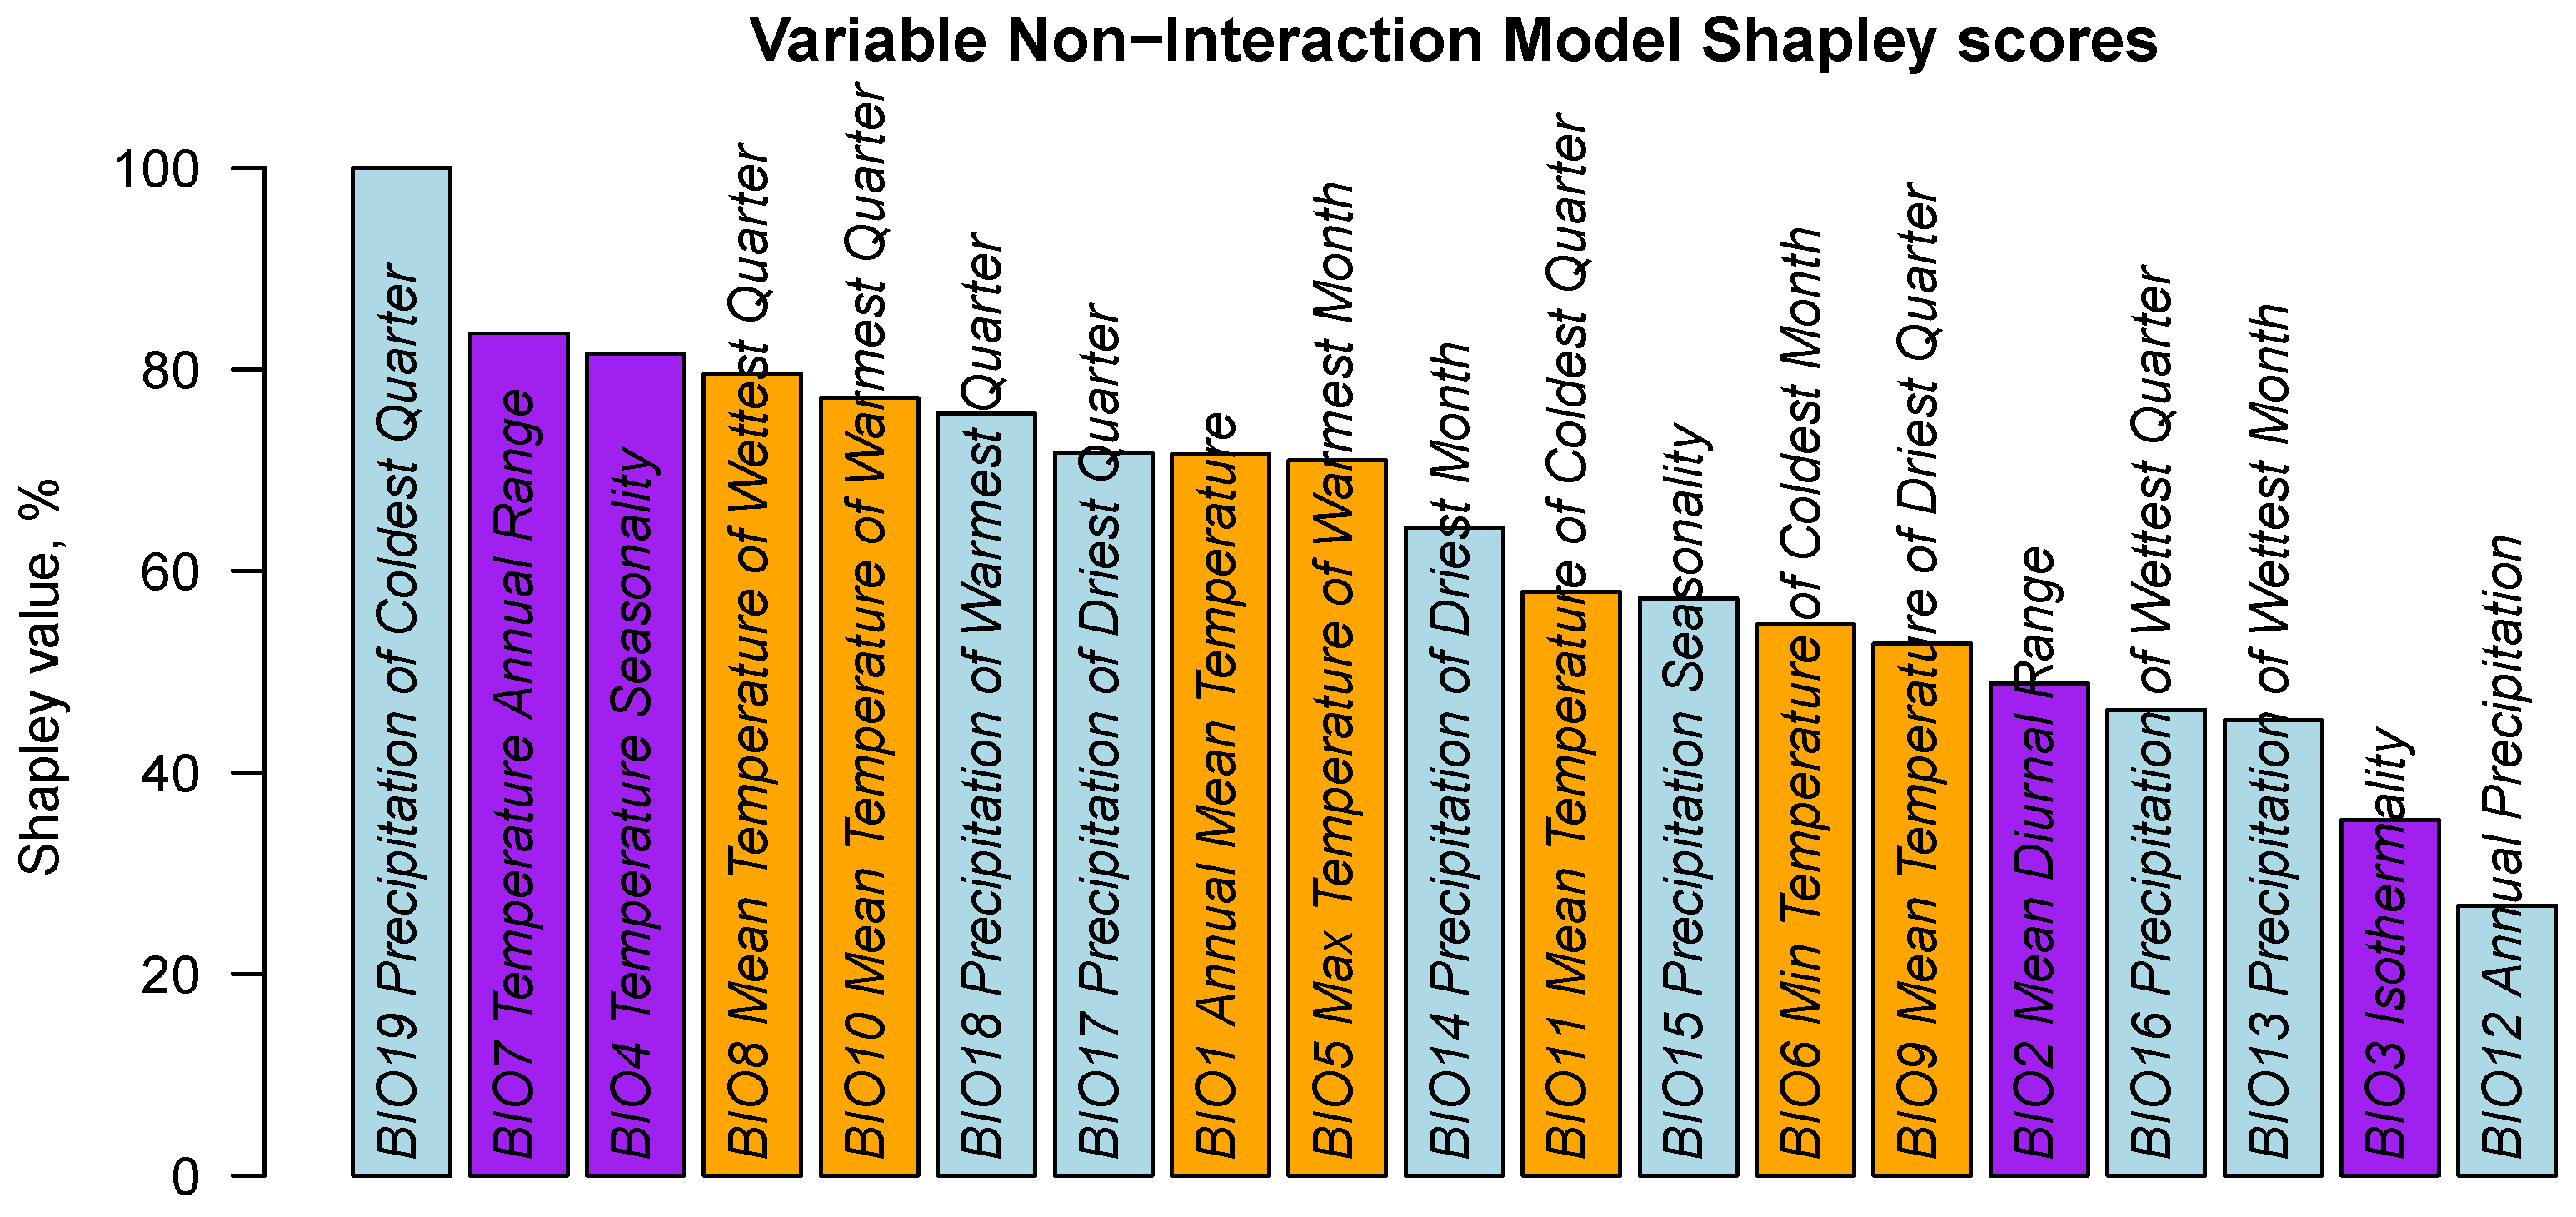
2.5. Ranking of Bioclimatic Variables Using Shapley Values
3. Results
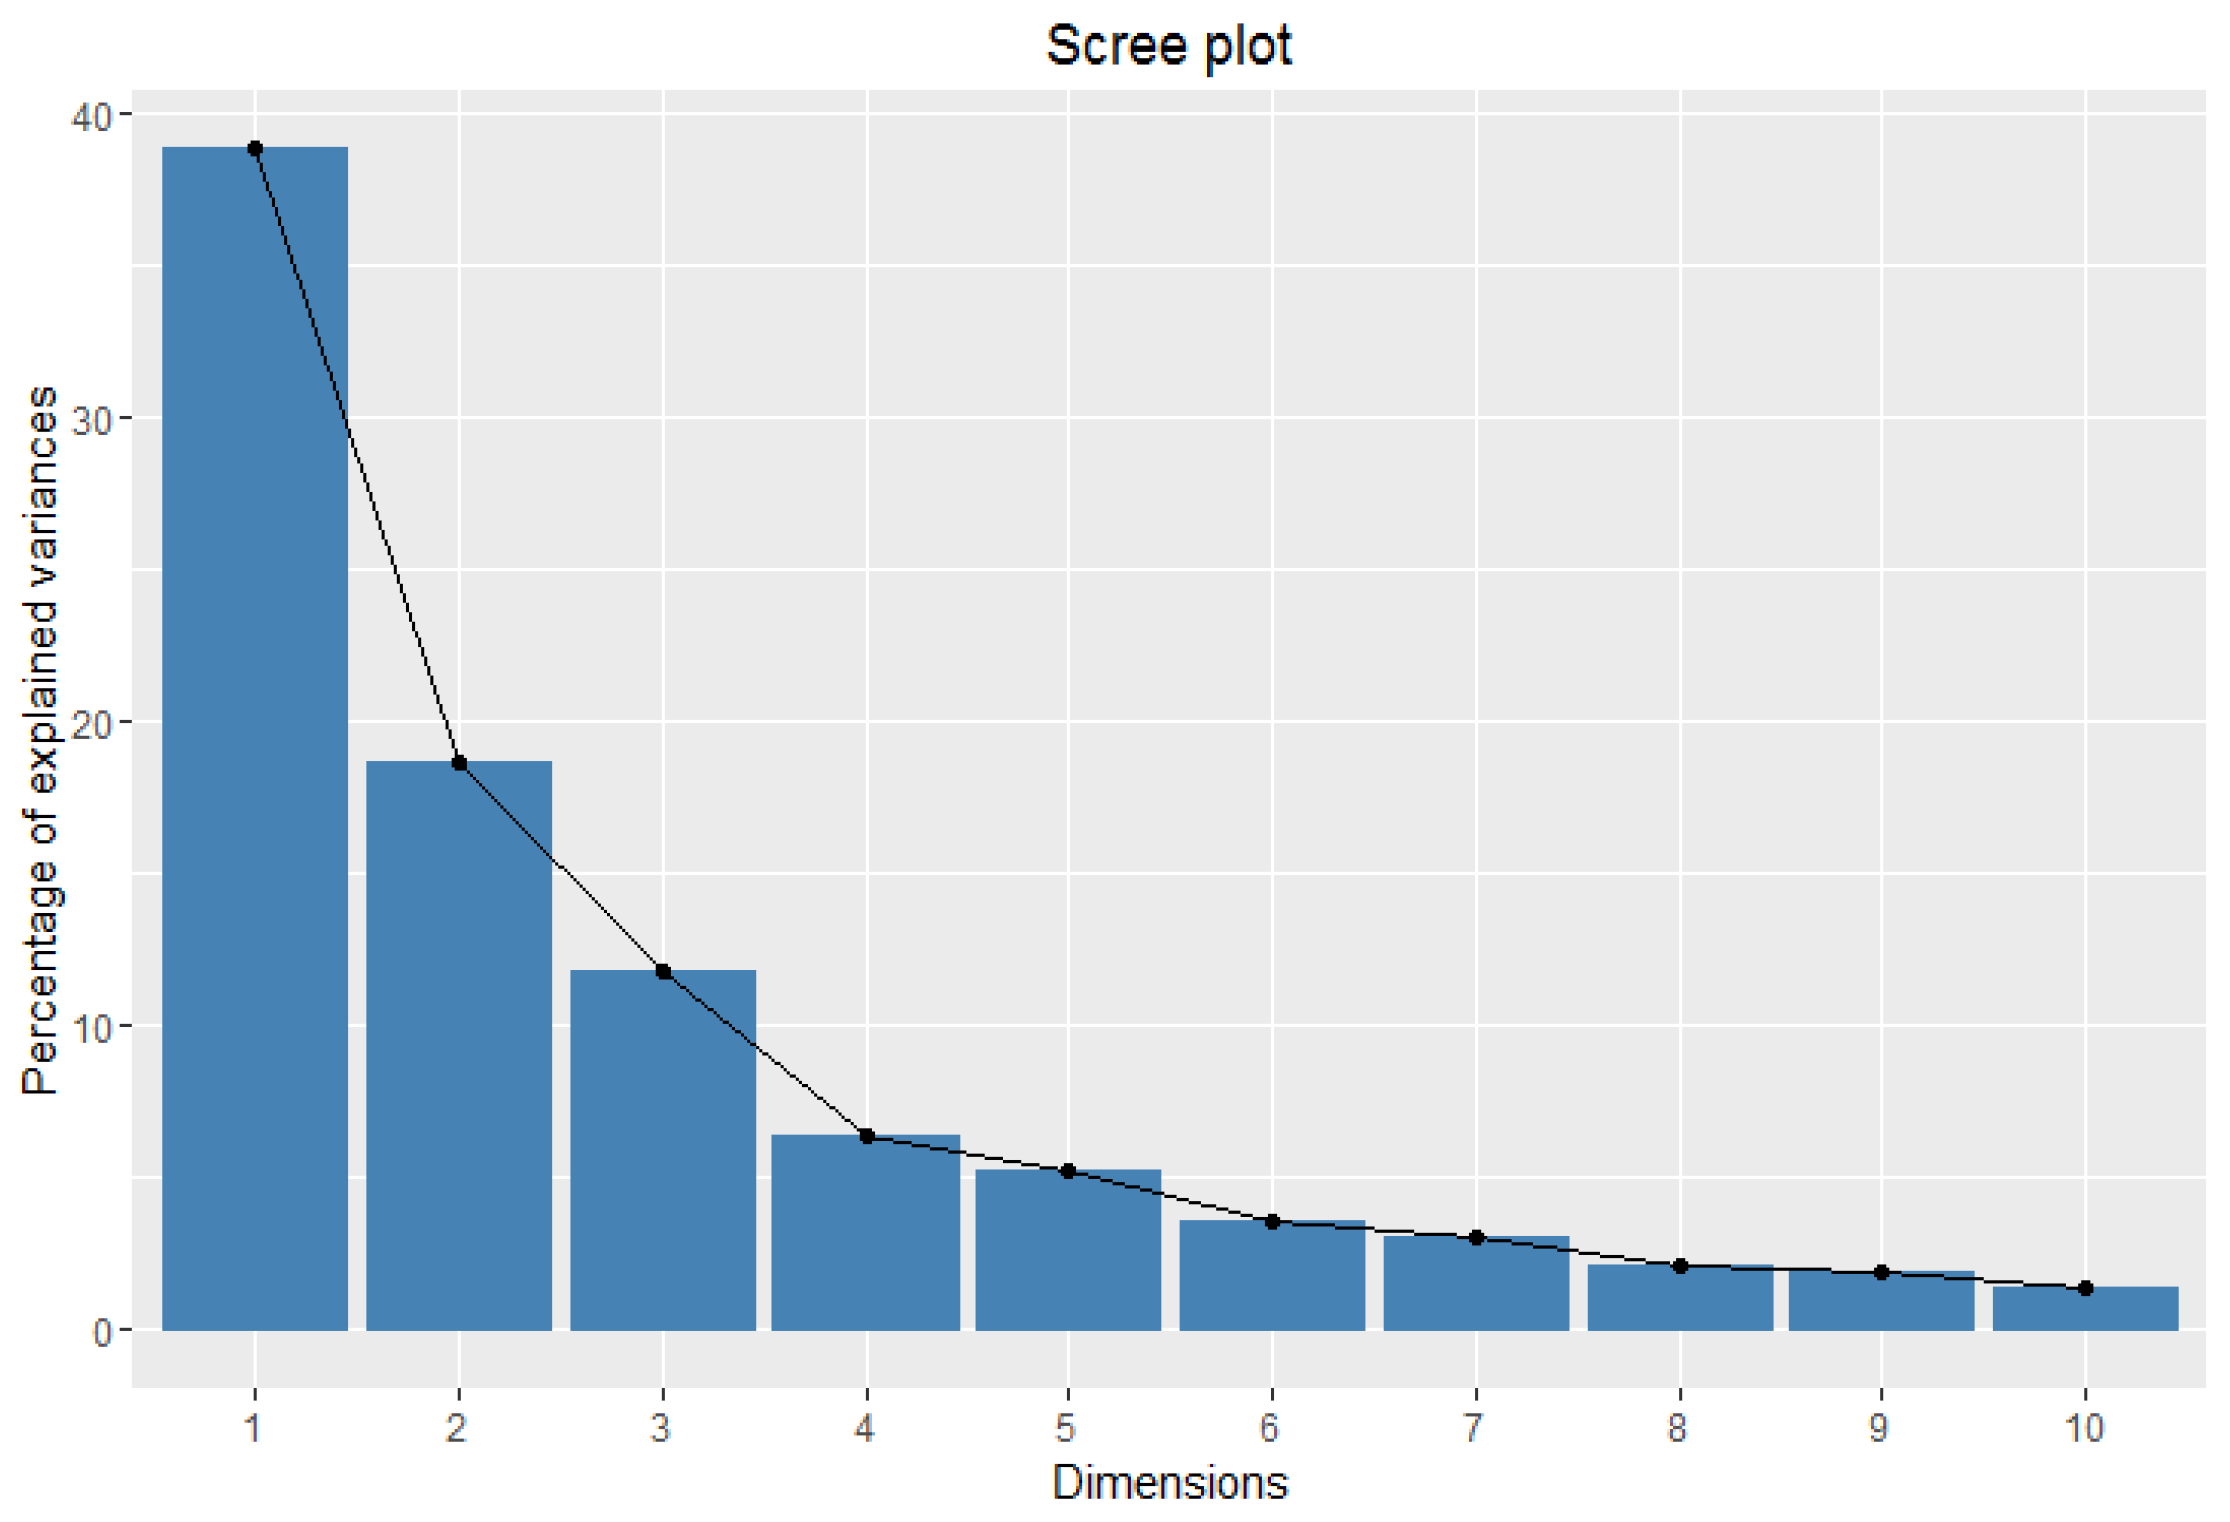
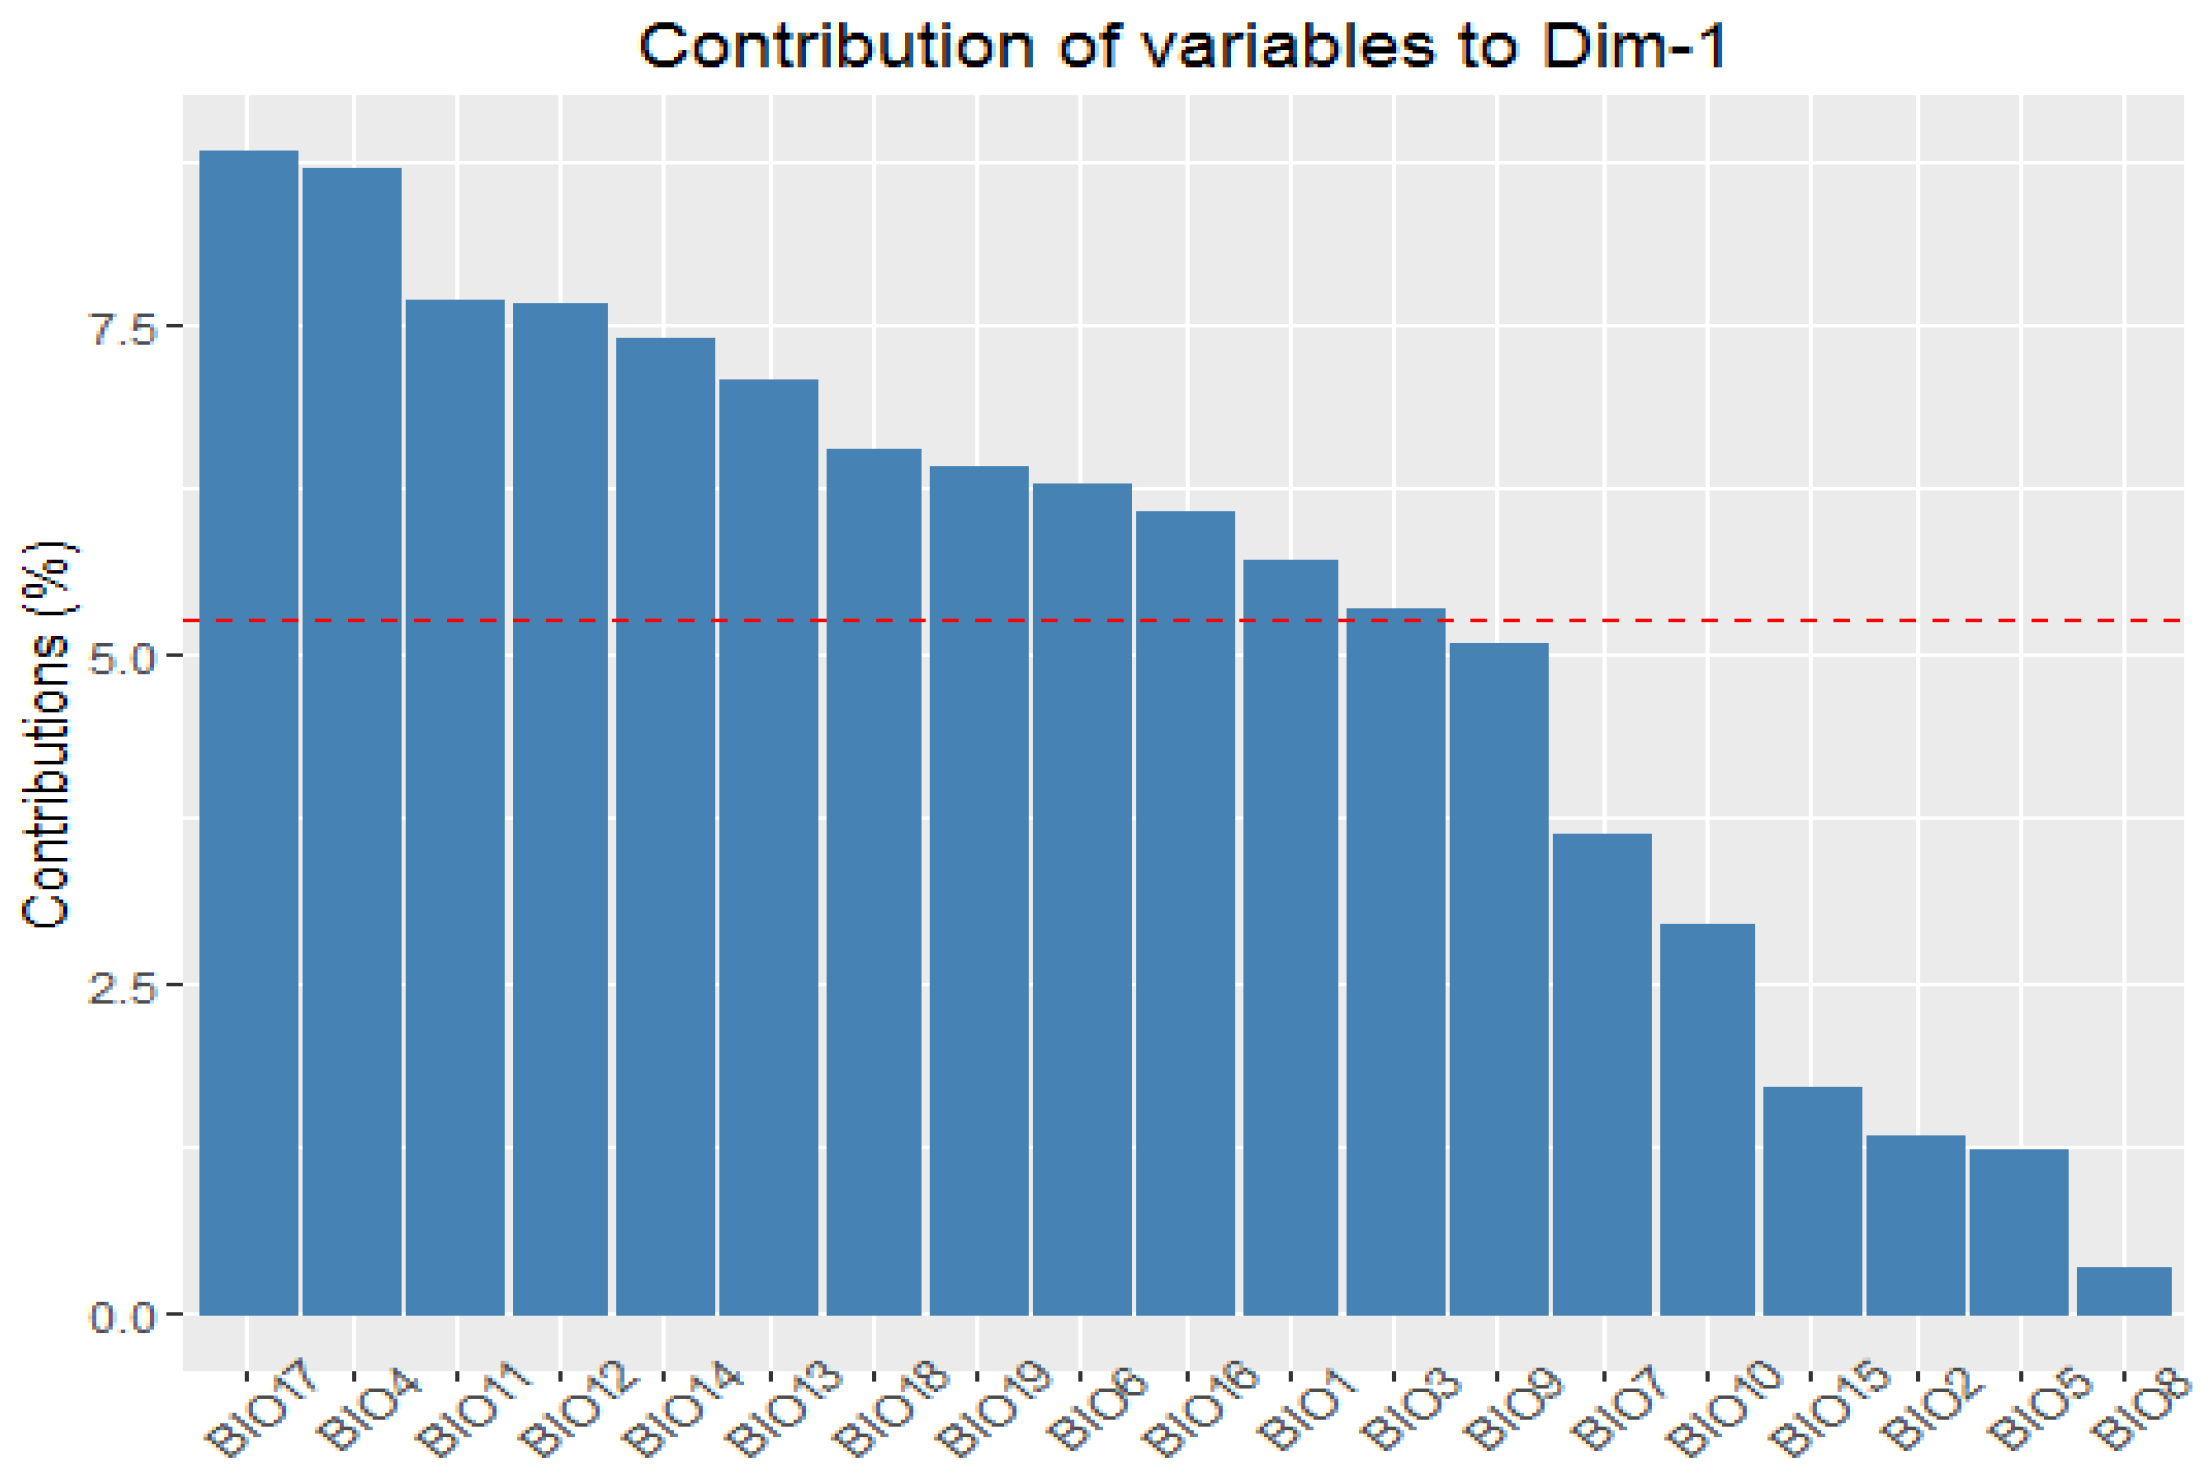
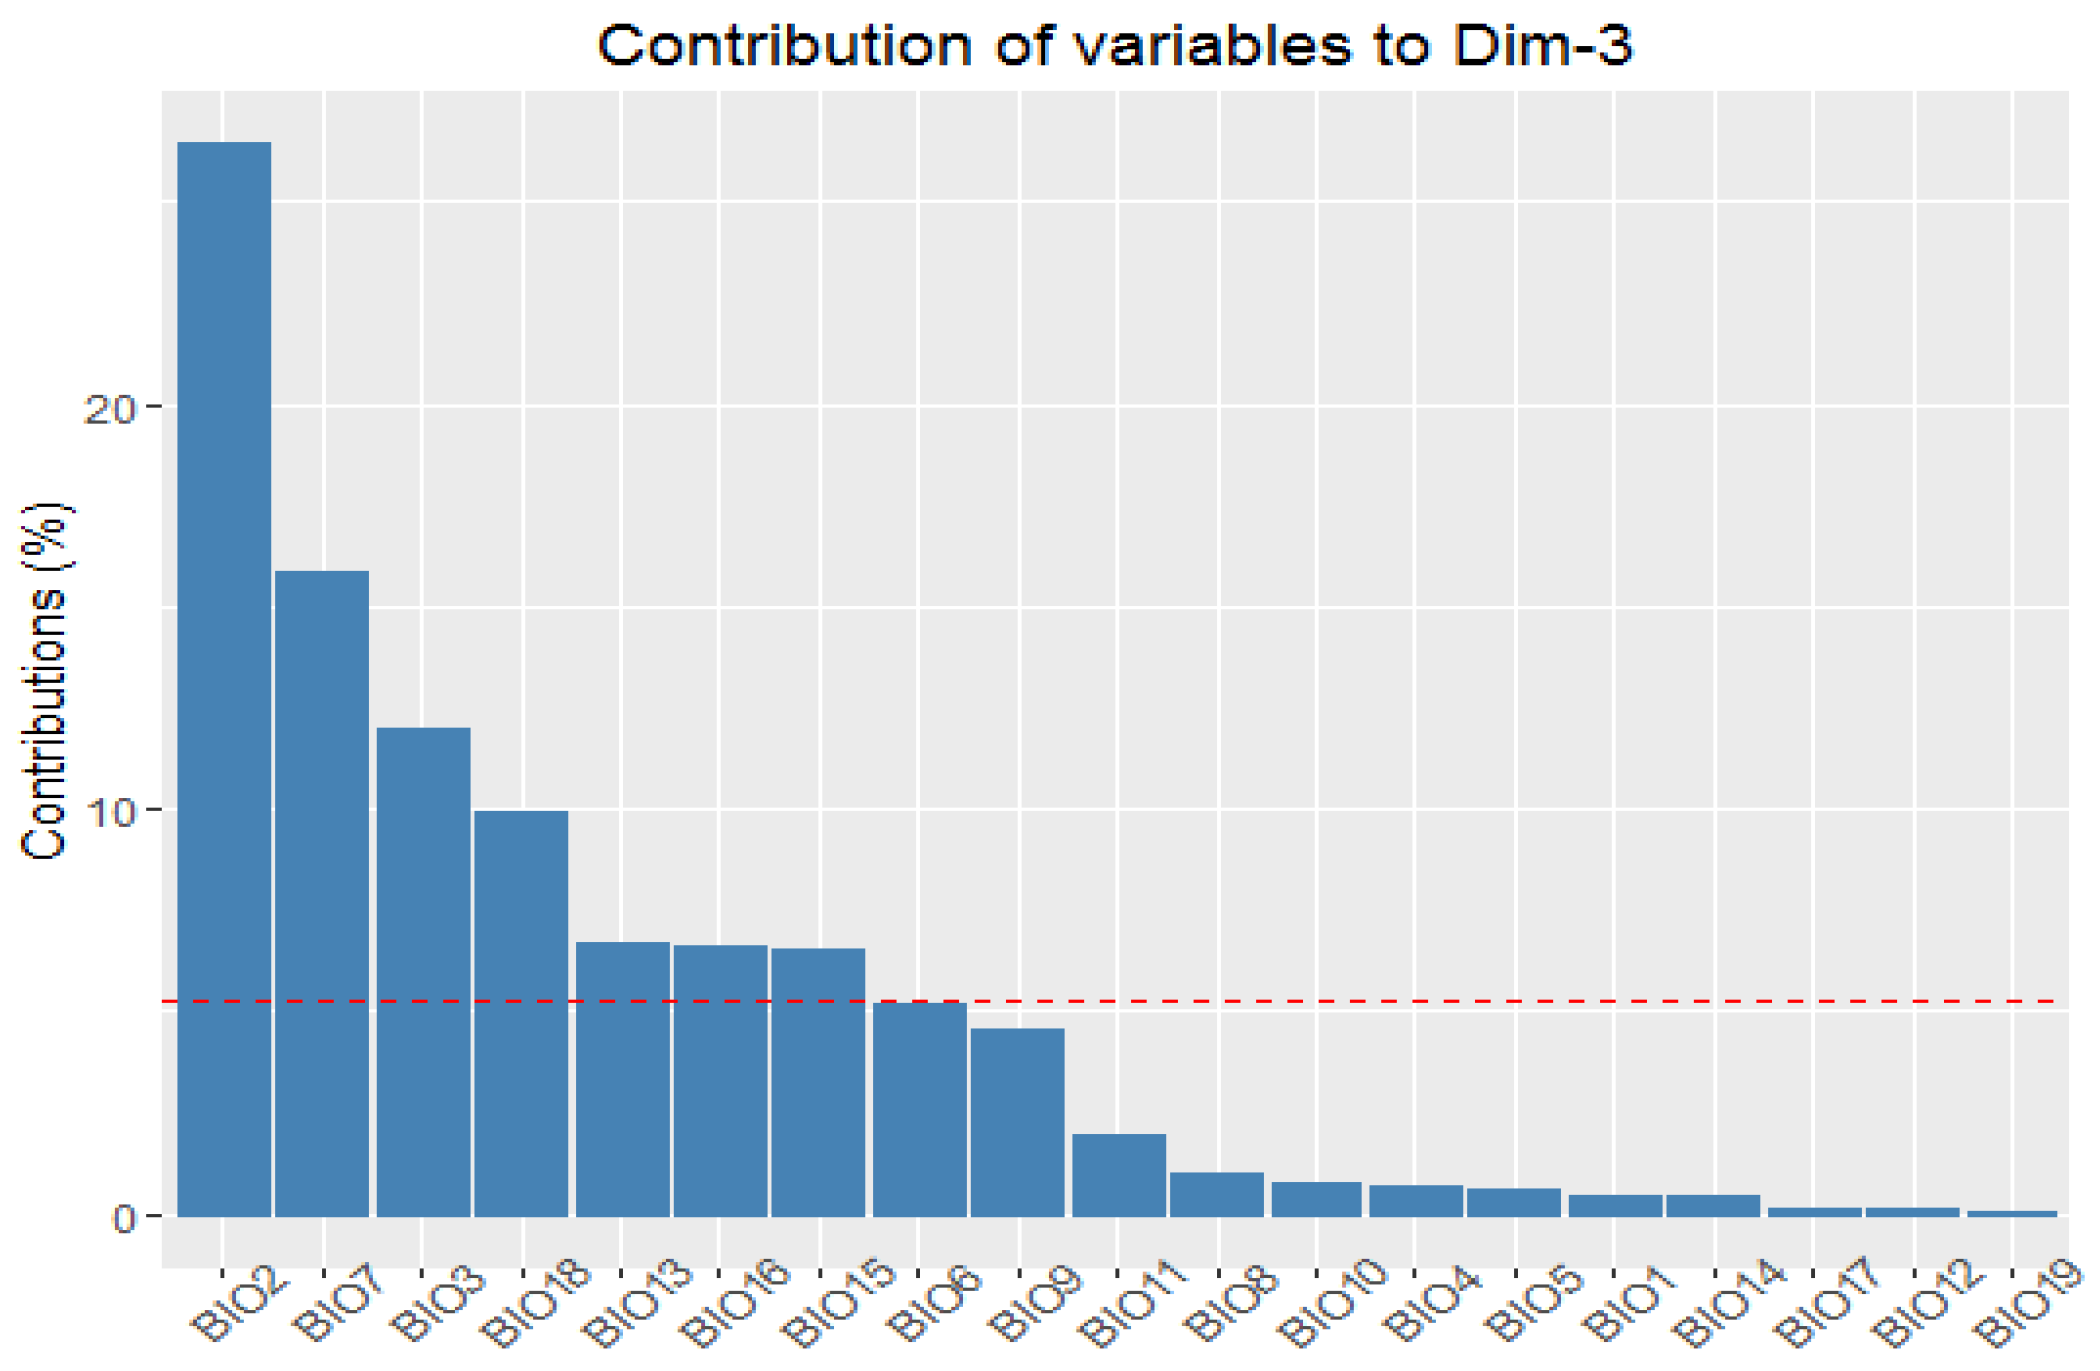
3.1. Climatic Conditions in Pitch Pine Habitats: Multivariate Statistical Analysis
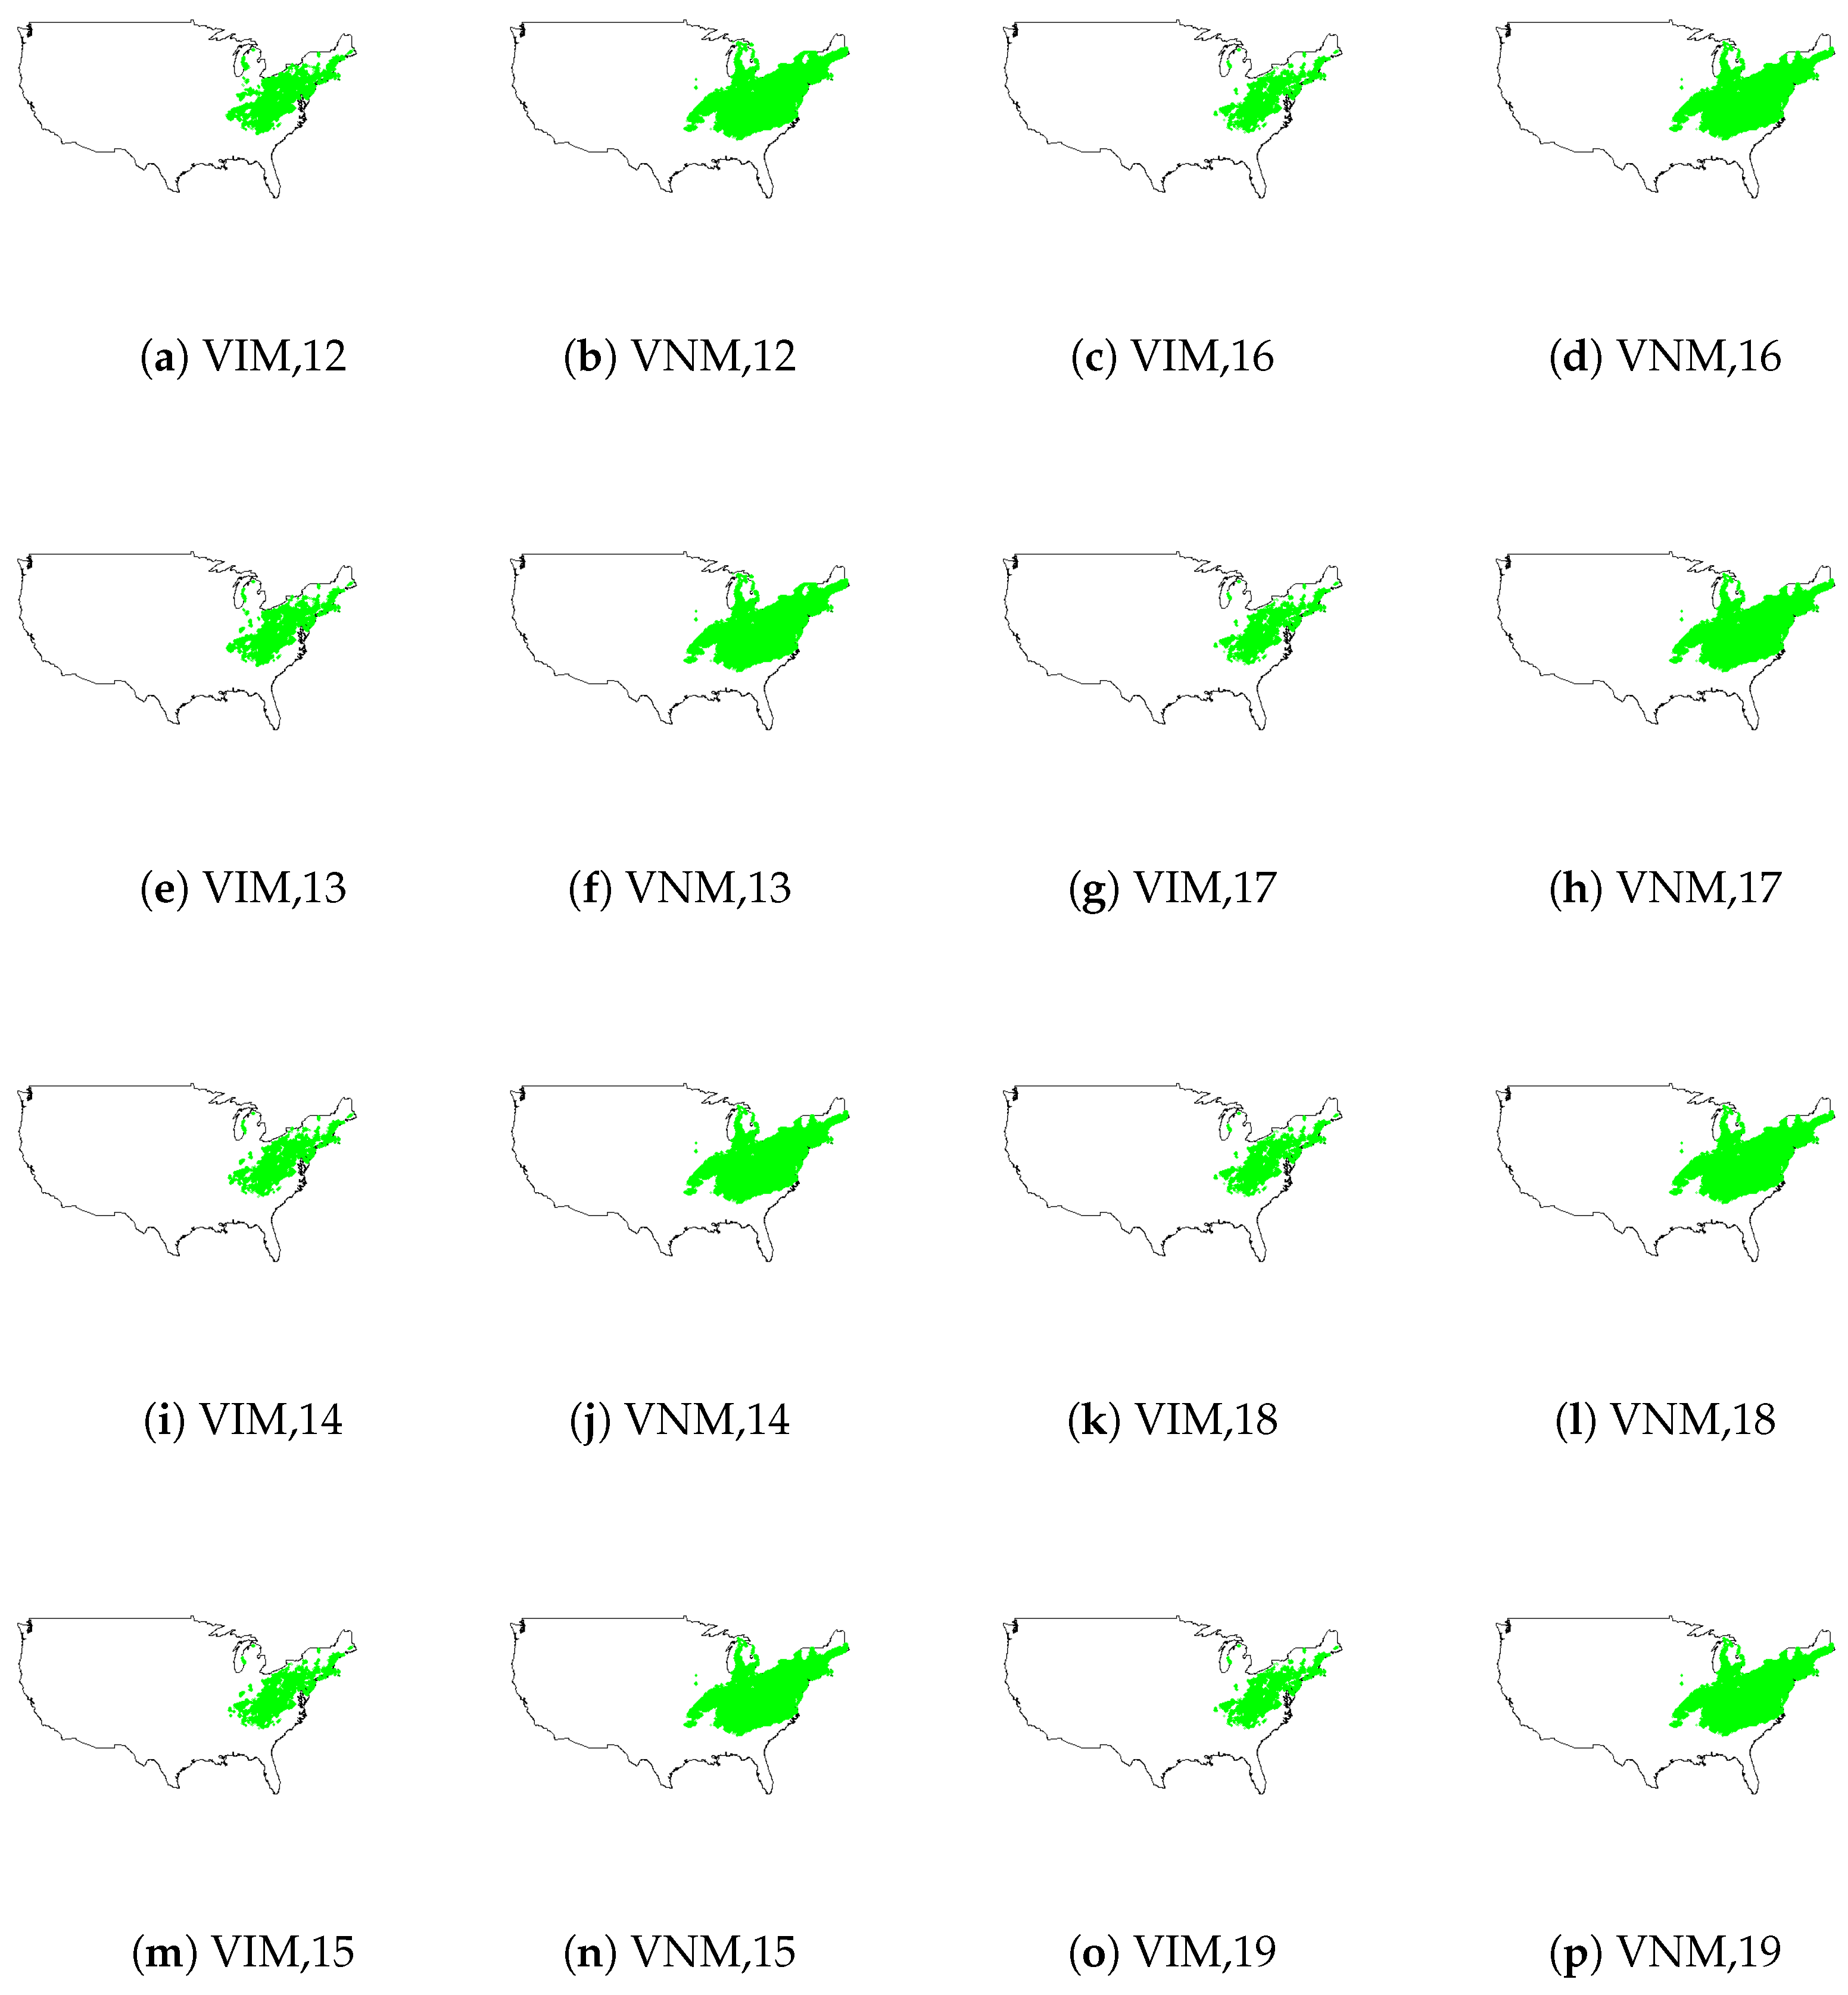
3.2. Stepwise Climate Envelop Modeling: VIM and VNM
4. Discussion
4.1. Pitch Pine: Ecology and Modeling
4.2. General Discussion
5. Conclusions
Author Contributions
Funding
Data Availability Statement
Acknowledgments
Conflicts of Interest
Appendix A. Calculation of Shapley Values: Numerical Example
Appendix A.1. VIM Shapley Scores
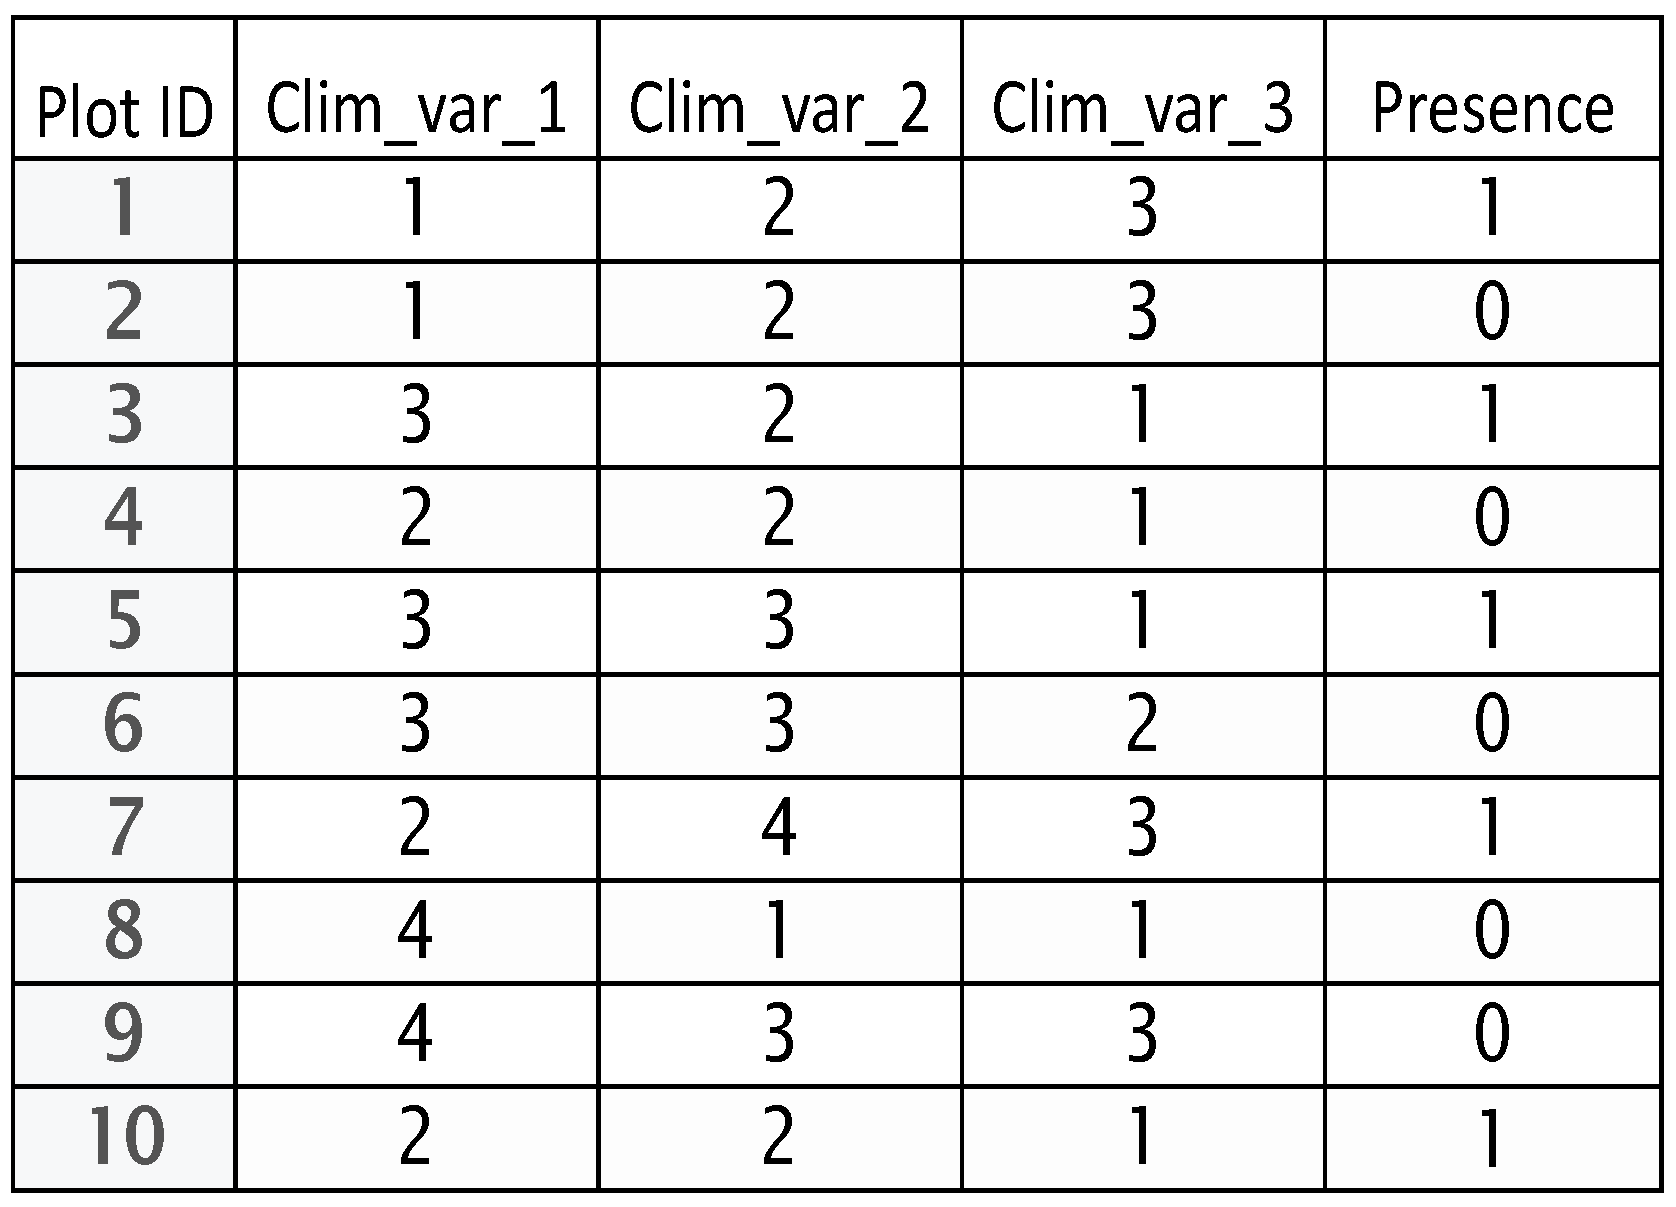
- In plot 1, the values of , , and are 1, 2, and 3 correspondingly. The second plot is the only one that has the same values, so the VIM score of {, , } is 2.
- In plot 3, the values of , , and are 3, 2, and 1 correspondingly. It is the only plot having such values, so the VIM score of {, , } is 2 + 1 = 3.
- In plot 5, the values of , , and are 3, 3, and 1 correspondingly. It is the only plot having such values, so the VIM score of {, , } is 3 + 1 = 4.
- In plot 7, the values of , , and are 2, 4, and 3 correspondingly. It is the only plot having such values, so the VIM score of {, , } is 4 + 1 = 5.
- In plot 1, the values of , , and are 2, 2, and 1 correspondingly. Plot 4 is the only one that has the same values, so the VIM score of {, , } is 5 + 2 = 7.
Appendix A.2. VNM Shapley Scores
References
- Austin, M. Species distribution models and ecological theory: A critical assessment and some possible new approaches. Ecol. Model. 2007, 200, 1–19. [Google Scholar] [CrossRef]
- Elith, J.; Leathwick, J.R. Species distribution models: Ecological explanation and prediction across space and time. Annu. Rev. Ecol. Evol. Syst. 2009, 40, 677–697. [Google Scholar] [CrossRef]
- Loiselle, B.A.; Howell, C.A.; Graham, C.H.; Goerck, J.M.; Brooks, T.; Smith, K.G.; Williams, P.H. Avoiding pitfalls of using species distribution models in conservation planning. Conserv. Biol. 2003, 17, 1591–1600. [Google Scholar] [CrossRef]
- Buckley, L.B.; Urban, M.C.; Angilletta, M.J.; Crozier, L.G.; Rissler, L.J.; Sears, M.W. Can mechanism inform species’ distribution models? Ecol. Lett. 2010, 13, 1041–1054. [Google Scholar] [CrossRef]
- Merow, C.; Smith, M.J.; Edwards, T.C., Jr.; Guisan, A.; McMahon, S.M.; Normand, S.; Thuiller, W.; Wüest, R.O.; Zimmermann, N.E.; Elith, J. What do we gain from simplicity versus complexity in species distribution models? Ecography 2014, 37, 1267–1281. [Google Scholar] [CrossRef]
- Araújo, M.B.; Guisan, A. Five (or so) challenges for species distribution modelling. J. Biogeogr. 2006, 33, 1677–1688. [Google Scholar] [CrossRef]
- Zimmermann, N.E.; Edwards, T.C., Jr.; Graham, C.H.; Pearman, P.B.; Svenning, J.C. New trends in species distribution modelling. Ecography 2010, 33, 985–989. [Google Scholar] [CrossRef]
- Dormann, C.F.; Schymanski, S.J.; Cabral, J.; Chuine, I.; Graham, C.; Hartig, F.; Kearney, M.; Morin, X.; Römermann, C.; Schröder, B.; et al. Correlation and process in species distribution models: Bridging a dichotomy. J. Biogeogr. 2012, 39, 2119–2131. [Google Scholar] [CrossRef]
- Wisz, M.S.; Hijmans, R.; Li, J.; Peterson, A.T.; Graham, C.; Guisan, A.; NCEAS Predicting Species Distributions Working Group. Effects of sample size on the performance of species distribution models. Divers. Distrib. 2008, 14, 763–773. [Google Scholar] [CrossRef]
- Kelling, S.; Hochachka, W.; Fink, D.; Riedewald, M.; Caruana, R.; Ballard, G.; Hooker, G. Data-intensive Science: A New Paradigm for Biodiversity Studies. BioScience 2009, 59, 613–620. [Google Scholar] [CrossRef]
- Michener, W.K.; Jones, M.B. Ecoinformatics: Supporting ecology as a data-intensive science. Trends Ecol. Evol. 2012, 27, 85–93. [Google Scholar] [CrossRef]
- Liénard, J.; Harrison, J.; Strigul, N. US forest response to projected climate-related stress: A tolerance perspective. Glob. Chang. Biol. 2016, 22, 2875–2886. [Google Scholar] [CrossRef]
- Rumyantseva, O.; Strigul, N. Data-Driven Analysis of Forest–Climate Interactions in the Conterminous United States. Climate 2021, 9, 108. [Google Scholar] [CrossRef]
- Rumyantseva, O.; Sarantsev, A.; Strigul, N. Time series analysis of forest dynamics at the ecoregion level. Forecasting 2020, 2, 20. [Google Scholar] [CrossRef]
- Liénard, J.; Florescu, I.; Strigul, N. An Appraisal of the Classic Forest Succession Paradigm with the Shade Tolerance Index. PLoS ONE 2015, 10, e0117138. [Google Scholar] [CrossRef] [PubMed]
- Little, S.; Garrett, P.W. Pinus rigida Mill. pitch pine. Silvics N. Am. 1990, 1, 456–462. [Google Scholar]
- Williams, C.E. History and status of Table Mountain pine–pitch pine forests of the southern Appalachian Mountains (USA). Nat. Areas J. 1998, 18, 81–90. [Google Scholar]
- Bernard, J.M.; Seischab, F.K. Pitch pine (Pinus rigida Mill.) communities in northeastern New York state. Am. Midl. Nat. 1995, 134, 294–306. [Google Scholar] [CrossRef]
- Motzkin, G.; Patterson Iii, W.; Foster, D.R. A historical perspective on pitch pine–scrub oak communities in the Connecticut Valley of Massachusetts. Ecosystems 1999, 2, 255–273. [Google Scholar] [CrossRef]
- Brose, P.H.; Waldrop, T.A. Fire and the origin of Table Mountain pine pitch pine communities in the southern Appalachian Mountains, USA. Can. J. For. Res. 2006, 36, 710–718. [Google Scholar] [CrossRef]
- Grand, J.; Buonaccorsi, J.; Cushman, S.A.; Griffin, C.R.; Neel, M.C. A multiscale landscape approach to predicting bird and moth rarity hotspots in a threatened pitch pine–scrub oak community. Conserv. Biol. 2004, 18, 1063–1077. [Google Scholar] [CrossRef]
- Parshall, T.; Foster, D.R.; Faison, E.; MacDonald, D.; Hansen, B. Long-term history of vegetation and fire in pitch pine–oak forests on cape cod, massachusetts. Ecology 2003, 84, 736–748. [Google Scholar] [CrossRef]
- Gibson, J.; Moisen, G.; Frescino, T.; Edwards, T.C., Jr. Using publicly available forest inventory data in climate-based models of tree species distribution: Examining effects of true versus altered location coordinates. Ecosystems 2014, 17, 43–53. [Google Scholar] [CrossRef]
- Hair, J.E.; Anderson, R.E.; Tatham, R.L.; Black, W.C. Multivariate Data Analysis; Prentice Hall: Upper Saddle River, NJ, USA, 1998. [Google Scholar]
- Roth, A.E. Introduction to the Shapley value. Shapley Value 1988, 1, 1–27. [Google Scholar]
- Winter, E. The shapley value. Handb. Game Theory Econ. Appl. 2002, 3, 2025–2054. [Google Scholar]
- Jolliffe, I.T.; Cadima, J. Principal component analysis: A review and recent developments. Philos. Trans. R. Soc. A Math. Phys. Eng. Sci. 2016, 374, 20150202. [Google Scholar] [CrossRef] [PubMed]
- Meilleur, A.; Brisson, J.; Bouchard, A. Ecological analyses of the northernmost population of pitch pine (Pinus rigida). Can. J. For. Res. 1997, 27, 1342–1350. [Google Scholar] [CrossRef]
- Welch, N.; Waldrop, T.A.; Buckner, E. Response of southern Appalachian table mountain pine (Pinus pungens) and pitch pine (P. rigida) stands to prescribed burning. For. Ecol. Manag. 2000, 136, 185–197. [Google Scholar] [CrossRef]
- Jordan, M.J.; Patterson, W.A., III; Windisch, A.G. Conceptual ecological models for the Long Island pitch pine barrens: Implications for managing rare plant communities. For. Ecol. Manag. 2003, 185, 151–168. [Google Scholar] [CrossRef]
- Ledig, F.T.; Smouse, P.E.; Hom, J.L. Postglacial migration and adaptation for dispersal in pitch pine (Pinaceae). Am. J. Bot. 2015, 102, 2074–2091. [Google Scholar] [CrossRef]
- Hwang, J.; Son, Y. Short-term effects of thinning and liming on forest soils of pitch pine and Japanese larch plantations in central Korea. Ecol. Res. 2006, 21, 671–680. [Google Scholar] [CrossRef]
- Kearney, M.R.; Wintle, B.A.; Porter, W.P. Correlative and mechanistic models of species distribution provide congruent forecasts under climate change. Conserv. Lett. 2010, 3, 203–213. [Google Scholar] [CrossRef]
- Talluto, M.V.; Boulangeat, I.; Ameztegui, A.; Aubin, I.; Berteaux, D.; Butler, A.; Doyon, F.; Drever, C.R.; Fortin, M.J.; Franceschini, T.; et al. Cross-scale integration of knowledge for predicting species ranges: A metamodelling framework. Glob. Ecol. Biogeogr. 2016, 25, 238–249. [Google Scholar] [CrossRef] [PubMed]
- Whittaker, R. Communities and Ecosystems; Current Concepts in Biology; Macmillan Company, Collier-Macmillan Limited: London, UK, 1970. [Google Scholar]
- von Humboldt, A.; Bonpland, A. Essai sur la Géographie des Plantes; Chez Levrault, Schoell et Compagnie: Paris, France, 1805. [Google Scholar]
- Köppen, W. Die Wärmezonen der Erde, nach der Dauer der heissen, gemässigten und kalten Zeit und nach der Wirkung der Wärme auf die organische Welt betrachtet. Meteorol. Z. 1884, 1, 5–226. [Google Scholar]
- Köppen, W. Versuch einer Klassifikation der Klimate, vorzugsweise nach ihren Beziehungen zur Pflanzenwelt. Geogr. Z. 1900, 6, 593–611. [Google Scholar]
- Koppen, W. Klassifikation der Klima nach Temperatur, Niederschlag und Jahreslauf. Petermanns Geogr. Mitteilungen 1918, 64, 193–203. [Google Scholar]
- Geiger, R.; Pohl, W. Eine neue Wandkarte der Klimagebiete der Erde nach W. Köppens Klassifikation (A New Wall Map of the Climatic Regions of the World According to W. Köppen’s Classification). Erdkunde 1954, 8, 58–61. [Google Scholar]
- Rubel, F.; Kottek, M. Observed and projected climate shifts 1901–2100 depicted by world maps of the Köppen-Geiger climate classification. Meteorol. Z. 2010, 19, 135–141. [Google Scholar] [CrossRef]
- Trewartha, G.; Horn, L. An Introduction to Climate, 5th ed.; McGraw-Hill Book Co.: New York City, NY, USA, 1980. [Google Scholar]
- Belda, M.; Holtanová, E.; Halenka, T.; Kalvová, J. Climate classification revisited: From Köppen to Trewartha. Clim. Res. 2014, 59, 1–13. [Google Scholar] [CrossRef]
- Bailey, R.G. Ecosystem Geography: From Ecoregions to Sites; Springer Science & Business Media: Berlin/Heidelberg, Germany, 2009. [Google Scholar]
- Holdridge, L.R. Determination of world plant formations from simple climatic data. Science 1947, 105, 367–368. [Google Scholar] [CrossRef]
- Holdridge, L.R. Life Zone Ecology, Rev. ed.; Tropical Science Center: San Jose, Costa Rica, 1967. [Google Scholar]
- Lugo, A.E.; Brown, S.L.; Dodson, R.; Smith, T.S.; Shugart, H.H. The Holdridge life zones of the conterminous United States in relation to ecosystem mapping. J. Biogeogr. 1999, 26, 1025–1038. [Google Scholar] [CrossRef]


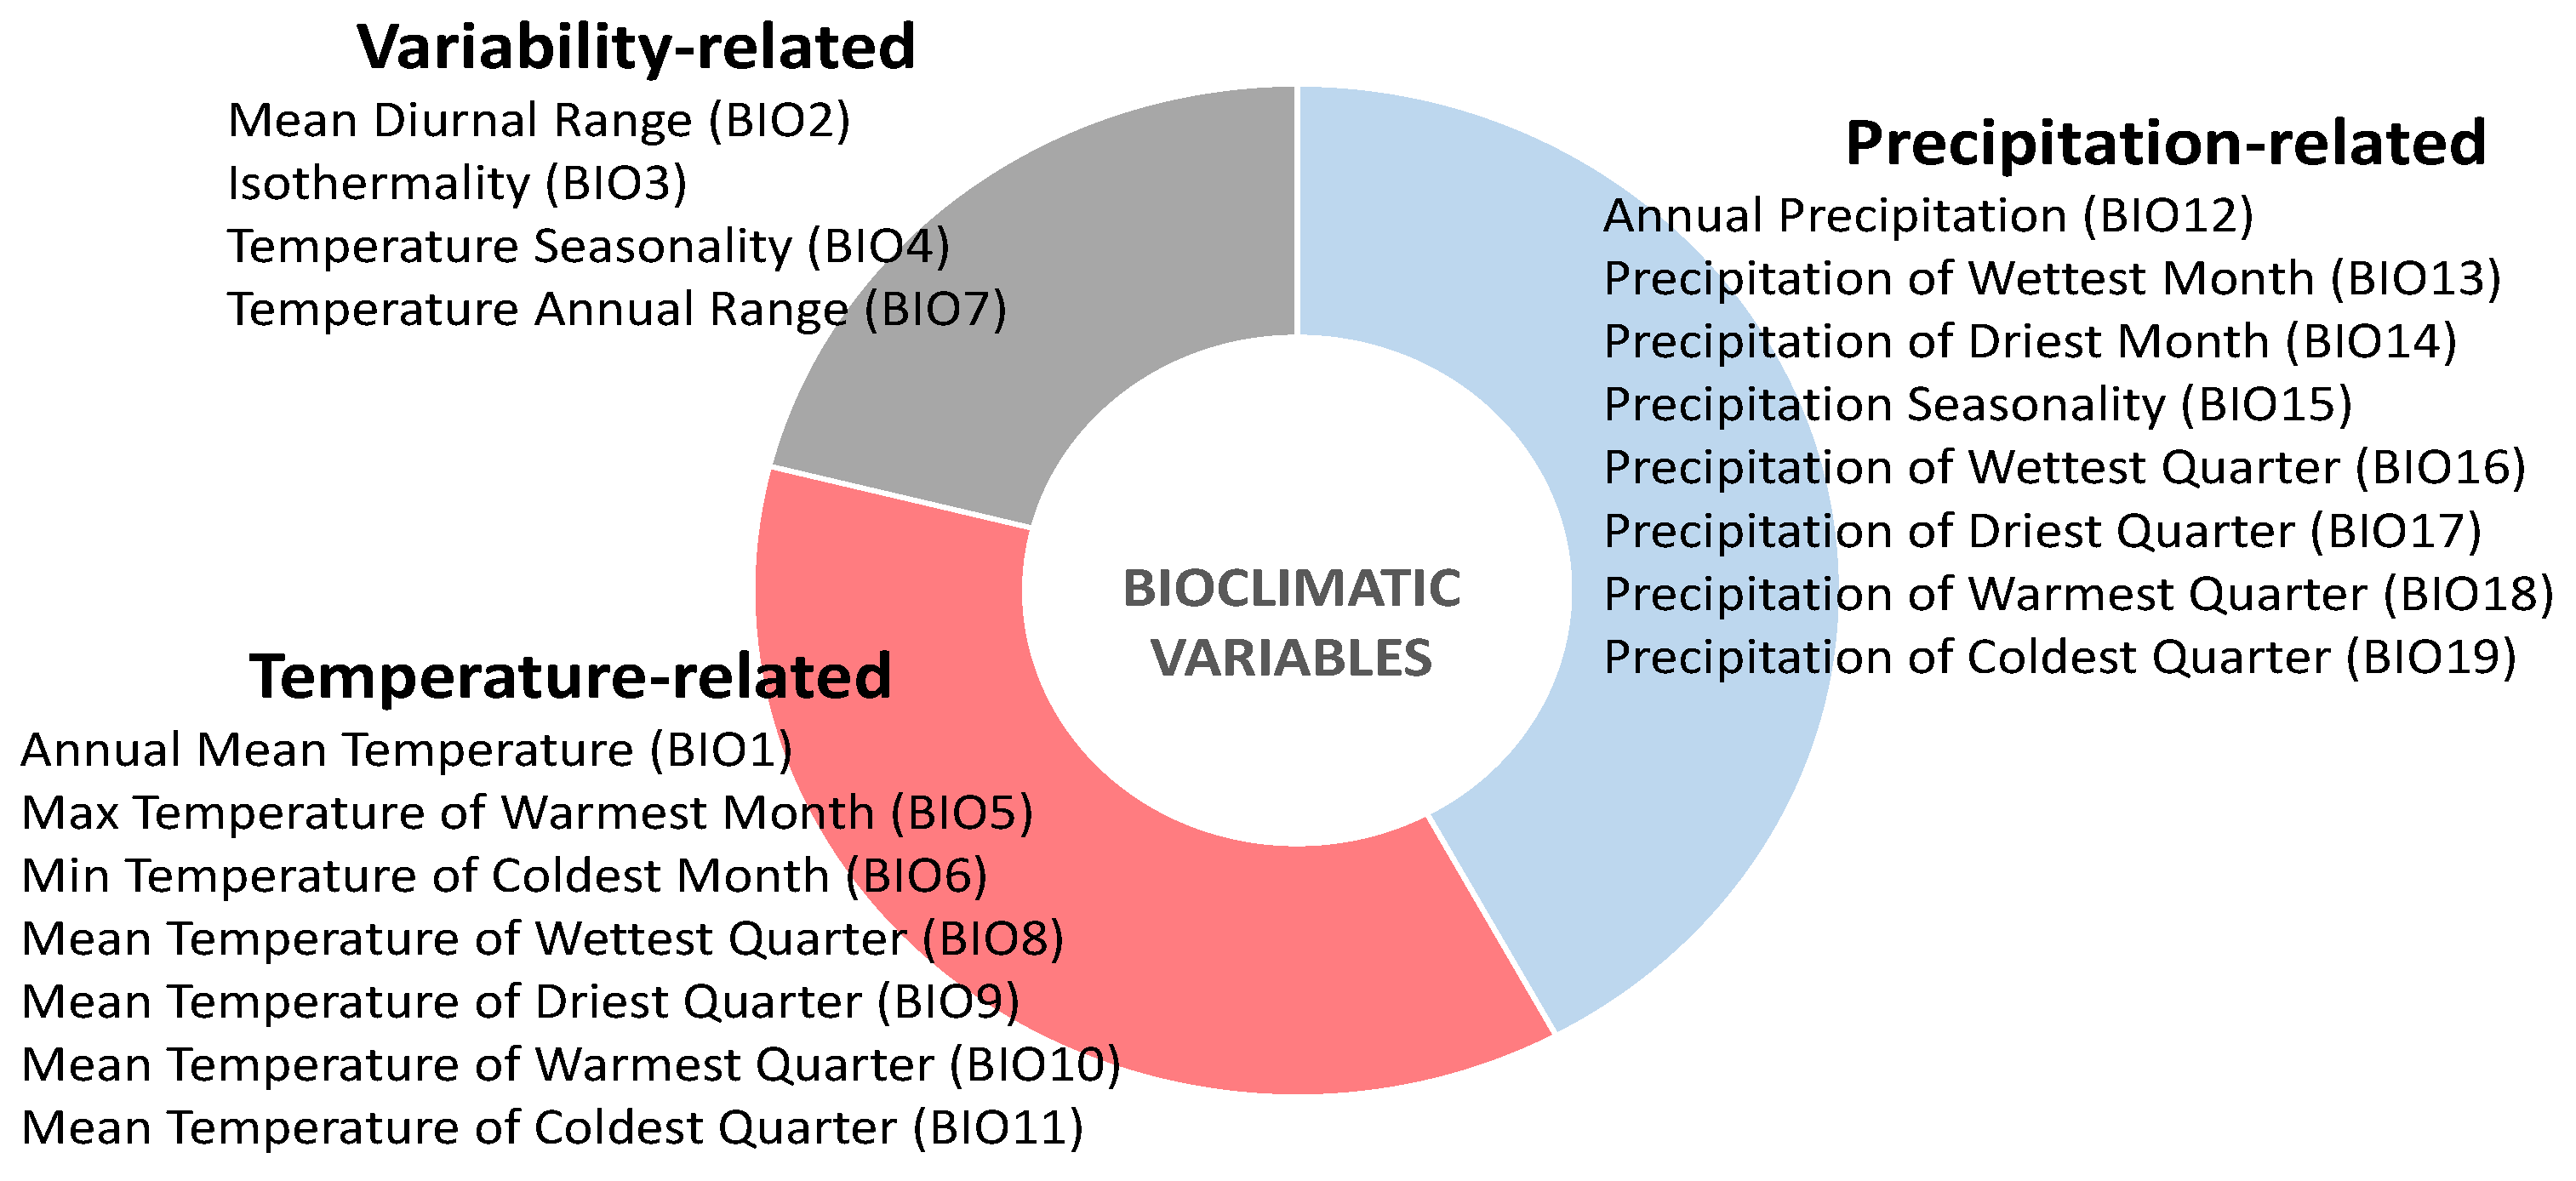
| Code | Appellation | Formula |
|---|---|---|
| BIO1 | Annual Mean Temperature | |
| BIO2 | Mean Diurnal Range | |
| BIO3 | Isothermality | |
| BIO4 | Temperature Seasonality | |
| BIO5 | Max Temperature of Warmest Month | |
| BIO6 | Min Temperature of Coldest Month | |
| BIO7 | Temperature Annual Range | |
| BIO8 | Mean Temperature of Wettest Quarter | where is an average temperature of the month k belonging to the wettest quarter. |
| BIO9 | Mean Temperature of Driest Quarter | where is an average temperature of the month k belonging to the driest quarter. |
| BIO10 | Mean Temperature of Warmest Quarter | where is an average temperature of the month k belonging to the warmest quarter. |
| BIO11 | Mean Temperature of Coldest Quarter | where is an average temperature of the month k belonging to the coldest quarter. |
| BIO12 | Annual Precipitation | |
| BIO13 | Precipitation of Wettest Month | |
| BIO14 | Precipitation of Driest Month | |
| BIO15 | Precipitation Seasonality | |
| BIO16 | Precipitation of Wettest Quarter | |
| BIO17 | Precipitation of Driest Quarter | |
| BIO18 | Precipitation of Warmest Quarter | month i is in the warmest quarter. |
| BIO19 | Precipitation of Coldest Quarter | month i is in the coldest quarter. |
Disclaimer/Publisher’s Note: The statements, opinions and data contained in all publications are solely those of the individual author(s) and contributor(s) and not of MDPI and/or the editor(s). MDPI and/or the editor(s) disclaim responsibility for any injury to people or property resulting from any ideas, methods, instructions or products referred to in the content. |
© 2024 by the authors. Licensee MDPI, Basel, Switzerland. This article is an open access article distributed under the terms and conditions of the Creative Commons Attribution (CC BY) license (https://creativecommons.org/licenses/by/4.0/).
Share and Cite
Rumyantseva, O.; Strigul, N. Stepwise Multidimensional Climate Envelop Modeling of Pitch Pine (Pinus rigida). Forests 2024, 15, 819. https://doi.org/10.3390/f15050819
Rumyantseva O, Strigul N. Stepwise Multidimensional Climate Envelop Modeling of Pitch Pine (Pinus rigida). Forests. 2024; 15(5):819. https://doi.org/10.3390/f15050819
Chicago/Turabian StyleRumyantseva, Olga, and Nikolay Strigul. 2024. "Stepwise Multidimensional Climate Envelop Modeling of Pitch Pine (Pinus rigida)" Forests 15, no. 5: 819. https://doi.org/10.3390/f15050819
APA StyleRumyantseva, O., & Strigul, N. (2024). Stepwise Multidimensional Climate Envelop Modeling of Pitch Pine (Pinus rigida). Forests, 15(5), 819. https://doi.org/10.3390/f15050819