Article

Effects of Illumination Conditions on Individual Tree Height Extraction Using UAV LiDAR: Pilot Study of a Planted Coniferous Stand

1
Chongqing Jinfo Mountain Karst Ecosystem National Observation and Research Station, School of Geographical Sciences, Southwest University, Chongqing 400715, China
2
Chongqing Engineering Research Center for Remote Sensing Big Data Application, School of Geographical Sciences, Southwest University, Chongqing 400715, China
*
Author to whom correspondence should be addressed.
Forests 2024, 15(5), 758; https://doi.org/10.3390/f15050758
Submission received: 26 March 2024 / Revised: 17 April 2024 / Accepted: 24 April 2024 / Published: 26 April 2024
(This article belongs to the Topic Individual Tree Detection (ITD) and Its Applications)

Abstract

:
Tree height is one of the key dendrometric parameters for indirectly estimating the timber volume or aboveground biomass of a forest. Field measurement is time-consuming and labor-intensive, while unmanned aerial vehicle (UAV)-borne LiDAR is a more efficient tool for acquiring tree heights of large-area forests. Although individual tree heights extracted from point cloud data are of high accuracy, they are still affected by some weather and environment factors. In this study, taking a planted M. glyptostroboides (Metasequoia glyptostroboides Hu & W.C. Cheng) stand as the study object, we preliminarily assessed the effects of various illumination conditions (solar altitude angle and cloud cover) on tree height extraction using UAV LiDAR. The eight point clouds of the target stand were scanned at four time points (sunrise, noon, sunset, and night) in two consecutive days (sunny and overcast), respectively. The point clouds were first classified into ground points and aboveground vegetation points, which accordingly produced digital elevation model (DEM) and digital surface model (DSM). Then, the canopy height model (CHM) was obtained by subtracting DEM from DSM. Subsequently, individual trees were segmented based on the seed points identified by local maxima filtering. Finally, the individual tree heights of sample trees were separately extracted and assessed against the in situ measured values. As results, the R2 and RMSEs of tree heights obtained in the overcast daytime were commonly better than those in the sunny daytime; the R2 and RMSEs at night were superior among all time points, while those at noon were poorest. These indicated that the accuracy of individual tree height extraction had an inverse correlation with the intensity of illumination. To obtain more accurate tree heights for forestry applications, it is best to acquire point cloud data using UAV LiDAR at night, or at least not at noon when the illumination is generally strongest.

1. Introduction

Tree height is one of the key dendrometric parameters for indirectly estimating the timber volume or aboveground biomass of a forest [1]. Field measuring methods for tree heights such as height measuring pole or total station are of relatively high accuracy, but usually time-consuming and labor-intensive [2]. They are generally infeasible for large forests with lush understory vegetation or/and a high density. Additionally, field surveys are relatively difficult to carry out for those forests located in steep mountainous regions [3]. Photogrammetry, which measures object dimensions without direct contact, is a cost-effective method for extracting tree heights of large forests [4]. However, the accuracy is relatively low, especially for dense forests with insufficient natural light [5]. The emergence of light detection and ranging (LiDAR) systems provides a more promising alternative for efficiently and accurately obtaining tree heights [6,7].
As an active remote sensing technology, LiDAR emits laser pulses and receives their returns reflected by object surfaces [8]. The distance between the sensor and the target is generally measured by the time of flight (TOF) method or phase-shift method [9]. With the spatial position of the LiDAR as a reference, the three-dimensional (3D) coordinates of a reflection point on the target object can be accurately derived. When there are enough such points (also called point clouds), the 3D model of the target object can be established. Therefore, the point clouds of dense forests can be obtained using a LiDAR, from which the tree heights will be conveniently extracted [10]. LiDARs are mainly divided into satellite-borne, aircraft-borne, and ground-based platforms [11]. Satellite-borne laser altimetry can obtain the stand-scale tree heights of very large forests with a wide swath, but it is usually difficult to extract individual-scale tree heights due to the sparse point density [12]. Manned aircraft-borne LiDAR can scan the point clouds of a forest and extract individual tree heights with sound quality [13], but the prohibitive cost for small areas and relatively higher personnel risk make it hard to be widely deployed and used periodically. Terrestrial LiDAR can acquire the dense and high-precision point clouds of trees at ground level, but its spatial coverage is extremely limited [14,15,16]. For these three types of LiDAR, their ranging accuracy increases sequentially, but the spatial coverage decreases accordingly.
In recent years, with the development of unmanned aerial vehicles (UAVs) and lightweight sensors, UAV-borne LiDAR has gradually matured [17]. It has bigger spatial coverage than terrestrial LiDAR, higher accuracy than satellite-borne LiDAR, and lower cost and personnel risk than airborne LiDAR. During operations, UAV-borne LiDARs emit laser pulses from the top to measure the forest, while the penetrating nature of the laser pulses and their multiple returns allow for obtaining more detailed information on the vertical structure of the canopies and the ground surface [18]. Therefore, it has been increasingly used in forest surveys and forest ecology studies. For instance, Chen et al. [19] utilized DJI M600-borne LiDAR (DJ-Innovations, Shenzhen, China) to scan the point cloud of a powerline corridor located in a mountainous forest region, and predicted tree encroachment early by combining the extracted individual tree heights and Richards growth model; Wang et al. [17] precisely mapped the aboveground biomass of mangrove forests on Hainan Island using UAV LiDAR sampling; Almeida et al. [20] monitored restored tropical forest diversity and structure through a UAV-borne hyperspectral and LiDAR fusion. Among these studies, individual tree heights extracted from the point clouds scanned by UAV LiDAR were one of the most basic structural parameters.
Although individual tree heights acquired by UAV LiDAR are of high accuracy [21,22], they are still affected by some weather and environmental factors, including illumination conditions, air humidity, rugged topography, complexity of forest structure, and so on. Under natural conditions, the intensity of illumination during a day is mainly determined by the solar altitude angle. In addition, cloud cover is also an important factor affecting the intensity of illumination throughout the day [23]. As the wavelength of the surveying LiDAR (near-infrared) is within the spectral range of sunlight, the reflected and backscattered sunlight will restrict the signal-to-noise ratio (SNR) of the detector of the LiDAR [24]. Accordingly, the ranging accuracies of UAV LiDAR will be affected to various extents. Therefore, it is necessary to assess the effects of different illumination conditions on the accuracy of individual tree height extraction. Thus, to obtain more accurate tree heights, we can choose a more suitable time point to carry out scanning operations with UAV LiDAR. However, there are currently few relevant studies reported in the literature.
In this paper, we conduct a pilot study on the effects of UAV-borne LiDAR for individual tree height extraction under various illumination conditions, including solar altitude angle and cloud cover. Eight point clouds of the target stand were scanned at four time points (sunrise, noon, sunset, and night) over two consecutive days (sunny and overcast). Our specific objectives were as follows: (1) to accurately extract individual tree heights from the eight point clouds acquired by UAV LiDAR under different illumination conditions; (2) to assess the accuracies of extracted individual tree heights against in situ measured values; and (3) to reveal the qualitative correlation between illumination intensity and the resulting accuracy of individual tree heights, and find out the optimal time point for scanning operations using UAV LiDAR.

2. Study Site and Data
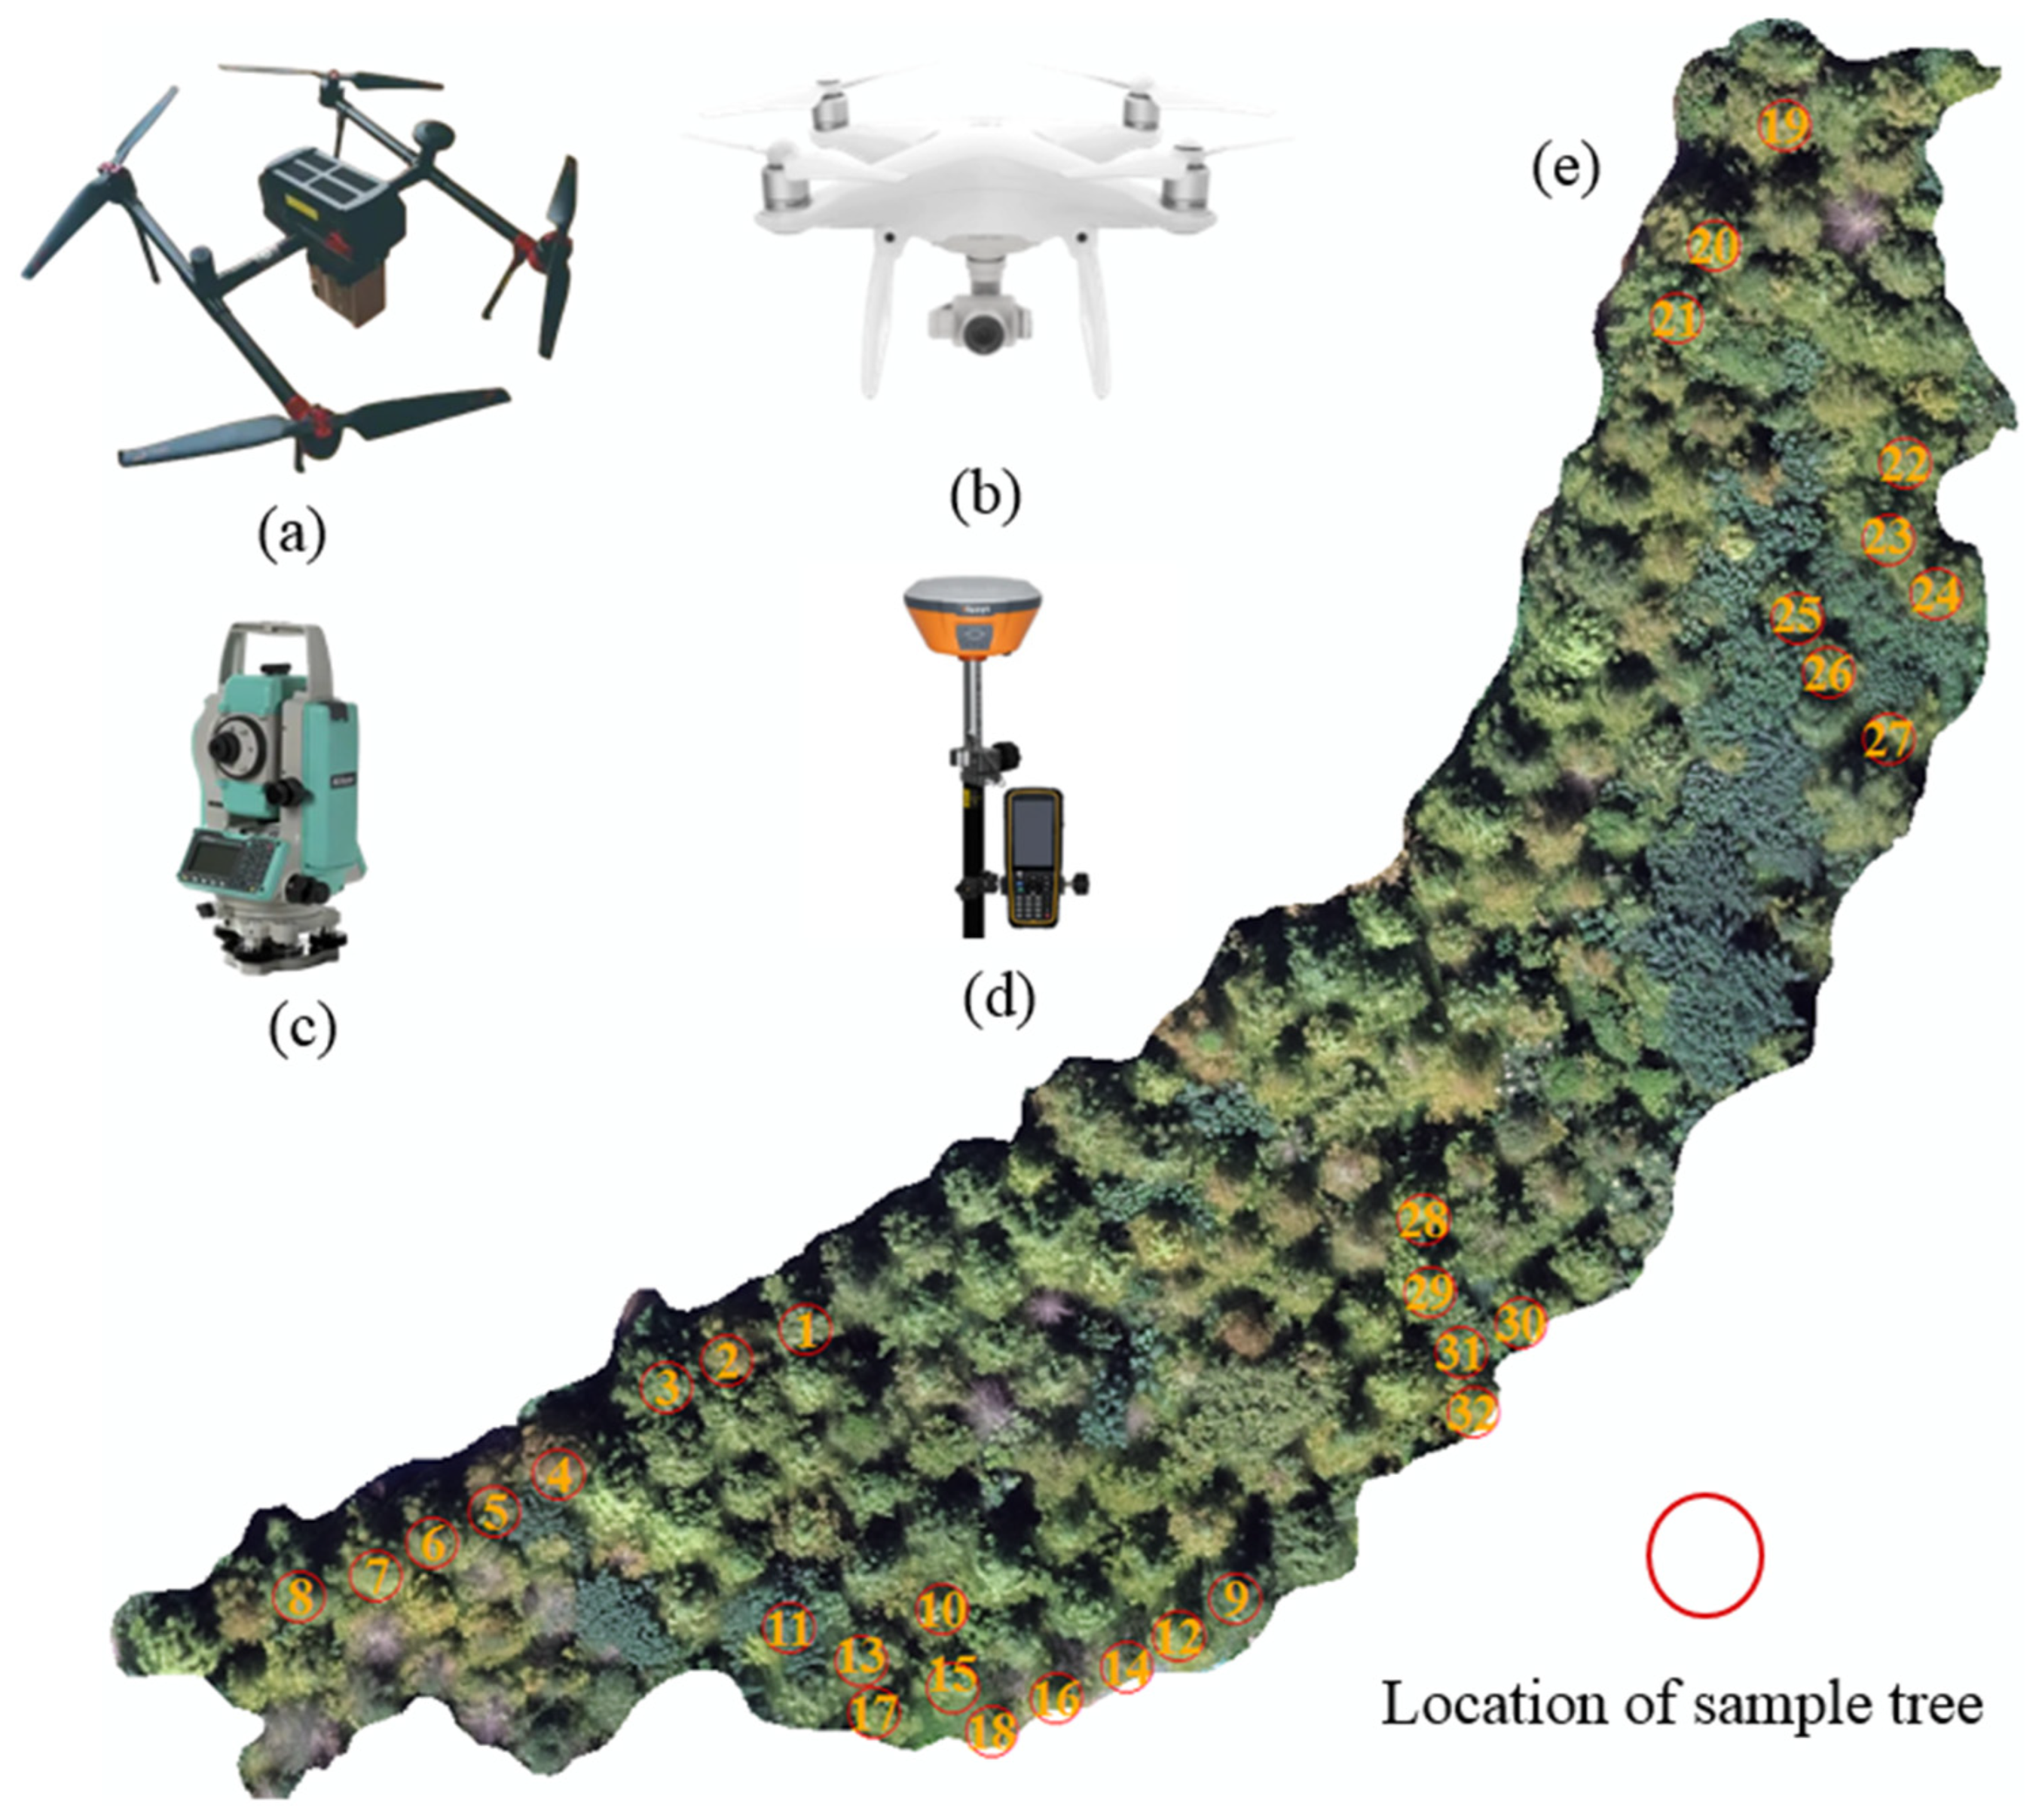
2.1. Study Site

The study site is located at the lower reach of the Ma’anxi Creek in the northwestern part of Beibei District (Figure 1a), Chongqing Municipality, China. The creek begins at the Longtanzi Reservoir and ends at the Jialing River, with a length of approximately 4 km. This region possesses a subtropical monsoon climate, which is characterized by low wind, high humidity, and abundant rainfall in the hot season. Many tree species such as Camphora officinarum, Neosinocalamus affinis, and M. glyptostroboides (Metasequoia glyptostroboides Hu & W.C. Cheng) grow along the Ma’anxi creek. The total area of the study site (Figure 1c) was approximately 0.26 ha with an average northwest slope of 16.47°. M. glyptostroboides is the predominant species of the planted stand with a relatively uniform spacing and tree age, but there is almost no regular management. The trunk of M. glyptostroboides is tall and straight, with a steeple-shaped crown when viewed from the side and a rounded crown when viewed from the top [25]. Thus, it is a tree species whose height can be relatively easily measured in situ. Therefore, the study site is very appropriate for studying the effects of different illumination conditions on tree height extraction using a UAV-borne LiDAR.

2.2. Data

2.2.1. Point Clouds Scanned under Different Illumination Conditions

As shown in Figure 2a, the UAV-borne LiDAR system used in the point scanning was a Feima D2000 (FEIMA Robotics, Shenzhen, China) equipped with a Feima D-LiDAR2000 (FEIMA Robotics, Shenzhen, China). The Feima D2000 is a four-rotor drone with a payload of up to 700 g, and is positioned using an onboard RTK (real-time kinematic) GNSS (Global Navigation Satellite System). The D-LiDAR2000 is a triple-echo laser scanner capable of detecting three returns from a single laser pulse, including those from the ground, tree trunks, and vegetation canopies. The detailed technical parameters of this LiDAR are listed in Table 1.
Under natural conditions, the variation in light intensity during a day is generally caused by the different altitude angles of the sun at different times. Additionally, at the same solar altitude angle, different cloud covers have different blocking effects on sunlight, which can also cause changes in illumination intensity. In this study, to assess the effects of different illumination conditions (solar altitude angle and cloud cover) on tree height extraction, there were eight UAV-based scanning operations for the study site carried out at four time points (sunrise, noon, sunset, and night) over two consecutive days (sunny and overcast). During the two days, the other weather conditions in our experiments were relatively consistent, including no rainfall, low wind speed (no tree shaking), insensible change in humidity, and so forth. The specific information of the eight UAV-borne LiDAR scanning measurements is listed in Table 2.
As indicated in Figure 1b, a cross-flight route was adopted in the eight UAV LiDAR scanning operations. To ensure consistent and uniform laser scanning across the entire study site, the side overlap was set as 60% and the flight speed was 5 m/s. Furthermore, the relative flight altitude was set as 90 m, guaranteeing a point density of approximately 2000 points/m2. After flight operations, eight raw point clouds scanned under different illuminations were obtained.
Subsequently, the raw point cloud data underwent pipeline processing, including utilizing Inertial Explorer 8.70 (https://novatel.com/products/, accessed on 2 January 2024) for waypoint post-processing and the Data Processing Toolbox of Feima UAVmanager for point cloud resolving (https://www.feimarobotics.com/en/productDetailManager, accessed on 2 January 2024). The resulting point cloud data were stored in the LAS format, with a coordinate system of WGS84/UTM Zone 48N.

2.2.2. In Situ Measured Tree Heights
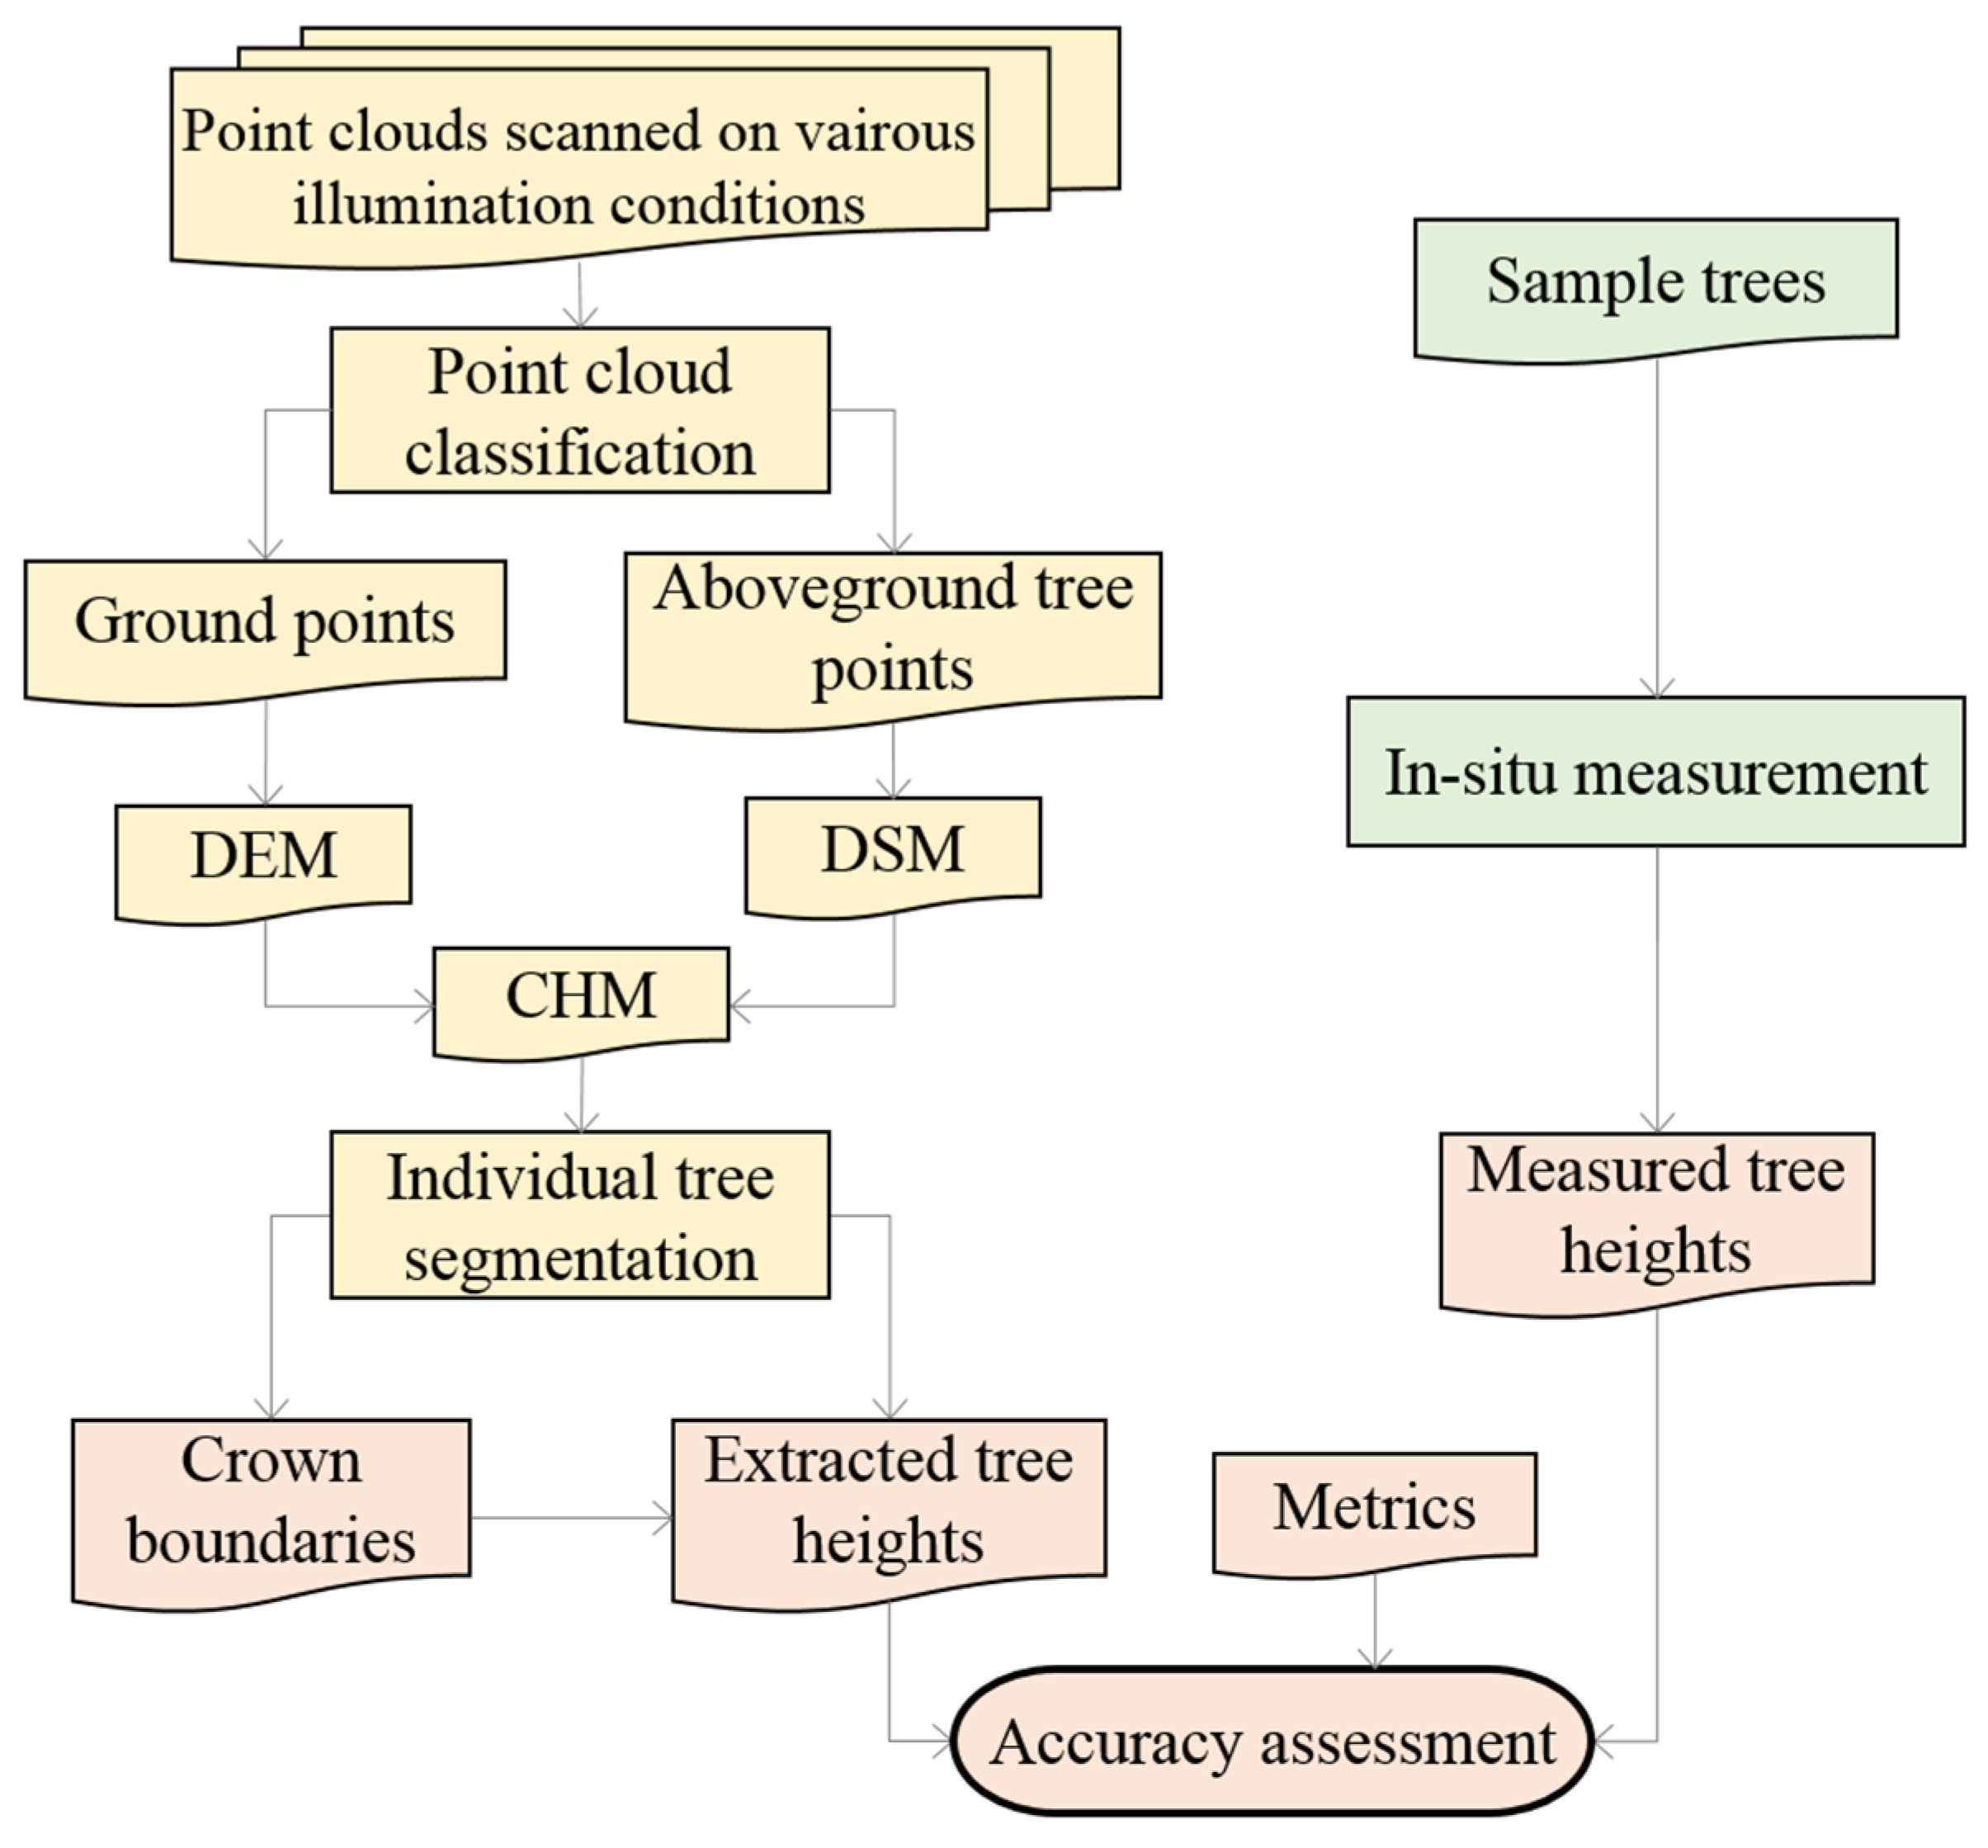
In order to facilitate the identification and localization of the sample trees, a DJI Phantom 4 pro (DJ-Innovations, Shenzhen, China) (Figure 2b) equipped with a Sony Exmor R CMOS sensor (Sony Group, Beijing, China) was used to capture RGB images of the study site on 10 September 2023. The flight altitude for the drone was set as 90 m, guaranteeing a ground sampling distance (GSD) of approximately 0.05 m. The heading overlap and lateral overlap were set to 90% and 70%, respectively. Based on the overlapping RGB images, the orthoimage (Figure 2e) of the study site was produced using the Pix4Dmapper Version 4.5.6 (https://www.pix4d.com.cn/pix4dmapper, accessed on 2 January 2024). It shared the same coordinate system as that of the LiDAR data acquired in Section 2.2.1.
To improve the accuracy of in situ measured tree heights, only those trees with fewer occlusions and easy measurement in the study site were selected as samples. As a result, there were 32 M. glyptostroboides purposely selected as sample trees. As indicated in Figure 2e, the spatial locations and number identifiers of those sample trees were separately labeled. The height of each sample tree was measured using a RTS-882 total station (Figure 2c) from multiple directions or angles [26], whose mean value was used as ground truth for later accuracy assessment. A RTK GNSS system (Figure 2d) was used to precisely obtain the coordinates of the sample trees, matching the positions on the orthoimage. The in situ measured heights of sample trees are listed in Table 3.

3. Methods

To assess the illumination effects, the individual heights of sample trees were separately extracted from the eight point clouds scanned by UAV-borne LiDAR. The specific procedures are as follows. Firstly, the ground and aboveground tree points were separated via classifying the raw point clouds. Secondly, the digital elevation model (DEM) and digital surface model (DSM) were produced by rasterizing the ground points and non-ground points, respectively. Thirdly, the canopy height model (CHM) was acquired by subtracting the DEM from the corresponding DSM. Fourthly, the seed points representing the highest points of individual trees were generated by using Gaussian filtering. Based on the seed points, the CHM was segmented into individual trees. Fifthly, the crown boundaries of individual trees were extracted, and the tree heights were determined as the highest points falling into the boundaries. Finally, the accuracies of the extracted individual heights of sample trees under different illumination conditions were assessed against the measured values in terms of various metrics. The detailed workflow of this study is illustrated in Figure 3.

3.1. Point Cloud Classification
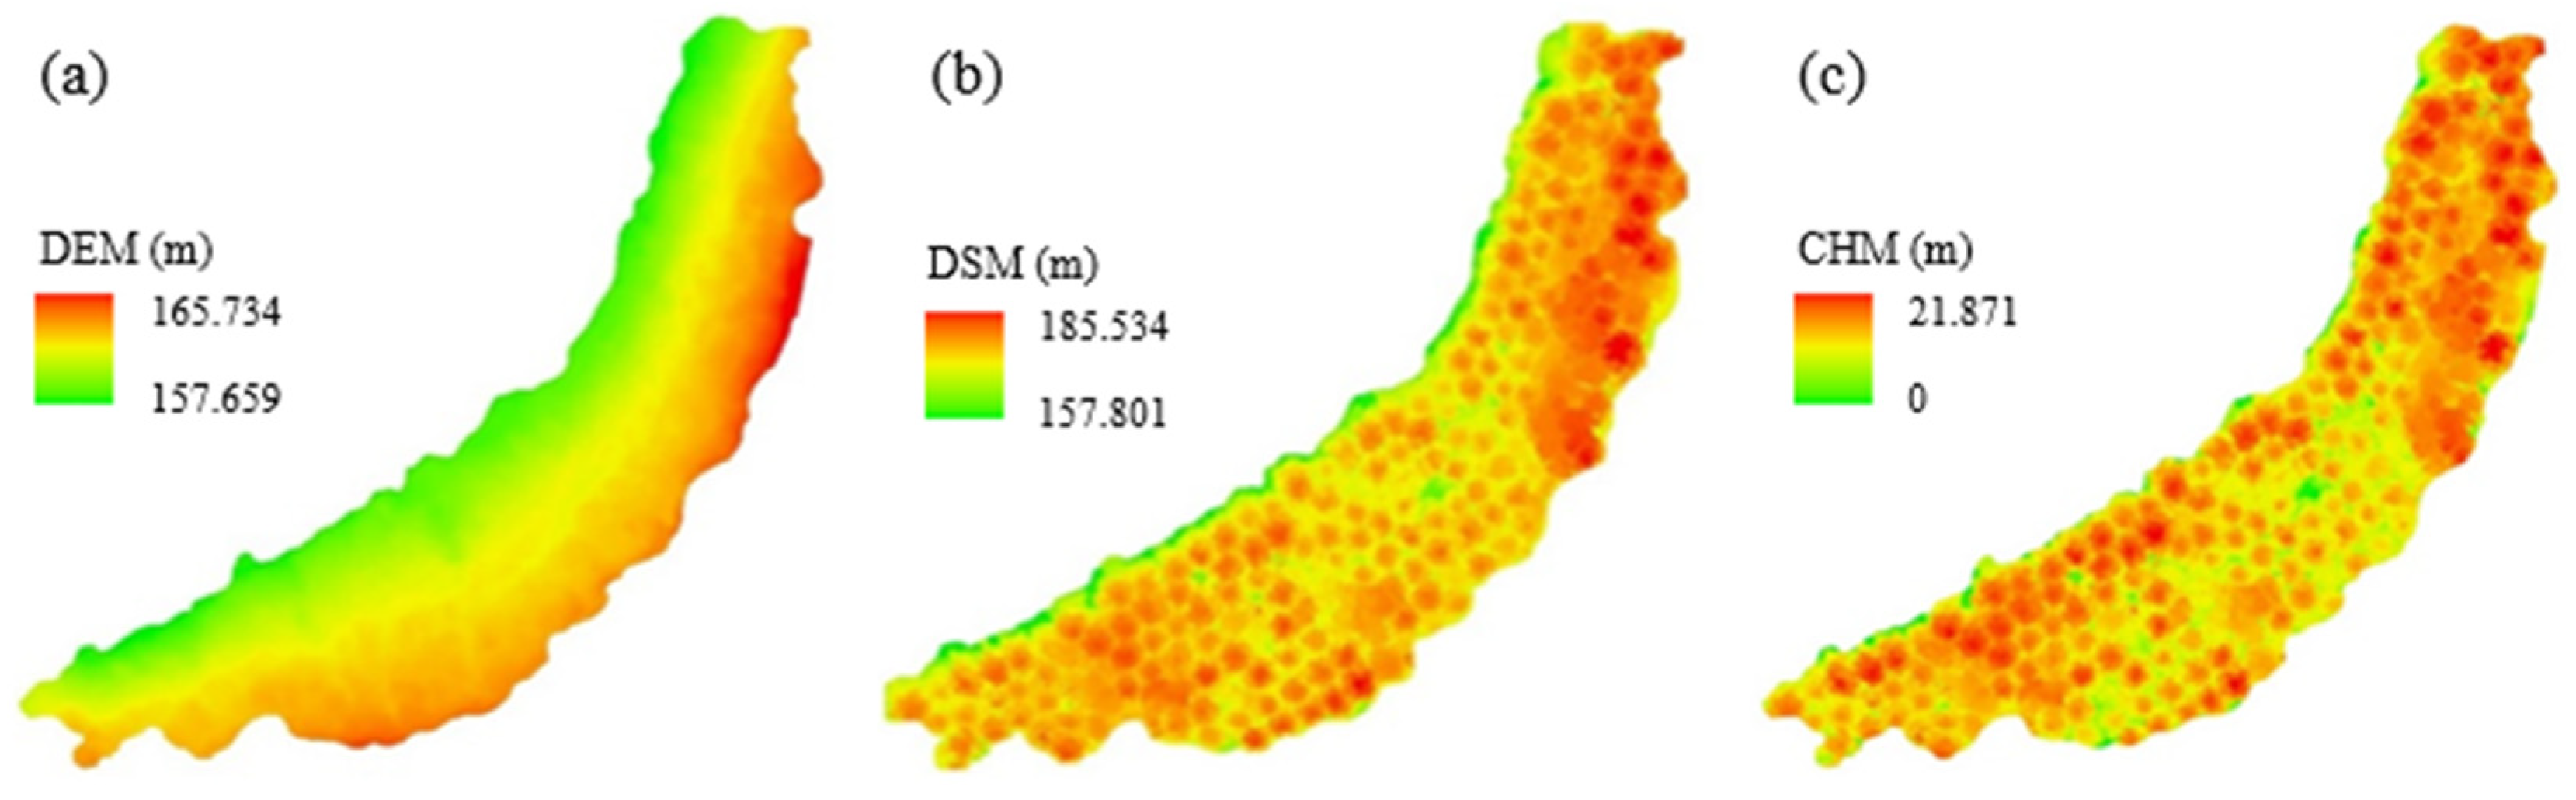
Accurate classification of ground points and aboveground forest points from the raw points clouds is the prerequisite for extracting individual heights of M. glyptostroboides. Before classification, the point denoising should be first performed. The points outside the target scanning area have significant errors and need to be removed in advance. Subsequently, the noise points that are caused by the device or external factors are filtered out from the remaining points. In this study, the improved progressive TIN densification algorithm [27] was used to separate ground points. The point cloud was first rasterized for morphological operations and local minimums were found as potential ground seed points. Then, a TIN-based model was constructed using the obtained accurate ground seed points, and iteratively densified according to some criteria on iterative angles and distance. As a result, the points that make up the final TIN were considered as ground points, while the remaining points were vegetation points.

3.2. CHM Creation

The CHM is the surface model which reflects the distance between the vegetation surface and the ground [28]. It can be utilized to infer tree parameters such as crown width and height. In this study, the CHM was created using Equation (1) below.
C H M = D S M D E M
The DSM generally includes the elevation information of buildings, trees, and other objects above the ground, and is produced from the classified vegetation points. The DEM reflects the true undulations of the ground, and is produced from the classified ground points. Since both the DSM and DEM are in raster format, their productions involve the step of rasterization. As the cell size impacts the extraction of the crown boundaries and seed points for individual tree segmentation, the rasterized DSM and DEM should have the same spatial resolution, which were determined by repeated experiments [29].

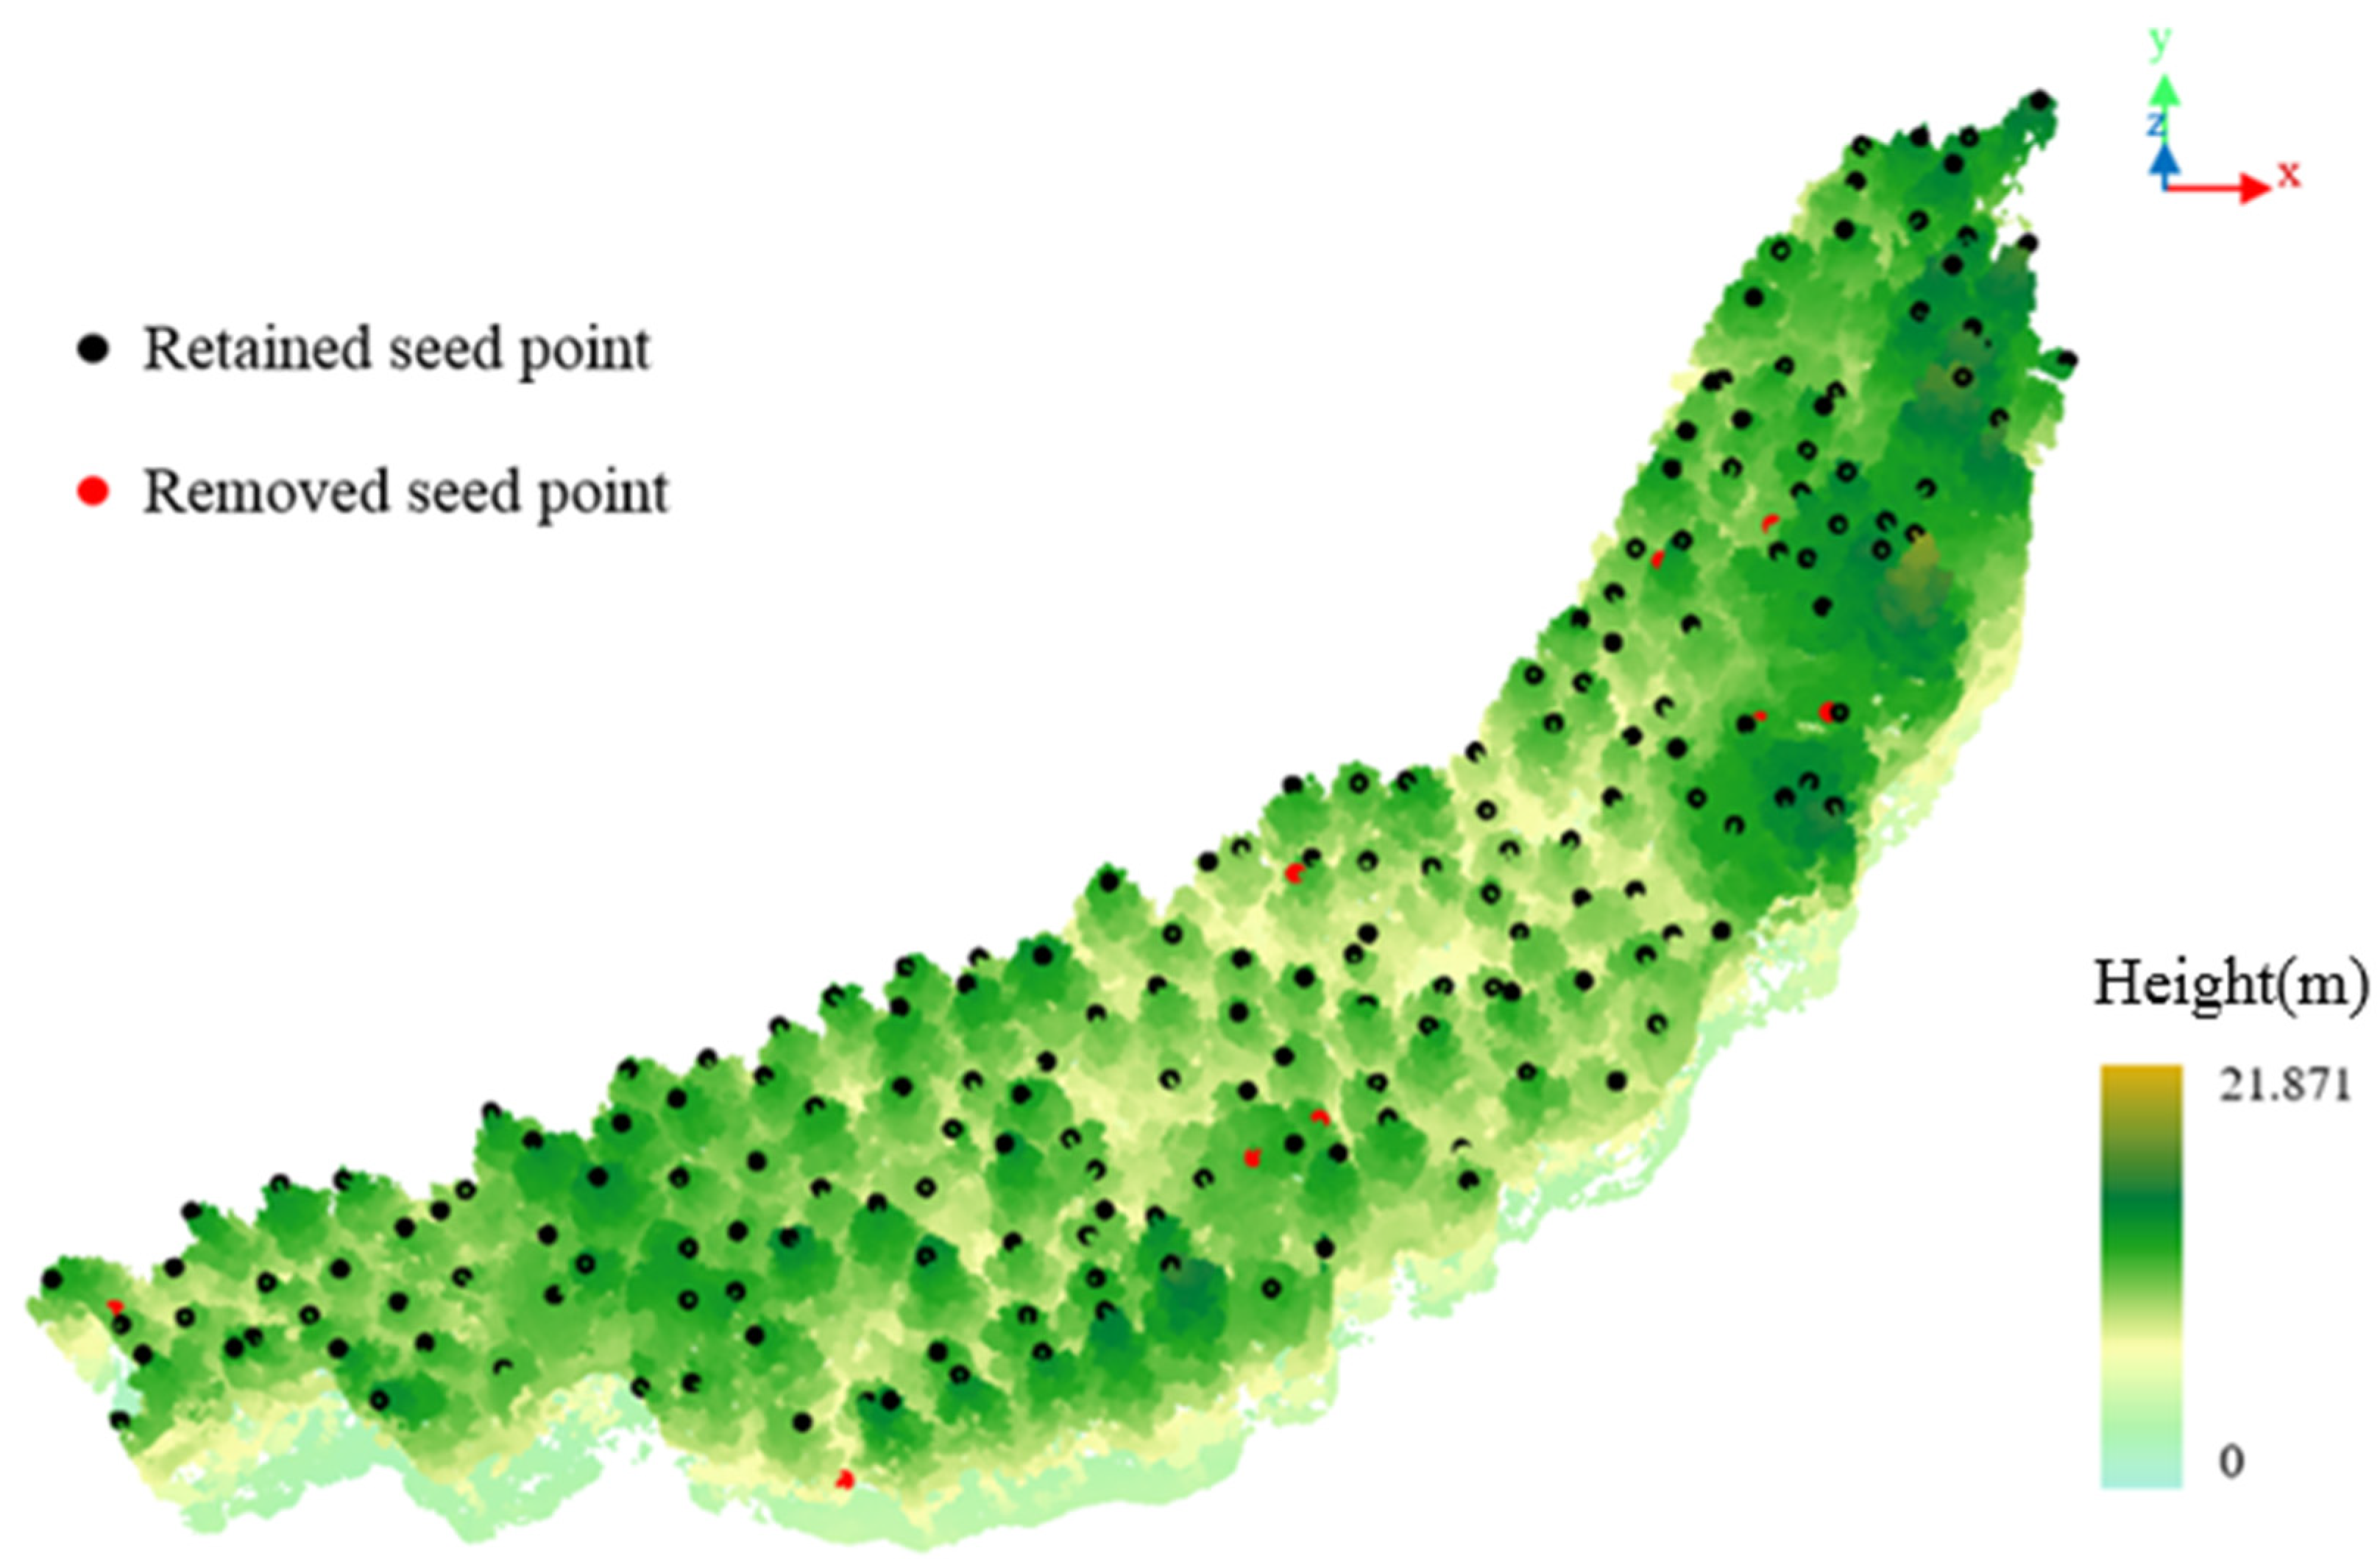
3.3. Individual Tree Segmentation and Height Extraction

The k-means clustering algorithm is used to segment individual trees from the point cloud [30]. The first step of the segmentation process was the seed point extraction from the CHM. Gaussian filtering was employed to smooth the CHM to remove noise while preserving essential details. The local maxima filter [31] was utilized to search for the points with the local maximum heights as starting positions (seed points). The second step of the cluster analysis starts off these locations in an iteration process. Each iteration consists of reassigning points to their nearest cluster centroid all at once, which is followed by a recalculation of the cluster centroids. Then, points are individually reassigned if that reduces the sum of distances and the cluster centroids are recomputed after each assignment.
The tree height commonly refers to the distance from the top of the tree crown to the ground. The crown boundaries of segmented individual trees are the convex hull polygons generated by projecting the belonging points onto the ground. Then, the individual tree heights are determined as the highest points falling into the boundaries.
The paired samples t-test was employed to assess the statistical significance of differences between every two groups of field-measured and eight LiDAR-derived tree heights. This test is particularly suitable for datasets involving measurements taken under different conditions [32], as seen with the tree heights extracted under various illumination conditions in this study. It compares the means of two groups of field-measured and -extracted tree heights to determine if a statistically significant difference exists between them. A p-value less than 0.05 indicates a statistically significant difference between two datasets.

3.4. Metrics for Accuracy Assessment

The individual tree heights of sample trees extracted from point clouds acquired under varying illumination conditions were subjected to comparison with in situ measured values. The metrics, including R2 (coefficient of determination), Bias, root mean square error (RMSE), and relative RMSE (rRMSE) [33], were calculated using Equations (2)–(5), respectively. According to the resulting metric values, the impacts of various illuminations on individual tree height extraction using UAV-borne LiDAR were evaluated.
R 2 = x x ¯ y y ¯ x x ¯ 2 y y ¯ 2 2
B i a s = x y n
RMSE   = ( x y ) 2 n
r R M S E = R M S E x ¯ × 100 %
where y represents extracted individual tree heights; y ¯ is the average extracted tree height; x denotes in situ measured tree heights; x ¯ is the average measured tree height; and n is the number of sample trees.

4. Results

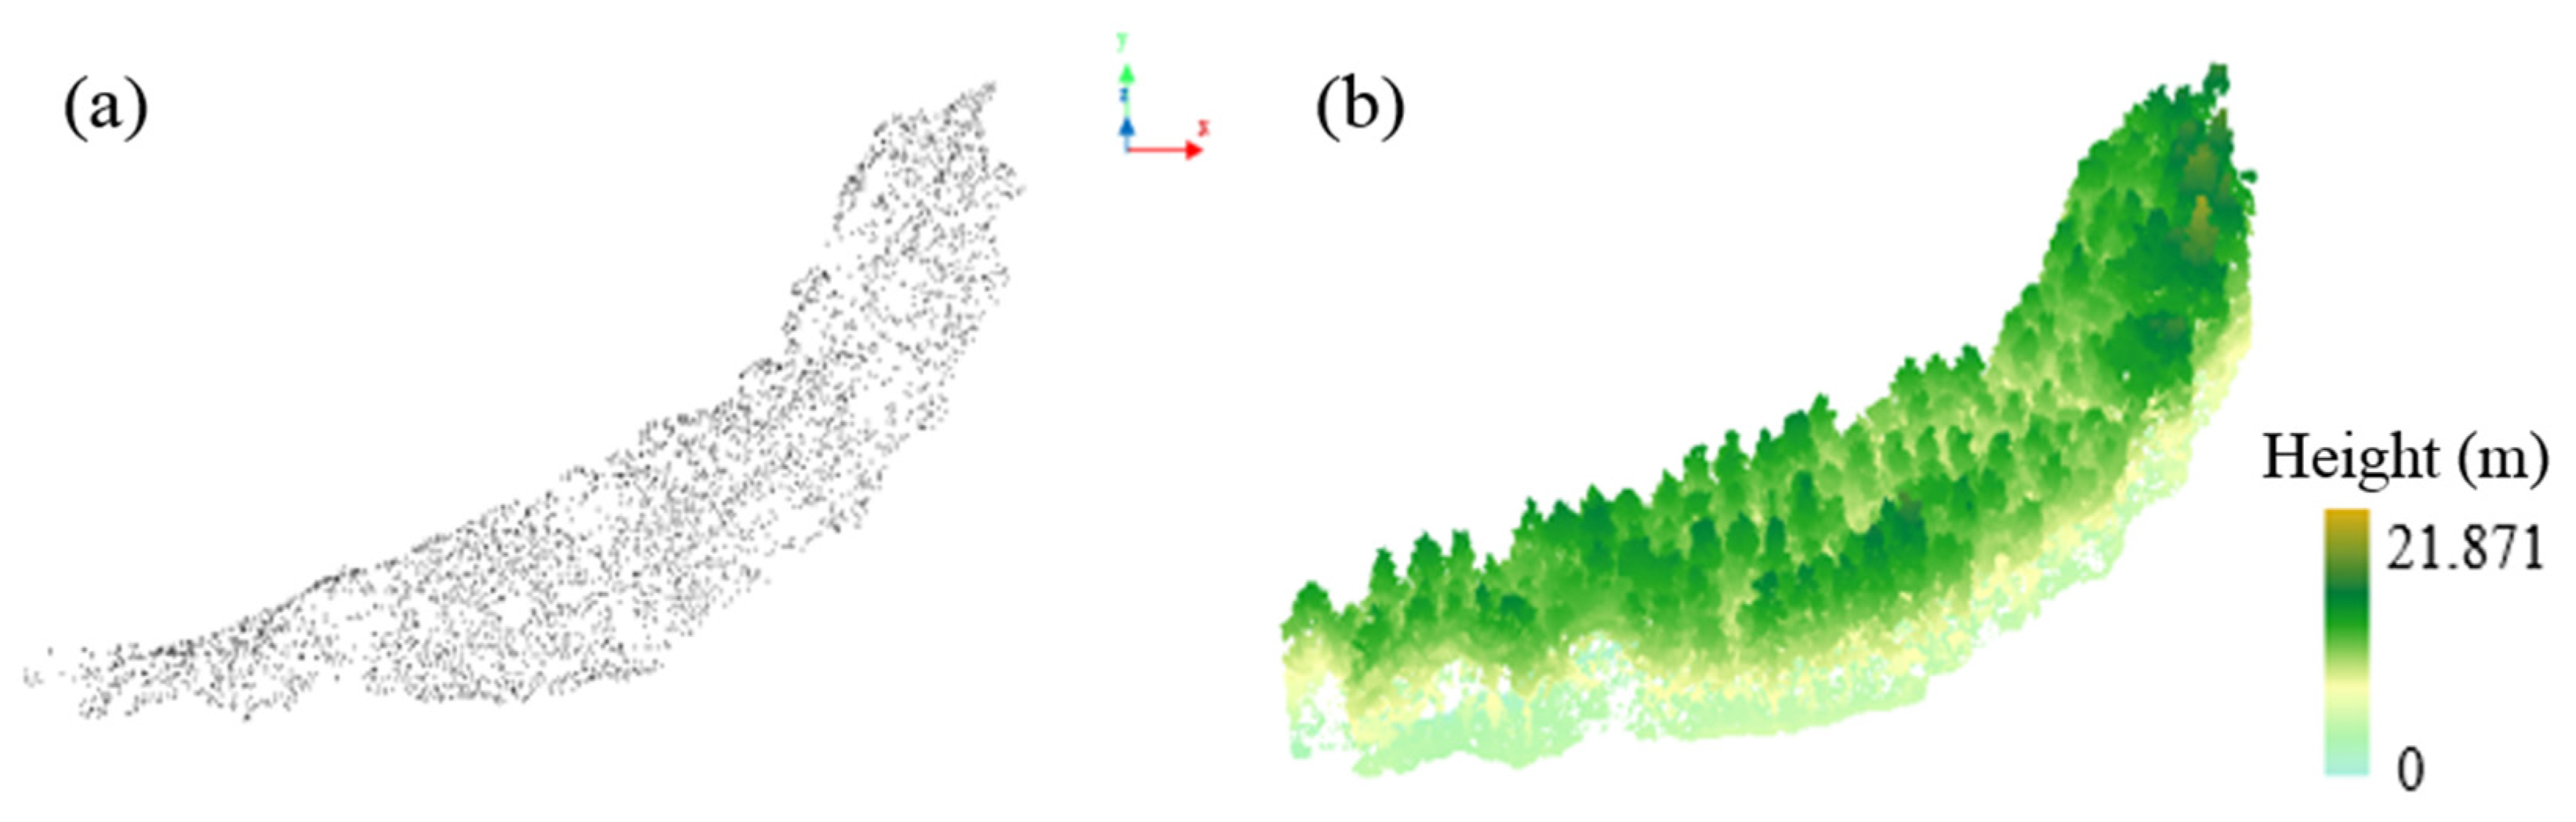
4.1. Classified Point Clouds

The eight point clouds scanned by UAV LiDAR were separately classified into the ground and aboveground vegetation points using the software LiDAR360 V6.0 (https://www.lidar360.com/, accessed on 2 January 2024). Taking the point cloud acquired during the sunny night as an example, we analyzed the characteristics of the separated point cloud. As the scanning operations occurred in summer, the understory weeds were lush, partially obstructing the laser pulses directed towards the ground. Nevertheless, as shown in Figure 4a, the distribution of the resulting ground points was relatively uniform without large gaps. Hence, it provided a reliable representation of the terrain surface and sufficient for subsequent DEM generation. Simultaneously, the crown morphological characteristics of M. glyptostroboides can be clearly observed in Figure 4b, and were beneficial for the subsequent production of high-precision DSM of the study area.

4.2. Created CHM

Using the classified point clouds in the sunny night as an example, the process of generating the CHM of the study site is illustrated in Figure 5. Several candidate spatial resolutions (0.1 m, 0.3 m, and 0.5 m) were sequentially tested, and 0.3 m was determined as the optimum one. Then, the ground points were interpolated and rasterized into an DEM image with the optimum spatial resolution (Figure 5a). Meanwhile, the DSM in Figure 5b was generated by interpolating and rasterizing aboveground vegetation points. It shared the same spatial resolution with the DEM. Based on the DEM and DSM, the resulting CHM is indicated in Figure 5c. Notably, the maximum height recorded for an individual tree in the study site was 21.871 m. With greater growth space and more abundant sunlight, the trees located on the edges grew much lusher and had higher heights.

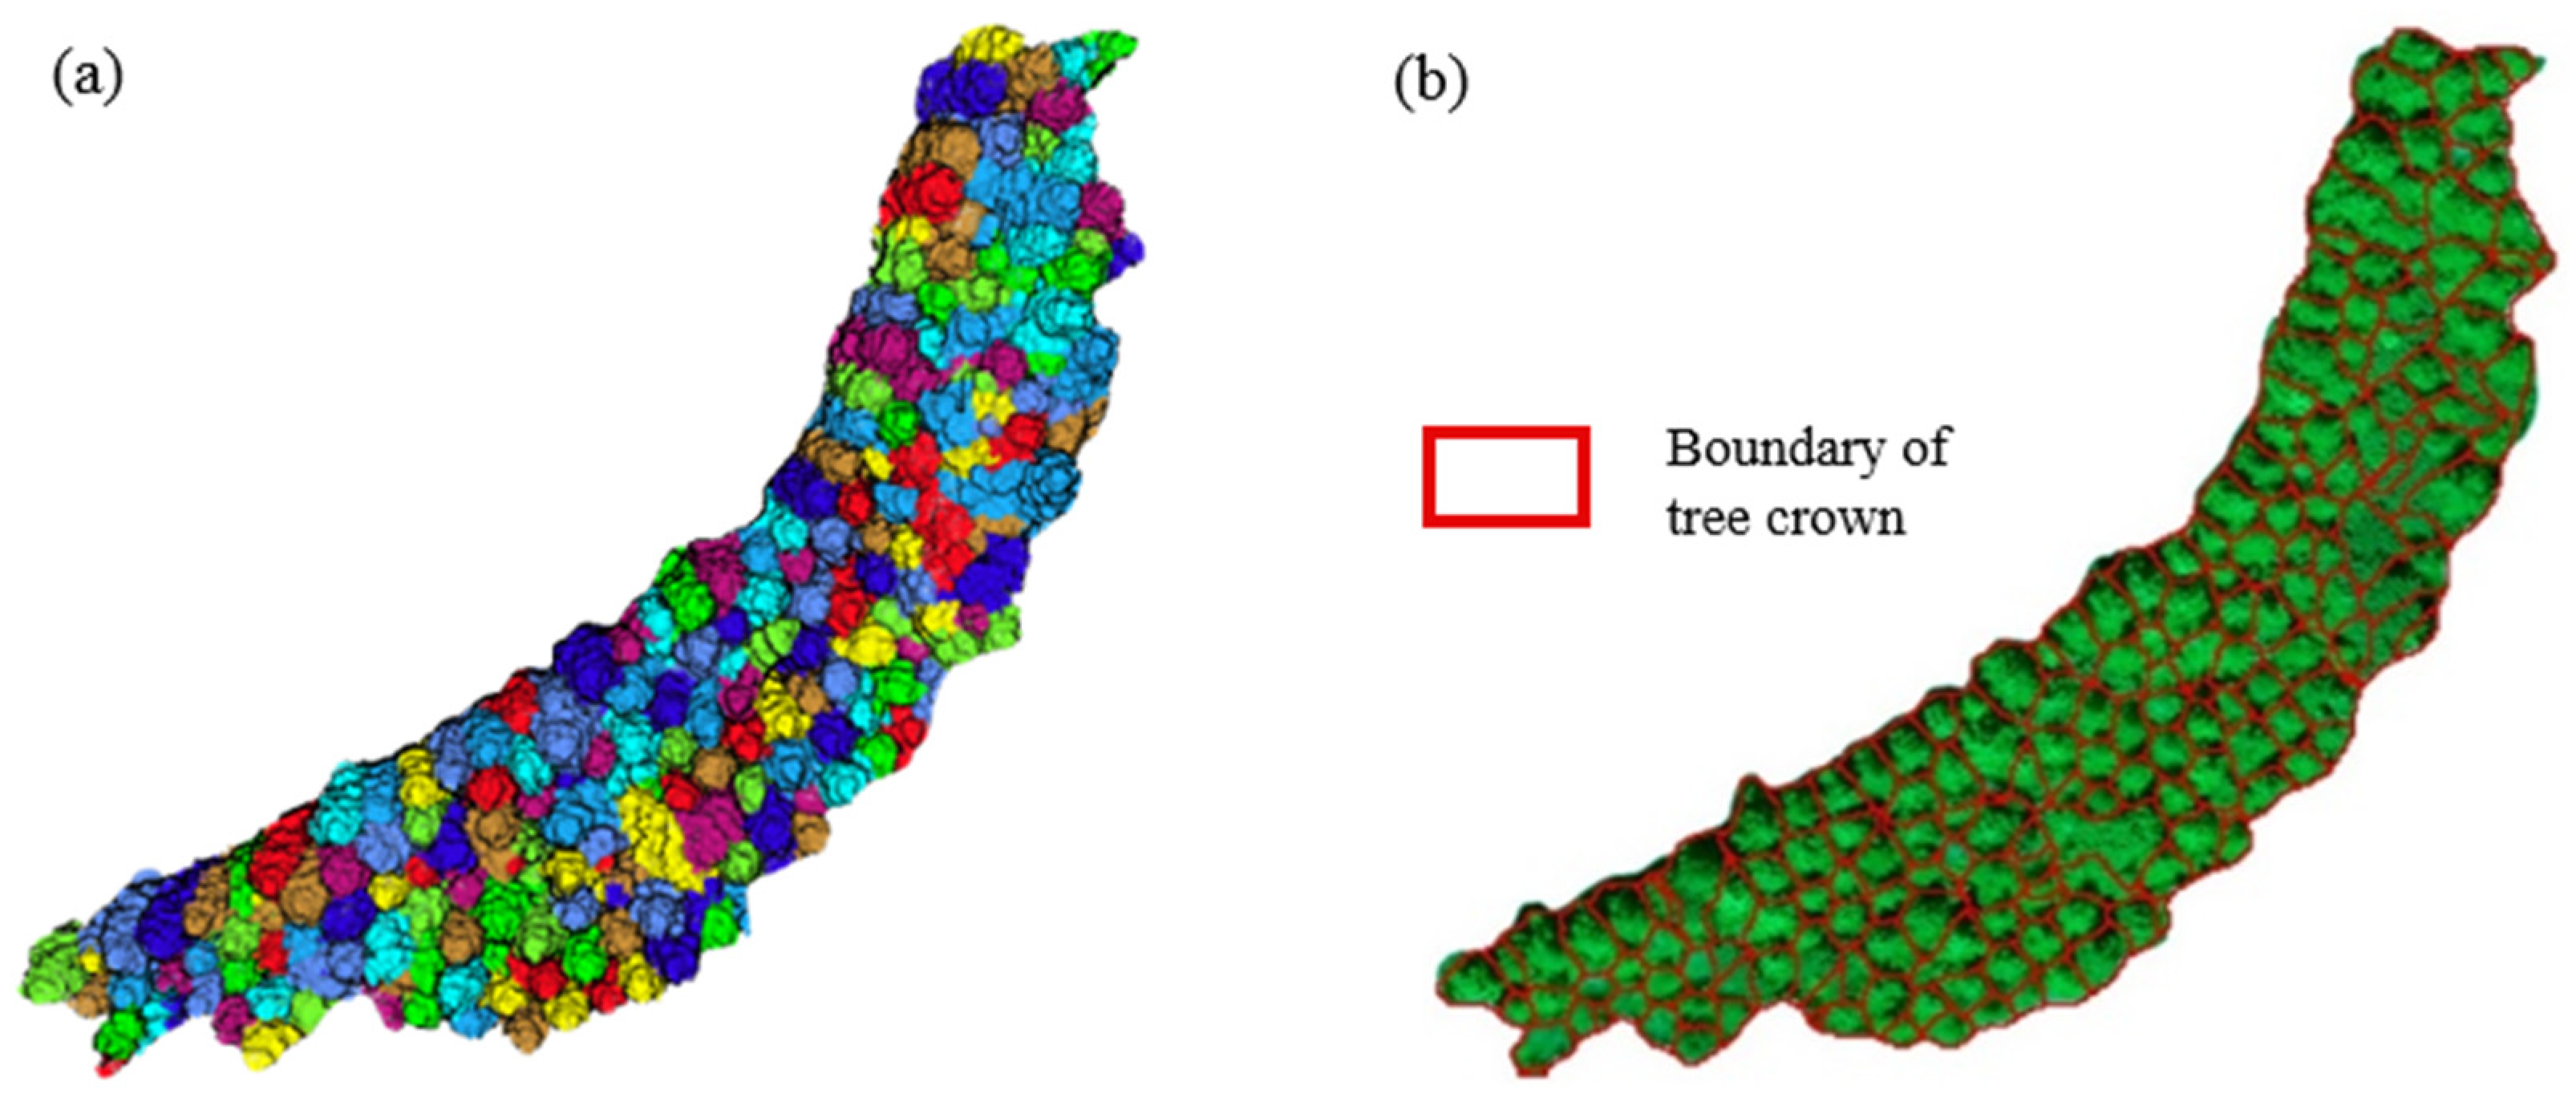
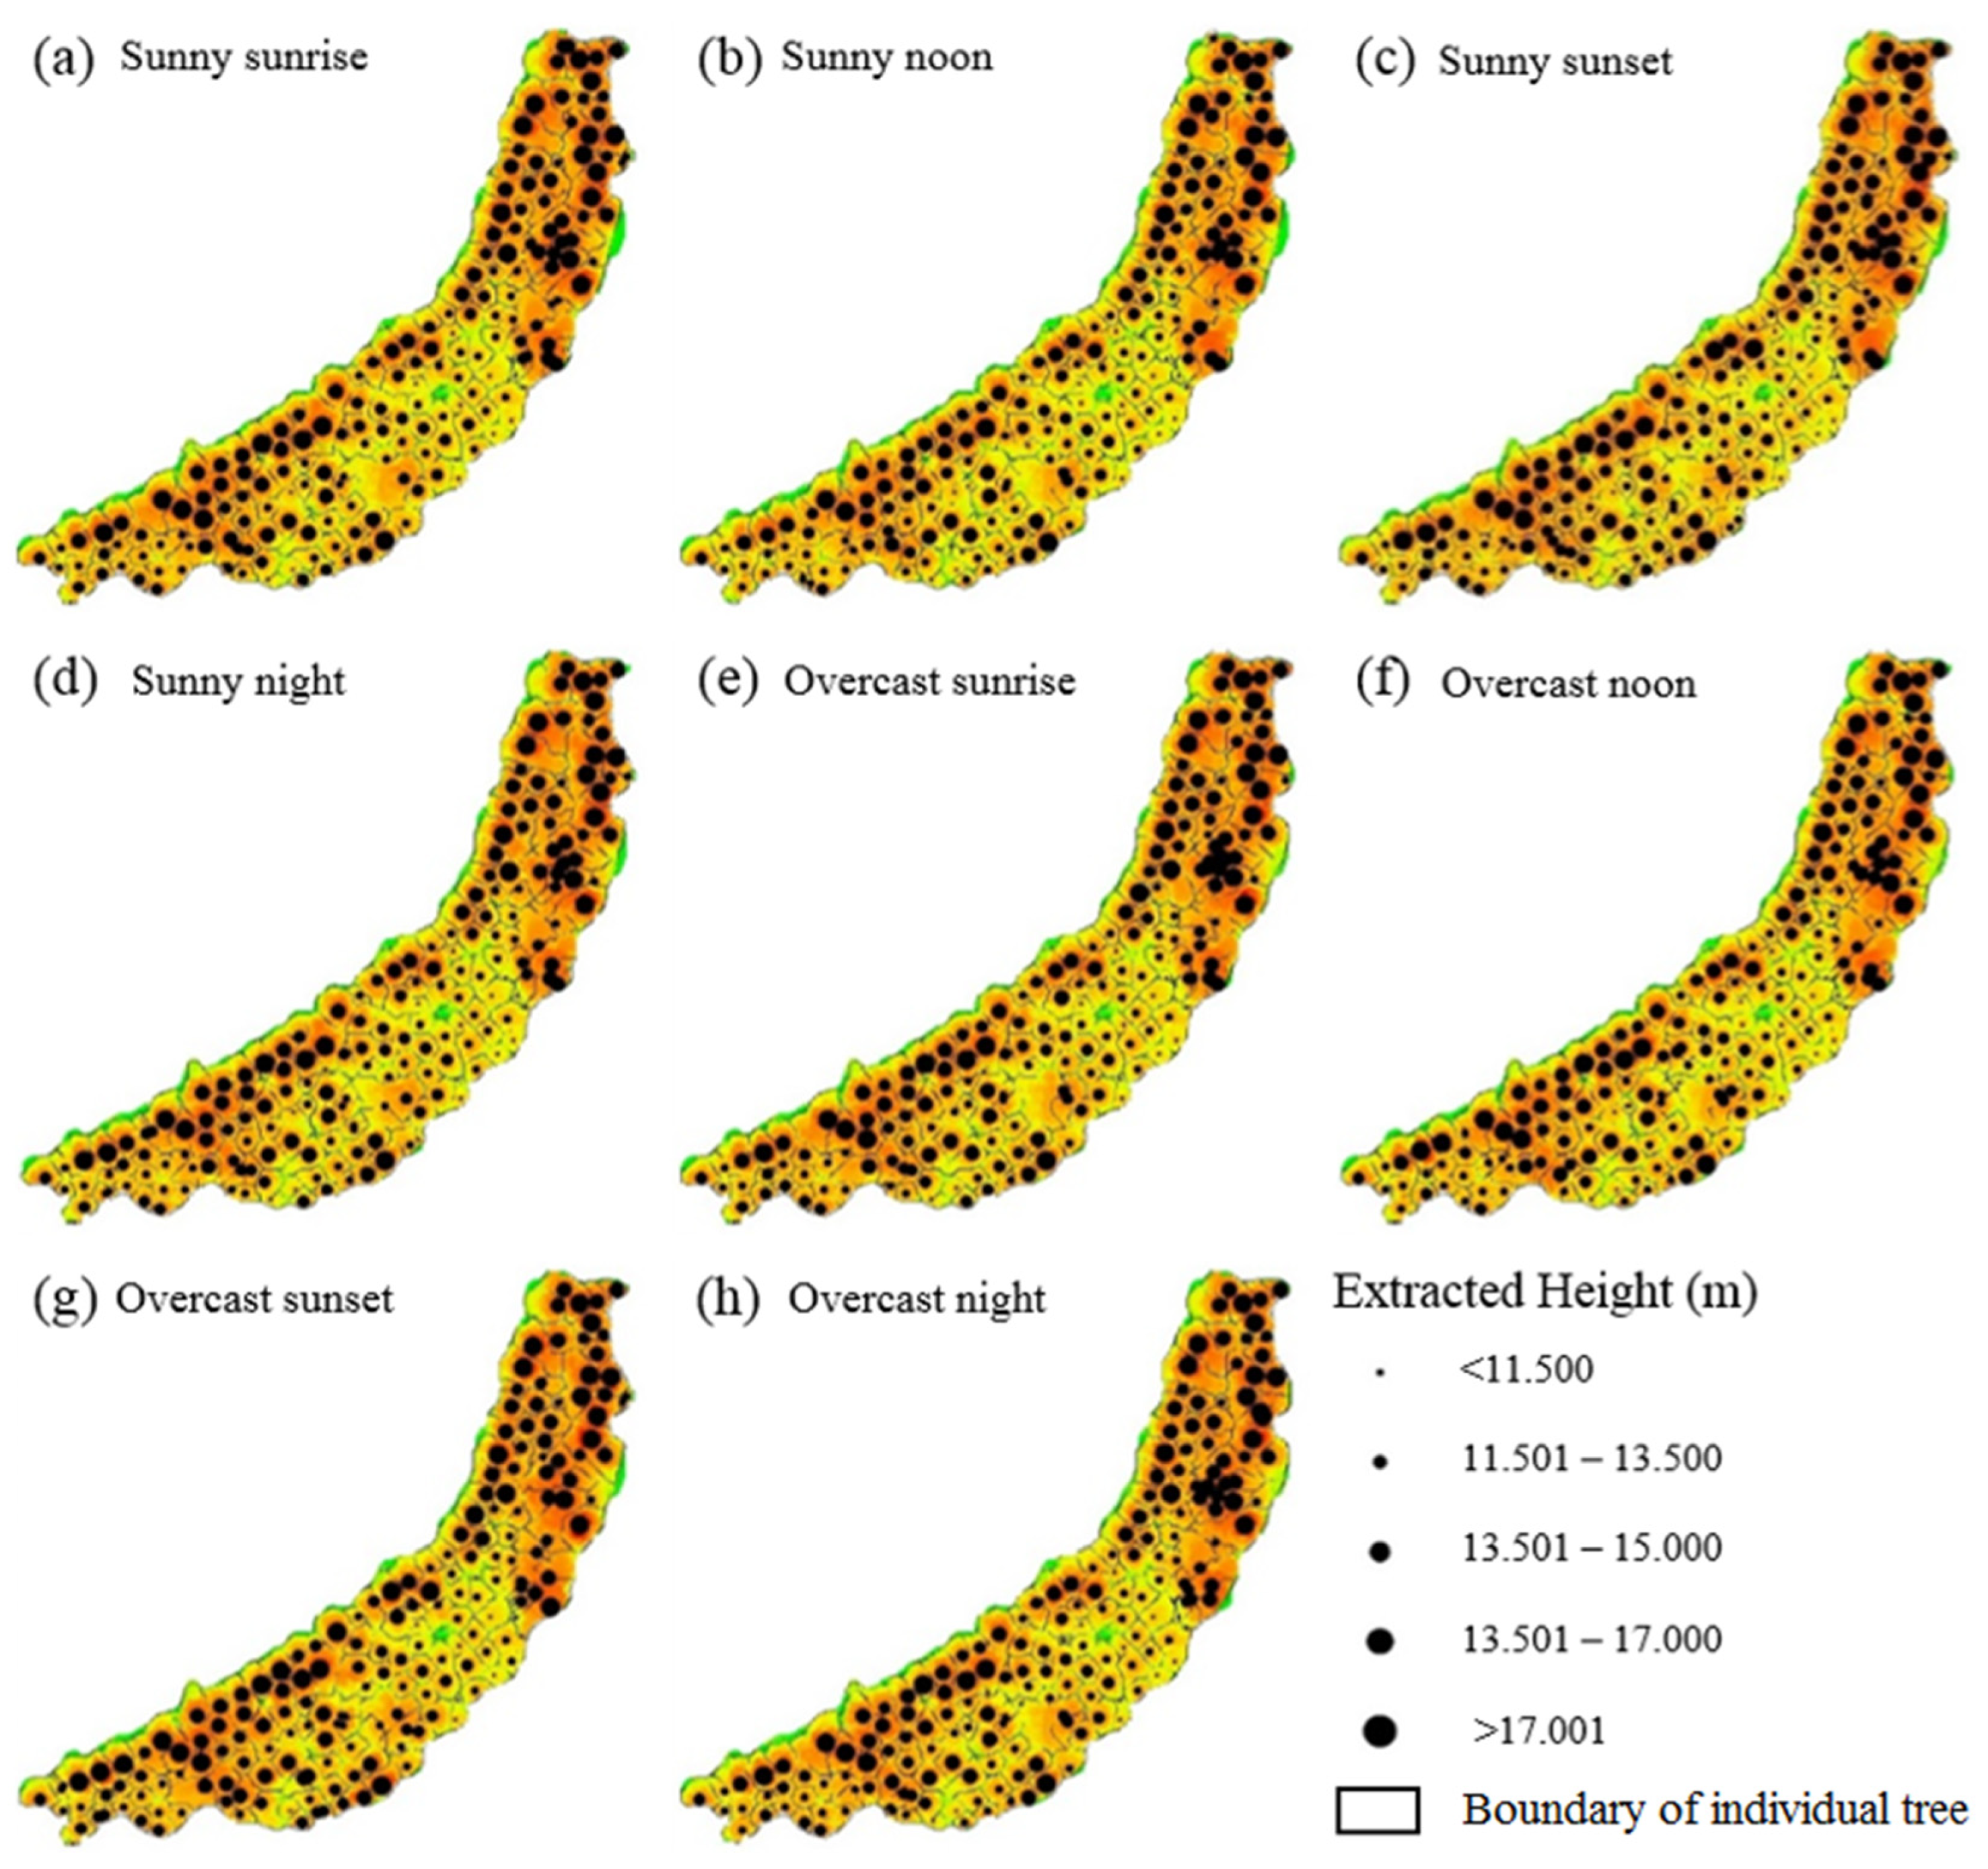
4.3. Extracted Individual Trees and Heights

Through empiric experiments, the optimal parameters of Gaussian filtering to those CHMs were determined to be a sigma value of 11 and a convolution kernel of 9. As shown in Figure 6, more than 200 seed points were initially generated from the CHM acquired during the sunny night. Subsequently, through on-site verification and manual editing, the number of retained seed points in the CHM was reduced to 195. This process was crucial for eliminating seed points incorrectly extracted due to factors such as shading or fluctuating terrain. Thus, each retained seed point corresponded to the top of an individual tree that truly existed.
Based on the retained seed points, the individual trees in the sunny night were segmented. As observed in Figure 7a, the points belonging to the individual trees were rendered in various colors for the purpose of easy distinguishment. Then, as indicated in Figure 7b, the corresponding crown boundaries of individual trees were obtained.
The crown boundaries were subsequently superimposed on the CHM to extract individual tree heights. In the same way, the heights of 195 trees under different illumination conditions were extracted and are shown in Figure 8, exhibiting similar height range and spatial distribution on the whole. The statistics, including average tree height and standard deviation of tree heights under different illumination conditions, are listed in Table 4. The average tree heights were all around 13 m, with internal trees typically below 13.5 m in height and edge trees above 13.5 m. Several trees as high as 17 m were also located in the edge area. The standard deviations of tree heights were all around 2.50 m.
The results of the paired-samples t-test between every two groups of field-measured and eight LiDAR-derived tree heights are shown in Figure 9. The number 1 indicates the rejection of the null hypothesis, meaning that there was a significant difference (p < 0.05) existing between the two group of tree heights, while 0 was the opposite (p > 0.05). In Figure 9, it can be seen that there were significant differences in most pairs of tree height groups excluding self-comparisons, including field measurement–sunny night, field measurement–overcast night, sunny sunrise–overcast sunrise, sunny sunset–overcast sunset, and so forth. For the sunny day condition, there were more significant differences in pair groups that included time points of noon or night than those that included sunrise or sunset. For the overcast day, more non-significant differences were achieved due to slight differences in illumination intensity at different time points except overcast night. For the comparison of the two days, more significant differences in pair groups were attained. Also, there were some pair groups that did not show significant differences, such as field measurement–sunny sunset, field measurement–sunny sunset, sunny sunrise–sunny sunset, sunny noon–overcast noon, and sunny night–overcast night. The reason was possibly that the illumination intensities at the two time points were very close. For instance, due to the lack of solar illumination on both sunny and overcast nights, the impacts of illuminations on tree height extraction were minimized, and the accuracies were very close.

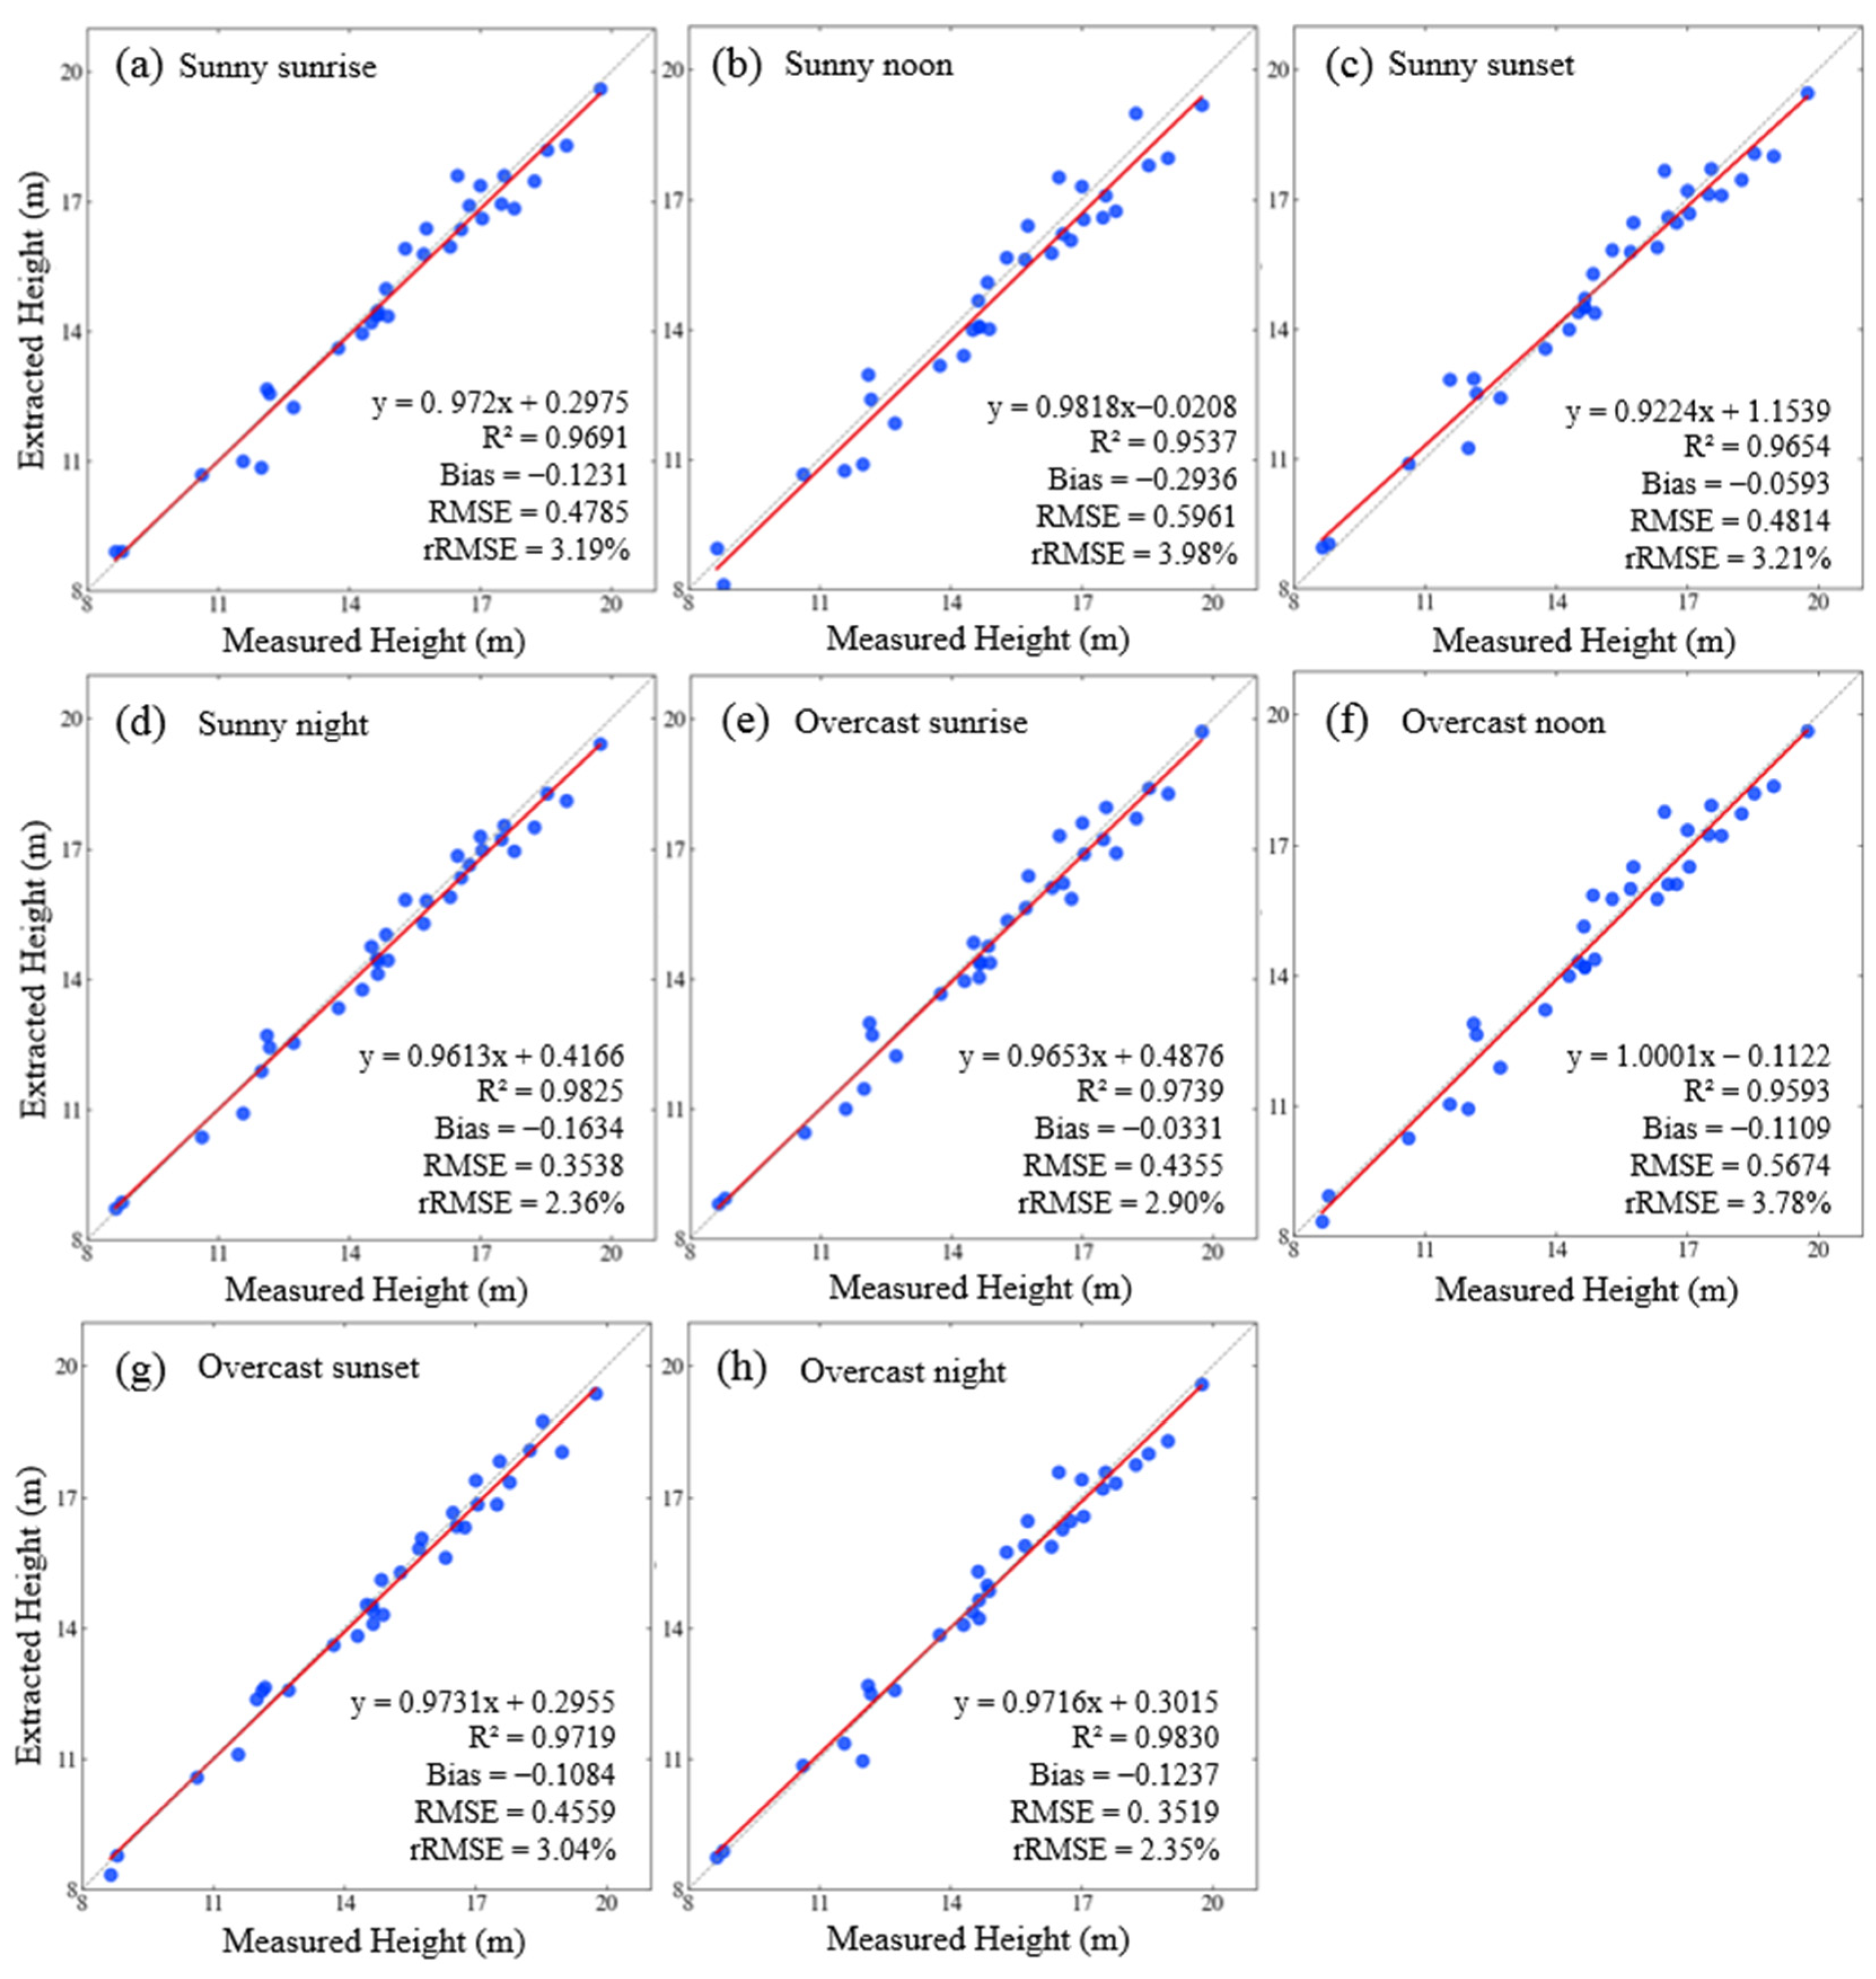
4.4. Accuracy Assessment

By matching the tree positions in Figure 2e and Figure 7b, it was confirmed that all 32 sample trees were correctly segmented from the point cloud acquired during the sunny night. Similarly, in the point clouds obtained at the other seven time points, all sample trees were properly segmented as well. Thus, the accuracies of the extracted tree heights of those sample trees (Figure 8) under varying illumination conditions were separately assessed against the corresponding in situ measured values listed in Table 3. As shown in Figure 10, the R2s of the extracted tree heights at eight time points ranged from 0.9537 to 0.9830, which were a good fit with the measured tree height; the Biases had absolute values ranging from 0.05 to 0.3 m; the RMSEs were all less than 0.6 m; and the rRMSEs were all below 4%. These indicated that individual tree heights extracted from point cloud data were all of high accuracy.
The slight differences in these accuracy metrics under different illumination conditions can be more clearly observed in Figure 11. As shown in Figure 11a, the R2 values of noon and night had the minimum and maximum values among the four time points in both sunny and overcast days, respectively. Moreover, the R2 values of sunrise, noon, and sunset in the overcast day were commonly larger than those in the sunny day, while the R2 of night in the two days were very close. As for the curves of RMSE and rRMSE in Figure 11c,d, they shared a similar pattern with the minimum and maximum values at night and noon, respectively. Except for the RMSE and rRMSE of night in the two days having nearly the same value, their values of the other three time points in the overcast day were generally smaller than those in the sunny day. These indicated that the accuracy of individual tree height extraction had an inverse correlation with the intensity of illumination. As for Bias, although there was a slight abnormality at sunset, it did not affect this conclusion. This abnormality might be caused by human factors during the in situ tree height measurement or equipment error while scanning point clouds.
Although individual tree heights extracted from point cloud data were of high accuracy, they were still affected by illumination conditions. To obtain more accurate tree heights for forestry applications, it is best to acquire point clouds using UAV-borne LiDAR at night. If such a task has to be carried out during the day, it is better not to do so at noon when the illumination is generally strongest.

5. Discussion

5.1. How Does Solar Radiation Impact on the Ranging Accuracy of UAV LiDAR?

Solar radiation has negative impacts on the accuracies of individual tree height extraction by forming solar background noise (SBN) which restricts the signal-to-noise ratio (SNR) of the detector of LiDAR. Commonly, the manufacturers of LiDARs install a narrow band-pass filter [34] to isolate SBN at wavelengths close to that of the LiDAR receiving channel. This filter significantly reduces the impacts of the total SBN on LiDAR. However, the SBN with the same wavelength as that of the LiDAR still exists. Generally, the remaining SBN is much weaker than the returns of a laser pulse, so the LiDAR can still achieve high-precision measurement of tree heights. This part of SBN has a positive correlation with the intensity of solar radiation. As the interference caused by SBN intensifies, the accuracy of tree height measurement will accordingly decrease to a slight degree.
Although the laser pulse/returns and the sunlight are two independent light sources, direct interference between them does exist during propagation [35], especially the spectrum range of solar radiation covers the wavelength of the laser pulse/returns. However, the sunlight coherence is very low. Its coherence length is up to 2 μm (micrometers) and the coherence time is on the order of a few fs (femtoseconds) only. Therefore, the impact of sunlight on the propagation of the laser pulse/returns is relatively trivial.
In addition, solar radiation might indirectly affect the intensity of laser pulse/returns by influencing environmental factors such as air humidity. Generally, the moisture in the air has a certain absorption effect on laser pulses in the near-infrared band [36]. The absorption effect increases with the increment of air humidity. This is the reason why laser scanning is not suitable to carry out on days with rain or thick fog (there is also strong scattering). Typically, there exists a slight negative correlation between air humidity and solar radiation. During the two consecutive days of point cloud collection, the air humidity during the cloudy day was relatively higher than that during the sunny day; the diurnal air humidity was relatively highest at sunrise, and lowest at noon [37]. Nevertheless, the air humidity did not fluctuate much over the two days, and the intensity variations of laser pulse/returns caused by it were relatively small.
In a word, the SBN caused by solar radiation was the dominant factor affecting the height measurement of individual trees using UAV LiDAR in our experiments. The direct interference with laser pulse/returns made by sunlight during transmission was negligible. The impact of air humidity depends on the base value and the magnitude of the variation induced by solar radiation. In our experiments, the air humidity was relatively low and consistent and not the major factor causing the differences in tree height measurement.

5.2. Other Factors Affecting the Ranging Accuracy of UAV LiDAR

Besides illumination conditions, there are still other factors affecting the ranging accuracy of a LiDAR mounted on the UAV, including the technical parameters of the sensor, settings in flight operation, characteristics of forest stand, and so forth.
As one of the most important technical parameters of a LiDAR, the laser return number determines how many returns a laser scanner can detect from a single laser pulse. Each laser return is reflected by different object surfaces in a stand, including the top of the tree crown, branches in the middle layer, understory vegetation, and the ground. Therefore, the number of laser returns is theoretically proportional to the complexity of detectable forest structures [18]. Also, the multiple returns greatly improve the chances of obtaining ground returns, and will increase the effective point density over vegetated areas [38]. More effective ground points will improve the accuracy of the resulting DEM [39], which will in turn improve the accuracy of tree height extraction according to Equation (1). Nevertheless, with the increment of laser return number, the structural complexity, weight, and cost of a LiDAR also sharply increase. For multi-rotor UAV/drone with limited payload, it has to balance the laser return number and aforementioned costs. At present, using three laser returns is the most cost-effective configuration for UAV LiDAR, including Feima D-LiDAR2000 used in this study and DJI Zenmuse L1 (DJ-Innovations, Shenzhen, China) (https://www.dji.com/, accessed on 2 January 2024). The impacts of different illumination conditions on the accuracy of individual tree height extraction using UAV-borne LiDARs with various laser return numbers (5, 7, or more) require further research.
Flight altitude is one of the most important settings for UAV flight operation. With the increment of flight altitude, the lengths of propagation paths of a laser pulse and their returns accordingly increase, implying an aggravated attenuation by the atmosphere. At the same time, it also adds the negative impact of solar radiation on laser pulses and their returns, ultimately affecting the ranging accuracy. As listed in Table 1, the ranging accuracy of ±2 cm is only ensured at the flight altitude of 50 m. In our study, to avoid colliding with a nearby building that was 80 m high, the flight altitude of the UAV was set to 90 m. This also reduced the ranging accuracy to a certain extent. For a large forest distributed in a mountainous area, it is beneficial to maintain relative flight altitude via adopting a terrain-following mode, thereby ensuring consistency in ranging accuracy [40]. In addition, the density of the resulting point cloud will be enhanced by adding the overlap of flight routes, which is also beneficial to improve the accuracy of individual tree height extraction.
The characteristics of the target forest stand also have a significant impact on the accuracy of individual tree height extraction [41]. In terms of tree species, evergreen and deciduous trees exhibit different accuracy in tree height extraction during leaf-off and leaf-on seasons; accuracy differences in extracting individual heights are also observed for coniferous and broad-leaved trees; and adult trees with higher heights are superior to those with shorter heights in tree height extraction. In terms of stand structure, a stand with a single tree species, similar tree ages, and relatively uniform tree spacing is conducive to accurate extraction of individual tree heights [42]. As stated in Section 2.1, the study object of our research was a planted stand with the dominant species of M. glyptostroboides, relatively uniform age and spacing. With a single, tall, and straight trunk, M. glyptostroboides is very beneficial for precisely extracting individual tree heights. In contrast, natural forests, especially those in tropical and subtropical regions, are often composed of multiple tree species with varying ages, high tree density, and complex vertical spatial structures, which pose great challenges to extracting the heights of individual trees [43].
In fact, the factors affecting the range accuracy of UAV LiDAR are more than those studied and discussed in this paper. In a natural environment, it is exceedingly challenging to achieve complete consistency in experimental conditions. While the effects of a certain factor on individual tree height extraction are studied, the relative consistency of other factors should be maintained.

5.3. Limitations and Potential Improvements

Although we preliminarily evaluated the effects of various illumination conditions (solar altitude angle and cloud cover) on tree height extraction using UAV LiDAR, there were still some limitations in our study. For instance, without measuring illumination intensities at those time points, only the qualitative relationship between light intensity and accuracy of tree height extraction was obtained. For the sake of safety, the flight altitude of the UAV exceeded the optimal ranging accuracy scope of the LiDAR. The insufficient number and distribution of field-measured sample trees might result in a lack of statistical independence. The magnitudes of the negative effects of the SBN on ranging accuracy were not determined.
Nevertheless, some measures could be taken to further improve the reliability of the studies on this topic in the future, such as choosing a larger area of planted forest as the study object, and ensuring no high mountains or buildings are present in the surrounding area. In this way, enough sample trees can be selected to measure heights in situ for verification and statistical analysis, and the UAV can conduct point scanning at the altitude within the optimal ranging scope of the LiDAR. The photometer is used to measure the illumination intensity while LiDAR scanning so that the quantitative relationship between illumination intensity and the accuracy of extracted tree heights can be established.

6. Conclusions

Although tree heights extracted from point cloud data are of high accuracy, they are still affected by weather and environmental factors. In this study, taking a planted coniferous stand of M. glyptostroboides as an example, we preliminarily assessed the effects of various illumination conditions (solar altitude angle and cloud cover) on individual tree height extraction using UAV-borne LiDAR. The major conclusions we drew were as follows:
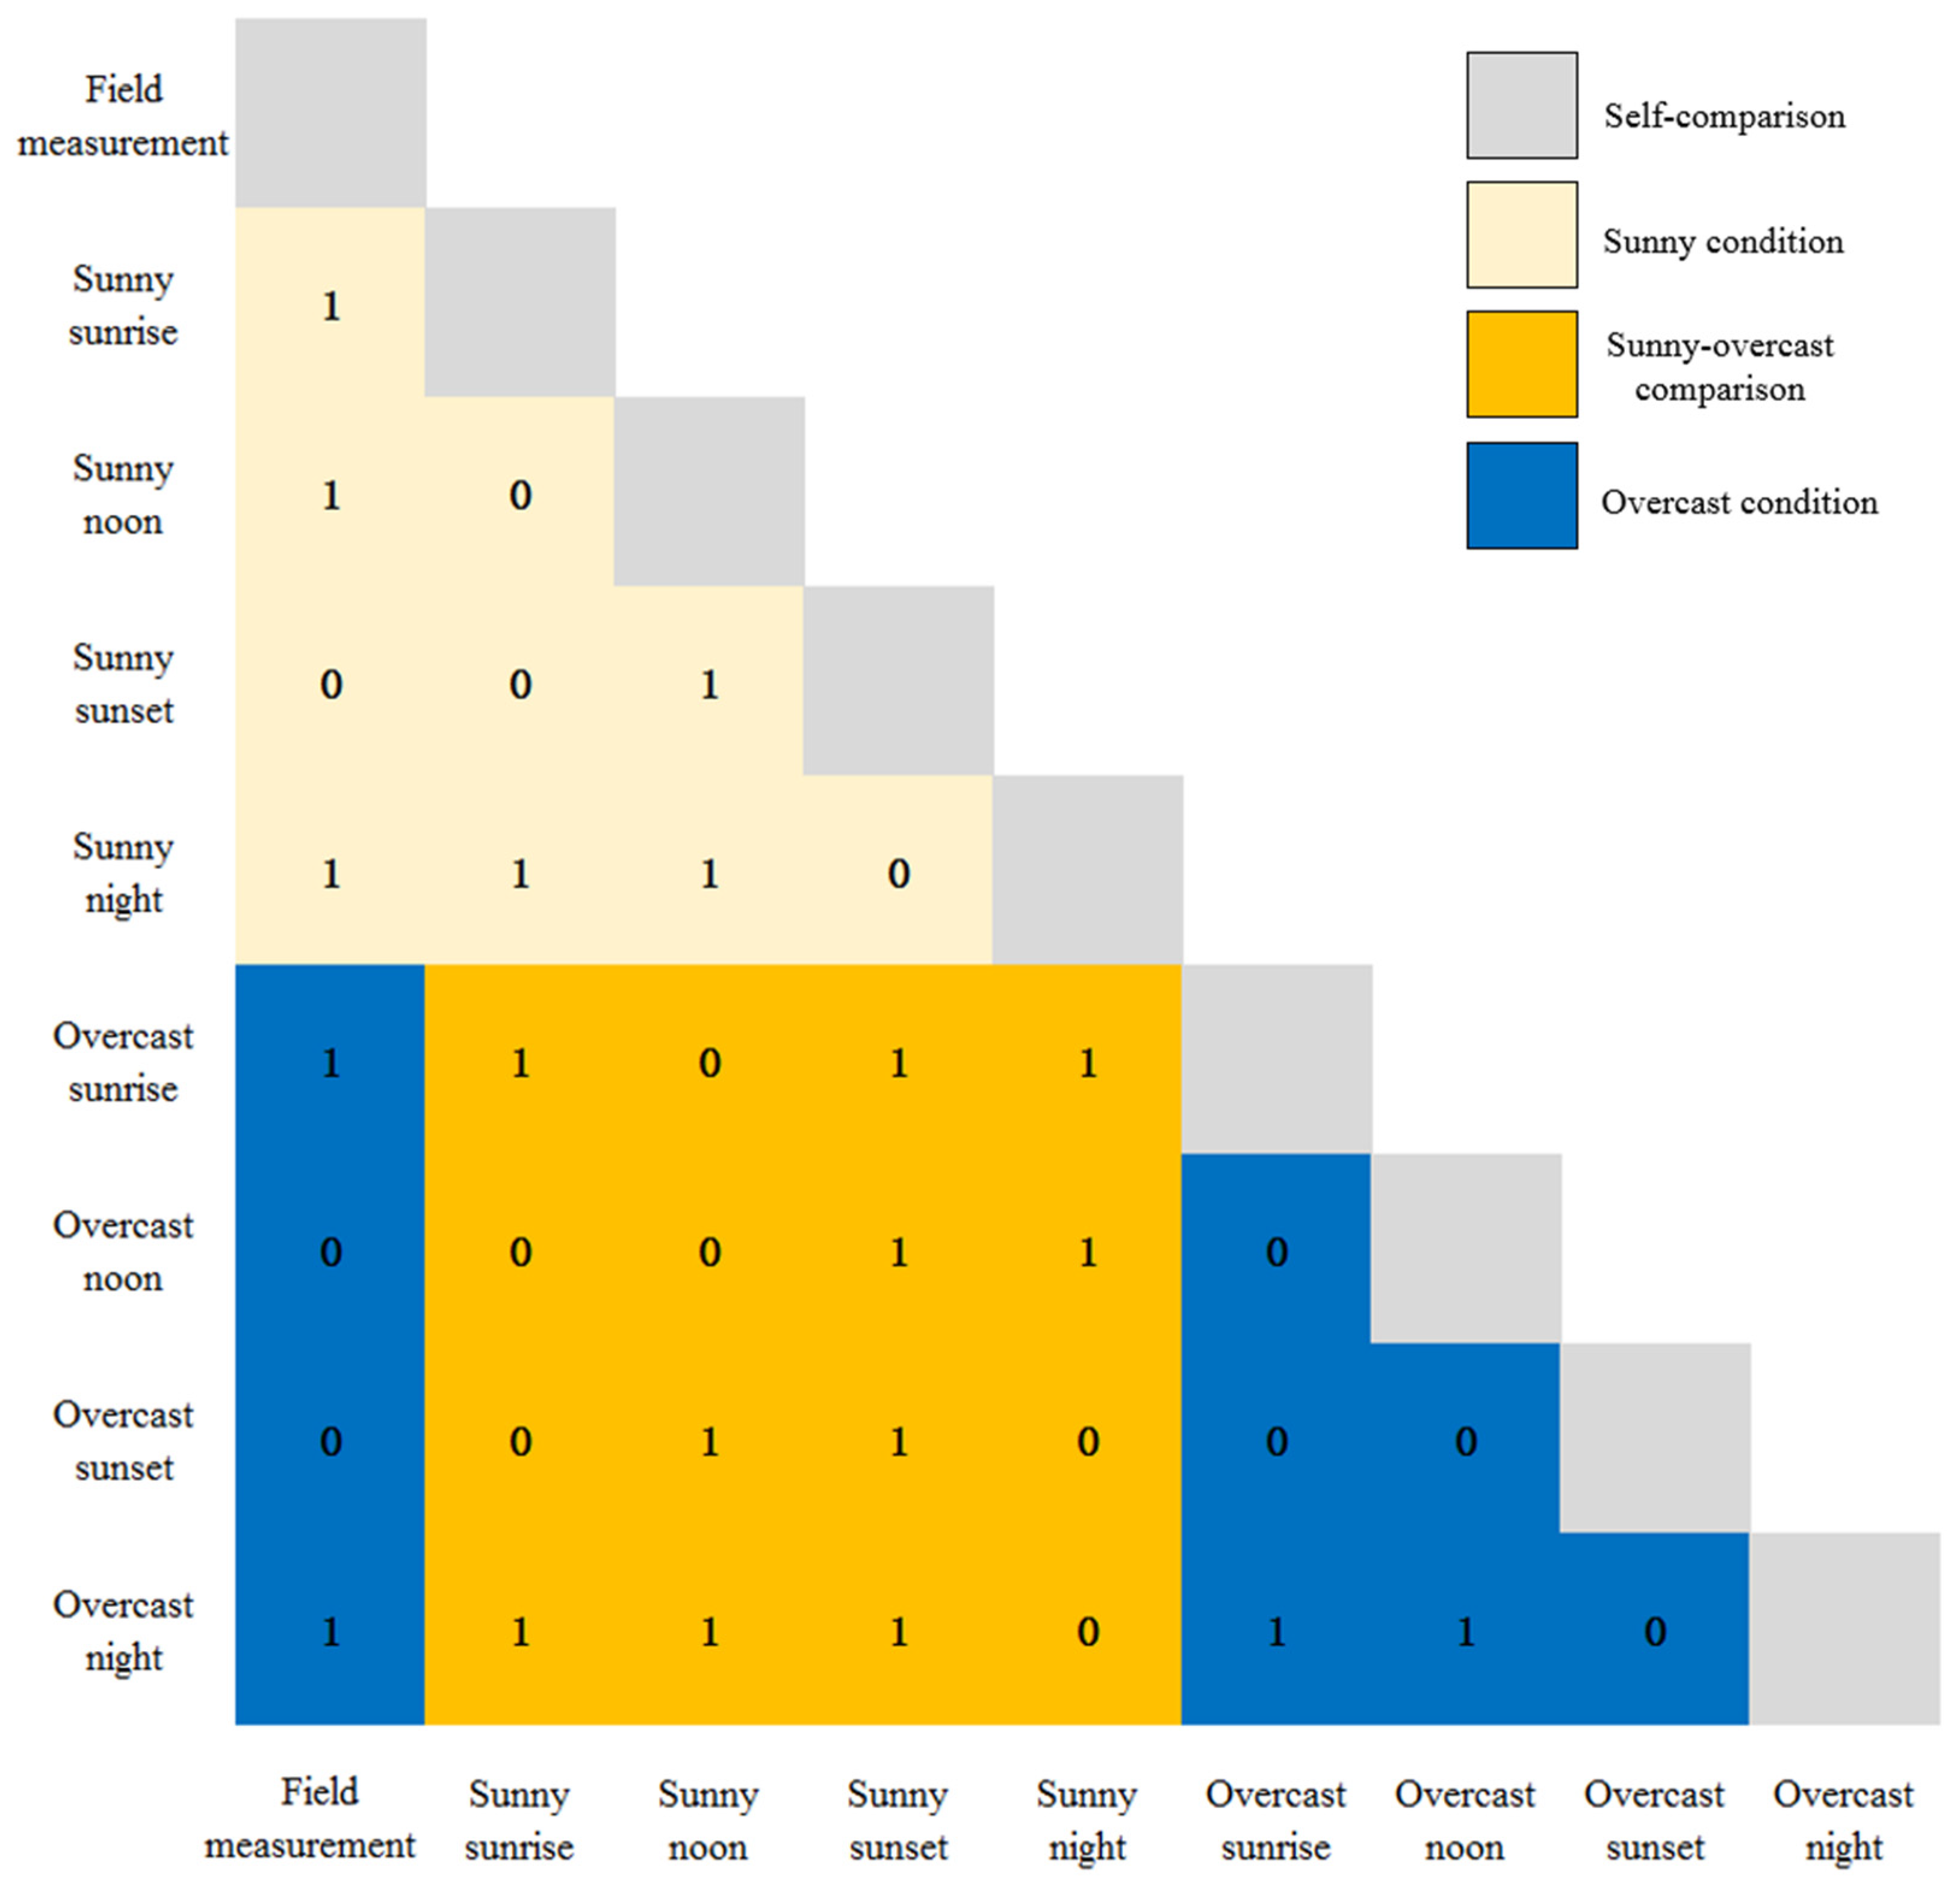
  • Individual tree heights extracted from the eight point clouds scanned by UAV LiDAR under various illumination conditions were of high accuracy. There were statistically significant differences in most pairs of tree height groups. The R2s were all above 0.95; the Biases had absolute values ranging from 0.05 to 0.3 m; the RMSEs were all less than 0.6 m; and the rRMSEs were all below 4%.
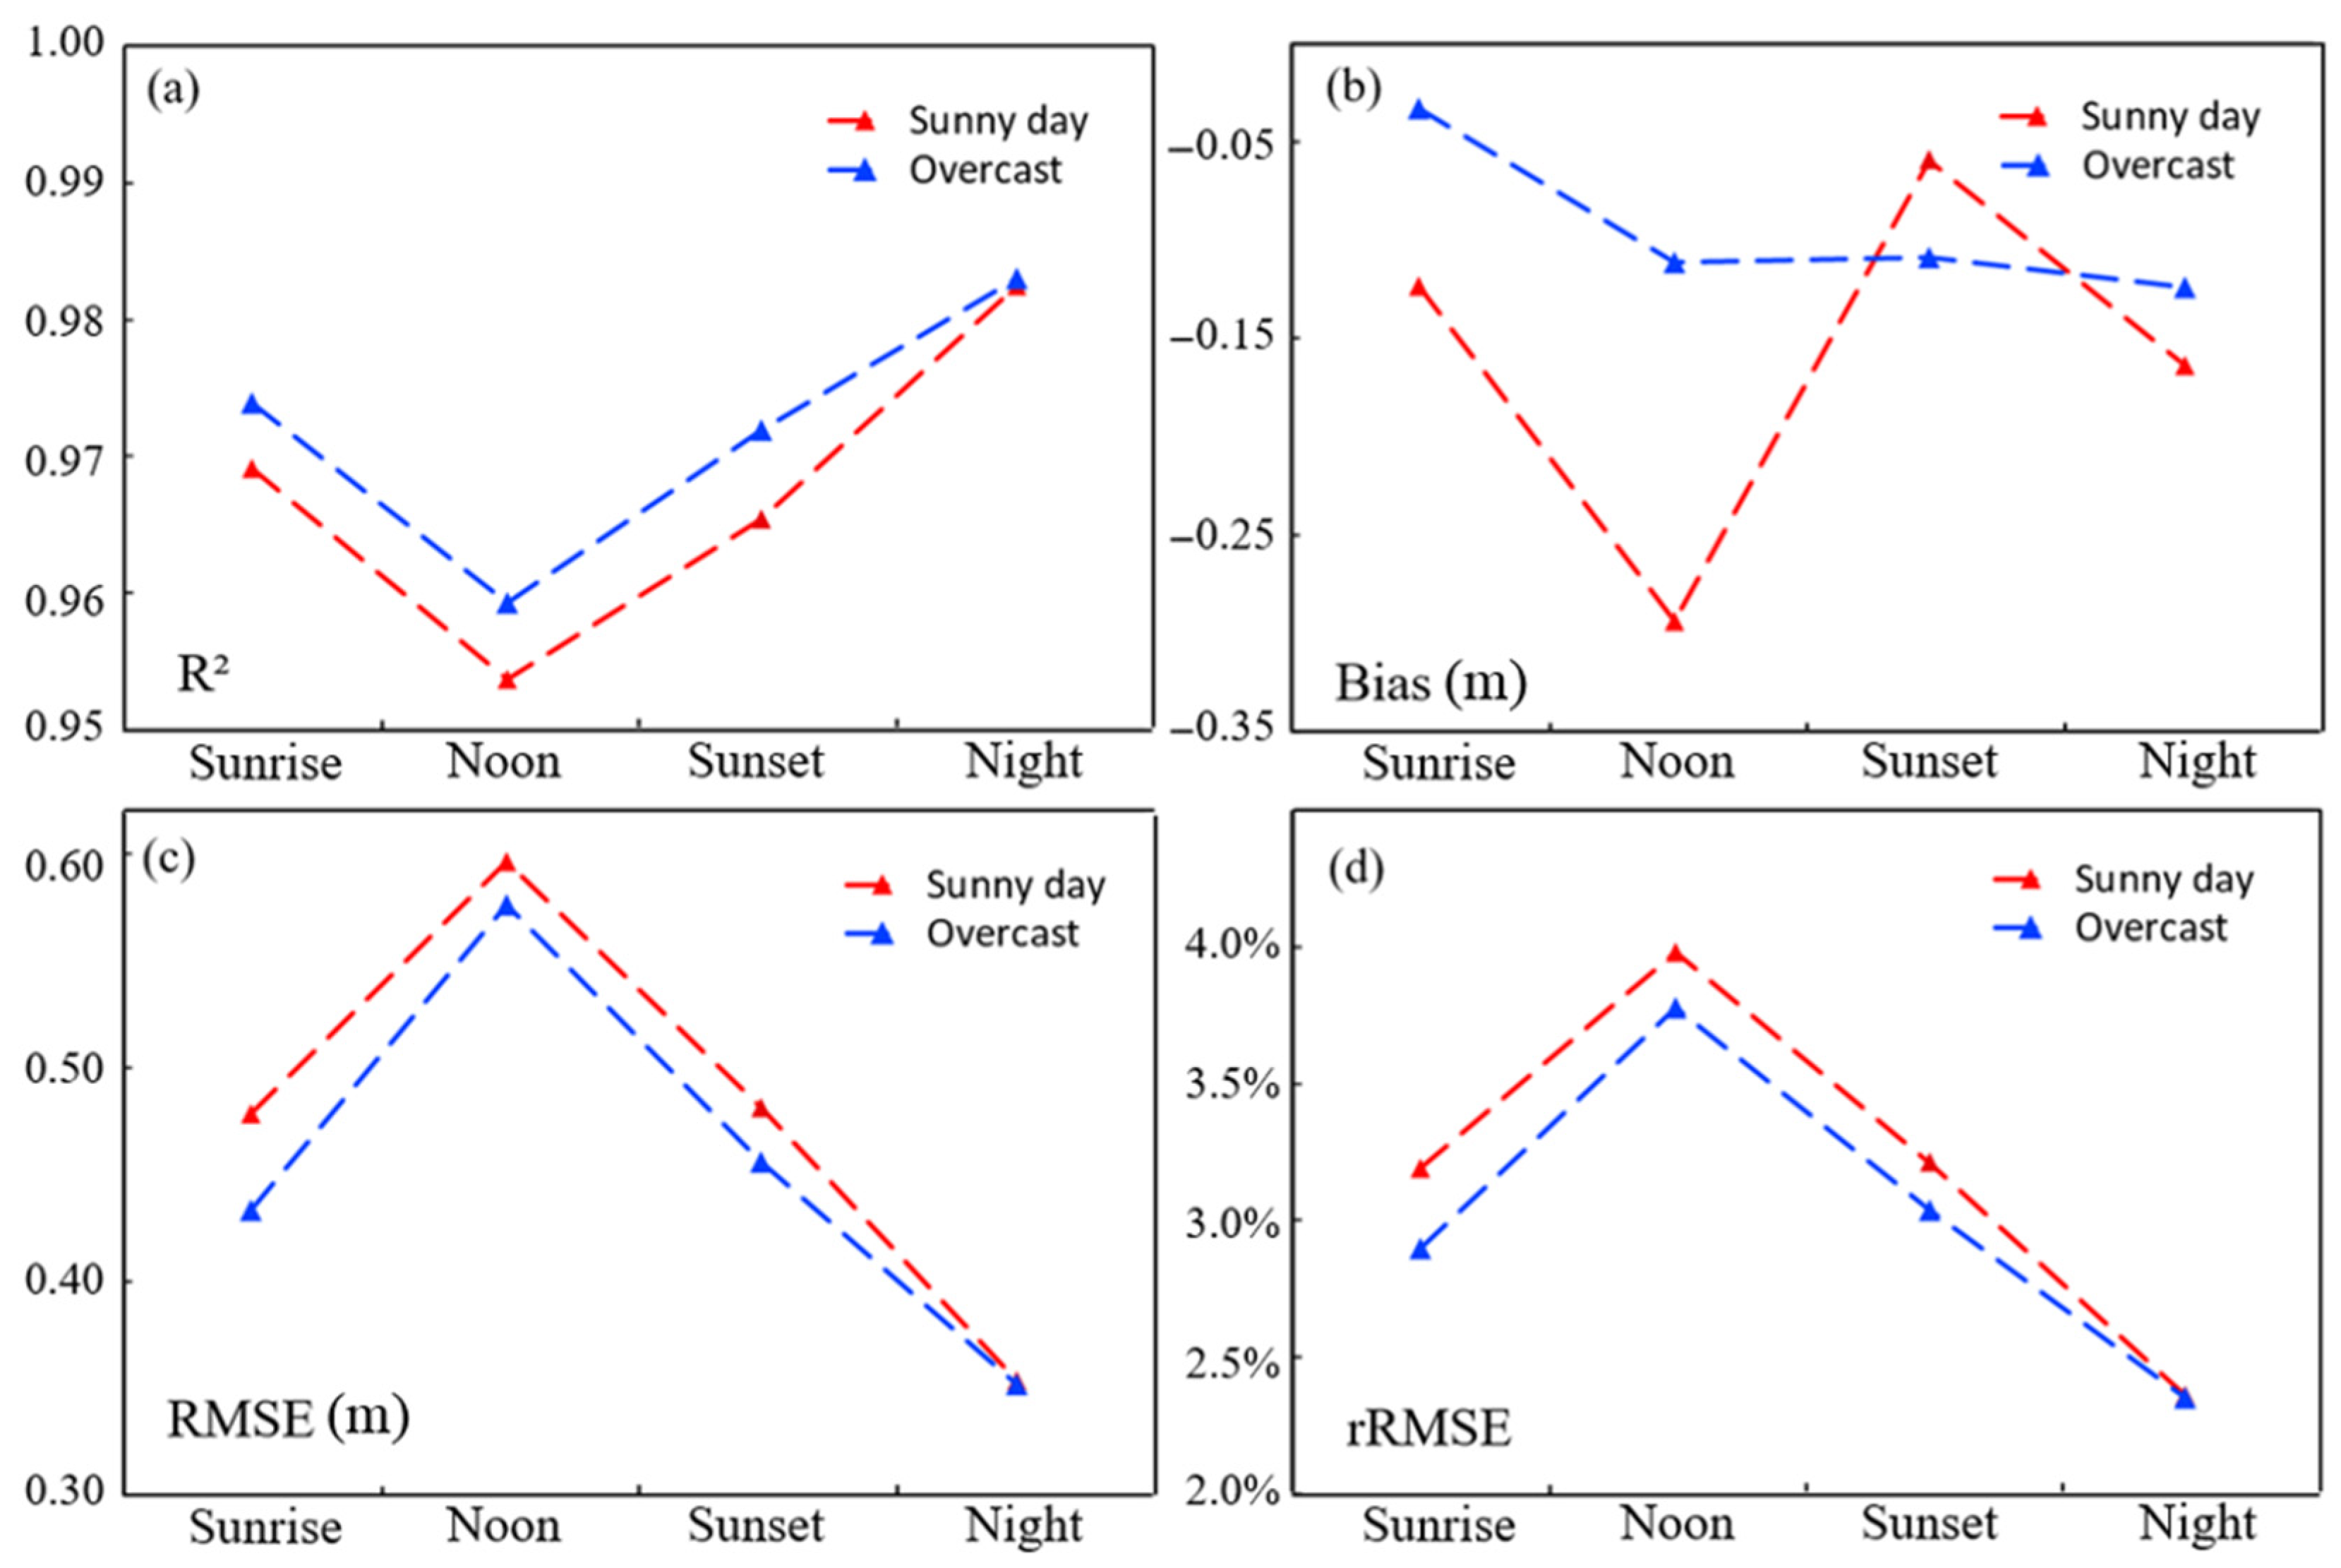
  • The accuracy of individual tree height extraction had an inverse correlation with the intensity of illumination. The R2 and RMSEs of tree heights obtained in the overcast day were commonly better than those in the sunny day; the R2 and RMSEs at night were superior among all time points, while those at noon were poorest.
  • To obtain more accurate tree heights for forestry applications, it is best to acquire point cloud using UAV LiDAR at night. If such a task has to be carried out during the day, it is better not to do so at noon.
Nevertheless, our study was just a first attempt in this topic, and the above conclusions were achieved under the conditions of our simple experiments, including tree species, site conditions, LiDAR sensor, point processing procedure, and so forth. There are still other factors affecting the accuracy of individual tree height extraction, such as the interferences of understory vegetation, the different growth patterns of various tree species, and the differences in the anti-interfering functionality in various laser devices. Moreover, only qualitative divisions were made for lighting conditions in terms of solar altitude angles and cloud cover in this study, and the quantitative relationship between lighting intensity and the accuracy of tree height extraction is required for further study. In practical applications, one could choose the appropriate illumination conditions for LiDAR data collection depending on the purpose and accuracy requirements. In future studies, more rigorous and diverse experiments for tree height extraction using UAV-borne LiDAR need to be carried out. The further reduction in the potential errors of field-measured tree heights will be beneficial for the statistical significance tests. The effects of other factors such as different laser return numbers, various flight altitudes, and different tree species and stand structures on the accuracy of individual tree height extraction should be further evaluated.

Author Contributions

Conceptualization, J.L.; methodology, T.L. and J.L.; validation, T.L. and W.W.; formal analysis, J.L. and T.L.; investigation, T.L., W.W. and R.J.; data curation, R.J. and W.W.; writing—original draft preparation, T.L.; writing—review and editing, J.L.; visualization, T.L.; supervision, J.L.; project administration, J.L.; funding acquisition, J.L. and R.J. All authors have read and agreed to the published version of the manuscript.

Funding

This research was funded by the National Natural Science Foundation of China, grant number 32071678; the Key Research and Development Program of the Sichuan Province, grant number 2022YFQ0035; and the Postgraduate Innovative Research Project of Chongqing, grant number CYS22204.

Data Availability Statement

The data presented in this study are available on request from the corresponding author.

Conflicts of Interest

The authors declare no conflicts of interest.

References

  1. Douss, R.; Farah, I.R. Extraction of Individual Trees Based on Canopy Height Model to Monitor the State of the Forest. Trees For. People 2022, 8, 100257. [Google Scholar] [CrossRef]
  2. Jurjević, L.; Liang, X.; Gašparović, M.; Balenović, I. Is field-measured tree height as reliable as believed—Part II, A comparison study of tree height estimates from conventional field measurement and low-cost close-range remote sensing in a deciduous forest. ISPRS J. Photogramm. Remote Sens. 2020, 169, 227–241. [Google Scholar] [CrossRef]
  3. Mulatu, K.A.; Decuyper, M.; Brede, B.; Kooistra, L.; Reiche, J.; Mora, B.; Herold, M. Linking Terrestrial LiDAR Scanner and Conventional Forest Structure Measurements with Multi-Modal Satellite Data. Forests 2019, 10, 291. [Google Scholar] [CrossRef]
  4. Dempewolf, J.; Nagol, J.; Hein, S.; Thiel, C.; Zimmermann, R. Measurement of Within-Season Tree Height Growth in a Mixed Forest Stand Using UAV Imagery. Forests 2017, 8, 231. [Google Scholar] [CrossRef]
  5. Tian, J.; Dai, T.; Li, H.; Liao, C.; Teng, W.; Hu, Q.; Ma, W.; Xu, Y. A Novel Tree Height Extraction Approach for Individual Trees by Combining TLS and UAV Image-Based Point Cloud Integration. Forests 2019, 10, 537. [Google Scholar] [CrossRef]
  6. Xu, D.; Wang, H.; Xu, W.; Luan, Z.; Xu, X. LiDAR Applications to Estimate Forest Biomass at Individual Tree Scale: Opportunities, Challenges and Future Perspectives. Forests 2021, 12, 550. [Google Scholar] [CrossRef]
  7. Kwak, D.A.; Lee, W.K.; Lee, J.H.; Biging, G.S.; Gong, P. Detection of Individual Trees and Estimation of Tree Height Using LiDAR Data. J. For. Res. 2007, 12, 425–434. [Google Scholar] [CrossRef]
  8. Akay, A.E.; Oǧuz, H.; Karas, I.R.; Aruga, K. Using LiDAR Technology in Forestry Activities. Environ. Monit. Assess. 2009, 151, 117–125. [Google Scholar] [CrossRef] [PubMed]
  9. Yang, H.; Zhao, C.; Zhang, H.; Zhang, Z.; Gui, K. A novel hybrid TOF/phase-shift method for absolute distance measurement using a falling-edge RF-modulated pulsed laser. Opt. Laser Technol. 2019, 114, 60–65. [Google Scholar] [CrossRef]
  10. Jiang, R.; Lin, J.; Li, T. Refined Aboveground Biomass Estimation of Moso Bamboo Forest Using Culm Lengths Extracted from TLS Point Cloud. Remote Sens. 2022, 14, 5537. [Google Scholar] [CrossRef]
  11. Zimble, D.A.; Evans, D.L.; Carlson, G.C.; Parker, R.C.; Grado, S.C.; Gerard, P.D. Characterizing vertical forest structure using small-footprint airborne LiDAR. Remote Sens. Environ. 2003, 87, 171–182. [Google Scholar] [CrossRef]
  12. Lafsky, M.A.; Harding, D.; Keller, M.; Cohen, W.B. Estimates of forest canopy height and aboveground biomass using ICESat. Geophys. Res. Lett. 2005, 32, L22S02. [Google Scholar] [CrossRef]
  13. Hamraz, H.; Contreras, M.A.; Zhang, J. Vertical stratification of forest canopy for segmentation of understory trees within small-footprint airborne LiDAR point clouds. ISPRS J. Photogramm. Remote Sens. 2017, 130, 385–392. [Google Scholar] [CrossRef]
  14. Côté, J.F.; Fournier, R.A.; Frazer, G.W.; Niemann, K.O. A fine-scale architectural model of trees to enhance LiDAR-derived measurements of forest canopy structure. Agric. For. Meteorol. 2012, 166–167, 72–85. [Google Scholar] [CrossRef]
  15. Stovall, A.E.L.; Vorster, A.G.; Anderson, R.S.; Evangelista, P.H.; Shugart, H.H. Non-destructive aboveground biomass estimation of coniferous trees using terrestrial LiDAR. Remote Sens. Environ. 2017, 200, 31–42. [Google Scholar] [CrossRef]
  16. Lin, J.; Chen, Y.; Jiang, R.; Li, T. Exploratory Quantification of 3D Spatial Competition in Ecotone of Trees and Bamboos Using Terrestrial Laser Scanner. For. Ecol. Manag. 2023, 541, 121085. [Google Scholar] [CrossRef]
  17. Wang, D.; Wan, B.; Qiu, P.; Zuo, Z.; Wang, R.; Wu, X. Mapping Height and Aboveground Biomass of Mangrove Forests on Hainan Island Using UAV-LiDAR Sampling. Remote Sens. 2019, 11, 2156. [Google Scholar] [CrossRef]
  18. Renslow, M.; Greenfield, P.; Guay, T. Evaluation of Multi-Return LIDAR for Forestry Applications. Inventory & Monitoring Project Report Liaison and Special Projects. 2000. Available online: https://www.fs.usda.gov/eng/techdev/IM/rsac_reports/lidar_report.pdf (accessed on 23 January 2024).
  19. Chen, Y.; Lin, J.; Liao, X. Early Detection of Tree Encroachment in High Voltage Powerline Corridor Using Growth Model and UAV-Borne LiDAR. Int. J. Appl. Earth Obs. 2022, 108, 102740. [Google Scholar] [CrossRef]
  20. Almeida, D.R.A.D.; Broadbent, E.N.; Ferreira, M.P.; Meli, P.; Brancalion, P.H.S. Monitoring restored tropical forest diversity and structure through UAV-borne hyperspectral and lidar fusion. Remote Sens. Environ. 2021, 264, 112582. [Google Scholar] [CrossRef]
  21. Hu, T.; Sun, X.; Su, Y.; Guan, H.; Sun, Q.; Kelly, M.; Guo, Q. Development and Performance Evaluation of a Very Low-Cost UAV-Lidar System for Forestry Applications. Remote Sens. 2020, 13, 77. [Google Scholar] [CrossRef]
  22. Dalla Corte, A.P.; Rex, F.E.; Almeida, D.R.A.D.; Sanquetta, C.R.; Silva, C.A.; Moura, M.M.; Wilkinson, B.; Zambrano, A.M.A.; Cunha Neto, E.M.D.; Veras, H.F.P. Measuring Individual Tree Diameter and Height Using GatorEye High-Density UAV-Lidar in an Integrated Crop-Livestock-Forest System. Remote Sens. 2020, 12, 863. [Google Scholar] [CrossRef]
  23. Arroyo-Mora, J.P.; Kalacska, M.; Løke, T.; Schläpfer, D.; Coops, N.C.; Lucanus, O.; Leblanc, G. Assessing the Impact of Illumination on UAV Pushbroom Hyperspectral Imagery Collected under Various Cloud Cover Conditions. Remote Sens. Environ. 2021, 258, 112396. [Google Scholar] [CrossRef]
  24. Sun, W.; Hu, Y.; MacDonnell, D.G.; Weimer, C.; Baize, R.R. Technique to Separate Lidar Signal and Sunlight. Opt. Express 2016, 24, 12949. [Google Scholar] [CrossRef]
  25. Xu, L.; Yao, L.; Ai, X.; Guo, Q.; Wang, S.; Zhou, D.; Deng, C.; Ai, X. Litter Autotoxicity Limits Natural Regeneration of Metasequoia glyptostroboides. New For. 2023, 54, 897–919. [Google Scholar] [CrossRef]
  26. Andersen, H.E.; Reutebuch, S.E.; McGaughey, R.J. A rigorous assessment of tree height measurements obtained using airborne LIDAR and conventional field methods. Can. J. Remote Sens. 2006, 32, 355–366. [Google Scholar] [CrossRef]
  27. Zhao, X.; Guo, Q.; Su, Y.; Xue, B. Improved Progressive TIN Densification Filtering Algorithm for Airborne LiDAR Data in Forested Areas. ISPRS J. Photogramm. Remote Sens. 2016, 117, 79–91. [Google Scholar] [CrossRef]
  28. Wei, L.X.; Yang, B.A.; Jiang, J.P.; Cao, G.Z.; Wu, M.F. Vegetation filtering algorithm for UAV-borne lidar point clouds: A case study in the middle-lower Yangtze river riparian zone. Int. J. Remote Sens. 2017, 38, 2991–3002. [Google Scholar] [CrossRef]
  29. Lin, J.; Chen, D.; Wu, W.; Liao, X. Estimating Aboveground Biomass of Urban Forest Trees with Dual-Source UAV Acquired Point Clouds. Urban For. Urban Green. 2022, 69, 127521. [Google Scholar] [CrossRef]
  30. Morsdorf, F.; Meier, E.; Allgöwer, B.; Nüesch, D. Clustering in airborne laser scanning raw data for segmentation of single trees. Int. Arch. Photogramm. Remote Sens. Spat. Inf. Sci. 2003, 34, 27–33. [Google Scholar]
  31. Wulder, M.; Niemann, K.O.; Goodenough, D.G. Local maximum filtering for the extraction of tree locations and basal area from high spatial resolution imagery. Remote Sens. Environ. 2000, 73, 103–114. [Google Scholar] [CrossRef]
  32. Mara, C.A.; Cribbie, R.A. Paired-Samples Tests of Equivalence. Commun. Stat. Simul. Comput. 2012, 41, 1928–1943. [Google Scholar] [CrossRef]
  33. Li, W.; Guo, Q.; Jakubowski, M.K.; Kelly, M. A New Method for Segmentation Individual Trees from the LiDAR Point Cloud. Photogramm. Eng. Remote Sens. 2012, 78, 75–84. [Google Scholar] [CrossRef]
  34. Wu, S.; Song, X.; Liu, B. Fraunhofer Lidar Prototype in the Green Spectral Region for Atmospheric Boundary Layer Observations. Remote Sens. 2013, 5, 6079–6095. [Google Scholar] [CrossRef]
  35. Kawalec, T.; Sowa, P. Observation of two truly independent laser interference made easy. Eur. J. Phys. 2021, 42, 055305. [Google Scholar] [CrossRef]
  36. Lei, B.; Wang, J.; Li, J.; Tang, J.; Wang, Y.; Zhao, W.; Duan, Y. Influence of humidity on the characteristics of laser-induced air plasma. Jpn. J. Appl. Phys. 2018, 57, 106001. [Google Scholar] [CrossRef]
  37. Chung, E.S.; Sohn, B.J.; Schmetz, J.; Koenig, M. Diurnal Variation of Upper Tropospheric Humidity and Its Relations to Convective Activities over Tropical Africa. Atmos. Chem. Phys. 2007, 7, 2489–2502. [Google Scholar] [CrossRef]
  38. Adams, T.; Brack, C.; Farrier, T.; Pontl, D.; Brownlie, R. So you want to use LiDAR? A guide on how to use LiDAR in forestry. N. Z. J. For. 2011, 55, 19–23. [Google Scholar]
  39. Calders, K.; Armston, J.; Newnham, G.; Herold, M.; Goodwin, N. Implications of Sensor Configuration and Topography on Vertical Plant Profiles Derived from Terrestrial LiDAR. Agric. For. Meteorol. 2014, 194, 104–117. [Google Scholar] [CrossRef]
  40. Singh, C.H.; Jain, K.; Mishra, V. UAV-Based Terrain-Following Mapping Using LiDAR in High Undulating Catastrophic Areas. In Proceedings of the UASG 2021: Wings 4 Sustainability; Lecture Notes in Civil Engineering; Jain, K., Mishra, V., Pradhan, B., Eds.; Springer: Cham, Switzerland, 2023; Volume 304. [Google Scholar] [CrossRef]
  41. Liu, K.; Shen, X.; Cao, L.; Wang, G.; Cao, F. Estimating Forest Structural Attributes Using UAV-LiDAR Data in Ginkgo Plantations. ISPRS J. Photogramm. Remote Sens. 2018, 146, 465–482. [Google Scholar] [CrossRef]
  42. Zhang, X.; Wei, H.; Zhang, X.; Liu, J.; Zhang, Q.; Gu, W. Non-Pessimistic Predictions of the Distributions and Suitability of Metasequoia Glyptostroboides under Climate Change Using a Random Forest Model. Forests 2020, 11, 62. [Google Scholar] [CrossRef]
  43. Mielcarek, M.; Kamińska, A.; Stereńczak, K. Digital Aerial Photogrammetry (DAP) and Airborne Laser Scanning (ALS) as Sources of Information about Tree Height: Comparisons of the Accuracy of Remote Sensing Methods for Tree Height Estimation. Remote Sens. 2020, 12, 1808. [Google Scholar] [CrossRef]
Figure 1. (a) The location of the study site; (b) the cross-flight trajectory of UAV-borne LiDAR; (c) the point cloud rendered in elevation (top view).
Forests 15 00758 g001
Figure 2. (a) Feima D2000 equipped with D-LiDAR2000; (b) DJI Phantom 4 Pro with FC6310; (c) RTS-882 total station; (d) Huace RTK GNSS; (e) locations of sample trees for in situ measurement.
Forests 15 00758 g002
Figure 3. The workflow of this study.
Forests 15 00758 g003
Figure 4. Classified point cloud—sunny night data as an example. (a) Ground points (side view); (b) aboveground vegetation points (side view).
Forests 15 00758 g004
Figure 5. The CHM created from point cloud—sunny night data as an example. (a) DEM; (b) DSM; (c) CHM.
Forests 15 00758 g005
Figure 6. The resulting seed points from CHM—sunny night data as an example.
Forests 15 00758 g006
Figure 7. Segmented individual trees—sunny night data as an example. (a) Point cloud of individual trees rendered in colors; (b) crown boundaries of individual trees.
Forests 15 00758 g007
Figure 8. Extracted individual tree heights under different illumination conditions. (a) Sunny sunrise; (b) sunny noon; (c) sunny sunset; (d) sunny night; (e) overcast sunrise; (f) overcast noon; (g) overcast sunset; (h) overcast night.
Forests 15 00758 g008
Figure 9. The results of the statistical significance test between every two groups of field-measured and eight LiDAR-derived tree heights using paired samples t-test; 1 indicates that the null hypothesis is rejected, while 0 is the opposite.
Forests 15 00758 g009
Figure 10. Accuracy assessment of extracted individual tree heights against in situ measured values under different illumination conditions. (a) Sunny sunrise; (b) sunny noon; (c) sunny sunset; (d) Sunny night; (e) overcast sunrise; (f) overcast noon; (g) overcast sunset; (h) overcast night.
Forests 15 00758 g010
Figure 11. Metric curves for extracted individual tree heights at four time points in two days. (a) R2; (b) Bias; (c) RMSE; (d) rRMSE.
Forests 15 00758 g011
Table 1. Technical parameters of Feima D-LiDAR2000.
ParameterValue/Description
PlatformFeima D-2000
Laser classclass 1
Ranging modeTOF (Time of Flight)
Wavelength905 nm
Return number3 returns
Return intensity8 bit
Ranging accuracy±2 cm (50 m)
Point frequency240 kpts/s
Horizontal FOV (Field of View) 70.4°
Vertical FOV4.5°/77.2°
Table 2. Specific information of the eight UAV LiDAR scanning measurements.
Description
Date 10 September 202311 September 2023
Atmospheric conditionSunnyOvercast
Time points Sunrise (6:00); noon (12:00); sunset (18:00); night (21:00)
Table 3. The in situ measured heights of sample trees.
Tree IDHeight (m)Tree IDHeight (m)Tree IDHeight (m)
114.869 1218.240 2317.004
214.647 1317.766 2417.540
314.654 1413.750 2512.164
416.556 1516.463 2616.305
518.961 1615.753 2717.035
611.563 1714.839 2812.728
714.295 1815.701 2911.981
810.627 1916.753 3012.108
914.619 2019.739 318.652
108.793 2118.522 3214.503
1117.476 2215.267
Table 4. The statistics of extracted tree heights under various illumination conditions.
Atmospheric ConditionTime PointAverage Tree Height (m)Standard Deviation of Tree Height (m)
Sunnysunrise12.972.49
noon12.802.56
sunset12.932.44
night13.092.56
Overcastsunrise12.992.47
noon12.832.58
sunset13.042.49
night13.102.53
Disclaimer/Publisher’s Note: The statements, opinions and data contained in all publications are solely those of the individual author(s) and contributor(s) and not of MDPI and/or the editor(s). MDPI and/or the editor(s) disclaim responsibility for any injury to people or property resulting from any ideas, methods, instructions or products referred to in the content.

