Article

Woody Species Composition, Stand Structure and Regeneration Status of Londiani Forest in Kenya

by
Evalyne Kosgey Chepkoech
1,*,
Humphrey Agevi
1,2,
Henry Lung’ayia
1 and
Harrison Mugatsia Tsingalia
1
1
Department of Biological Sciences, Masinde Muliro University of Science and Technology (MMUST), Kakamega P.O. Box 190-50100, Kenya
2
Institute of Indigenous Knowledge, Cultural Studies and Climate Change, Masinde Muliro University of Science and Technology (MMUST), Kakamega P.O. Box 190-50100, Kenya
*
Author to whom correspondence should be addressed.
Forests 2024, 15(4), 653; https://doi.org/10.3390/f15040653
Submission received: 20 July 2023 / Revised: 2 September 2023 / Accepted: 8 September 2023 / Published: 3 April 2024
(This article belongs to the Special Issue Ecological Forestry and Restoration)

Abstract

:
Tropical forests provide habitats for diverse flora and fauna, in addition to playing a crucial role in climate regulation. They are being recognized for their roles as nature-based solutions to many sustainable development challenges, as shown by increased political commitment and global promises to reduce the rates of deforestation and boost the restoration of degraded forest ecosystems. Understanding tropical forest dynamics and their conservation status is therefore important. This study analysed the forest stand structure, the tree species composition and the regeneration status of Londiani Forest. In the three blocks of Londiani Forest, which are Kedowa, Chebewor and Londiani, belt transects that were 25 m wide and 1 km long were established. At every 200 m along the transects, 25 m × 25 m quadrats were set up in which an inventory of all the tree species was determined. Diameter tape was used to measure the diameter at breast height (DBH) 1.3 m above the ground. With the use of a Suunto angular clinometer, the tree height was measured. A nested 5 m × 5 m quadrat within the 25 m × 25 m quadrat was used to sample the saplings, while a 1m × 1 m quadrat was used to sample the seedlings. The quantities of seedlings and saplings were used to determine the state of regeneration. The data were entered into Microsoft Excel. The total stem density, species density, basal area, species basal area, relative density and species diversity were determined and extrapolated per hectare. A total of 1308 distinct trees from 34 different species and 24 families were counted. Kedowa recorded the highest (27) species richness, followed by Chebewor (19) and then Londiani (14). There was a statistically significant difference in the species richness among the three forest blocks (p < 0.05). Within the three forest blocks, there were no statistically significant variations in the basal area distribution (p > 0.005) or in the mean DBH (F = 0.560; p = 0.729) or height class distribution (F = 0.821; p = 0.558). There was a statistically significant difference in the stem density (F = 12.22; p = 0.005) and woody species diversity (F = 0.32; p = 0.001) within the three forests blocks. The similarity index ranged from 0.34–0.47. The presence of substantial numbers of seedlings and saplings in all forest blocks was an indication that there was regeneration.

1. Introduction

Tropical forests contain diverse ecosystems and provide a home for people, flora and faunal species [1]. These include about 75% of bird species, 68% of mammal species and 80% of amphibian species. Tropical forests harbour over 60% of the world’s vascular plants [2]. Additionally, they are essential in regulating the climate through oxygen production and carbon storage within different carbon pools, and provide livelihoods for millions of people, especially those adjacent communities that entirely depend on them [1,2,3,4]. Consequently, understanding the dynamics of tropical forests and their conservation has gained prominence [5]. Increased political commitments and the global will to reduce the rates of forest destruction and enhance the restoration of degraded forest ecosystems are great evidence that forests are increasingly becoming more widely recognized for their roles as nature-based solutions to many challenges in sustainable development [6,7].
Deforestation and forest degradation within forest ecosystems remain the biggest challenges in forest conservation globally [8,9]. These two processes contribute significantly to the current loss of biodiversity, resulting in increased rates of extinction in important species that play crucial roles in maintaining ecosystems [4]. A total of 420 million hectares of forests is thought to have been lost during the past 30 years due to conversion to other land uses [4]. The primary causes of deforestation, forest fragmentation and the resulting loss in forest biodiversity are currently agricultural expansion and urbanization [10]. Large-scale commercial agriculture and local subsistence agriculture account for most tropical deforestation. It has been demonstrated that the resilience of human food systems and their capacity to adapt to future change depends on biodiversity, which includes dry land shrubs and tree species that are essential in combating desertification in arid lands, especially forest insects; bat species and bird species that are useful for crop pollination; trees with extensive root systems that mitigate soil erosion and conserve fertility; and mangrove species that provide resilience against flooding and storms in coastal areas [11,12]. The role of forests in absorbing and storing carbon and mitigating climate change is becoming increasingly important for the agricultural sector as hazards to food systems and subsequently food security increase [13,14].
Data and information are the keys to the sustainable management of forests [15,16] since they provide the means for planning, monitoring, evaluating, research, growth, yield, biodiversity and wood sales [17,18]. Forest inventories put together to gather information on the status of forest resources in relation to forest management are the primary method of obtaining this information. A list of tree species can help to identify species of particular concern that could be adversely affected by deforestation and forest degradation by providing information on the diversity and richness of the forest [19].
Intense anthropogenic pressures, such as deforestation, habitat degradation and fragmentation, over-exploitation, invasive species, pollution and global climate change, threaten the biodiversity of tropical rainforests [20,21]. These threats may alter the stand structure and composition of forest ecosystems [22,23]. Tropical forest restoration, which models natural regeneration, has been adopted as a strategy for restoring degraded forests, and hence, restoring forest health [24]. The dynamics of the forest ecosystem and the repair of damaged forest areas heavily rely on regeneration [25]. The patterns of regeneration drive the structure and composition of forest ecosystems [26,27]. At various spatial scales, these variables affect the species composition of tropical forests [27,28]. One result of this is an improvement in the stability, resilience and variety of forest ecosystems [29]. A significant number of seedlings must survive for regeneration to be successful, which depends on the site’s predominant microclimate and the intensity of anthropogenic activities. The success of the different growth stages of the seedlings as well as the size class distribution of a tree population is important in the recovery of the forest following disturbances [30]. In the understory of a forest, seedling densities can fluctuate according to the species, types of forests and habitats with gaps and shadows [31,32,33]. Where regeneration is continuous, the size class distribution of species cohorts will tend to exhibit a reverse J-shaped curve [34]. There are a number of studies that have determined patterns of tree species composition and diversity in different forest ecosystems globally, emphasizing the determination of floristic similarity and diversity gradients [35,36]. Similar studies have been reported in the Kakamega tropical rain forest [37] and Mau Forest in Kenya [38], among others. Studies on the woody species composition, the tree diversity and the regeneration status of Londiani Forest, which is a montane forest, are lacking. Therefore, this study sought to determine: i) species composition, tree abundance, species diversity and distribution within different species associations in Londiani Forest, ii) stand structure (stem density across size classes) by important species across species associations of Londiani Forest and iii) the regeneration status of key species in Londiani Forest.

2. Materials and Methods

2.1. Study Area

The Londiani Forest, located in Kericho County, covers some 18,938 ha [39]. It lies to the West of Nakuru town, East of Bomet County and along the Kericho–Nakuru highway. Londiani town is about 260 km from the capital city of Nairobi, with a latitude of 0.17° south, a longitude of 35.6° east and an elevation of 2326 m above sea level [40] (Figure 1). The forest was gazetted via legal notice No. 44 of 1932 with the objective of conservation. Londiani Forest and its environments receive rainfall that varies between 1500 and 1700 mm per year that is bimodally distributed [39]. Long rains fall between mid-March and June, while short rains fall between mid-October and December. There is a mean difference in precipitation of 133 mm between the driest and the wettest month [39]. The mean maximum temperature is 24 °C and the lowest mean minimum temperature is 10 °C. The region is a source for several rivers that drain into Lake Victoria [41]. The main economic activity is farming, which involves crop production and livestock keeping. All these economic practices have a direct impact on Londiani Forest [42]. Native and exotic (non-native) tree species coexist throughout the woodland. About 2.0 ha of the forest is alien, primarily made up of plantations, and about 4.4 ha is made up of native trees and shrubs [43]. The indigenous forest has a wide range of vegetation cover and composition. Londiani Forest is a home for endemic tree species like Prunus africana, Podocarpus falcatus, Olea africana, Osyris lanciolata, Olea holchsteterii and Juniperus procera, which, according to the IUCN Red List, are some of the rare and threatened forest tree species that are declining in abundance [42]. The local communities, especially those that directly rely on the forest resources for their subsistence, place a high value on these indigenous trees since they provide them with high-quality wood, a source of medicine and wood fuel [42]. Monoculture trees are planted in plantations [43], which are primarily made up of alien [44] trees, to produce wood that can be processed by wood-based enterprises. These include the Cupressus lusitanica and Pinus patula among others [45].

2.2. Research Design

A cross-sectional research design was applied in this study. Londiani Forest is divided into three forest blocks, Londiani, Chebewor and Kedowa, for conservation purposes according to the Londiani Forest Management Plan (LFMP) [42]. Kedowa block is rich in species number compared to the other blocks. Chebewor has a mountain called Mt. Blackett which is a tourist attraction site, while Londiani block has faced numerous anthropogenic activities like illegal logging, charcoal burning, unsupervised gazing, urbanization and fuel wood collection that has seen the native forest reduced drastically. Secondary regeneration to restore the block has led to a mixture of indigenous and alien (44) planted trees in the area covering a large percentage of Londiani block. Sampling areas and transects were established and mapped using Global Positioning System Garmin ETrex, country of origin, United States of America(GPS) and coordinates were noted down in the data collection sheet for further analysis using Geographical Information System software https://www.caliper.com/maptitude/gis-software/default.htm Accessed on 20 September 2022.

2.3. Data Collection

In each of the three forest blocks, belt transects measuring 25 m wide and 1 km long were established 100 m from the edge into the forest. At every 200 m along the transect, 25 m × 25 m quadrats were set up. Six plots were established in each of the forest blocks, summing to 18 plots in the entire forest. All individual trees within each plot were counted, their species identified and their scientific names established and recorded in a data sheet. For tree species which could not be identified in the field during the inventory, Para taxonomists who took part in the data collection reported the local name and in some cases, photos of the tree were taken. The species name was afterwards determined with the aid of a taxonomist and a manual [42] of woody tree species of the Londiani Forest. For all the trees inventoried, data on diameter at breast height (DBH), tree height, the species name and the number per plot were recorded in a data sheet. The tree species abundance was scaled to a hectare. The diameter at breast height for trees > 10 cm (DBH) was measured at 1.3 m from the ground using a diameter tape. Tree height was measured using a Suunto angular clinometer. Regeneration status was assessed by counting and identifying the number and species of seedlings and saplings. A nested quadrat measuring 5 m × 5 m within the 25 m × 25 m quadrat was used to sample saplings, while a 1 m × 1 m quadrat was used for sampling seedlings. All saplings and seedlings within the nested quadrat were identified and matched to the existing tree species. Tree species were listed according to KFS manual [42] as indigenous or exotic [45].

2.4. Data Analysis and Presentation

Data were entered into Microsoft Excel spreadsheets. The population structure of the tree species was analysed across fifteen DBH classes with an interval of 10 cm apart for a range of 10 cm to 150 cm and also across eleven tree height classes with an interval of 5 m apart from 1 m to 50 m. Total stem density, species density, basal area, species basal area, relative density, species diversity, evenness and richness were determined using the formulas shown below. Relative densities were extrapolated to per hectare (ha).
1.
S t e m   D e n s i t y ( t r e e s / h a ) = t r e e s   s a m p l e d P l o t   a r e a ( m 2 ) × 10,000   m 2 / ha
S p e c i e s   S t e m   d e n s i t y ( t r e e s / h a ) = s p e c i e s   X   s a m p l e d P l o t   a r e a   ( m 2 ) × 10,000   m 2 / ha  
2.
T o t a l   B a s a l   A r e a ( m 2 / h a ) = i n d i v i d u a l   t r e e   b a s a l   a r e a s p l o t   a r e a { m 2 } × 10,000   m 2 / h a
w h e r e   i n d i v i d u a l   t r e e   b a s a l   a r e a m 2 = π × t r e e   r a d i u s 2 × ( 1   m 2 / 10,000   c m 2 )
S p e c i e s   B a s a l   A r e a m 2 / h a = S p .   X   i n d i v i d u a l   t r e e   b a s a l   a r e a s P l o t   a r e a   m 2 × 10,000   m 2 / h a
3.
R e l a t i v e   d e n s i t y = N o . o f   t r e e s   o f   a   s p e c i e s T o t a l   n o .   o f   t r e e s   o f   a l l   t r e e   s p e c i e s  
= S p   X   i n d i v i d u a l   t r e e   b a s a l   a r e a s P l o t   a r e a   m 2 × 10,000   m 2 / h a
4.
Species Diversity
Diversity was calculated using Shannon Diversity index as shown below:
H = −∑ [( pi) × ln (pi)]
where (ln) is the natural logarithm, ∑ is the Greek letter denoting sum and (pi) represents the percentage of species i in the overall community [46].
5.
Evenness
E = Evenness = H/Hmax
Hmax = ln(N) = Maximum diversity possible
N = number of species, = species richness
6.
Jaccard Similarity Index
The Jaccard similarity index [47] was determined using the formula shown below:
SJ = c/(a + b + c)
where SJ is the similarity index, c is the number of shared species between the two sites and a and b are the number of species unique to each site [47].
7.
The Importance Value Index (IVI) was used to determine the ecological importance of each tree species.
IVI = RD + RF + RDO
where
RD is relative density;
RF is the relative frequency;
RDO is the relative dominance, where
  R D = N u m b e r   o f   a l l   i n d i v i d u a l s   o f   a   s p e c i e s T o t a l   n u m b e r   o f   a l l   i n d i v i d u a l s × 100  
R F = N u m b e r   o f   p l o t s   w h e r e   a   s p e c i e s   o c c u r s T o t a l   o c c u r r e n c e s   o f   a l l   s p e c i e s   i n   a l l   p l o t s × 100
R D O = B a s a l   a r e a   o f   a   s p e c i e s T o t a l   b a s a l   a r e a × 100
The quantifiable data were tested for normality using a Kolmogorov–Smirnov test and analysed statistically using techniques for descriptive and inferential statistics. A chi-square one-way non-parametric analysis of variance test was used to determine differences in abundance, diversity, density of trees and saplings among the forest blocks. The Ryan–Einot–Gabriel–Welsch Multiple Range Test (REGWQ) was used in post hoc tests to determine the source of variation among means at the 5% significance level.

3. Results

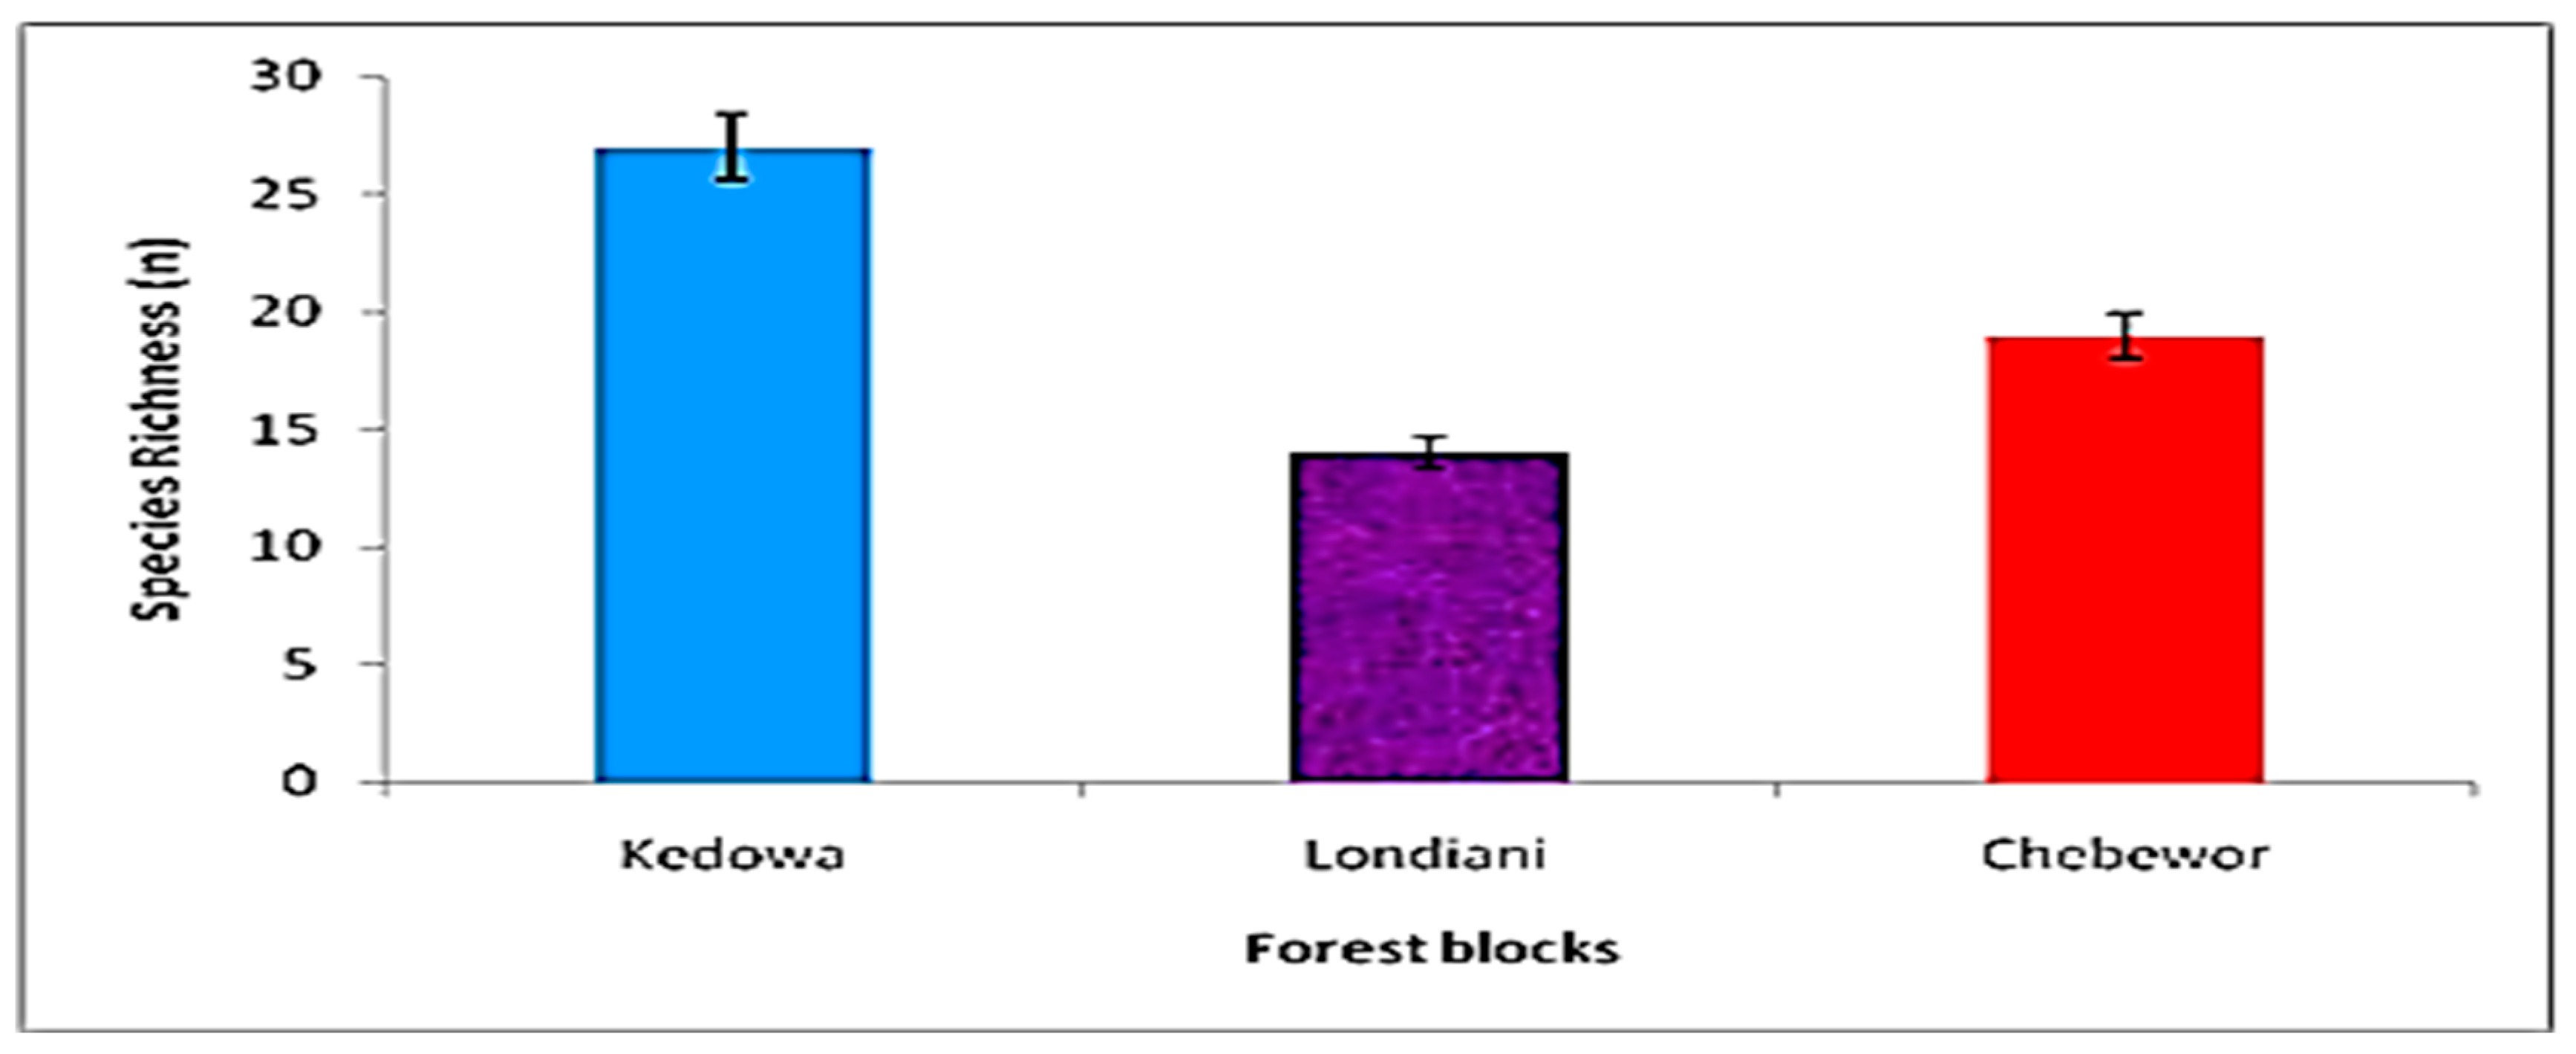
3.1. Forest Stand Structure and Composition of Londiani Forest

Woody Species Richness and Importance Value Indices

A total of 1308 individual trees were sampled, which represented thirty-four (n = 34) woody tree species in 24 families. Trees’ species richness ranged from 14 to 27 (Figure 2). Kedowa Forest block had the highest species richness (n = 27, 45%), while Londiani Forest block had the lowest species richness (n = 14, 23.3%). There was no statistically significant difference in richness distribution among the three forest blocks (X2 = 12.000 df = 9, p = 0.21). Indigenous tree species comprised 45.1% (n = 591) of all the trees sampled while exotic (non-native) species comprised 54.9% (n = 717) according to KFS, 2018 (a list of indigenous and alien tree species in Londiani Forest) [42]. Kedowa Forest block accounted for 54.4% (n = 235) of the indigenous trees and 45.6% (n = 197) of the exotics (non-native) and Chebewor Forest block accounted for 53.5% (n = 231) of indigenous trees and 46.5% (n = 201) of the exotics, while Londiani Forest block accounted for 27.4% (n = 118) of indigenous trees and 72.6% (n = 312) of the exotics. The family Cupressaceae had the highest number of woody plants (32%; n = 421), followed by Pinaceae (15%; n = 196). The families with the least woody plants were Proteaceae and Rhamnaceae, each representing 0.2% (n = 2). Analysis of importance value indices of woody species (IVI) for the three forest blocks ranged from 31.48–48.25%. Kedowa Forest block had the highest IVI of 48.25%, followed by the Londiani Forest block at 42.86% and then Chebewor Forest block at 31.48%.

3.2. Diameter at Breast Height Distribution

The DBH class distribution assumed a “J”-shaped inverted pattern with the majority of trees having smaller DBHs, while fewer trees having larger DBHs. The DBH ranged between 10 cm and 150 cm in Londiani Forest. The mean DBH for the Chebewor Forest block was 24.8 cm, for the Kedowa Forest block it was 32.4 cm and for the Londiani Forest block it was 34.2 cm (Figure 3).
Kedowa and Londiani Forest blocks had more trees in the DBH ranges of 21–30 cm, 31–40 cm and 41–50 cm. Chebewor, on the other hand, had more trees in the 11–20 cm DBH range. In all the forest blocks, there were trees with a DBH of <10 cm, which were mainly saplings. A total of n = 1177 (89.9%) trees out of N = 1308 trees recorded from the entire forest recorded a small DBH below 50 cm, showing that the forests consist of young, still growing trees. The results revealed no statistically significant differences in the mean DBH distribution among the three forest blocks (F = 0.560; p = 0.729).

3.3. Tree Height Distribution

The spectrum of tree height in Londiani Forest ranged from 1–50 m. The mean height for the Chebewor Forest block was 16.9 m that for the Kedowa Forest block was 23.9 m and 25 m for the Londiani Forest block (Figure 4).
The height of trees in the Kedowa Forest block ranged from 11 m to 45 m, while the height of trees in Chebewor and Londiani Forest blocks ranged from 11 m to 50 m, respectively. There was no statistically significant difference in height distribution classes between the three forest blocks (F = 0.821, p = 0.558).

3.4. Density and Relative Density

Stem density in the Londiani forest varied from 0.33 stems ha−1 to 45.5 stems ha−1. Cupressus lusitanica had the highest density of 45.5 stems ha−1, followed by Pinus patula with a density of 32.7 stems ha−1. Eucalyptus globulus and Juniperus procera were third in that order with a density of 24.7 stems ha−1 each, while Grevillea robusta had the least density of 0.33 stems ha−1. There was a statistically significant difference in stem density between the three forest blocks (F = 12.22; p = 0.005).

3.5. Basal Area, Dominance and Relative Dominance

The total basal area for all species recorded in the entire forest was 122.6419 ha−1. Cupressus lusitanica had the highest relative dominance of 33.684 ha−1, while the species with the least relative dominance of 0.038 ha−1 was Grevillea robusta. There was no statistically significant difference in basal area distribution within the three forest blocks (X2 = 12.000 df = 9, p = 0.213). Cupressus lusitanica recorded the highest species basal area of 2.295 ha−1, followed by Pinus patula with 0.992 ha−1 and Juniperus procera with 0.985 ha−1. Grevillea robusta had the lowest species basal area of 0.0026 ha−1.

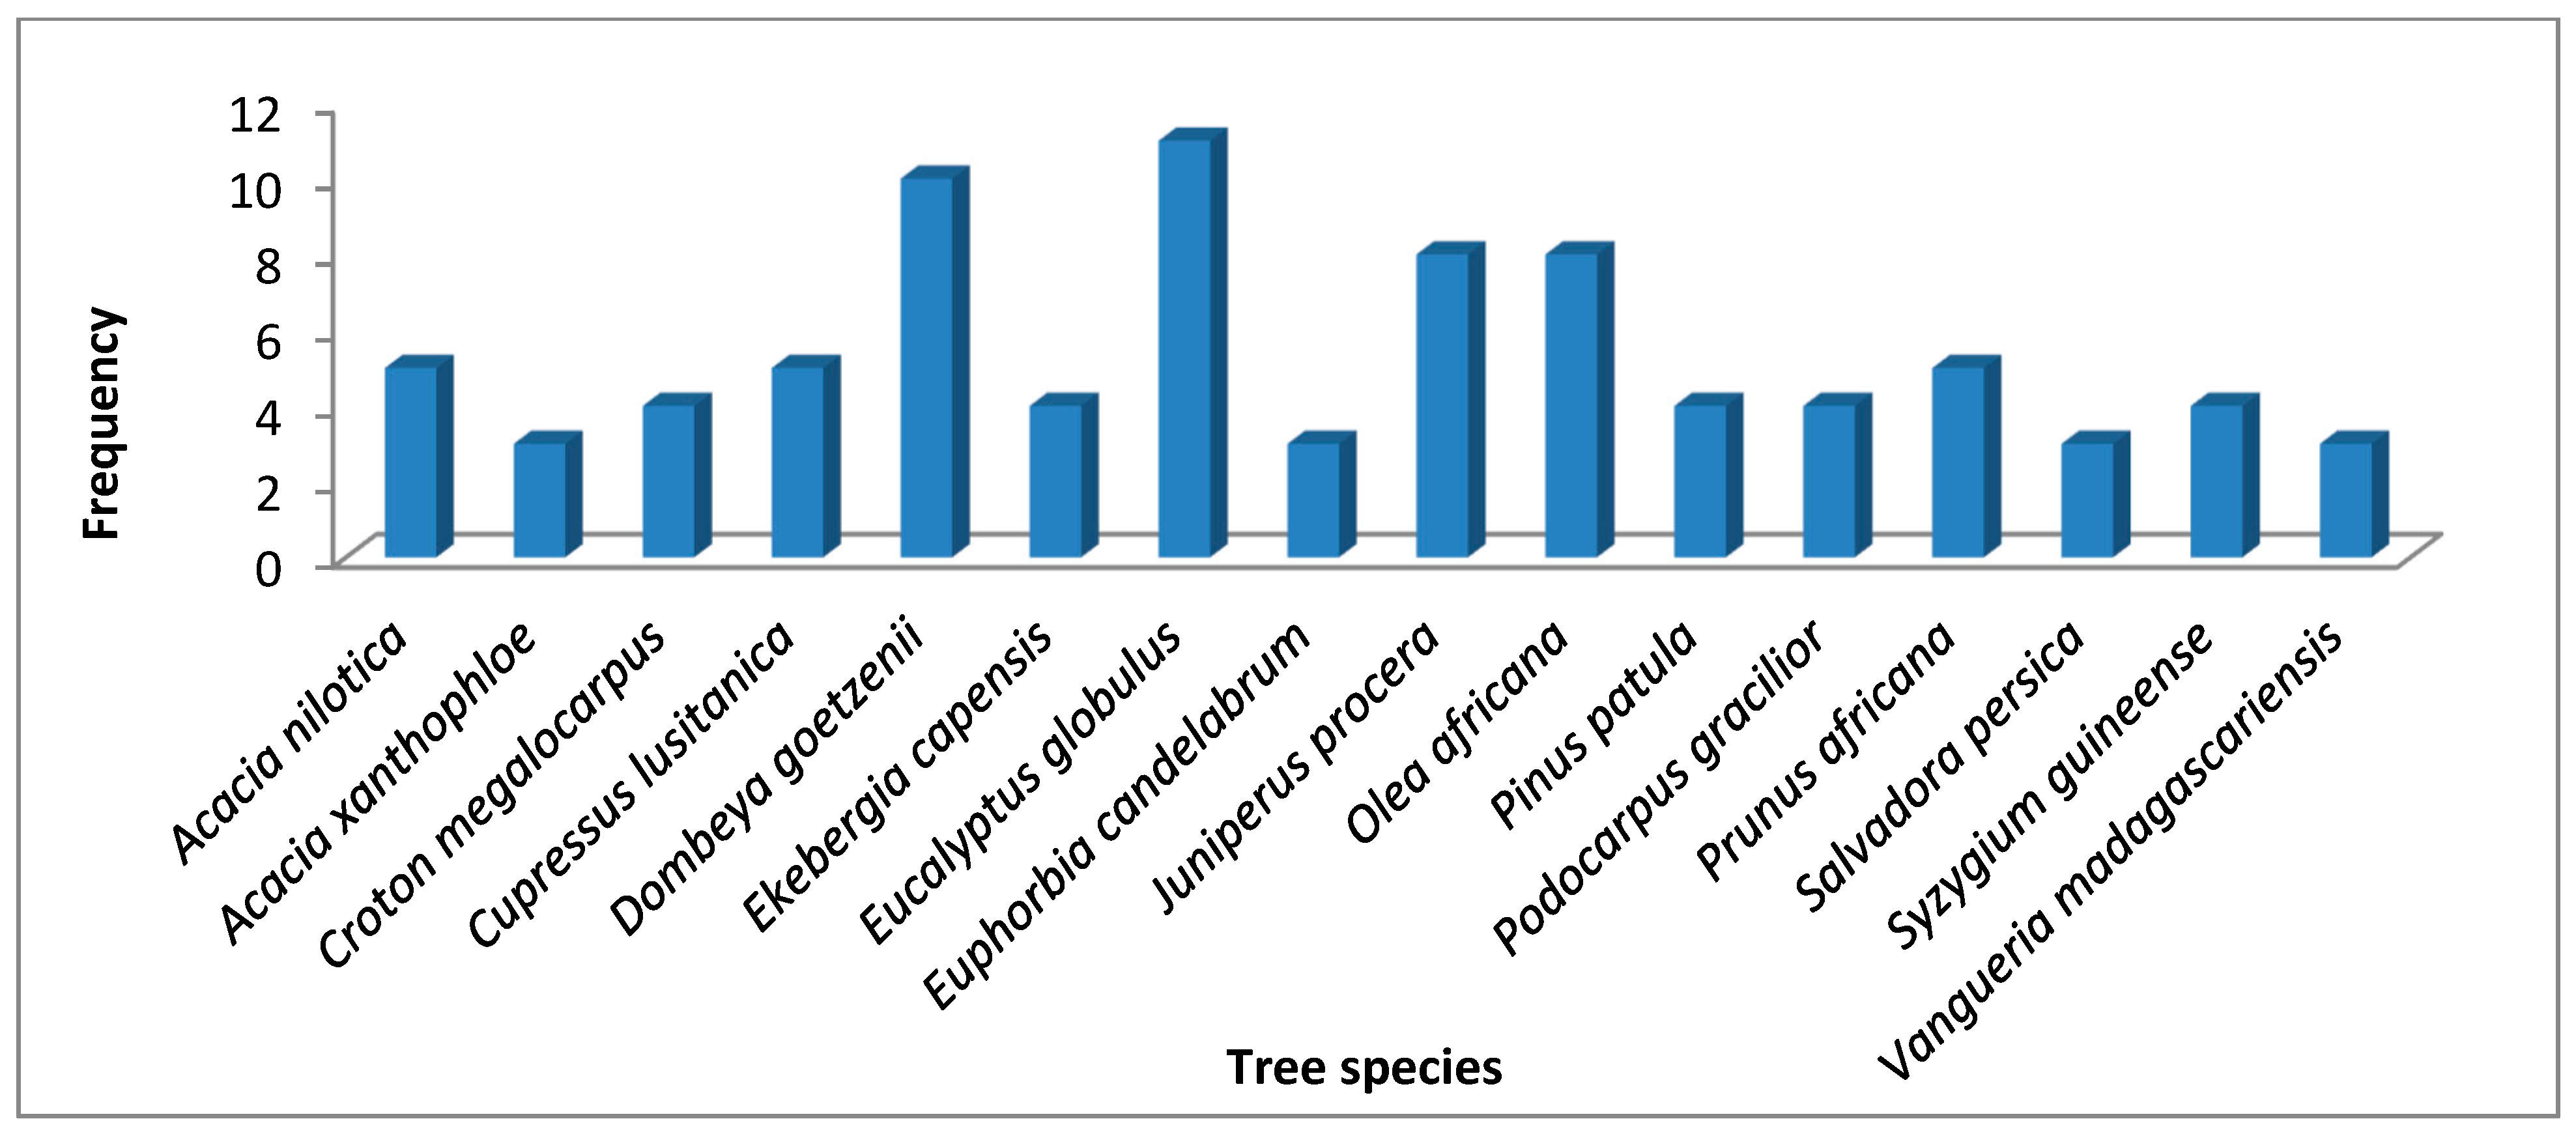
3.6. Frequency and Relative Frequency

Eucalyptus globulus had the highest frequency of 11 appearances and a relative frequency of 61.1%, followed by Dombeya goetzenii, appearing 10 times with a relative frequency of 55.5%. Juniperus procera and Olea africana had a frequency of 8 and a relative frequency of 44.4% each, while Acacia nilotica, Cupressus lusitanica and Prunus africana had a frequency of 5 and a relative frequency of 27.7% each (Figure 5). Acacia nilotica, Cupressus lusitanica and Prunus africana each had a frequency of 5 with a relative frequency of 27.7% (Figure 5). Arundiana alpina, Brassica actinophylla, Croton macrostachyus, Grevillea robusta, Maesopsis eminii and Ocotea usambarensis, among others, had the lowest frequencies of 1 and a relative frequency of 5.6%.

3.7. Woody Species Diversity and Evenness

The species diversity (H′) for the three forest blocks ranged from 0.792–0.864. Kedowa block had the highest diversity H′ = 0.864, followed by Chebewor Forest block with H′ = 0.855 and Londiani block at 0.792 (Table 1). There were significant statistical differences in woody species diversity among the three forest blocks (X2 = 12.000 df = 9, p = 0.213). Chebewor Forest block had the highest evenness (1 ± 0.32), while Londiani Forest block had the lowest (0.41 ± 0.04).

3.8. Similarity between Sites

Table 2 shows the Jaccard similarity indices among the three forest blocks. The similarity index ranged from 0.34 to 0.47. Kedowa and Chebewor forest blocks had a relatively higher similarity index of 0.47, which implies that the two vegetation types shared more similar woody species than between Londiani and Kedowa. This was followed by a lower similarity index between Londiani and Chebewor forest blocks.

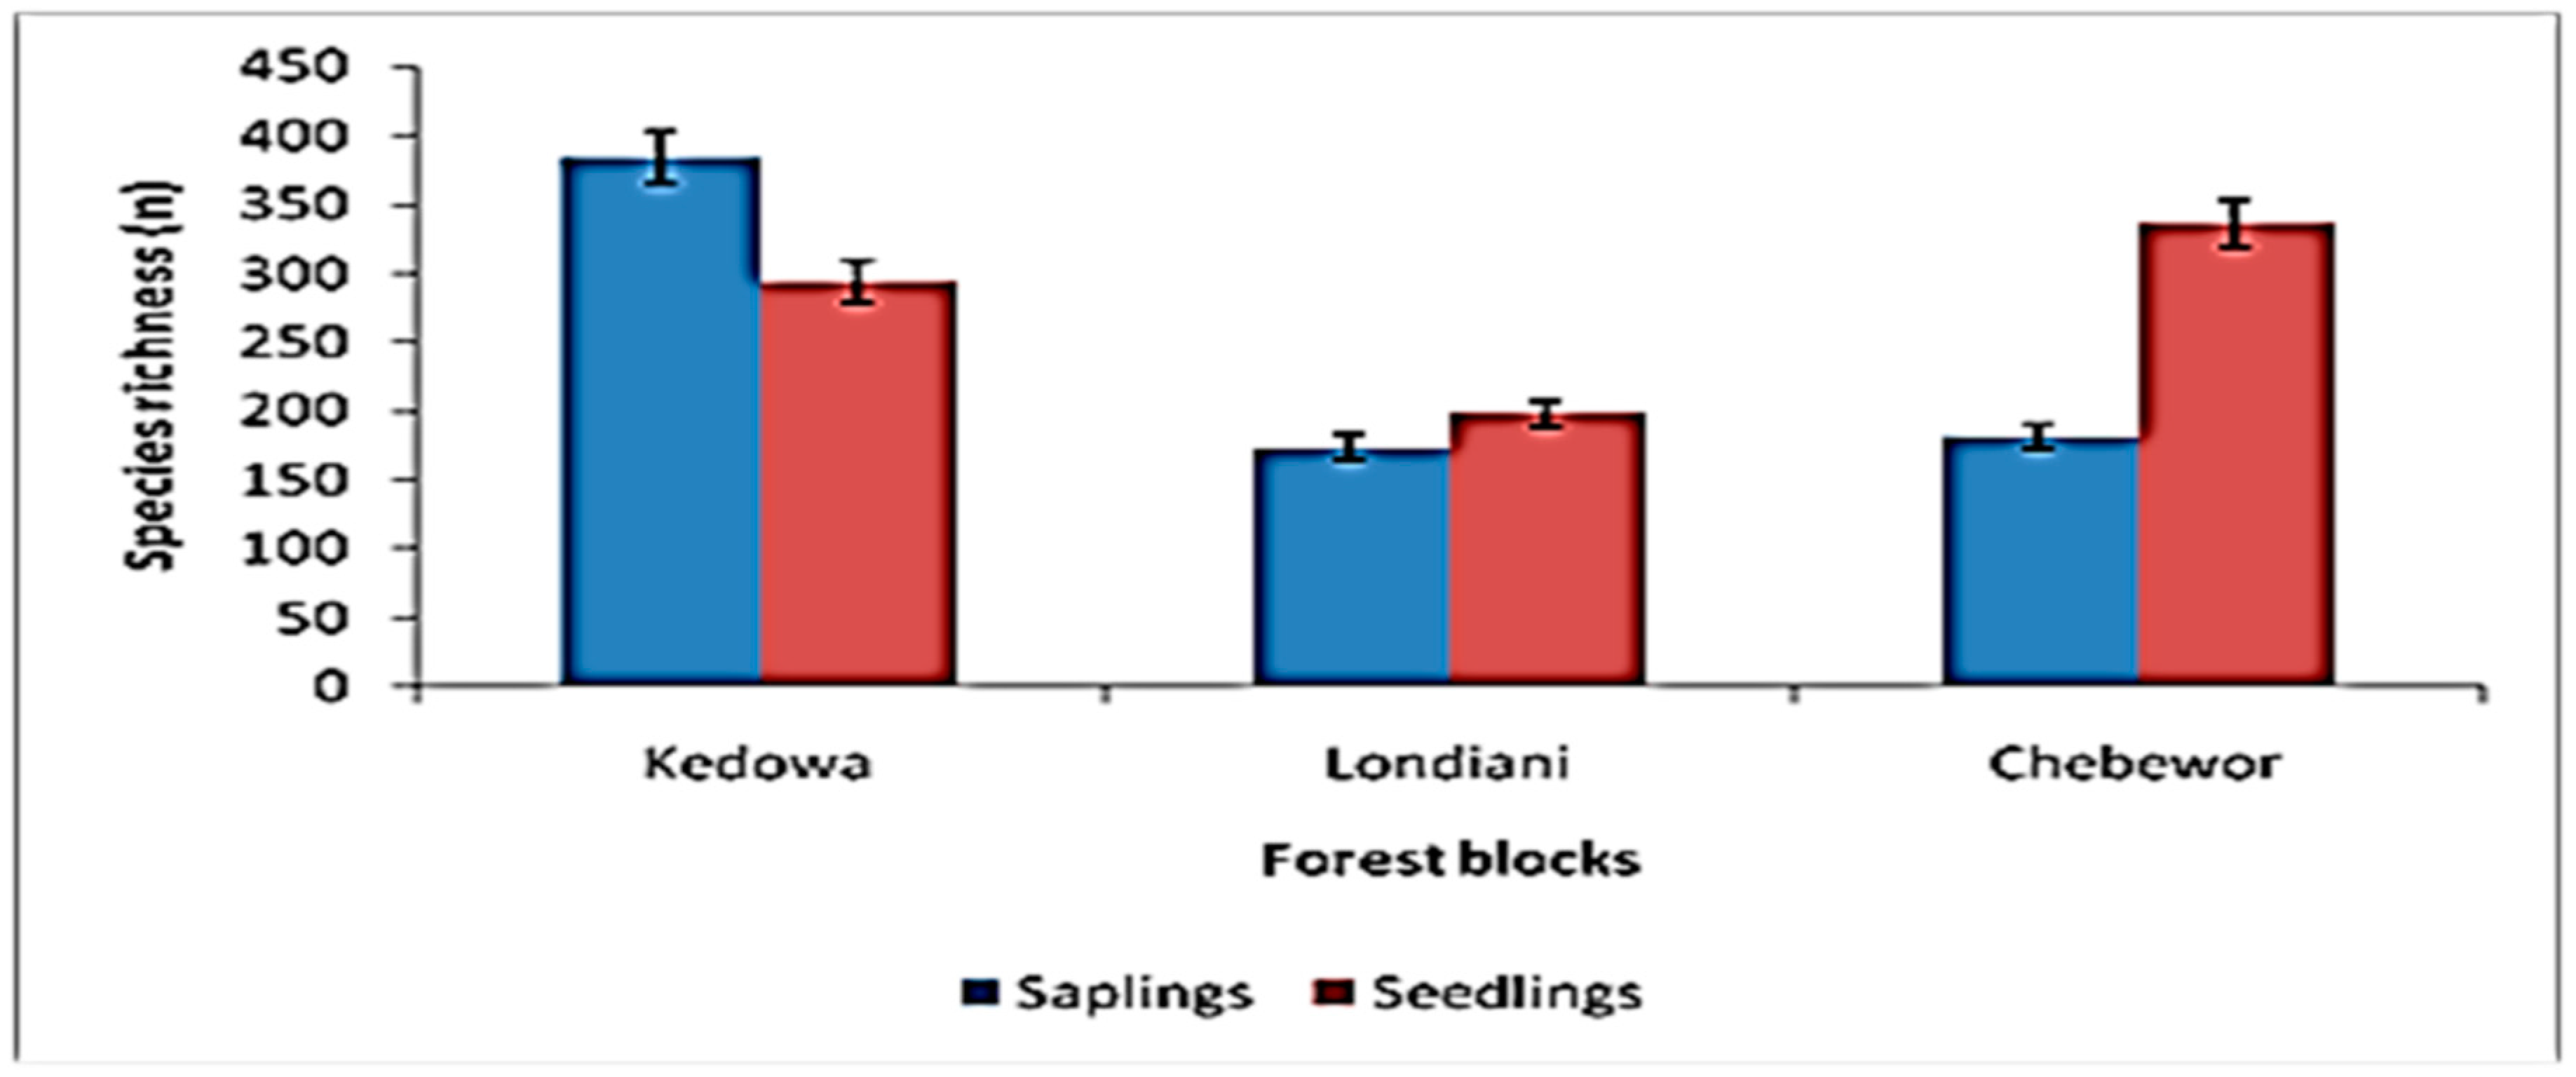
3.9. Regeneration Status of Londiani Forest

Londiani Forest recorded a total of n = 740 saplings and n = 832 seedlings (Table 3). Kedowa Forest block recorded saplings abundance of n = 384 and n = 294 seedlings and Chebewor had a saplings abundance of n = 182 and n = 337 seedlings, while Londiani block recorded a saplings abundance of n = 174 and n = 198 seedlings (Figure 6).
In Kedowa Forest block, Cupressus lusitanica accounted for most of the saplings (33.4%; n = 128), while Vangueria madagascariensis (0.5%; n = 2) had the least number of saplings. Likewise, Cupressus lusitanica had the highest number of seedlings (66.7%; n = 198), followed by Croton megalocarpus (4.4%; n = 13) and Eucalyptus globulus (4%; n = 12). Pinus patula did not have any seedlings since the trees were still young and had not reached maturity where they can produce seeds which would later become seedlings.
In the Chebewor Forest block, Juniperus procera had the highest numbers of saplings (34.6%; n = 63), followed by Eucalyptus globulus with (21.4%; n = 39), Acacia mearnsii (16.5%; n = 30) and Rhus natalensis (5.5%; n = 10). Cupressus lusitanica, Anthocleista vogelii, Grevillea robusta, Podocarpus falcatus, Salvadora persica, Tamarindus indica and Vangueria madagascariensis had no saplings. Juniperus procera had the most seedlings (45.4%; n = 153), followed by Eucalyptus globulus at (23.7%; n = 80). The rest of the species had no seedlings.
In the Londiani Forest block, the saplings ranged from 2 to 121. Acacia xanthophloe had the most saplings (69.5%; n = 121), then Juniperus procera (10.3%; n = 18), Eucalyptus globulus (1.3%; n = 2). The rest of the tree species had no saplings. Acacia xanthophloe had the most seedlings (n = 130; 65.7%), followed by Juniperus procera (n = 29; 14.7%) and Dombeya goetzenii (n = 2; 1.01%). The rest of the species had no seedlings. There was no statistically significant difference (p = 0.082) in the abundance distribution of saplings and seedlings (p = 0.238) within the three forest blocks.

4. Discussion

4.1. Forest Stand Structure and Species Composition

The results of this study reveal that the three forest blocks of Londiani Forest recorded a total of 34 different tree species. Another study performed in the same area by the Kenya Forest Service (KFS) in 2018 [42] reported a total of 27 species, while [48] identified 38 plant species. The Londiani Forest's species composition was similar to that of the dry Afromontane forest in Ethiopia, which included 36 species [49], and the Mopane woodland in northern Botswana, which contained 35 species [50]. However, this figure was less than the 55 species of Kenya's tropical woodlands [51]. According to Getaneh et al., 2019 [52], various species within these ecosystems contribute to the accomplishment of crucial ecological activities, including the provision of habitat for other flora and fauna as well as economic services. The large number of species found in Londiani Forest may be due to historical and current disruptions, which are mostly attributed to human activity as well as to natural causes. These factors stimulate the establishment of a variety of species [53]. There were ongoing disturbances observed in the study site which further affect forest diversity. Livestock were grazing freely and unsupervised and charcoal burning was witnessed in Chebewor and Kedowa blocks in the remaining indigenous portion of the forest. These disturbances have led to a decline in climax economically important species. Similarly, Sapkota et al., 2010 [54] reported a decline in species diversity as a result of disturbances.
The findings show that Kedowa block was richer in tree species compared to the other two blocks; the same findings were shared by the KFS in 2018 [42]. There were many indigenous tree species fully matured and with saplings and seedlings, unlike Londiani block, which had a small area with indigenous tree species. Similar observations were recorded in [51]. Chebewor block had above 50% of indigenous tree species but had faced numerous anthropogenic impacts. Efforts of restoration could be seen, where many secondary planted indigenous tree species had matured, while other plots were still young trees growing under the Plantation Establishment for Livelihood Improvement Scheme (PELIS). The DBH for the forest ranged from 10 cm to 150 cm, an indication that the forest consists of young trees which are still growing. Translating this to carbon sequestration potential implies the forest is actively sequestering carbon. The small DBH ranges in the trees sampled in the forest could also be an indication that bigger trees are being harvested for timber and charcoal, leaving behind small ones.
Cupressus lusitanica was the most prevalent species in Londiani Forest. It is a secondary exotic (non-native) (44) species planted under the modern shamba system (PELIS) program to replace the indigenous trees after a forest experiences disturbances. Mutiso [51] recorded Cupressus lusitanica as the most abundant exotic species in the Mau Forest Complex which Londiani Forest is part of. Cupressus lusitanica and Pinus patula, two of the introduced conifers, have successfully adapted to the local growing environment and are now the main species that are frequently planted in industrial plantations [55,56,57]. Around 80% of the 186,000 ha state-owned forest plantation land is currently made up of the two conifer species Cupressus lusitanica and Pinus patula [55]. The species' management practices, silviculture and other growth characteristics are also well known because they have been present in the Kenyan landscape for a sizable amount of time [55]. This study also agrees with [58], who found a high abundance of these species on farms neighbouring Kakamega tropical rainforest. The only indigenous conifer species, Juniperus procera, was recorded in Londiani Forest but had a very low abundance. The findings of this study are in agreement with those of Cheboiwo et al., 2015 [59], who found that Juniperus procera grows natively in Western rainforests and high-altitude montane forest types, such as the Kenya Mau Forest Complex, and is a slow-growing conifer when compared to alien conifers [60].
For the three forest blocks, the analysis of the significance value indices of woody species (IVI) ranged from 31.48%–48.25%, suggesting that some of the tree species are commonly found in all the three forest blocks. Based on Jaccard similarity indices, it is clear that the three forest blocks have low similarity indexes of less than 0.5. This indicates that there is some degree of species sharing within the three forest blocks, particularly between the Chebewor and Kedowa blocks. This can be attributed to endemism and neighbourhood effects. Neighbour plant interactions are cited in [61] as a factor in post-disturbance plant forms. The great similarity between Kedowa and Chebewor Forest blocks, on the other hand, may have been influenced by the minor changes in their terrain and levels of disturbance.

4.2. Population Structure and Regeneration Status of Londiani Forest

Due to inadequate forest management, which exposed the trees to unlawful harvesting and resulted in cut tree stumps being observed in the three forest blocks, the population structure and regeneration state of the different tree species varied. While there were minor differences in the species richness of adult trees among the three forest blocks, adult tree species were significantly more numerous and diverse than saplings and seedlings. Each forest had a different total quantity of seedlings and saplings. The number of species of seedlings and saplings was accounted for by a small number of species, much like the densities of adult tree species. These results concur with those in [51], which claimed that persistent disruptions on the sites have had a negative impact on the regeneration and recruitment processes in studies conducted in the Mau Complex. Low redundancy mono-dominant forests are encouraged by such regeneration processes [62]. The main reason for differences in species composition between adults, saplings and seedlings in the forests was the extent of harvesting.
Londiani forest has a very low population density of saplings and seedlings, indicating the poor regeneration status of the forest in the near future. Therefore, development of management options that take conservation goals, socio-economic realities and development priorities into consideration should be designed to assist the regeneration process, a fact that resonates with [53]. The regeneration status of Londiani forest may remain poor for a long time if ongoing disturbances, including illegal logging, charcoal burning, forest encroachment, unsupervised grazing livestock and wood and timber production, fail to be reduced and may require over five decades to return to pre-disturbance conditions [51,54]. Therefore, human interventions are required to reduce the effects of disturbances and maintain the integrity of the forests, as well as to enhance their composition and structure [59]. An improved shamba system currently promoted under the PELIS program has proven to be very effective for the regeneration of trees in the Londiani area. In all three forest blocks, food crops were notably planted alongside both exotic (non-native) (44) and indigenous trees seedlings. PELIS has proven to be a cost-effective and efficient plantation method, but its seedling survival rates have shown some inconsistent results according to [62]. A high seedling survival rate of 79% has been recorded in Nyandarua County, in Trans-nzoia County a 51% survival rate has been recorded and a national mean of 67% was recorded according to KFS data from the 2012/2013 planting season, although further research accounting for heterogeneous performance is yet to be performed according to [63].

5. Conclusions

The objective of this study was to determine the woody species composition, tree diversity and regeneration status of Londiani Forest, Kenya. This study aimed at developing a forest inventory to support physical planning purposes, environmental policy and sustainable land use and land development. This study reports findings on the current stand structure, species composition and regeneration status of Londiani Forest. This information will help strengthen Kenya Forest Service and Community Forest Association operation activities geared towards forest sustainability. The findings showed that Londiani Forest is a relatively diverse forest with both indigenous and exotic (non-native) tree species. Physical observations revealed a low floristic composition in the Londiani Forest at mature, seedling and sapling stages, indicating poor establishment and recruitment as a result of continuing disturbances, primarily anthropogenic disturbances, including forest excision, encroachment, illegal logging, overgrazing, rampant charcoal production, political interferences, an unsustainable Plantation Establishment for Livelihood Improvement Scheme (PELIS) system, ballooning of plantation forest, pollution from factories wastes both liquid and solid wastes, debarking of trees for medicinal purposes and construction of bee hives. Anthropogenic factors stemming from population pressure and ineffective implementation of relevant forest laws, policies and regulations were shown to be the main causes of forest cover reduction.

Author Contributions

Conceptualization, E.K.C. and H.M.T.; Investigation, E.K.C.; Writing—original draft, E.K.C.; Writing—review and editing, H.M.T.; Supervision, H.A. and H.L. All authors have read and agreed to the published version of the manuscript.

Funding

This research received no external funding.

Data Availability Statement

Data for this study are available upon request through the corresponding author.

Acknowledgments

The authors would like to thank the Kenya Forest Service (KFS) in Londiani for giving E.K. Chepkoech a permit to collect data in the forest during her study for a MSc. We also appreciate Julius Sila, Irine Cherotich, Erick Bii, Mercy Chelangat, Peacemark Kipkorir and Willy Cheruiyot for their help in data collection. All individuals included in this section have consented to the acknowledgement.

Conflicts of Interest

The authors declare no conflict of interest.

References

  1. Bennett, G. Integrating Biodiversity Conservation and Sustainable Use: Lessons Learned from Ecological Networks; IUCN: Gland, Switzerland, 2004. [Google Scholar]
  2. Bharucha, Z.; Pretty, J. The roles and values of wild foods in agricultural systems. Philos. Trans. R. Soc. B Biol. Sci. 2010, 365, 2913–2926. [Google Scholar] [CrossRef]
  3. Blackman, A.; Veit, P. Titled Amazon indigenous communities cut forest carbon emissions. Ecol. Econ. 2018, 153, 56–67. [Google Scholar]
  4. Agevi, H.; Wabusya, M.; Tsingalia, H.M. Community Forest Associations and Community-Based Organizations: Redesigning their Roles in Forest Management and Conservation in Kenya. Int. J. Sci. Res. (IJSR) 2014, 3. [Google Scholar]
  5. Chomba, B.M.; Tembo, O.; Mutandi, K.; Mtongo, C.S.; Makano, A. Drivers of Deforestation, Identification of Threatened Forests and Forest Co-Benefits Other than Carbon from REDD+ Implementation in Zambia; A consultancy report prepared for the Forestry Department and the Food and Agriculture Organization of the United Nations under the national UN-REDD Programme. Ministry of Lands, Natural Resources and Environmental Protection: Lusaka, Zambia, 2014. Available online: http://landforlions.org/data/documents/drivers-deforestation-Zambia-WEB_final.pdf (accessed on 22 September 2021).
  6. Beatty, C.R.; Cox, N.A.; Kuzee, M.E. Biodiversity Guidelines for Forest Landscape Restoration Opportunities Assessments, 1st ed.; IUCN: Gland, Switzerland, 2018. [Google Scholar]
  7. Bastin, J.-F.; Finegold, Y.; Garcia, C.; Mollicone, D.; Rezende, M.; Routh, D.; Zohner, C.M.; Crowther, T.W. The global tree restoration potential. Science 2019, 365, 76–79. [Google Scholar] [PubMed]
  8. Zhu, H.; Xu, Z.F.; Wang, H.; Li, B.G. Tropical rain forest fragmentation and its ecological and species diversity changes in southern Yunnan. Biodivers. Conserv. 2004, 13, 1355–1372. [Google Scholar] [CrossRef]
  9. Agrawal, A.; Chhatre, A.; Hardin, R. Changing governance of the world’s forests. Science 2008, 320, 1460–1462. [Google Scholar] [CrossRef]
  10. Chan, K.M.A.; Pringle, R.M.; Ranganathan, J.; Boggs, C.L.; Chan, Y.L.; Ehrlich, P.R.; Haff, P.K.; Heller, N.E.; Al-Khafaji, K.; Macmynowski, D.P. When agendas collide: Human welfare and biological conservation. Conserv. Biol. 2007, 21, 59–68. [Google Scholar] [CrossRef]
  11. Ahenkan, A.; Boon, E. Improving nutrition and health through non-timber forest products in Ghana. J. Health Popul. Nutr. 2011, 29, 141–148. [Google Scholar] [CrossRef]
  12. Barros, F.M.; Peres, C.A.; Pizo, M.A.; Ribeiro, M.C. Divergent flows of avian-mediated ecosystem services across forest-matrix interfaces in human-modified landscapes. Landsc. Ecol. 2019, 35, 879. [Google Scholar] [CrossRef]
  13. CBD. Linking Biodiversity Conservation and Poverty Alleviation: A State of Knowledge Review; CBD Technical Series No: 55; Secretariat of the Convention on Biological Diversity: Montreal, QC, Canada, 2010. [Google Scholar]
  14. Ding, H.; Veit, P.G.; Blackman, A.; Gray, E.; Reytar, K.; Altamirano, J.C.; Hodgdon, B. Climate Benefits, Tenure Costs: The Economic Case for Securing Indigenous Land Rights in the Amazon; WRI: Washington, DC, USA, 2016. [Google Scholar]
  15. Wenger, K.F. Forestry Handbook; John Wiley and Sons, Inc.: New York, NY, USA, 2013; 1335p. [Google Scholar]
  16. Dau, J.H.; Mati, A.; Dawaki, S.A. Role of Forest Inventory in Sustainable Forest Management: A Review. Int. J. For. Hortic. 2015, 1, 33–40. [Google Scholar]
  17. Monserud, R.A. Evaluating Forest Models in a Sustainable Forest Management Context; FBMIS, 2003; Volume 1, pp. 35–47. ISSN 1740-5955. Available online: http://www.fbmis.info/A/3_1_MonserudR_1 (accessed on 15 May 2023).
  18. Zerihun, A.; Yemir, T. Hawassa University: Wondo Genet Colleg of Forestry and Natural Resources. In Training Manual on: Forest Inventory and Management in the Context of SFM & REDD; International Journal of Forestry and Horticulture (IJFH) Volume 1, Issue 2, July–September 2015, PP 33-40 ISSN 2454-9487. Available online: www.arcjournals.org (accessed on 15 May 2023).
  19. Mendoza, G.A.; Prabhu, R. Qualitative multi-criteria approach to assessing indicators of sustainable forest resource management. For. Ecol. Manag. 2000, 131, 107–126. [Google Scholar] [CrossRef]
  20. Marengo, J. Drought, Floods, Climate Change, and Forest Loss in the Amazon Region: A Present and Future Danger? Front. Young Minds 2020, 8, 147. [Google Scholar] [CrossRef]
  21. Lawrence, D.; Vandecar, K. Effects of tropical deforestation on climate and agriculture. Nat. Clim. Chang. 2015, 5, 27–36. [Google Scholar] [CrossRef]
  22. Krupnick, G.A. Conservation of tropical plant biodiversity: What have we done, where are we going? Wiley Online libr. Biotropica 2013, 45, 693–708. [Google Scholar]
  23. Fischer, R.; Bohn, F.; de Paula, M.D.; Dislich, C.; Groeneveld, J.; Gutiérrez, A.G.; Kazmierczak, M.; Knapp, N.; Lehmann, S.; Paulick, S.; et al. Lessons learned from applying a forest gap model to understand the ecosystem and carbon dynamics of complex tropical forests. Ecol. Modell. 2016, 326, 124–133. [Google Scholar] [CrossRef]
  24. Aide, T.M. Tropical Forest Restoration; Restoration Ecology Special Issue; Encyclopedia of Life Support Systems (EOLSS); 2000; Volume 8, pp. 327–424. Available online: https://www.eolss.net/ebooklib/sc_cart.aspx (accessed on 18 June 2022).
  25. Chazdon, R.L.; Uriarte, M. Natural regeneration in the context of large-scale forest and landscape restoration in the tropics. Biotropica 2016, 48, 709–715. [Google Scholar] [CrossRef]
  26. Wangda, P. Forest Zonation along the Complex Altitudinal Gradients in a Dry Valley of Punatsang Chu. Master’s Thesis, Graduate School of Frontier Sciences, Laboratory of Biosphere Functions, University of Tokyo, Tokyo, Japan, 2003. [Google Scholar]
  27. Mori, A.; Takeda, H. Effects of Undisturbed Canopy Structure on Population Structure and Species Coexistence in an Old-growth Subalpine Forest in Central Japan. For. Ecol. Manag. 2004, 200, 89–100. [Google Scholar] [CrossRef]
  28. Peña-Claros, M.; Poorter, L.; Alarcón, A.; Blate, G.; Choque, U.; Fredericksen, T.S.; Justiniano, M.J.; Leaño, C.; Licona, J.C.; Pariona, W. Soil Effects on Forest Structure and Diversity in a Moist and a Dry Tropical Forest. Biotropica 2012, 44, 276–283. [Google Scholar] [CrossRef]
  29. Liira, J.; Sepp, T.; Kohv, K. The ecology of tree regeneration in mature and old forests: Combined knowledge for sustainable forest management. J. For. Res. 2011, 16, 184–193. [Google Scholar] [CrossRef]
  30. Chazdon, R.L. Tropical forest recovery: Legacies of human impact and natural disturbances. In Perspectives in Plant Ecology, Evolution and Systematics; Urban & Fischer Verlag: Munich, Germany, 2003; Volume 6, pp. 51–71. ISSN 1433-8319. [Google Scholar]
  31. Bazzaz, F. Regeneration of Tropical Forests: Physiological Responses of Pioneer and Secondary Species. In Rainforest Regeneration and Management; Gomez-pompa, A., Whitmore, T., Hadley, M., Eds.; Parthenon Publishing, UNES: Paris, France, 1991; pp. 91–118. [Google Scholar]
  32. Khumbongmayum, A.D.; Khan, M.; Tripathi, R. Biodiversity Conservation in Sacred Groves of Manipur, Northeast India: Population Structure and Regeneration Status of Woody Species. In Human Exploitation and Biodiversity Conservation; Springer: Berlin/Heidelberg, Germany, 2006; Volume 15, pp. 2439–2456. [Google Scholar]
  33. Strassburg, B.B.N.; Beyer, H.L.; Crouzeilles, R.; Iribarrem, A.; Barros, F.; de Siqueira, M.F.; Sánchez-Tapia, A.; Balmford, A.; Sansevero, J.B.B.; Brancalion, P.H.S.; et al. Strategic approaches to restoring ecosystems can triple conservation gains and halve costs. Nat. Ecol. Evol. 2019, 3, 62–70. [Google Scholar] [CrossRef]
  34. Teketay, D. Seed and Regeneration Ecology in Dry Afromontane Forests of Ethiopia: I. Seed Production-population Structures. Trop. Ecol. 2005, 46, 29–44. [Google Scholar]
  35. Wittmann, F.; Schöngart, J.; Montero, J.C.; Motzer, T.; Junk, W.J.; Pieadade, M.T.F.; Queiroz, H.L.; Worbes, M. Tree Species Composition and Diversity Gradients in the White-Water Forests across the Amazon Basin. J. Biogeogr. 2006, 33, 1334–1347. [Google Scholar] [CrossRef]
  36. Gotelli, N.J.; Chao, A. Measuring and Estimating Species Richness, Species Diversity, and Biotic Similarity from Sampling Data, 2nd ed.; Levin, S.A., Ed.; Encyclopedia of Biodiversity; Academic Press: Waltham, MA, USA, 2013; Volume 5, pp. 195–211. [Google Scholar]
  37. Schleuning, M.; Farwig, N.; Peters, M.K.; Bergsdorf, T.; Bleher, B.; Brandl, R.; Dalitz, H.; Fischer, G.; Freund, W.; Gikungu, M.W.; et al. Forest fragmentation and selective logging have inconsistent effects on multiple animal-mediated ecosystem processes in a tropical forest. PLoS ONE 2011, 6, e27785. [Google Scholar] [CrossRef] [PubMed]
  38. Tarus, G.K.; Nadir, S.W. Effect of Forest Management Types on Soil Carbon Stocks in Montane Forests: A Case Study of Eastern Mau Forest in Kenya. Int. J. For. Res. 2020, 8862813. [Google Scholar] [CrossRef]
  39. [GoK] Government of Kenya. Ministry of livestock and fisheries. Agricultural Sector Development Support System (ASDSP) Volume I Household Baseline Survey Report- Kericho County 2014. Available online: www.asdsp.co.ke (accessed on 5 July 2022).
  40. Government of Kenya (GOK). Sessional Paper No. 1 of 2007 on Forest Policy; Government of Kenya Printers: Nairobi, Kenya, 2007.
  41. Government of Kenya (GOK). Kenya Gazette Supplement Acts: The Forest Act; Government of Kenya printers: Nairobi, Kenya, 2005.
  42. Kenya Forest Service. Londiani Participatory Forest Management Plan 2018–2022; CIFOR: Bogor, Indonesia, 2018. [Google Scholar]
  43. GOK. Plantation Establishment for Livelihood Improvement Scheme Guidelines; Government Printers: Nairobi, Kenya, 2007. [Google Scholar]
  44. Richardson, D.M.; Pysek, P.; Rejmanek, M.; Barbour, M.G.; Panetta, F.D.; West, C.J. Naturalization and invasion of alien plants: Concepts and definitions. Divers. Distrib. 2000, 3, 14–93. [Google Scholar] [CrossRef]
  45. Blackburn, T.M.; Pyšek, P.; Bacher, S.; Carlton, J.T.; Duncan, R.P.; Jarošík, V.; Wilson, J.R.; Richardson, D.M. A proposed unified framework for biological invasions. Trends Ecol. Evol. 2011, 26, 333–339. [Google Scholar] [CrossRef]
  46. Roswell, M.; Dushoff, J.; Winfree, R. A Conceptual Guide to Measuring Species Diversity. Oikos Adv. Ecol. 2021, 130, 321–338. [Google Scholar] [CrossRef]
  47. Hancock, P.R. Book Reviews. Rev. Radic. Political Econ. 2004, 36, 260–263. [Google Scholar] [CrossRef]
  48. Mutiso, F.; Hitimana, J.; Kiyiapi, J.; Sang, F.; Eboh, E. Recovery of Kakamega tropical rainforest from anthropogenic disturbances. J. Trop. For. Sci. 2013, 25, 566–576. [Google Scholar]
  49. Girma, A.; Mosandl, R. Structure and potential regeneration of degraded secondary stands in Sameness-Shashemene Forest, Ethiopia. J. Trop. For. Sci. 2012, 24, 46–53. [Google Scholar]
  50. Teketay, D.; Kashe, K.; Madome, J.; Kabelo, M.; Neelo, J.; Mmusi, M.; Masamba, W. Enhancement of Diversity, Stand Structure and Regeneration of Woody Species through Area Exclosure: The Case of a Mopane Woodland in Northern Botswana. Ecol. Process. 2018, 7, 5. [Google Scholar] [CrossRef]
  51. Mutiso, F.M.; Mugo, M.J.; Cheboiwo, J.; Sang, F.; Tarus, G.K. Floristic Composition, Affinities and Plant Formations in Tropical Forests: A Case Study of Mau Forests in Kenya. Int. J. Agric. For. 2015, 5, 79–91. [Google Scholar] [CrossRef]
  52. Getaneh, G.; Teshome, S.; Tesfaye, B.; Demel, T. Species composition, stand structure, and regeneration status of tree species in dry Afromontane forests of Awi Zone, northwestern Ethiopia. Ecosyst. Health Sustain. 2019, 5, 199–215. [Google Scholar] [CrossRef]
  53. Kinyanjui, M.J.; Latva-Käyrä, P.; Bhuwneshwar, P.S.; Kariuki, P.; Gichu, A.; Wamichwe, K. An Inventory of the Above Ground Biomass in the Mau Forest Ecosystem, Kenya. Open J. Ecol. 2014, 4, 619–627. [Google Scholar] [CrossRef]
  54. Sapkota, I.; Tigabu, M.; Oden, P. Changes in tree species diversity and dominance across disturbance gradient in Napelese Sal (Shorea robusta Gaertn. f.). J. For. Res. 2010, 21, 25–32. [Google Scholar] [CrossRef]
  55. Kuria, N.C.; Balozi, K.; Kipkore, W. Growth and Yield Models for Plantation-Grown Cupressus lusitanica for Central Kenya. Afr. J. Educ. Sci. Technol. 2019, 5, 34–58. [Google Scholar]
  56. Mutangah, J.; Mwangangi, O.; Mwaura, P. Mau Forest Complex Vegetation. J. Ecol. 2014, 04, 619–627. [Google Scholar] [CrossRef]
  57. Omondi, F.S. Early Growth Performance and Survival of Pine Hybrids in Turbo, Kenya. East Afr. Agric. For. J. 2018, 84. Available online: https://www.kalro.org/www.eaafj.or.ke/index.php/path/article/view/301/475 (accessed on 5 July 2022).
  58. Agevi, H. Determination of Species Abundance, Diversity and Carbon Stocks in Kakamega Forest Ecosystem. Ph.D. Dissertation, Moi University, Eldoret, Kenya, 2020. Available online: http://ir.mu.ac.ke:8080/jspui/handle/123456789/3101 (accessed on 5 July 2022).
  59. Cheboiwo, K.; Joshua, M.; Robert, O.; Mbinga, J.; Festus, M. Potential Growth, Yields and Socioeconomic benefits of Four Indigenous Species for Restoration in Moist Forest, Mau Kenya. J. Environ. Earth Sci. 2015, 5. ISSN 2224-3216 (Paper) ISSN 2225-0948 (Online). Available online: www.iiste.org (accessed on 5 July 2022).
  60. KEFRI. National Tree Improvement Strategy 2018–2022; KEFRI: Muguga, Kenya, 2018. [Google Scholar]
  61. Gaaf, N.; Poels, H.; Rompaey, R. Effect of silvicultural treatment on growth and mortality of rainforest in Suriname over long periods. For. Ecol. Manag. 1999, 124, 123–135. [Google Scholar]
  62. Kagombe, J.K. Contribution of PELIS in Increasing Tree Cover and Community Livelihoods; KEFRI: Nairobi, Kenya, 2014; Available online: www.kefri.org (accessed on 5 July 2022).
  63. Gichuru, I. An Evaluation of Factors Contributing to the Success of PELIS Strategy in Forest Plantation Establishment in Mucheene Forest. Int. J. Soc. Sci. Proj. Plan. Manag. 2015, 1, 15–43. [Google Scholar]
Figure 1. Map showing the position of Londiani Forest within Kenya (and three counties of Nakuru, Baringo and Kericho).
Forests 15 00653 g001
Figure 2. Woody trees species richness in the Londiani Forest ecosystem.
Forests 15 00653 g002
Figure 3. DBH distribution classes of the tree species recorded in Londiani Forest.
Forests 15 00653 g003
Figure 4. Tree height class distribution for the three forest blocks.
Forests 15 00653 g004
Figure 5. Tree species frequency distribution of Londiani Forest.
Forests 15 00653 g005
Figure 6. Species richness distribution for saplings and seedlings.
Forests 15 00653 g006
Table 1. Species diversity and evenness with SD of trees per forest block in Londiani Forest.
Forest BlockAbundanceRichnessDiversity (H′)Evenness (H/Hmax)
Kedowa76 ± 0.0336 ± 0.51 ± 0.140.57 ± 0.1
Chebewor 71 ± 0.47 ± 0.011 ± 0.641 ± 0.32
Londiani72 ± 0.34 ± 0.210.77 ± 0.010.41 ± 0.04
Table 2. Jaccard’s similarity coefficient for the three forest blocks.
ForestJaccard’s Similarity Coefficient (S)
KedowaChebeworLondiani
Chebewor0.47
Londiani 0.35
Kedowa 0.34
Table 3. Saplings and seedlings distribution data for the three forest blocks.
Forest BlocksAbundanceRichnessDiversity H’
SaplingsSeedlingsSaplingsSeedlingsSaplingsSeedlings
Kedowa38429417222.011.62
Chebewor1823371292.892.58
Londiani174198871.641.78
Disclaimer/Publisher’s Note: The statements, opinions and data contained in all publications are solely those of the individual author(s) and contributor(s) and not of MDPI and/or the editor(s). MDPI and/or the editor(s) disclaim responsibility for any injury to people or property resulting from any ideas, methods, instructions or products referred to in the content.

