Article

Efficiency Evaluation of Forest Carbon Sinks: A Case Study of Russia

College of Economics and Management, Northeast Forestry University, Harbin 150040, China
*
Author to whom correspondence should be addressed.
Forests 2024, 15(4), 649; https://doi.org/10.3390/f15040649
Submission received: 26 February 2024 / Revised: 24 March 2024 / Accepted: 1 April 2024 / Published: 2 April 2024
(This article belongs to the Section Forest Economics, Policy, and Social Science)

Abstract

:
Forest carbon sinks in Russia are an integral part of the national “Low-carbon development strategy”. However, the influence of natural disasters and various land use policies in economic regions (ERs) raises the issue of forest carbon sink efficiency (FCSE). This study adopted a DEA-SBM model that considers undesirable outputs to measure FCSE, and the Malmquist index (MI) approach to analyze total factor productivity (TFP) of forest carbon sinks, using panel data from 2009 to 2021. The results show that the average FCSE was 0.788, with an improvement rate of 21.2%. Scale efficiency is the main factor constraining FCSE in Russia. In twelve ERs, forest carbon sinks are efficient only in the Kaliningrad and West Siberian ERs. In general, forest carbon sinks in Russia are inefficient mainly due to forest fires and other natural disturbances (82.33%); excessive logging activities (38.64%); and lack of carbon absorption capacity (31.70%). The average score of their TFP is 0.970, indicating a decline of 3% over the study period. This is primarily attributed to the decline of 1.6% in technological change. The productivity of forest carbon sinks remained static only in the Kaliningrad ER, while other economic regions performed deterioration trends. Therefore, Russia should enhance the efficiency of forest carbon sinks.

1. Introduction

Russia has nearly 20% of the world’s forests, which occupy 815 million hectares (49.8% of the total land area of the country) [1,2]. In addition to being a source of raw materials, forests are an important tool for climate change mitigation as they absorb carbon dioxide (CO2) through photosynthesis [3]. Currently, Russia ranks fifth in the world in terms of CO2 emissions [4]. Carbon sinks, which in the country consist mainly of forests, offseted about a quarter and slightly less than a third of national greenhouse gas (GHG) and CO2 emissions in 2021, respectively [5]. Russia belongs to the Annex I countries of the United Nations Framework Convention on Climate Change (UNFCCC), which signed the Kyoto Protocol [6] in 1997 and the Paris Agreement [7] in 2015. The country annually publishes national inventory reports (NIRs) containing a section on GHG emissions and removals as a result of anthropogenic activities, in particular within the “land use, land use change, and forestry” (LULUCF) sector [8]. The parties included in Annex I of the UNFCCC are required to comply with the regulations of the guidelines for national greenhouse gas inventories of the Intergovernmental Panel on Climate Change (IPCC) [9].
Since reporting is formed independently by countries and takes into account national characteristics, the evaluation results in Russia differ significantly both methodologically and from the point of view of the quality and completeness of the data used [10]. The IPCC methodology consists of different hierarchical tiers (Tiers 1, 2, 3) [11]. To prepare NIRs for IPCC, Russia applies the third (highest) methodological tier that implies that the county has a detailed state forest registry (SFR) database and its own national methodologies based on regional experimental studies [12]. Since 2011, the system of the regional assessment of forest carbon budget (ROBUL) has been applied for compiling NIRs, complying with the IPCC guidelines [13]. After the reforms of the national forest management system related to the transition to annual data within the SFR, the “stock-difference” approach was almost totally replaced by the “gain–loss” method [12]. At the same time, a number of Russian experts [14] proposed to include reserve (remote) forests in the category of “managed” (consisting of exploitational and protective forests) and include these data in NIRs [15]. According to their findings, the value of carbon stock in the biomass of the country’s forests is expected to increase by 17%, annual absorption by 13%, and the net carbon sequestration of forest biomass in total by 13%. Noteworthy, this violates the key criterion of international climate reporting, stating that only managed forests may be included in carbon accounting practices [9]. Apart from that, the remote method of data collection during forest inventory, in comparison with ground surveys, also reveals significant discrepancies in estimates of carbon stock in Russia’s forests. According to the experts [16], remote sensing data showed that, in 2014, the growing stock in Russia’s forests was 39% higher than stated in the state forest register, and carbon sequestration in live biomass between 1988 and 2014 was 47% higher than reported in the NIR. Another study [17] on the assessment of carbon stock in Russian forests between 2001 and 2021 was carried out on the basis of satellite remote sensing data, selected ground observations, and prediction models. According to their findings [18], forest carbon stock (excluding soil carbon pool) in 2021 amounted to 55.8 billion tons (in comparison with 36.6 billion tons stated in the NIR for 1990–2021 [2]). Table 1 shows various estimations of the carbon sequestration potential of Russia’s forests in the long-term perspective.
In general, the experts [12] point out that the currently applied ROBUL method is satisfactory for the estimation of carbon stocks and fluxes in managed forests of Russia. Moreover, it complies with the IPCC Guidelines and the results are comparable to other models, i.e., the carbon budget model of the Canadian forest sector (CBM-CFS3) of the Canadian Forest Service (CFS) [13,22]. Other carbon sequestration assessment techniques are not widely adopted and presented only as research alternatives that are not recognized by the experts from IPCC to become candidate solutions. However, the issue of choosing a particular method is primarily related to the accuracy and reliability of the national forest inventory on which estimations are based. According to the Accounts Chamber of the Russian Federation [23], for 2020, data for 84.4% of forests in Russia are more than 10 years out of date. Therefore, a more frequent update and quality improvement of related data is a must. In that case, the enhancement of international scientific cooperation could significantly contribute to the achievement of this goal.
Obviously, the discrepancies in the above-mentioned estimations on carbon stock and the sequestration potential of Russia’s forests seriously complicate the formation of a reliable strategy for climate change mitigation. Nonetheless, in October 2021, Russia approved its “Strategy of the socio-economic development with low greenhouse gas emissions until 2050” [20] and submitted it to the UNFCCC on 5 September 2022 as its long-term climate strategy [24]. In the strategy, Russia has set a goal to achieve carbon neutrality no later than 2060. The strategy also includes a goal to reduce GHGs by 80% below 1990 levels by 2050, relying heavily on the carbon sequestration capacity of forests, which should be more than doubled between 2030 and 2050 (from 539 million tCO2e to 1200 million tCO2e), as stated in the target (intensive) scenario [20]. According to the document, forest–climatic projects (widely known as forest carbon offset projects) should be implemented to achieve this goal [25]. As of January 2024, only seven related projects have been implemented in Russia, and only two of them were added to the national carbon credit registry [26,27,28]. At the same time, the strategy does not limit the typology of such projects. They can include projects on afforestation; reforestation; protection of forests from fires, pests and diseases; and prevention of logging and conversion of forest lands. [26,29,30,31,32]. In general, the implementation of these projects should enhance the carbon sink capacity of managed forests. Moreover, forest carbon sinks in Russia are distributed highly unevenly, and their carbon absorption capacity depends on many factors, including the area, age structure, and species composition of the forests themselves; the land use policy of regions (wood harvesting or clear cutting due to agricultural expansion); and natural disturbance volumes (namely forest fires, pests, and disease outbreaks, etc.) [33,34,35,36].
Finally, Russia should urgently comprehend the importance of the climate role of its own forests, considering the fact that the climate in the country is warming about 2.5 times faster than the global average [37]. Given the largest area of forests and that the country is responsible for fulfilling the international commitments in climate change, there is a clear need to measure the efficiency of forest carbon sinks in Russia both from temporal and spatial perspectives. Therefore, this study aims to fill this research gap and provide recommendations for enhancing forest carbon sink efficiency (FCSE) in Russia.

2. Literature Review

The research topic of efficiency evaluation in forestry mainly focuses on the optimal allocation of resources and aims to improve production efficiency. The stochastic frontier approach (SFA) and data envelopment analysis (DEA) are both commonly used methods that measure the efficiency of forestry [38,39]. Based on the non-parametric nature, DEA is widely performed in efficiency measurement of input/output indicators [40]. FCSE refers to the obtaining of maximum forest carbon sink output with the least amount of forest resources utilized. Recently, several studies have focused on the efficiency performance of forest carbon sinks. Most scholars have focused on measuring FCSE by applying DEA. Long et al. [25] conducted an FCSE evaluation of Hangzhou and found out the spatial heterogeneity among counties and cities. Xue et al. [41] observed driving forces and the convergence of FCSE in four forest regions in China. Shu et al. [42] measured the FCSE of the Natural Forest Protection Project (NFPP). The results showed that the efficiency of forest carbon sinks in the state-owned forest areas of the project was higher. Yao et al. [43] and Zhao et al. [44] conducted similar research of FCSE in China, applying the traditional DEA models. Several studies adopted SFA regression in the three-stage DEA model as an extension to test the impact of uncontrollable environmental factors on the dependent variable. Ao et al. [45] proposed a three-stage DEA model combining SFA regression for the efficiency evaluation of bamboo forests, considering their carbon sequestration capacity. Lin and Ge [46] adopted SFA to adjust regional forest carbon sinks and forestry output slacks.
Moreover, a number of studies have investigated the factors that influence FCSE. Wei and Shen [47] adopted a DEA-SBM (slack-based measure) model to evaluate the efficiency of forest carbon sinks, and explored the influence of various natural and human factors within the pressure–state–response (PSR) framework model. Liu et al. [48] included socio-economic and meteorological factors to evaluate their impact on carbon sequestration by forest vegetation. Wang et al. [49] highlighted natural endowment, forest management, and social development factors, and performed a Tobit panel regression model to investigate their influence on FCSE. Yin et al. [50] pointed out that temperature, GDP per capita, urbanization, and length of highway network have significant positive impacts, and the total imports and exports have a significant negative impact.
In summary, most of the above-mentioned studies adopted a “stock-difference” approach for calculating forest carbon sink volumes. Moreover, there is a lack of quantitative analysis of FCSE, including various undesirable outputs during the forestry production process, e.g., forest fire rates and wood harvesting volumes, that hinder the development of forest carbon sinks. Therefore, this study proposed the DEA-SBM model considering undesirable outputs and the Malmquist index technique to evaluate the efficiency of forest carbon sinks in Russia both from temporal and spatial perspectives. Firstly, due to the “gain–loss” approach performed in Russia’s NIRs, undesirable outputs are stated as “losses”, which is more appropriated for examining FCSE under the proposed model. Secondly, ignoring the undesirable outputs may lead to exaggerated efficiency scores [51]. Thirdly, it can be possible to determine which kind of forest carbon offset projects should be implemented to increase FCSE in particularly inefficient regions.

3. Research Methodology

3.1. SBM-DEA Model Considering Undesirable Outputs

Originally, the DEA method was first proposed in 1978 by Charnes, Cooper, and Rhodes [52] (CCR model) based on the concept introduced by Farrell [53]. The CCR model assumes constant returns to scale (CRS), assuming that all decision-making units (DMUs) operate at the optimal scale. Alternatively, in 1984, Banker, Charnes, and Cooper [54] proposed a variable returns to scale (VRS) model (BCC model), in which DMUs do not operate at the optimal scale. However, neither model considers input or output slacks (namely input redundancy and output deficiency) or the impact (redundancy) of undesirable outputs. Tone [55,56] proposed a more advantageous non-radial SBM model that incorporates all slack variables into the objective function to solve the slackness problem and improve the efficiency measurement considering undesirable outputs. Based on the model’s adjustments (namely slack movements), it is possible to provide some suggestions regarding inefficient DMUs becoming efficient. Given that the forest carbon sinks in Russia are affected by natural disasters, wood harvesting, and clear cutting, this study adopts a more suitable input-oriented SBM-DEA model that considers undesirable outputs. The specific model is as follows:
ρ * = m i n 1 1 I i = 1 I S i x i 0 1 + 1 R + L r = 1 R S r g y r 0 g + l = 1 L S l b y l 0 b s . t . x i 0 = j = 1 n x i j λ j + S i ,   i = 1 , , M y r 0 g = j = 1 n y r j g λ j S r g ,   r = 1 , , R y l 0 b = j = 1 n y l j b λ j + S l b ,   l = 1 , , L S j , S r g , S l b 0 ,   i , r , l ,
where ρ * is the efficiency value of forest carbon sinks of the j-th DMU; x i j , y r j g , and y l j b represent input, expected output, and undesirable output variables, respectively; S i , S r g , and S l b are the slack variables of input, expected output, and undesirable output, respectively; λ stands for the linear programming weight vector. When ρ * = 1 , it means that DMU is efficient under the condition that the slack variables of input, expected output, and undesirable output ( S i , S r g and S l b ) are all 0. If ρ * < 1 , it means that DMU has low efficiency, and the slack variables of input, expected output, and undesirable output are larger than 0. Therefore, ineffective DMUs might be input redundant, expected output deficient, or undesirable output redundant. Subsequently, Equations (2)–(4) are used to compute the relevant rates in the case of their existence.
The formula for the redundancy rate of inputs is as follows:
ϑ m 0 = x i 0 S i x i 0
The formula for the deficiency rate of expected output is as follows:
ϑ r 0 g = S r g y r 0 g y r 0 g
The formula for the redundancy rate of undesirable outputs is as follows:
ϑ l 0 b = y l 0 b S l b y l 0 b
Since the research object of this study (forest carbon sinks) is a key climate mitigation tool in the “Low-carbon development strategy” (in terms of global (national) scope), the values of TE (constant returns to scale) are selected to measure FCSE in Russia. In an input-oriented model, TE defines the ability of a DMU to produce an output using the lowest possible quantity of inputs [57,58]. Furthermore, it can be decomposed into pure technical efficiency (PTE) and scale efficiency (SE). PTE implies that all resources are being efficiently utilized and allocated during the production process. SE reflects the gap between the actual and optimal production scales based on the combination of resources. The value of each indicator is ≤1, and T E = P T E × S E . This decomposition also highlights the potential sources of inefficiency, whether they are caused by the management regime (in case of lower PTE value), disadvantageous conditions (in the case of lower SE value), or both [40,59].

3.2. Malmquist Index (MI)

Originally, the Malmquist index was developed by Sten Malmquist in 1953 [60]. Caves et al. [61] adopted this technique to measure total factor productivity (TFP), assuming the efficiency of the main productive factors, including capital, labor, land resources, and innovations. Färe et al. [62,63] decomposed TFP change into technical progress change (TC) and technical efficiency change (EC). Assuming variable returns to scale, EC can be divided into pure technical efficiency change (PEC) and scale efficiency change (SEC). Traditional DEA analysis only reflects the relative efficiency values of different DMUs in the same time period and is unable to track the changes of their efficiency over time. The Malmquist index technique improves drawbacks of the classical DEA model by measuring the dynamic changes of efficiency values both from spatial and temporal perspectives. Therefore, it provides a valuable tool for DMUs to track the improvements or deteriorations in efficiency during the whole production process. This study calculates the TFP of forest carbon sinks among DMUs in Russia by taking t period as the base period; the formula is as follows:
T F P t , t + 1 = M I t + 1 x t + 1 , y t + 1 , x t , y t = E C t , t + 1 × T C t , t + 1 = P E C t , t + 1 × S E C t , t + 1 × T C t , t + 1    = D v t + 1 x t + 1 , y t + 1 D v t x t , y t × D c t + 1 x t + 1 , y t + 1 / D v t + 1 x t + 1 , y t + 1 D c t x t , y t / D v t x t , y t     × D c t x t + 1 , y t + 1 D c t + 1 x t + 1 , y t + 1 × D c t x t , y t D c t + 1 x t , y t 1 2 ,
where x t   and x t + 1 are the input vectors of units from t to t + 1; y t and y t + 1 are output vectors of units from t to t + 1, respectively. D t x t , y t and D t + 1 x t + 1 , y t + 1 are distance functions based on t and t + 1 period, respectively. The subscript v in the above formula is the VRS assumption, and c is the CRS assumption. If the Malmquist index is greater than 1, the productivity of forest carbon sinks is improved; if the Malmquist index is less than 1, the TFP of forest carbon sinks is decreased.

3.3. Variables Selection and Data Sources

3.3.1. Efficiency Evaluation Index System of Forest Carbon Sinks in Russia

The relative efficiency of each DMU can be evaluated by considering the input and output variables. This paper uses the production approach, including the main components of the Cobb–Douglas production function (namely land, labor, and capital) as the input variables. Among them, land is measured by the area of managed forests, labor is measured by the average number of forestry employees at the end of the year, and capital is measured by the number of expenditures on delegated commitments in forestry. The expected output variables in this study are represented by the net absorption volume of carbon by managed forests. The undesirable outputs include the area of forest loss due to forest fires and other natural disturbances and deforestation area due to logging activities. Table 2 shows the proposed efficiency evaluation index system of forest carbon sinks in Russia.
The sample size in this study was selected according to the “rule of thumb”, as proposed by several researchers [64,65,66,67]. In order to maintain the discrimination power of DEA, the number of DMUs should be at least twice the number of inputs and outputs combined [58,64]. Since the more traditional division of regions in Russia into eight federal districts is inappropriate in this case, this study proposed a division into twelve economic regions (ERs) according to the classification established by the Ministry of Economic Development (Minekonomrazvitiya) [68]. The structure of ERs considers that, in 2018, the Republic of Buryatia and Zabaykalsky Krai were removed from the East Siberian ER and added to the Far Eastern ER.
Further, suitability verification of the selected input and output variables was conducted. Since one of the prerequisites of DEA is the “isotonic” relationship between input and output data, the selected variables should have a positive correlation [64]. Therefore, a Pearson correlation test was conducted to analyze this assumption for the selected data, and the results are presented in Table 3. The correlation coefficients between three input variables and three output variables are all more than 0.514. Therefore, the selected data satisfy the isotonic property for conducting the research.

3.3.2. Data Sources

Data on the area of managed forests, degradation and deforestation areas and related net absorption volumes in Russia among regions were collected from the 2009–2021 NIRs [69]. Data on the expenditures of delegated commitments in forestry were obtained from the Unified Interagency Information and Statistical System (EMISS) [70]. Data on the average number of forestry employees at the end of the year were obtained from the Federal Forestry Agency (Rosleskhoz) upon request.

4. Results and Discussion

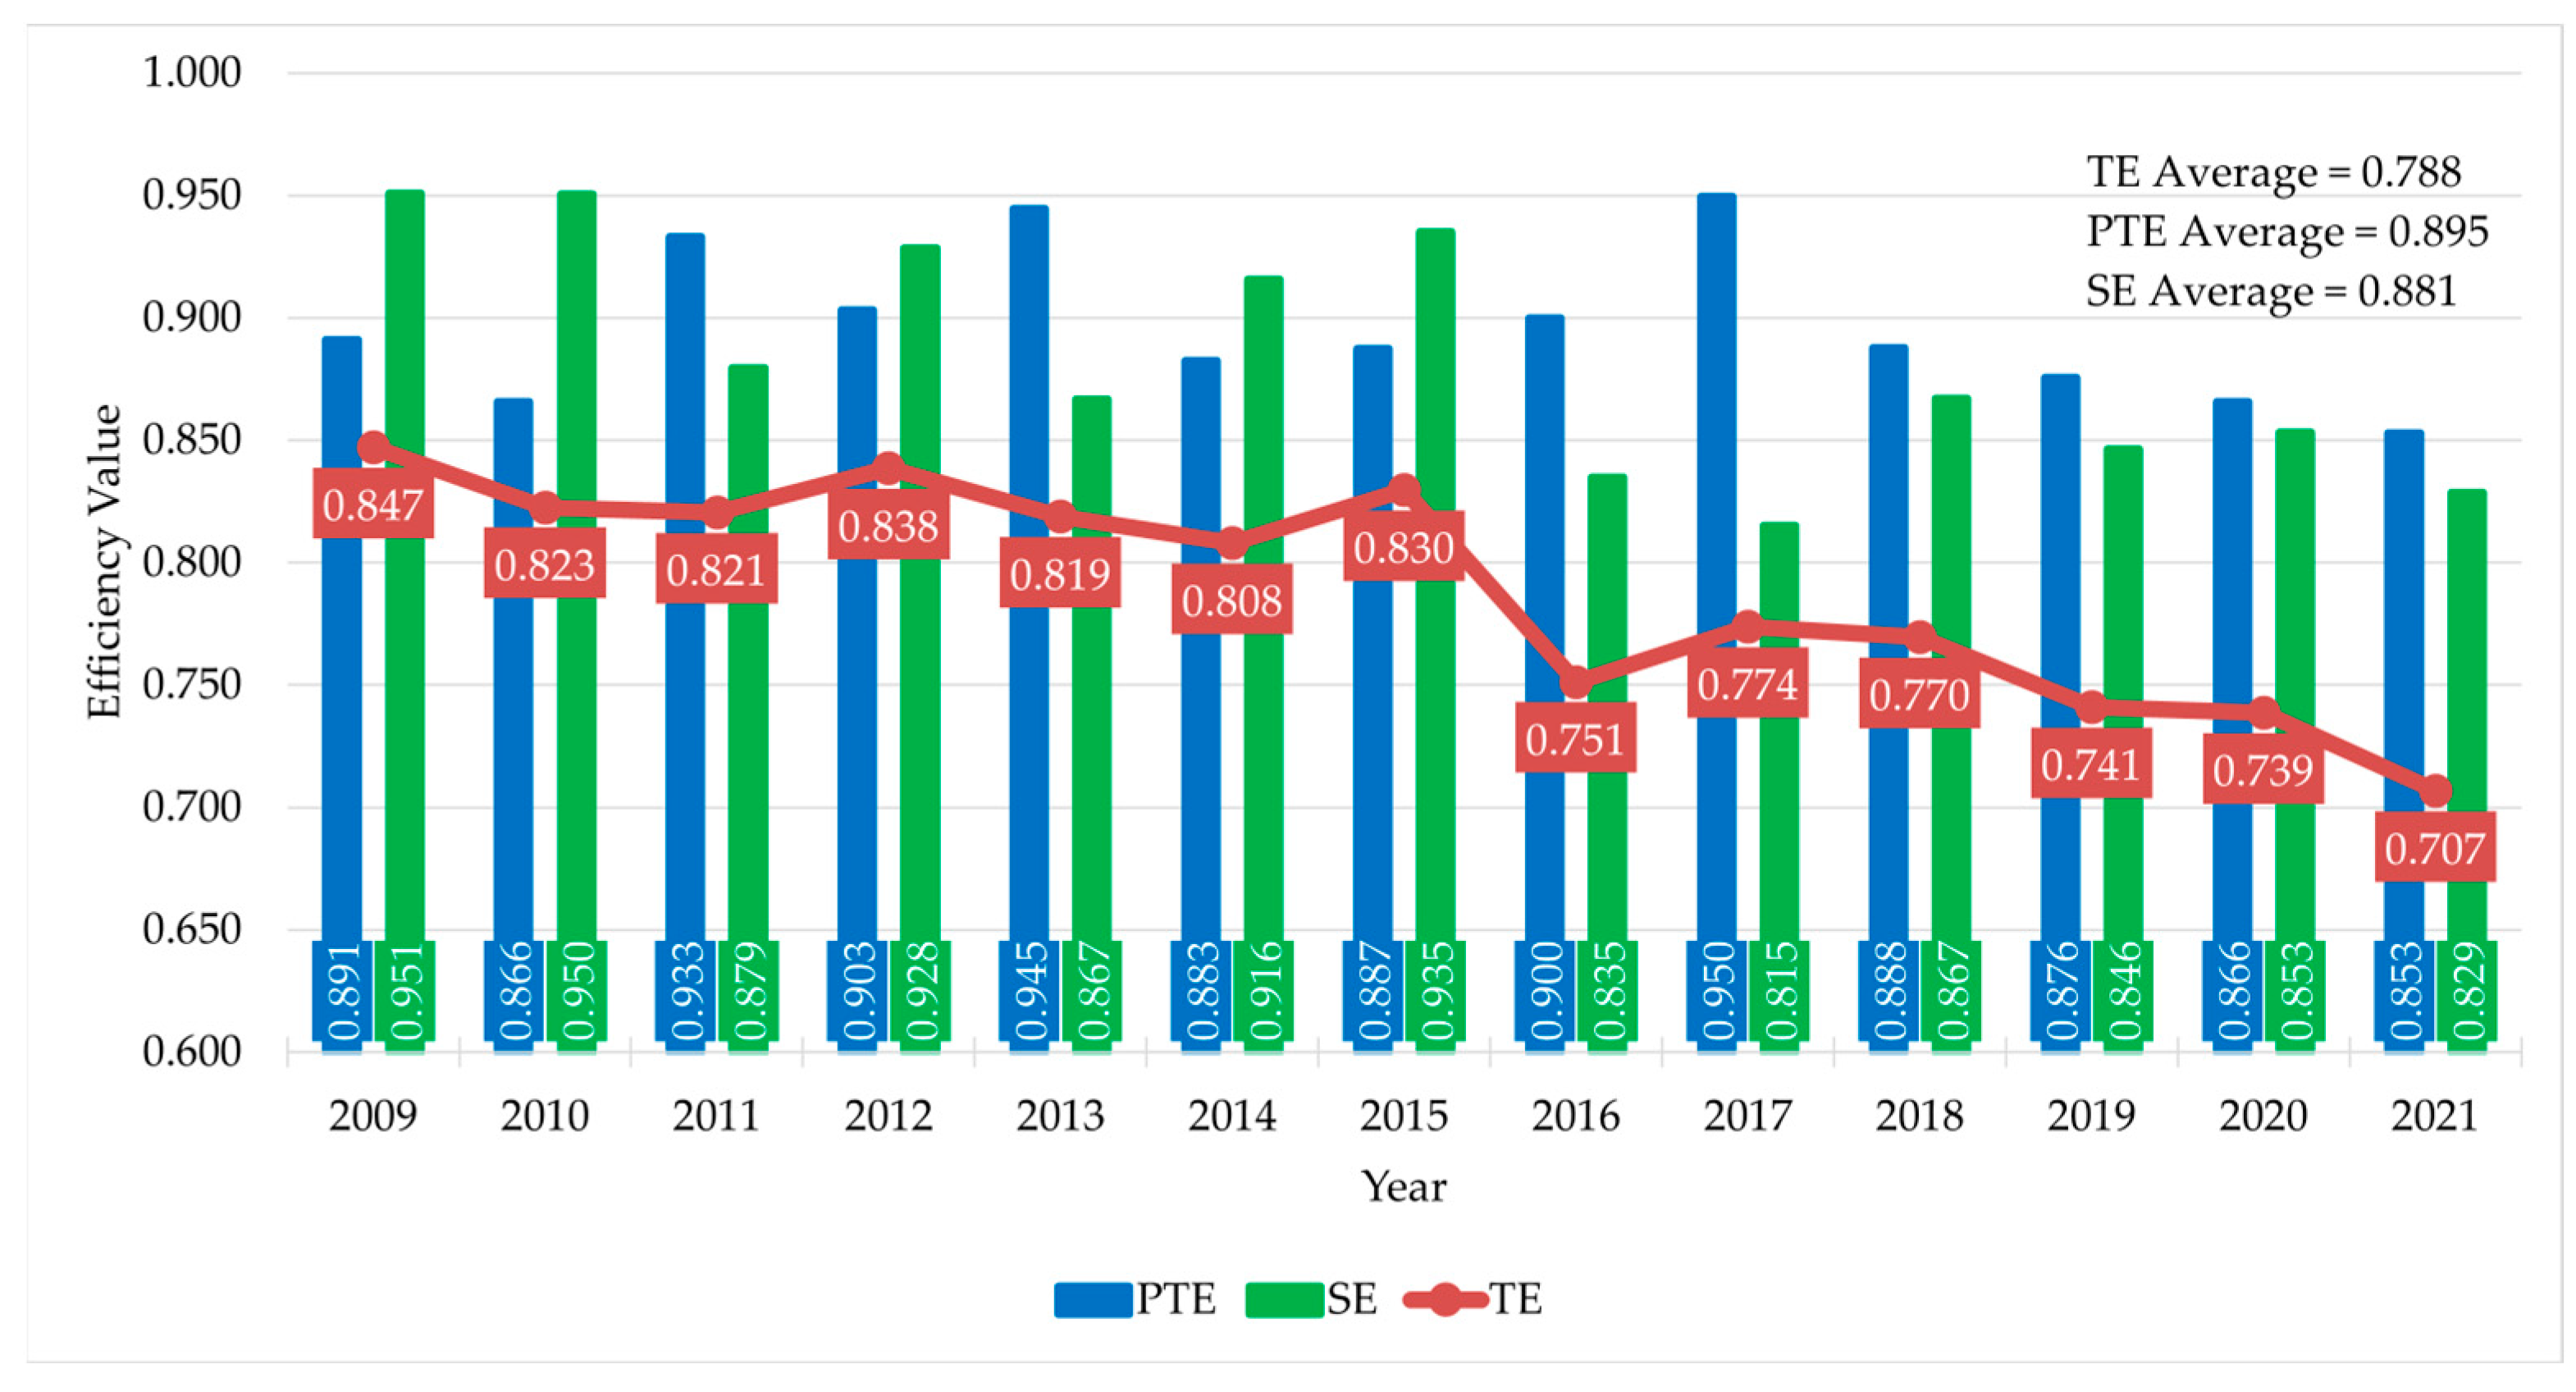
4.1. Forest Carbon Sink Efficiency (FCSE) in Russia

The efficiency of forest carbon sinks in managed forests of Russia from 2009 to 2021 was calculated using MaxDEA Ultra 8.0 software. Figure 1 and Table 4 show the average trend of FCSE in Russia and related values among ERs, respectively.
As shown in Figure 1, FCSE and its decomposition had volatile, increasing, and decreasing trend intervals for the entire study period. In general, the average value of FCSE during the study period was 0.788, accounting for the gap of 21.2% between the actual FCSE and the efficiency frontier. In 2009, this gap was 15.3%, but, in 2021, it almost doubled (29.3%). The trends of FCSE can be divided into three stages. The first stage was from 2009 to 2015, forming a “W” shape structure. The second stage was from 2015 to 2017, forming a “V” shape on the graph. The third stage, after 2017, performed a downward trend. For the entire study period, FCSE did not reach the efficiency frontier. The minimal gap between the actual FCSE and the efficiency frontier was in 2009 (15.3%), and the largest one was in 2021 (29.3%). From the perspective of FCSE decomposition, there were two periods: 2009–2015 and 2016–2021. During the first period, except for 2011 and 2013, the values of PTE were lower than the related values of scale efficiency. During the second period, SE values were lower than the values of PTE. Correlation analysis was adopted to verify the explanatory ability of PTE and SE to FCSE. The correlation coefficients of TE with PTE and SE were 0.381 and 0.826, respectively, indicating that the correlation between scale efficiency and FCSE was stronger. Therefore, SE is the main factor constraining the efficiency of forest carbon sinks in Russia. This indicates the prevailing role of adverse conditions that hinder the efficient functioning of forest carbon sinks.
Table 4 shows forest carbon sink efficiency values among economic regions in Russia. It can be seen that only two DMUs are considered to be totally efficient, including the Kaliningrad and West Siberian ERs. Therefore, the remaining DMUs are inefficient. Economic regions in Russia can be conditionally divided into two groups considering their FCSE performance. The first group consists of high-efficient DMUs with values of 0.800 and above, meaning their gap in FCSE does not exceed 20%. Therefore, except for the absolutely efficient Kaliningrad and West Siberian ERs, there are also four DMUs, namely Northwestern, Central, Volga-Vyatka, and Ural ERs, with FCSE gaps of 8.2%, 4.3%, 11.9%, and 0.7%, respectively. The second group includes the low-efficient regions in terms of forest carbon sink efficiency. Their gap in FCSE value is more than 20%. The Northern, Central Black Earth, North Caucasus, Volga, East Siberian, and Far Eastern ERs account for the gaps in FCSE value at 30.9%, 43%, 30.8%, 39.8%, 29.3%, and 35.2%, respectively.

4.2. Redundancy of Input and Undesirable Outputs

The SBM model provides the incorporation of all slack variables into the objective function and proposes the adjustments for ineffective DMUs based on the redundancy of input and undesirable outputs and the deficiency of expected outputs. If a DMU is considered to be efficient, all its slack variables are equal to 0 and the efficiency value equals 1. On the contrary, if a DMU does not meet these conditions, then it is considered inefficient. Therefore, to be transformed into efficient ones, inefficient DMUs should reduce their redundancy levels of input and undesirable outputs and the deficiency level of expected output. It was found that the employed model proposes no adjustments to optimize the deficiency of expected output. It means that FCSE in Russia is not brought by a deficiency of expected outputs but by resource inputs and undesirable outputs. Obviously, to increase the net absorption volume of forest carbon sinks, forest degradation and deforestation should be reduced, and input should be better utilized to improve FCSE. Therefore, the proposed adjustments are only focused on the redundancy of inputs and undesirable outputs. Table 5 presents the calculated rates of related slack variables and their average values for each DMU from 2009 to 2021.
If an input factor is not fully utilized during the production process, this means the existence of its redundancy. In the case of land resources, it indicates the lack of carbon absorption capacity by forests due to their mature or overmature condition. In the case of labor, it means personnel are in an idle working or underutilized state. In the case of capital, it indicates that not all expenditures are properly consumed to maintain the effective functioning of forest carbon sinks. The redundancy of undesirable outputs means an excess of adverse factors out of their permissible level.
As noted before, there are two ERs with non-redundant inputs and undesirable outputs, indicating the efficient functioning of forest carbon sinks in these regions. In general, forest carbon sinks in Russia are inefficient mainly due to forest fires and other natural disturbances (82.33%); excessive logging activities (38.64%); and lack of carbon absorption capacity (31.70%). However, the redundancy rates of inputs and undesirable outputs in FCSE among inefficient economic regions are different. The highest redundancy rate of forest land is in Northern ER, meaning that more than half (53.64%) of forests are overmature with a lack of carbon absorption capacity. Also, the rates in East Siberian (40.73%) and Far Eastern (47.36%) ERs are relatively high. The highest redundancy rates of labor are in Central Black Earth (77.99%) and Volga (74.16%) ERs, indicating that forestry personnel is either idle working or underutilized. Nearly half (52%) of the labor in North Caucasus ER is also in the related status. Noteworthy is that forestry is not the key industry in these ERs, rather it is agriculture [71]. From the perspective of capital, above 40% of expenditures are improperly consumed to maintain the effective functioning of forest carbon sinks in the Central Black Earth, Volga, and Far Eastern ERs.
Forest carbon sinks in most of the inefficient economic regions are suffering from degradation processes and deforestation activities. It is possible to highlight three groups of inefficient DMUs in order to enhance their FCSE. The first group includes Ural, East Siberian, and Far Eastern ERs. Since the labor factor has the lowest and the land resource has the highest redundancy value in the structure of inputs, these regions should reallocate part of their expenditure for combatting forest fires and other natural disasters and reduce excessive logging activities; otherwise, the carbon absorption capacity of local forests will continue to decrease. First of all, this applies to East Siberian and Far Eastern ERs. The second group consists of Northwestern, Central, Central Black Earth, Volga, and Volga-Vyatka ERs. Since the land factor has the lowest redundancy value and the labor and capital resources have the highest redundancy values in the structure of inputs, these regions should mobilize forestry personnel and related expenditures for forest degradation mitigation and clear-cutting reduction. Except for Northwestern ER, other economic regions in this group presumably neglect this policy due to agricultural expansion. The third group includes Northern and North Caucasus ERs. Forest carbon sinks in these regions deserve a specific approach. In the case of the Northern ER, logging operations should be significantly reduced. Since the predominant natural area here is tundra, the restoration and reproduction of forests is hindered [72]. In the case of the North Caucasus ER, forestry personnel should be better mobilized to mitigate forest fires, pest and disease outbreaks, and other natural disasters. In terms of favorable climate and less man-made destruction, the high growth rates of local vegetation contribute to intensive carbon absorption [33]. Moreover, the recreational significance of the local forests in natural parks and reserves must be considered [73]. The proportion of overmature trees will continue to grow, while relatively low logging volumes and mountainous terrain will lead to scarce reforestation and afforestation activities. Therefore, these features should be comprehended in order to maintain the efficient functioning of forest carbon sinks in this region.

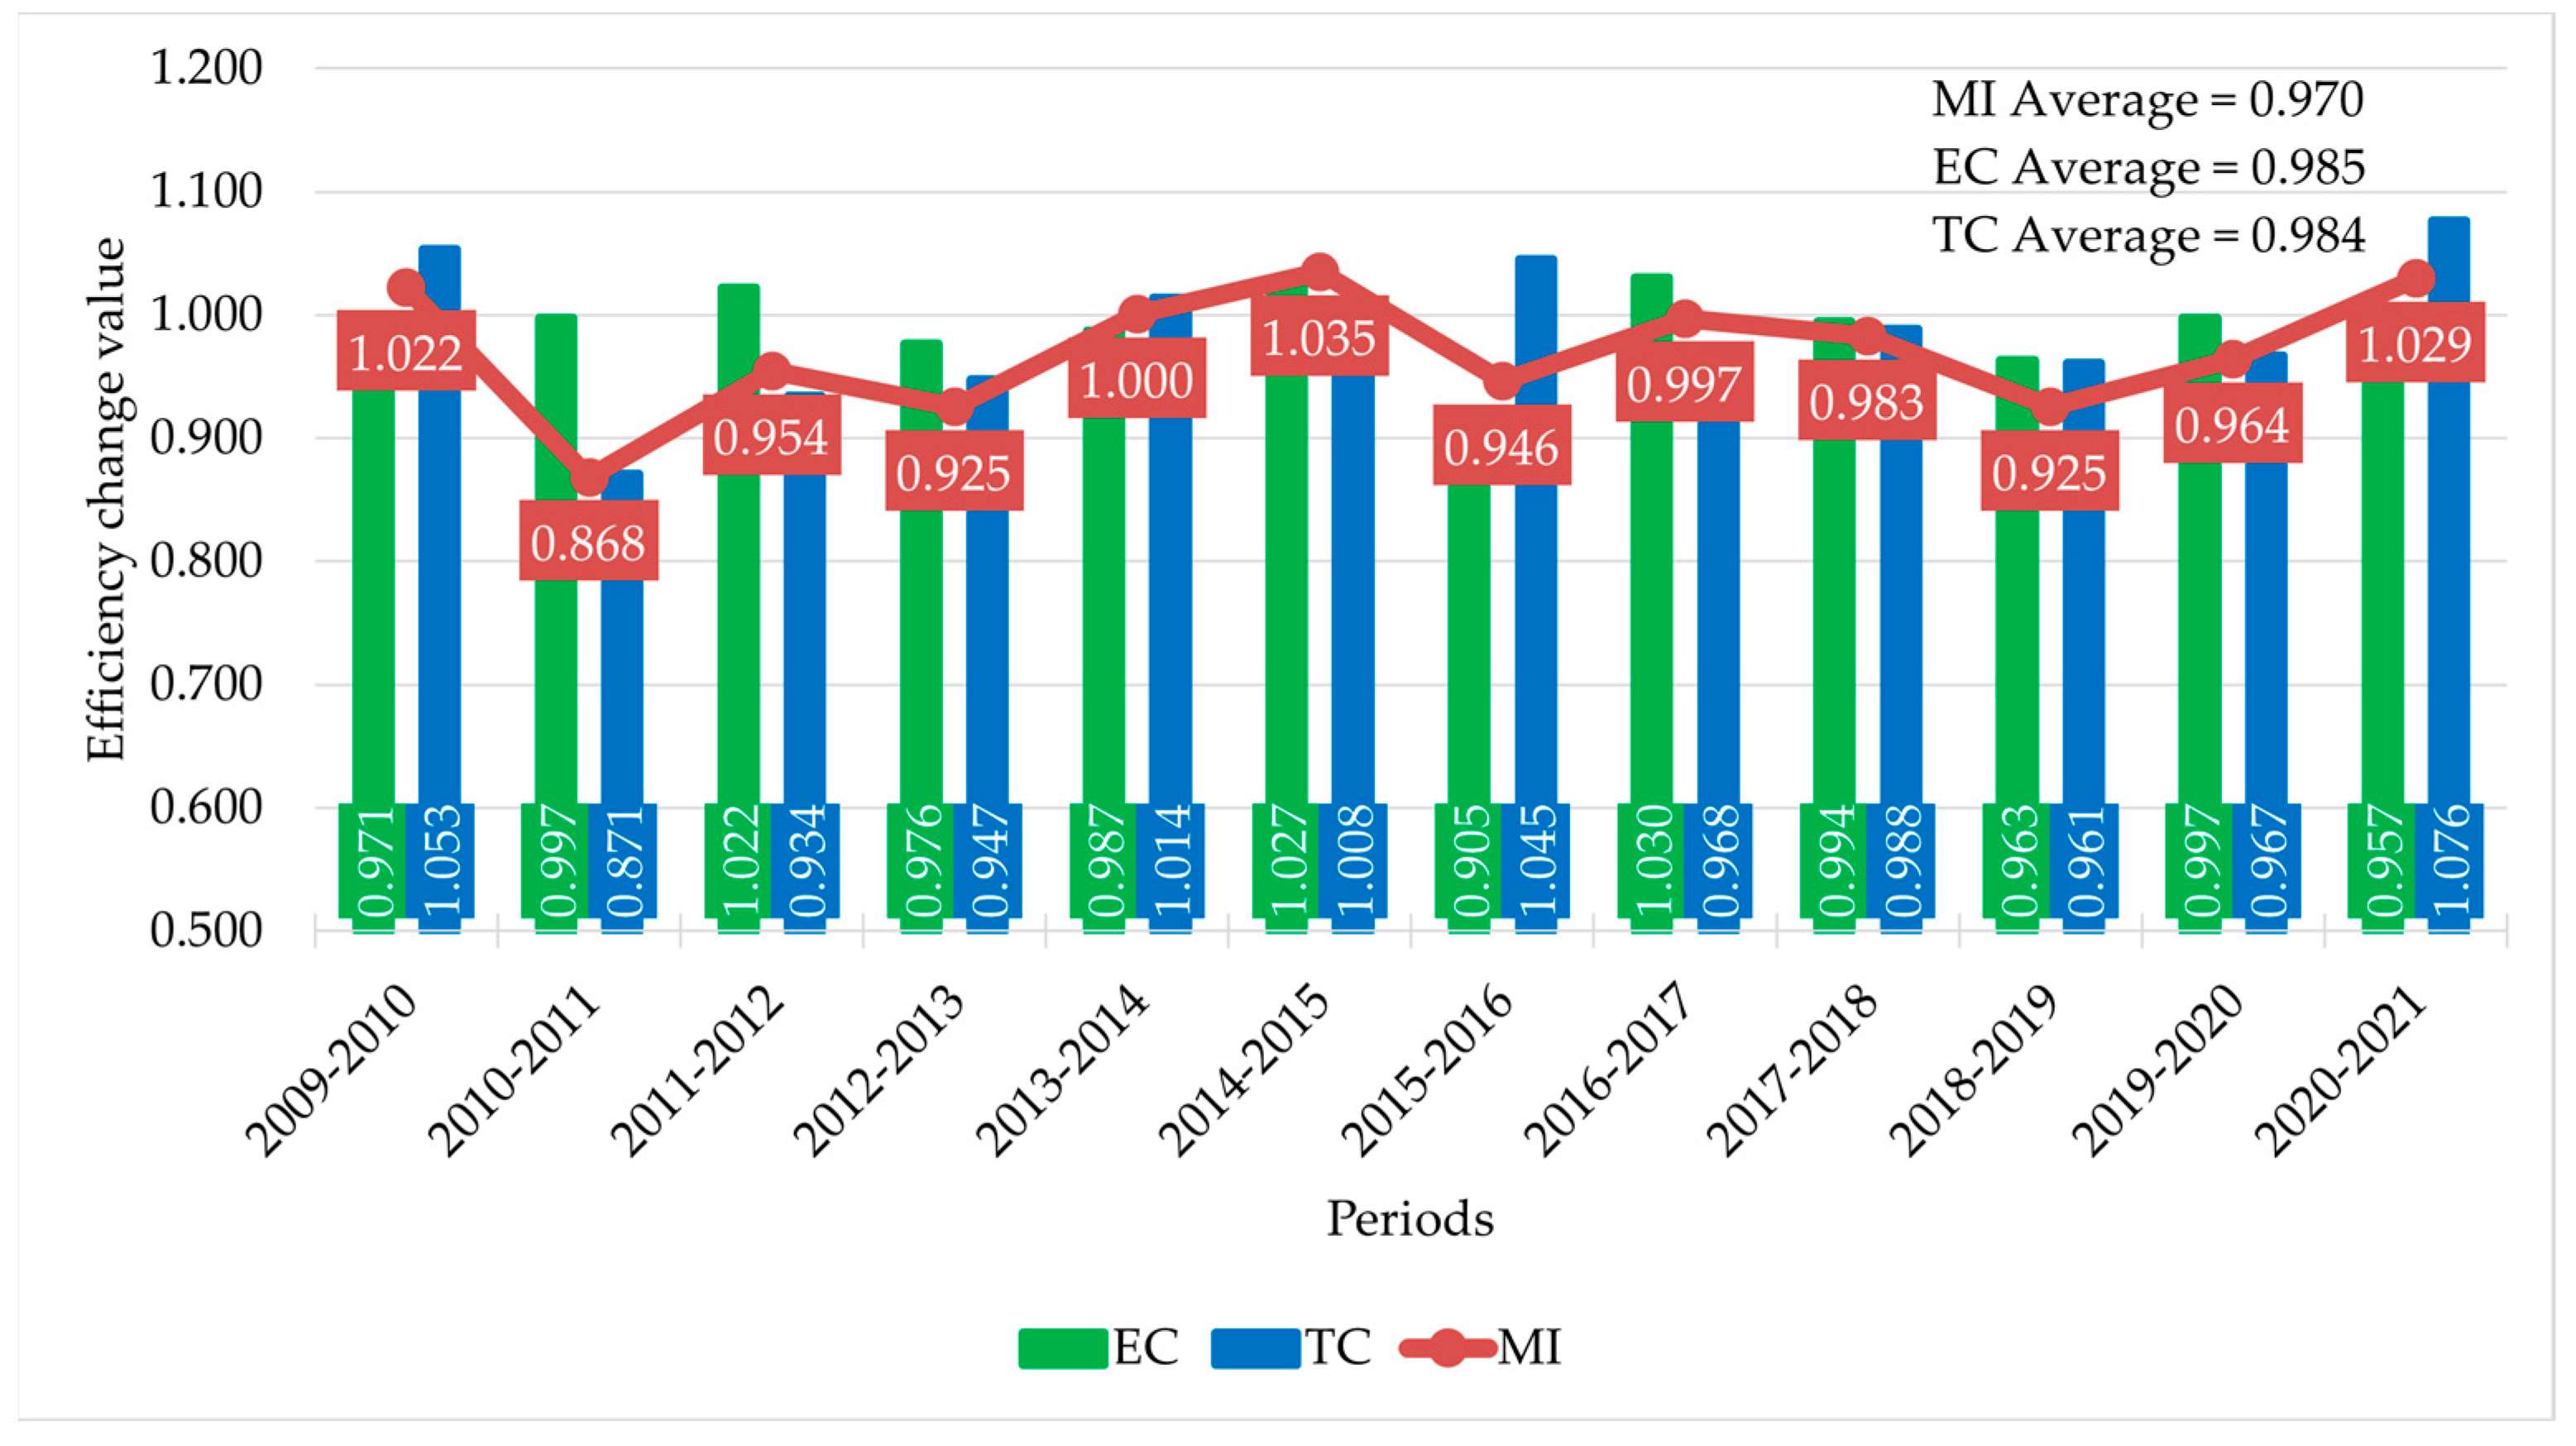
4.3. Temporal Changes in Total Factor Productivity of Forest Carbon Sinks in Russia

To further analyze the changes of FCSE in Russia, the Malmquist index technique was performed to reflect the improvements or deteriorations of total factor productivity and its decomposition. The results are presented in Figure 2.
The average Malmquist index value of forest carbon sinks in Russia was 0.970, meaning that their productivity declined by 3% during the study period. The increase in TFP occurred only three times, reaching the maximal value of 3.5% in 2015. The increment of EC also occurred only three times, with the highest value of 3% in 2017. Technical progress during the study period was revealed five times, reaching the maximal value of 7.6% in 2021. Correlation analysis was adopted to verify the explanatory ability of EC and TC to TFP value. The correlation coefficients were 0.160 and 0.786, respectively, indicating that the correlation between technical progress change and TFP was stronger. It indicates that forestry departments in Russia did not adopt modern technologies or sustainable practices for the effective functioning of forest carbon sinks. Therefore, they should establish a technological advancement policy related to forest carbon sinks and strengthen the forest management regime in order to improve their efficiency.
Further decomposition of the technical efficiency change values is presented in Table 6. During the study period, the average value of scale efficiency change was lower than the value of pure efficiency change. That means that the comprehensive efficiency change of forest carbon sinks in Russia was primarily hindered by the deterioration of 1.1% in their returns to scale, as evidenced by the high-influenced disadvantageous conditions discussed in the previous subsection. As mentioned before, the increase in EC occurred only three times. The improvement in PEC was in 2011, 2013, and 2015–2017, reaching the maximal value of 7.8% in 2011. The increase in SEC occurred in 2012, 2014–2015, 2018, and 2020, reaching the highest value of 6.4% in 2018.

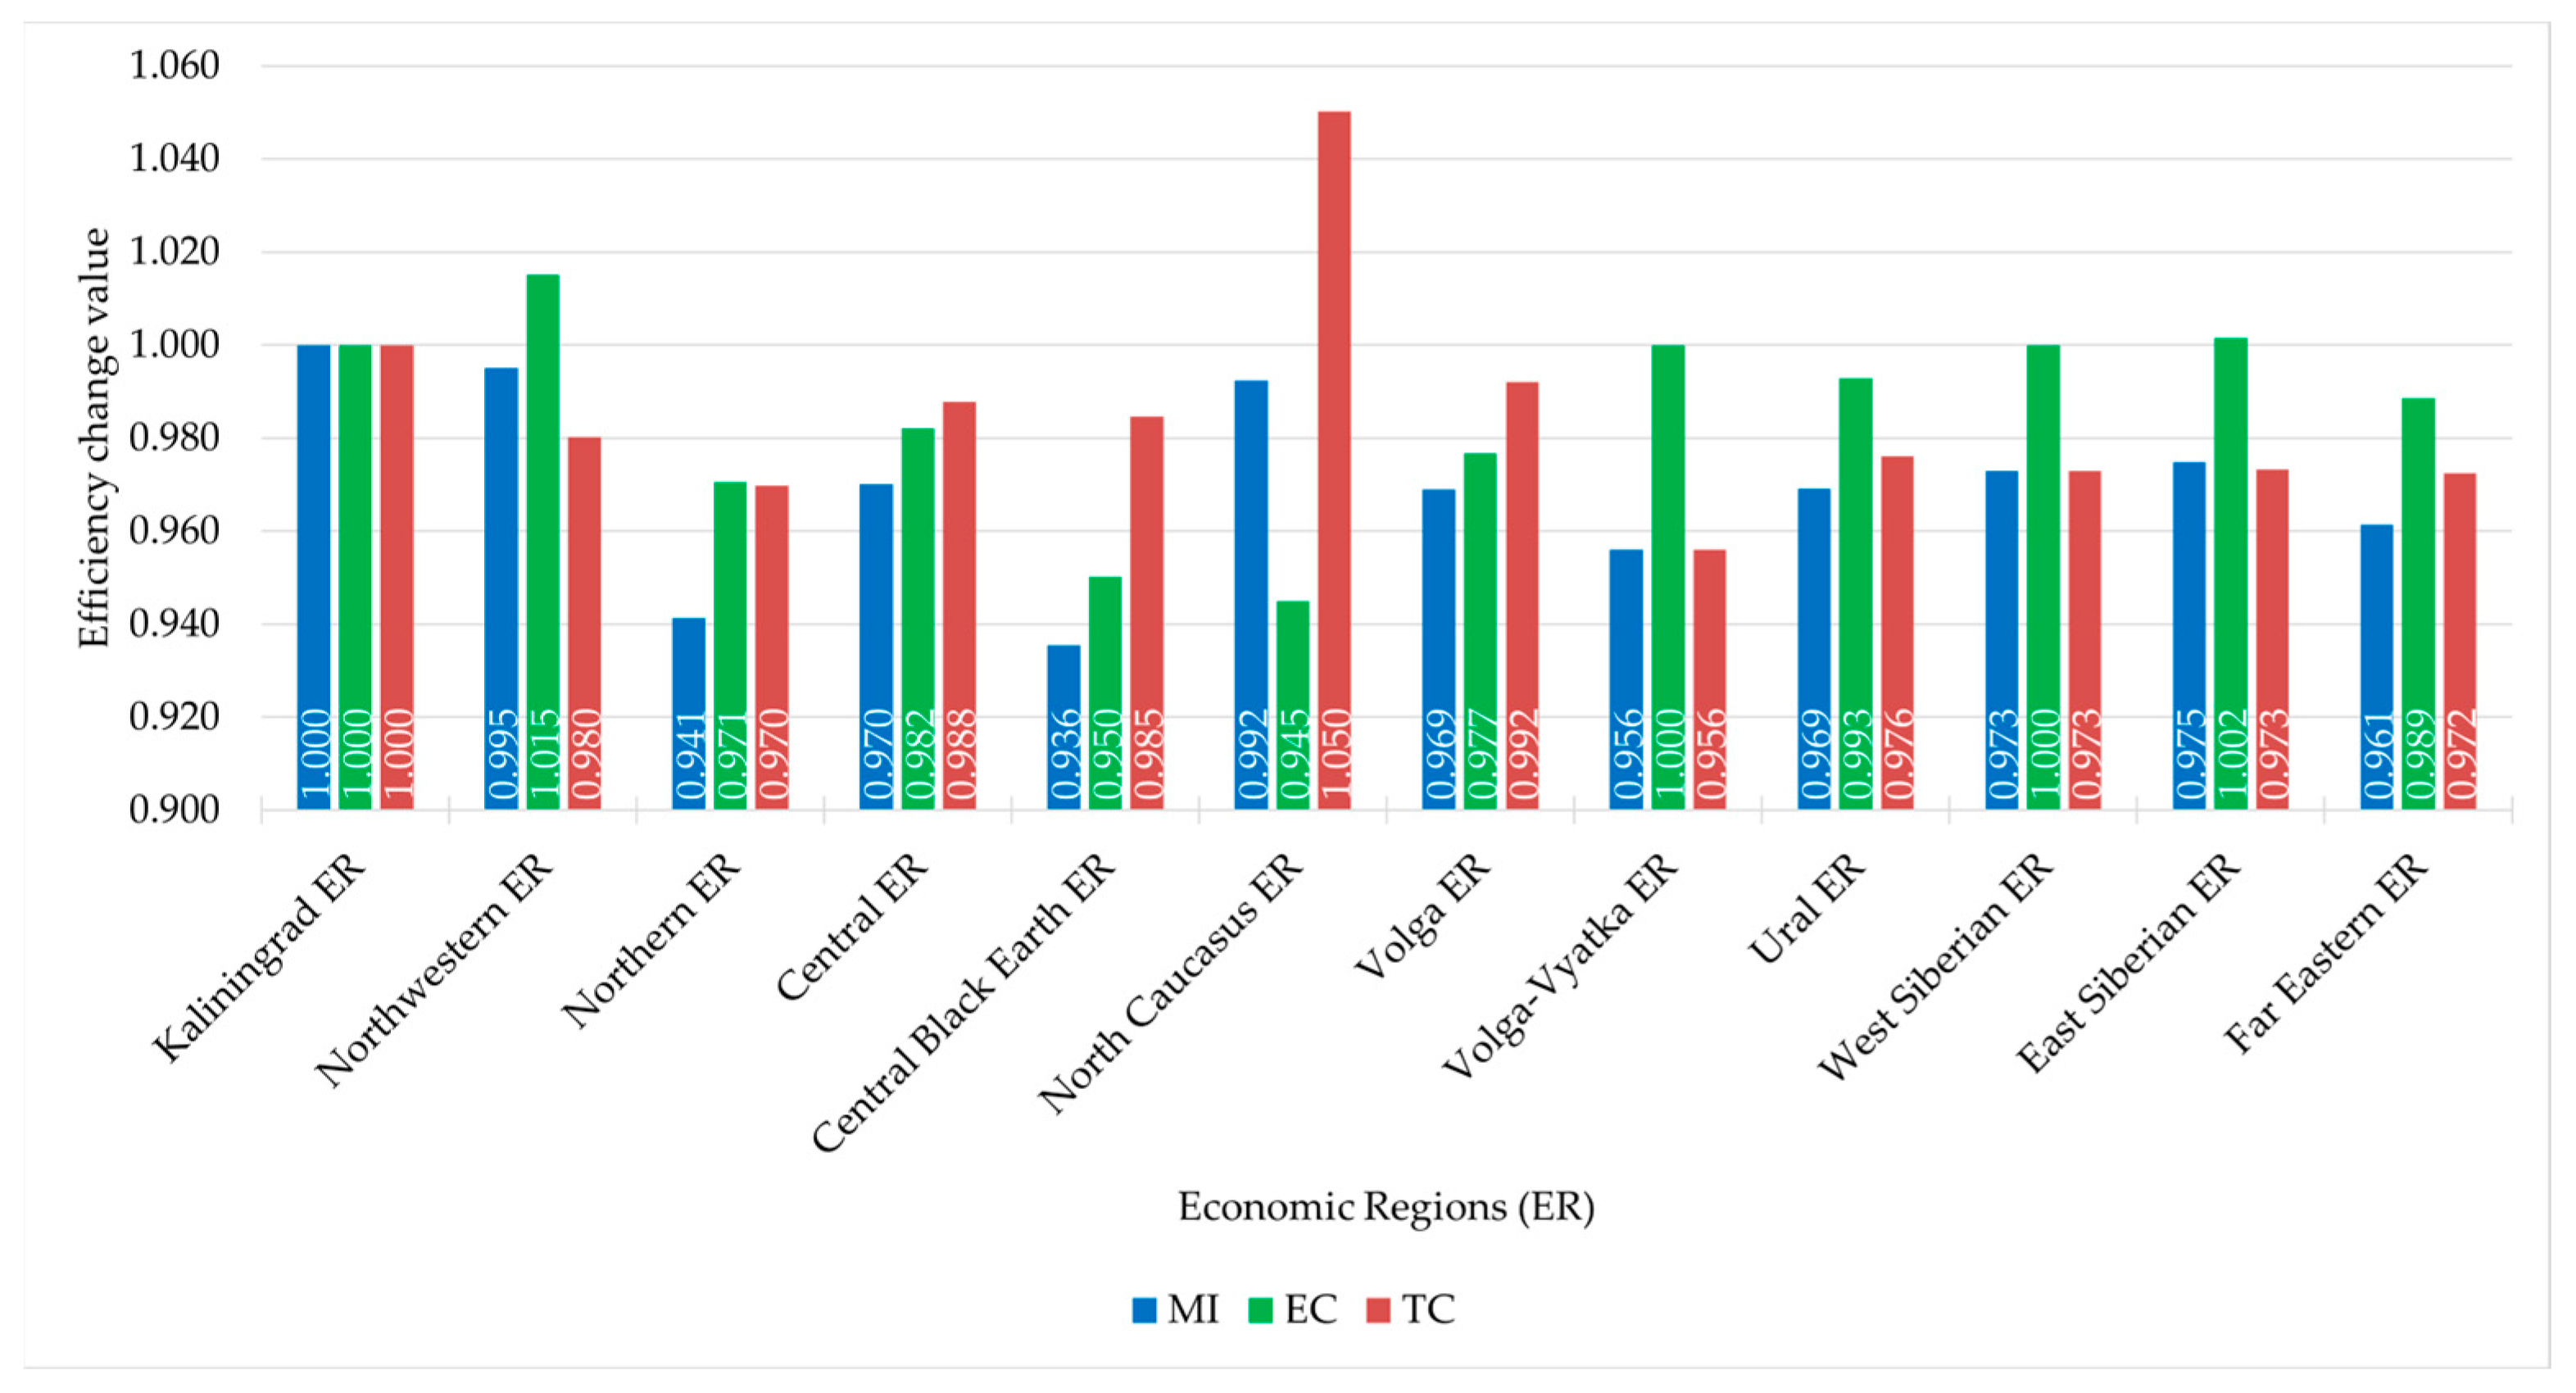
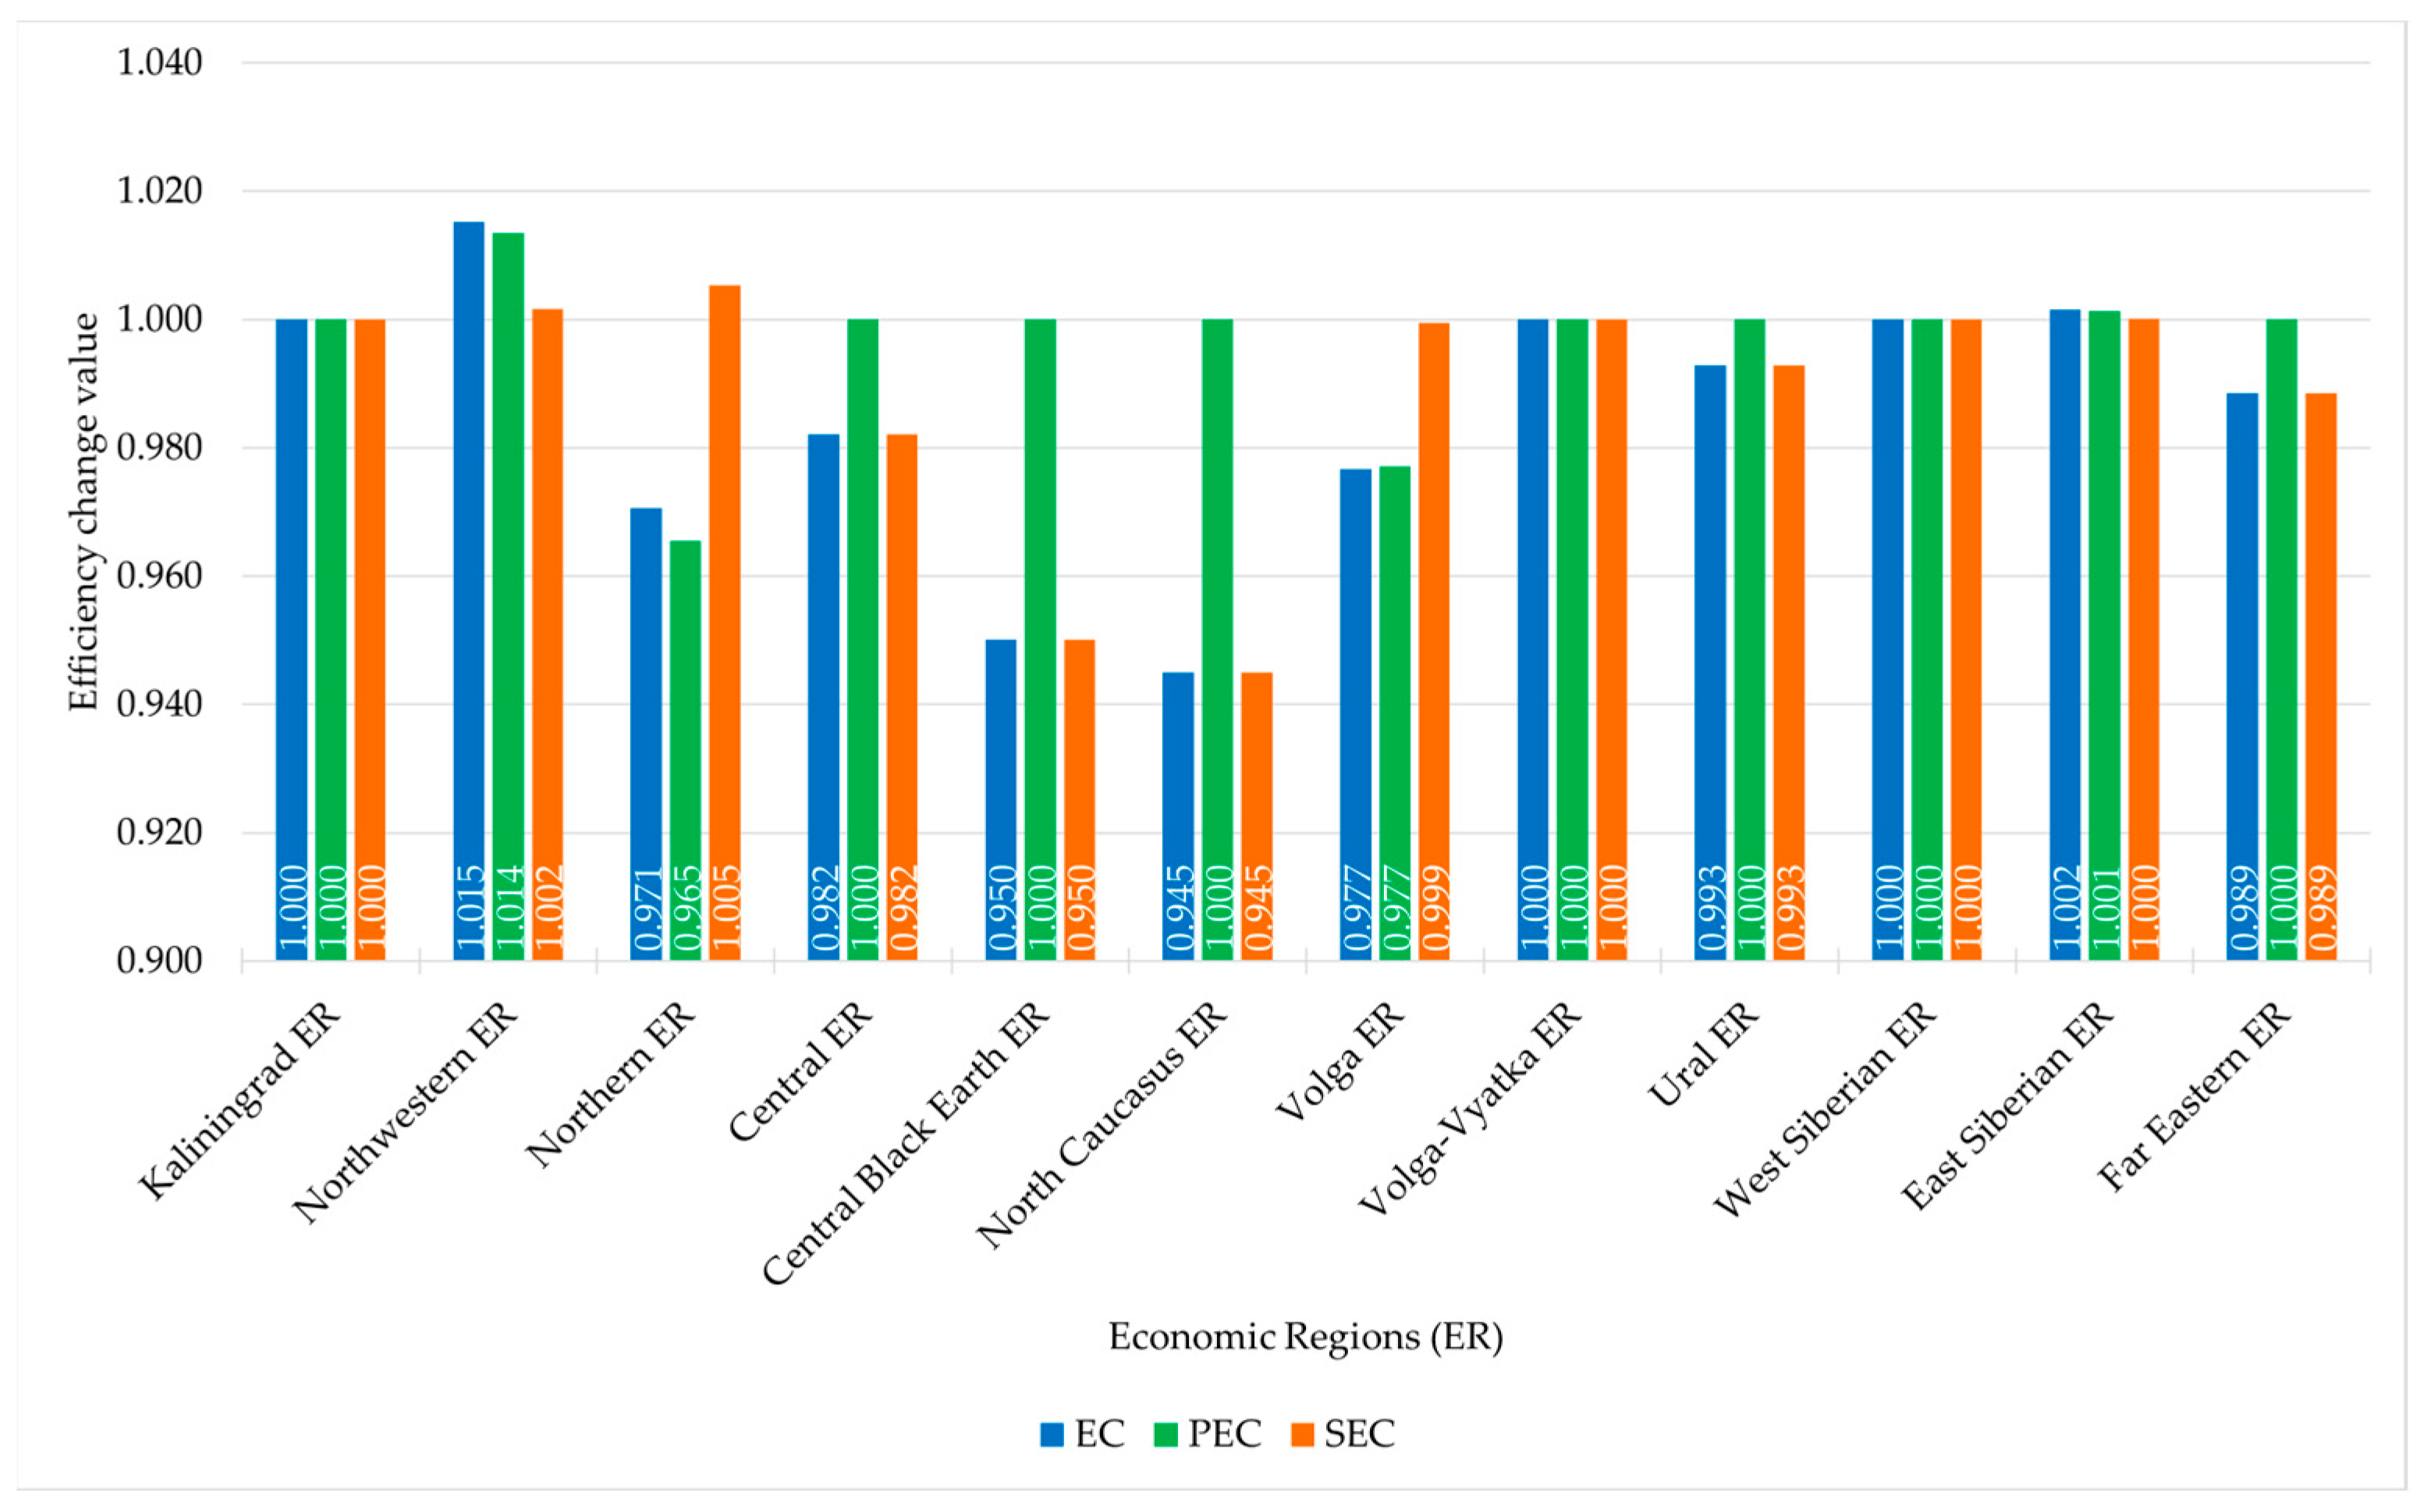
4.4. Spatial Heterogeneity in Total Factor Productivity of Forest Carbon Sinks in Russia

Since the Malmquist approach provides assessment of productivity and efficiency changes not only from a temporal but also from a spatial perspective, this subsection aims to investigate the TFP changes in forest carbon sinks across the country to determine the most effective DMUs from 2009 to 2021. Figure 3 shows the dynamic performance of forest carbon sinks among ERs in Russia valued as an average from 2009 to 2021. During the study period, their productivity remained static only in the Kaliningrad ER, while other economic regions performed a deterioration trend. Since the national average reduction rate of TFP equals 3%, DMUs can be conditionally divided into two groups. The first group contains the regions with values that do not exceed the national average deterioration. Except for Kaliningrad ER, the group consists of Northwestern, Central, North Caucasus, West Siberian, and East Siberian ERs, with rates of 0.5%, 3%, 0.8%, 2.7%, and 2.5%, respectively. The second group includes the regions with TFP reduction rates more than 3%. These are the Northern, Central Black Earth, Volga, Volga-Vyatka, Ural, and Far Eastern ERs, with deterioration rates of 5.9%, 6.4%, 3.1%, 4.4%, 3.1%, and 3.9%, respectively. During the study period, only Northwestern and East Siberian ERs performed efficiency improvement in forest carbon sinks, accounting for 1.5% and 0.2%, respectively, while Kaliningrad, Volga-Vyatka, and West Siberian ERs remained stagnant. Efficiency deterioration occurred in mostly agricultural regions (namely Central, Central Black Earth, North Caucasus, and Volga) and became the main factor, while other DMUs performed a technological decline in forest carbon sink functioning, leading to productivity reduction. This decline ranged from 2% in the Northwestern ER to 4.4% in the Volga-Vyatka ER. Technical progress emerged only in the North Caucasus ER, accounting for 5%.
Further decomposition of the technical efficiency change values is presented in Figure 4. As mentioned before, three regions, namely Kaliningrad, Volga-Vyatka, and West Siberian ERs, did not perform any efficiency improvements, therefore their PTE and SE values remained unchanged. Along with them, six DMUs (namely Central, Central Black Earth, North Caucasus, Ural, and Far Eastern ERs) kept their management regimes (PTEs) unmodified. During the study period, related improvements occurred in Northwestern ER (1.4%) and East Siberian ER (0.1%), while Northern and Volga ERs deteriorated by 3.5% and 2.3%, respectively. Therefore, these changes made a significant contribution to their performance. As stated before, deterioration in terms of scale efficiency is the main factor hindering the productivity of forest carbon sinks in Russia. In particular, the related value sufficiently decreased in the predominantly agricultural regions of Central Black Earth and North Caucasus ERs, accounting for 5% and 5.5%, respectively. Meanwhile, Central, Volga, Ural, and Far Eastern ERs decreased only by 1.8%, 0.1%, 0.7%, and 1.1%, respectively. Noteworthy, the scale efficiency increment in forest carbon sinks occurred in the Russian North, namely in Northwestern (0.2%) and Northern (0.5%) ERs. As stated in the report [37] by the Russian Federal Service for Hydrometeorology and Environmental Monitoring (Roshydromet), high warming rates occurred in these territories, presumably contributing to local forests absorbing more carbon.

5. Conclusions

Russian forests are vital to climate change mitigation and play an important role in the national “Low-carbon development strategy”. Being natural carbon sinks, they absorb atmospheric CO2 and sequester carbon. Moreover, considering the largest area, forest carbon sinks in Russia should be responsibly managed in order to achieve the goal stated in the strategy. Forests are unevenly distributed across the country, caused by the diversity of climatic zones [36]. Along with logging activities and natural disasters (in particular, wildfires), forests in the majority of regions are mature or overmature, affecting their carbon absorption capacity [34,35]. In addition, considering the different land use policies, some regions in Russia perform deforestation due to the prevailing role of agriculture. Russia’s “Low-carbon development strategy” [20] mostly relies on the implementation of forest carbon offset projects. Therefore, regional features and general performances of forest carbon sinks should be comprehended in order to introduce related projects in Russia.
This study employed an SBM-DEA model considering undesirable outputs to evaluate the efficiency of forest carbon sinks in Russia from 2009 to 2021. The results show that their average efficiency during the study period was valued at 0.788, indicating a space for improvement of 21.2%. In general, FCSE in Russia performed a downward trend and did not reach the efficiency frontier. In 2021, the related gap almost doubled in comparison with 2009. Forest carbon sinks are efficient only in two regions—the Kaliningrad and West Siberian ERs. The Central Black Earth and Volga ERs have the lowest FCSE values of 0.570 and 0.602, respectively, due to the predominant role of agriculture in terms of land use policy.
The SBM model also allowed to estimate the redundancy rates of inputs and undesirable outputs for ineffective DMUs to reveal the related adjustments. In general, forest carbon sinks in Russia are inefficient mainly due to forest fires and other natural disturbances (82.33%); excessive logging activities (38.64%); and lack of carbon absorption capacity (31.70%). Labor and capital inputs also should be better utilized. Therefore, fire protection, avoided conversion/deforestation, and improved forest management are the most demanded carbon offset projects for the forests in Russia, in general. However, local features of forest carbon sink functioning among ERs should be considered in order to implement the related projects.
The Malmquist productivity index (MI) of forest carbon sinks in Russia averaged 0.970 during the study period, reflecting a 3% decline in their productivity. Technical progress change (TC) was the main factor that hindered TFP. The decline in scale efficiency change (SEC) was the primary factor behind the technical efficiency (TE) decrease. The productivity of forest carbon sinks remained static only in Kaliningrad ER, while other economic regions performed deterioration trends. During the study period, only Northwestern and East Siberian ERs performed efficiency improvement of forest carbon sinks, accounting for 1.5% and 0.2%, respectively. The North Caucasus ER performed technical progress of forest carbon sinks, valued at 5%. Two-thirds of the regions did not modify their management regime (PTE). Only Northwestern and East Siberian ERs improved it by 1.4% and 0.1%, respectively. The scale efficiency of forest carbon sinks was slightly improved in the northern regions and significantly decreased in agricultural-related Central Black Earth and North Caucasus ERs.
Benchmarking techniques introduced in this study allowed to evaluate the performance of forest carbon sinks among different economic regions in Russia. It became possible to assess their efficiency both statically and dynamically, and from temporal and spatial perspectives. The findings of this study can be adopted by local forestry departments to develop new strategies and technological innovations to enhance the functioning of forest carbon sinks. The largest forest area in Russia lacks proper monitoring and is vulnerable to various natural disasters. In most regions, forest carbon sinks are inefficient. Therefore, the implementation of related carbon offset projects could create benefits both for their effective functioning and for their use as a valuable asset in carbon markets. Finally, several aspects of land use policy should also be considered in order to develop forest carbon sinks and launch related carbon offset projects in Russia. Firstly, regarding the growing demands of the logging industry, the possible implementation of logging restrictions can affect the related companies’ revenues. Alternatively, along with the growing share of mature and overmature forests in Russia, their carbon absorption capacity also will decline. Therefore, the increment in logging volumes can be put on the agenda. Secondly, regarding the growing demands of agriculture, since the climate in Russia is warming 2.5 times faster than the global average, agriculture, in particular in the southern regions, will increasingly face drought and the spread of pests [37,74]. Such a scenario may cause the transition of agriculture to the northern territories, which will lead to clear-cutting activities. Thirdly, regarding the implementation features of forest carbon offset projects, the fulfillment of numerous quality criteria for launching these projects (including additionality, permanence, leakage avoidance, etc.) often hinders and postpones the issuing of related credits [75,76,77]. Therefore, for Russia it is extremely important to find a balance in the national land use policy to improve the efficiency of forest carbon sinks.

Author Contributions

Conceptualization, A.V. and G.T.; methodology, A.V.; software, A.V.; validation, A.V. and G.T.; formal analysis, A.V.; investigation, A.V. and G.T.; resources, A.V.; data curation, A.V.; writing—original draft preparation, A.V.; writing—review and editing, A.V. and G.T.; visualization, A.V.; supervision, G.T.; project administration, A.V. and G.T.; funding acquisition, G.T. All authors have read and agreed to the published version of the manuscript.

Funding

This research was funded by the National Social Science Fund of China, grant number 21BGJ066.

Data Availability Statement

The sources of original data presented in the study are included in Section 3.3.2 of this article. Further inquiries can be directed to the corresponding authors.

Acknowledgments

The authors are grateful to anonymous reviewers for suggestions that improved this manuscript.

Conflicts of Interest

The authors declare no conflicts of interest.

References

  1. Food and Agriculture Organization of the United Nations (FAO). Global Forest Resources Assessment 2020. Country Report, Russian Federation; Russian Federation: Rome, Italy, 2020; p. 77. [Google Scholar]
  2. United Nations Climate Change (UNFCCC). National Report on the Cadastre of Anthropogenic Emissions from Sources and Absorptions by Sinks of Greenhouse Gases of Russian Federation Not Regulated by Montreal Protocol for 1990–2021. Part 1; UNFCCC: Moscow, Russia, 2023; p. 479. [Google Scholar]
  3. Harris, N.L.; Gibbs, D.A.; Baccini, A.; Birdsey, R.A.; De Bruin, S.; Farina, M.; Fatoyinbo, L.; Hansen, M.C.; Herold, M.; Houghton, R.A.; et al. Global Maps of Twenty-First Century Forest Carbon Fluxes. Nat. Clim. Chang. 2021, 11, 234–240. [Google Scholar] [CrossRef]
  4. Ritchie, H.; Roser, M.; Rosado, P. CO₂ and Greenhouse Gas Emissions. Available online: https://ourworldindata.org/co2-emissions (accessed on 10 July 2023).
  5. United Nations Climate Change (UNFCCC) Summary of GHG Emissions for Russian Federation. Available online: https://di.unfccc.int/ghg_profiles/annexOne/RUS/RUS_ghg_profile.pdf (accessed on 10 July 2023).
  6. United Nations Climate Change (UNFCCC) Kyoto Protocol to the United Nations Framework Convention on Climate Change. Available online: https://unfccc.int/resource/docs/convkp/kpeng.pdf (accessed on 10 July 2023).
  7. United Nations Climate Change (UNFCCC) Paris Agreement. Available online: https://unfccc.int/sites/default/files/english_paris_agreement.pdf (accessed on 10 July 2023).
  8. Kuzminyh, Y.V.; Gryaznov, S.E.; Shaitarova, O.E.; Sukonkin, S.E.; Yu Abakulina, L. Forestry Development as an Instrument for Implementing the Climate Policy of Russia. IOP Conf. Ser.Earth Environ. Sci. 2020, 574, 012044. [Google Scholar] [CrossRef]
  9. Intergovernmental Panel on Climate Change (IPCC). IPCC Guidelines for National Greenhouse Gas Inventories Volume 4 Agriculture, Forestry and Other Land Use; Institute for Global Environmental Strategies: Kanagawa, Japan, 2006. [Google Scholar]
  10. Vaganov, E.; Porfiryev, B.; Shirov, A.; Kolpakov, A.; Pyzhev, A. Assessment of the Contribution of Russian Forests to Climate Change Risk Reduction and its Impacts. In Scientific Works; The Institute of Economic Forecasting of the Russian Academy of Sciences: Moscow, Russia, 2021; pp. 7–33. [Google Scholar]
  11. Newell, J.P.; Vos, R.O. Accounting for Forest Carbon Pool Dynamics in Product Carbon Footprints: Challenges and Opportunities. Environ. Impact Assess. Rev. 2012, 37, 23–36. [Google Scholar] [CrossRef]
  12. Sorokina, D.; Ptichnikov, A.; Romanovskaya, A. Comparative analysis and assessment of methodologies applied in the Russian Federation for calculating greenhouse gas absorption by forest ecosystems. Izv. RAN 2023, 87, 1–15. [Google Scholar]
  13. Zamolodchikov, D.G.; Grabovskii, V.I.; Korovin, G.N.; Gitarskii, M.L.; Blinov, V.G.; Dmitriev, V.V.; Kurz, W.A. Carbon Budget of Managed Forests in the Russian Federation in 1990–2050: Post-Evaluation and Forecasting. Russ. Meteorol. Hydrol. 2013, 38, 701–714. [Google Scholar] [CrossRef]
  14. Filipchuk, A.; Malysheva, N.; Zolina, T.; Yugov, A.; Mironov, R. Assessing the Possible Risks of Including the Reserved Forests in National Reporting under the UN Convention on Climate Change. For. Inf. 2021, 2, 90–105. [Google Scholar] [CrossRef]
  15. Lindner, M.; Kulikova, E. Climate Change and Russian Forests: Impacts, Vulnerability and Adaptation Needs. Available online: https://rbf-ras.ru/wp-content/uploads/2021/04/RUFORCLIM_20210330_Lindner_Kulikova_.pdf (accessed on 23 October 2023).
  16. Schepaschenko, D.; Moltchanova, E.; Fedorov, S.; Karminov, V.; Ontikov, P.; Santoro, M.; See, L.; Kositsyn, V.; Shvidenko, A.; Romanovskaya, A.; et al. Russian Forest Sequesters Substantially More Carbon than Previously Reported. Sci. Rep. 2021, 11, 12825. [Google Scholar] [CrossRef] [PubMed]
  17. Center of Forest Ecology and Productivity of the Russian Academy of Sciences Dynamics of the Total Carbon Stock in the Forests of Russia, t/ha. Available online: http://carbon.cepl.rssi.ru/zapas-ygleroda/ (accessed on 10 July 2023).
  18. Russian Academy of Sciences the Carbon Stock in the Forests of Russia for the First Decades of the XXI Century Is Estimated. Available online: https://new.ras.ru/activities/news/otsenen-zapas-ugleroda-v-lesakh-rossii-za-pervye-desyatiletiya-xxi-veka/ (accessed on 10 July 2023).
  19. Vaganov, E.; Porfiryev, B.; Shirov, A.; Kolpakov, A.; Pyzhev, A. Assessment of the Contribution of Russian Forests to Climate Change Mitigation. Ekon. Reg. [Econ. Reg.] 2021, 17, 1096–1109. [Google Scholar] [CrossRef]
  20. United Nations Climate Change (UNFCCC) Strategy for the Socio-Economic Development of Russia with Low Greenhouse Gas Emissions until 2050. Available online: https://unfccc.int/sites/default/files/resource/Strategy%20of%20Socio-Economic%20Development%20of%20the%20Russian%20Federation%20with%20Low%20GHG%20Emissions%20EN.pdf (accessed on 10 July 2023).
  21. Food and Agriculture Organization of the United Nations (FAO). The Russian Federation Forest Sector: Outlook Study to 2030; FAO: Rome, Italy, 2012; ISBN 978-92-5-107309-4. [Google Scholar]
  22. Zamolodchikov, D.; Grabowsky, V.I.; Kurz, W.A. Influence of forest harvest rates on the carbon balance of Russian forests: Projective analysis using the CBM-CFS3 model. SPbNIILH Proc. 2014, 2014, 5–18. [Google Scholar]
  23. Accounts Chamber of the Russian Federation. Verification of the Effectiveness of the Organization of Work and Expenditure of Funds for Forest Management Allocated from the Budgets of the Budgetary System of the Russian Federation and Other Sources in 2015–2019; Accounts Chamber of the Russian Federation: Moscow, Russia, 2020; p. 40. [Google Scholar]
  24. Climate Action Tracker Russian Federation. Net Zero Targets. Available online: https://climateactiontracker.org/countries/russian-federation/net-zero-targets/ (accessed on 10 July 2023).
  25. Long, F.; Shen, Y.; Wu, W.; Qi, H.; Zhu, Z.; Zhang, Z. Measurement and optimum design of carbon sequestration efficiency of regional forestland use process. Trans. Chin. Soc. Agric. Eng. 2013, 29, 251–261. [Google Scholar] [CrossRef]
  26. Gordeeva, Y.M.; Vedernikova, I.E. Forest Carbon Offsets in Russia: Current Legal Infrastructure. Theor. Appl. Ecol. 2022, 2, 209–215. [Google Scholar] [CrossRef]
  27. TASS The First Forest Climate Project Was Registered in the Register of Carbon Units. Available online: https://tass.ru/ekonomika/18687409 (accessed on 20 January 2024).
  28. RUSAL RUSAL’s Forest Climate Project Is Registered in the Register of Carbon Units. Available online: https://rusal.ru/press-center/press-releases/lesnoy-klimaticheskiy-proekt-rusala-zaregistrirovan-v-reestre-uglerodnykh-edinits/ (accessed on 20 January 2024).
  29. Korotkov, V. Forest-climatic Projects, Their Carbon Reduction Potential, Advantages and Disadvantages. Available online: https://climate-change.moscow/article/lesoklimaticheskie-proekty-ih-uglerodnyy-potencial-preimushchestva-i-nedostatki (accessed on 10 July 2023).
  30. Korotkov, V.N. Forest Climate Projects in Russia: Limitations and Opportunities. Russ. J. Ecosyst. Ecol. 2022, 7, 7. [Google Scholar] [CrossRef]
  31. Ivanova, A. Economic Assessment of the Carbon Sequestration Potential of Plantation Forests. IOP Conf. Ser.Earth Environ. Sci. 2021, 875, 012013. [Google Scholar] [CrossRef]
  32. Kuznetsov, M.; Stetsenko, A.; Nikishova, M. Prospects for Investing in Forest Climate Projects in Russia. Econ. Policy 2022, 17, 26–53. [Google Scholar] [CrossRef]
  33. Zamolodchikov, D.G.; Grabowsky, V.I.; Chestnykh, O.V. Dynamic Pattern of Carbon Balance in the Forests of Federal Districts of the Russian Federation. For. Sci. Issues 2019, 2, 1–19. [Google Scholar] [CrossRef]
  34. Loboda, T.V.; Chen, D. Spatial Distribution of Young Forests and Carbon Fluxes within Recent Disturbances in Russia. Glob. Chang. Biol. 2017, 23, 138–153. [Google Scholar] [CrossRef]
  35. Leskinen, P.; Lindner, M.; Verkerk, P.J.; Nabuurs, G.-J.; Brusselen, J.V.; Kulikova, E.; Hassegawa, M.; Lerink, B. Russian Forests and Climate Change; What Science Can Tell Us; European Forest Inst: Joensuu, Finland, 2020; ISBN 978-952-5980-99-8. [Google Scholar]
  36. Food and Agriculture Organization of the United Nations (FAO). The State of the World’s Forest Genetic Resources: Country Report The Russian Federation; The State of the World’s Forest Genetic Resources: Rome, Italy, 2014; p. 194. [Google Scholar]
  37. Federal Service for Hydrometeorology and Environmental Monitoring (Roshydromet). Third Assessment Report on Climate Changes and Their Consequences on the Territory of the Russian Federation; Federal Service for Hydrometeorology and Environmental Monitoring (Roshydromet): St. Petersburg, Russia, 2022; p. 126. [Google Scholar]
  38. Strange, N.; Bogetoft, P.; Aalmo, G.O.; Talbot, B.; Holt, A.H.; Astrup, R. Applications of DEA and SFA in Benchmarking Studies in Forestry: State-of-the-Art and Future Directions. Int. J. For. Eng. 2021, 32, 87–96. [Google Scholar] [CrossRef]
  39. Yu, C.; Li, M. The Evaluation and Spatial Differentiation of Forestry Efficiency in Sichuan Province--Based on DEA-MI Model. In Proceedings of the 2017 2nd International Conference on Advances in Materials, Mechatronics and Civil Engineering (ICAMMCE 2017), Guangzhou, China, 23–24 July 2016; Atlantis Press: Guangzhou, China, 2017; Volume 121, pp. 172–177. [Google Scholar]
  40. Huguenin, J.-M. Data Envelopment Analysis (DEA): A Pedagogical Guide for Decision Makers in the Public Sector; Cahier de l’IDHEAP; Institut de hautes études en administration publique: Lausanne, France, 2012; Volume 276, ISBN 978-2-940390-54-0. [Google Scholar]
  41. Xue, L.; Luo, X.; Wu, X. Carbon sequestration efficiency in four major forest areas in China: Measurement, drivers and convergence. J. Nat. Resour. 2016, 31, 1351–1363. [Google Scholar] [CrossRef]
  42. Shu, M.; Wu, J.; Li, C.; Ding, S. Analysis on the evolution of forest carbon sinks efficiency in Natural Forest Protection Project regions. Is. For. Econ. 2022, 42, 490–497. [Google Scholar] [CrossRef]
  43. Yao, R.; Bian, W.; Fan, H.; Guan, J. Analysis on the evolution of provincial forest carbon sequestration efficiency in China. Is. For. Econ. 2021, 41, 51–59. [Google Scholar] [CrossRef]
  44. Zhao, S.; Shi, W.; Qiao, F.; An, Y.; Wang, W.; Zhang, G. Dynamic Analysis and Trend Forecast of China’s Forestry Carbon Sink Benefits Based on Dual Carbon Targets. Res. Sq. 2023. in review. [Google Scholar]
  45. Ao, G.; Wu, W.; Cao, X.; Liu, Q. Analysis on production efficiency of carbon sink bamboo forest based on three-stage DEA model: Evidence from Zhejiang Anji. J. Agr. For. Econ. Manag. 2019, 18, 656–666. [Google Scholar] [CrossRef]
  46. Lin, B.; Ge, J. Carbon Sinks and Output of China’s Forestry Sector: An Ecological Economic Development Perspective. Sci. Total Environ. 2019, 655, 1169–1180. [Google Scholar] [CrossRef]
  47. Wei, J.; Shen, M. Analysis of the Efficiency of Forest Carbon Sinks and Its Influencing Factors—Evidence from China. Sustainability 2022, 14, 11155. [Google Scholar] [CrossRef]
  48. Liu, S.; Liu, X.; Ding, Z.; Yao, S. Impact of the Management Scale on the Technical Efficiency of Forest Vegetation Carbon Sequestration: A Case Study of State-Owned Forestry Enterprises in Northeast China. Remote Sens. 2022, 14, 5528. [Google Scholar] [CrossRef]
  49. Wang, J.; Shi, K.; Hu, M. Measurement of Forest Carbon Sink Efficiency and Its Influencing Factors Empirical Evidence from China. Forests 2022, 13, 1909. [Google Scholar] [CrossRef]
  50. Yin, S.; Gong, Z.; Gu, L.; Deng, Y.; Niu, Y. Driving Forces of the Efficiency of Forest Carbon Sequestration Production: Spatial Panel Data from the National Forest Inventory in China. J. Clean. Prod. 2022, 330, 129776. [Google Scholar] [CrossRef]
  51. Limaei, S.M. Efficiency Analysis of Forest Management Units Considering Economics and Carbon Dynamic: A Data Envelopment Analysis (DEA) Approach. Austrian J. For. Sci. 2021, 137, 199–222. [Google Scholar]
  52. Charnes, A.; Cooper, W.W.; Rhodes, E. Measuring the Efficiency of Decision Making Units. Eur. J. Oper. Res. 1978, 2, 429–444. [Google Scholar] [CrossRef]
  53. Farrell, M.J. The Measurement of Productive Efficiency. J. R. Stat. Society. Ser. A 1957, 120, 253. [Google Scholar] [CrossRef]
  54. Banker, R.D.; Charnes, A.; Cooper, W.W. Some Models for Estimating Technical and Scale Inefficiencies in Data Envelopment Analysis. Manag. Sci. 1984, 30, 1078–1092. [Google Scholar] [CrossRef]
  55. Tone, K. A Slacks-Based Measure of Efficiency in Data Envelopment Analysis. Eur. J. Oper. Res. 2001, 130, 498–509. [Google Scholar] [CrossRef]
  56. Tone, K. Dealing with Undesirable Outputs in DEA: A Slacks-Based Measure (SBM) Approach. In Proceedings of the North American Productivity Workshop 2004, Toronto, Canada, 23–25 June 2004; pp. 44–45. [Google Scholar]
  57. Coelli, T.; Rao, D.S.P.; Battese, G.E. An Introduction to Efficiency and Productivity Analysis; Springer US: Boston, MA, USA, 1998; ISBN 978-0-7923-8062-7. [Google Scholar]
  58. Cook, W.D.; Tone, K.; Zhu, J. Data Envelopment Analysis: Prior to Choosing a Model. Omega 2014, 44, 1–4. [Google Scholar] [CrossRef]
  59. Lissitsa, A.; Babiéceva, T. The Data Envelopment Analysis (DEA) for Determining the Efficiency of a Production; Institute of Agricultural Development in Central and Eastern Europe (IAMO): Halle, Germany, 2003; p. 38. [Google Scholar]
  60. Malmquist, S. Index Numbers and Indifference Surfaces. Trab. De Estad. 1953, 4, 209–242. [Google Scholar] [CrossRef]
  61. Caves, D.W.; Christensen, L.R.; Diewert, W.E. The Economic Theory of Index Numbers and the Measurement of Input, Output, and Productivity. Econometrica 1982, 50, 1393. [Google Scholar] [CrossRef]
  62. Färe, R.; Grosskopf, S.; Norris, M.; Zhang, Z. Productivity Growth, Technical Progress, and Efficiency Change in Industrialized Countries. Am. Econ. Rev. 1994, 84, 66–83. [Google Scholar]
  63. Färe, R.; Grosskopf, S.; Lovell, C.A.K. Production Frontiers, 1st ed.; Cambridge University Press: Cambridg, UK, 1993; ISBN 978-0-521-42033-4. [Google Scholar]
  64. Golany, B.; Roll, Y. An Application Procedure for DEA. Omega 1989, 17, 237–250. [Google Scholar] [CrossRef]
  65. Banker, R.D.; Charnes, A.; Cooper, W.W.; Swarts, J.; Thomas, D. An Introduction to Data Envelopment Analysis with Some of Its Models and Their Uses. Res. Gov. Nonprofit Acc. 1989, 5, 125–163. [Google Scholar]
  66. Friedman, L.; Sinuany-Stern, Z. Combining Ranking Scales and Selecting Variables in the DEA Context: The Case of Industrial Branches. Comput. Oper. Res. 1998, 25, 781–791. [Google Scholar] [CrossRef]
  67. Dyson, R.G.; Allen, R.; Camanho, A.S.; Podinovski, V.V.; Sarrico, C.S.; Shale, E.A. Pitfalls and Protocols in DEA. Eur. J. Oper. Res. 2001, 132, 245–259. [Google Scholar] [CrossRef]
  68. Ministry of Economic Development (Minekonomrazvitiya) Russian Classification of Economic Regions. Available online: https://gostbank.metaltorg.ru/data/norms_/jk/7.pdf (accessed on 11 February 2024).
  69. United Nations Climate Change (UNFCCC) National Inventory Submissions. Available online: https://unfccc.int/ghg-inventories-annex-i-parties/2023 (accessed on 23 October 2023).
  70. Unified Interagency Information and Statistical System (UIISS) Expenses for the implementation of delegated commitments of the Russian Federation in the field of forestry relations. Available online: https://www.fedstat.ru/indicator/37923 (accessed on 23 October 2023).
  71. Minaev, V.N. The role of agroholdings in the development of the economies of the regions of Russia. Sci. Bull. South. Inst. Manag. 2018, 2, 74–81. [Google Scholar] [CrossRef]
  72. Roslesinforg Roslesinforge Told Where the Oldest Trees in Russia Grow. Available online: https://roslesinforg.ru/news/in-the-media/v-roslesinforge-rasskazali-gde-rastut-samye-starye-derevya-rossii/ (accessed on 14 February 2024).
  73. Kulakova, E. Forest Plantations of the Foothills of the North Caucasus and Their Environmental and Economic Assessment. IOP Conf. Ser.Earth Environ. Sci. 2019, 392, 012013. [Google Scholar] [CrossRef]
  74. Cook, E.R.; Solomina, O.; Matskovsky, V.; Cook, B.I.; Agafonov, L.; Berdnikova, A.; Dolgova, E.; Karpukhin, A.; Knysh, N.; Kulakova, M.; et al. The European Russia Drought Atlas (1400–2016 CE). Clim. Dyn. 2020, 54, 2317–2335. [Google Scholar] [CrossRef]
  75. Pietracci, B.; Bull, G.; Zerriffi, H.; Kerr, S. Editorial: Forest Carbon Credits as a Nature-Based Solution to Climate Change? Front. For. Glob. Chang. 2023, 6, 1243380. [Google Scholar] [CrossRef]
  76. Van Der Gaast, W.; Sikkema, R.; Vohrer, M. The Contribution of Forest Carbon Credit Projects to Addressing the Climate Change Challenge. Clim. Policy 2018, 18, 42–48. [Google Scholar] [CrossRef]
  77. Vilkov, A.; Tian, G. Blockchain’s Scope and Purpose in Carbon Markets: A Systematic Literature Review. Sustainability 2023, 15, 8495. [Google Scholar] [CrossRef]
Figure 1. Average trend of forest carbon sink efficiency in Russia from 2009 to 2021.
Forests 15 00649 g001
Figure 2. Total factor productivity and efficiency changes of forest carbon sinks in Russia from 2009 to 2021.
Forests 15 00649 g002
Figure 3. Average total factor productivity and efficiency changes of forest carbon sinks among economic regions in Russia from 2009 to 2021.
Forests 15 00649 g003
Figure 4. Average technical efficiency changes and their decomposition values in forest carbon sinks among economic regions of Russia from 2009 to 2021.
Forests 15 00649 g004
Table 1. Estimates of changes in carbon sequestration potential of Russia’s forests in the long-term perspective (% for the projection period). Adapted from Vaganov et al. [10].
Projection Period (Years)Drivers of ChangeReference
2010–20302010–20352010–2050
−30…−52−50…−68−65…−83Increased logging [13]
−3…−13−20…−40−33…−60Increased logging [19]
n.d.−15…−20n.d.Increased logging, fire protection
−57…−62n.d.−58…−72Increased logging, strengthening forest protection, reducing timber losses during logging, accounting for regrowth forests on abandoned agricultural lands [20]
+7…+10n.d.n.d.Increased logging, reduced forest damage, increased forest area[21]
Table 2. Efficiency evaluation index system of forest carbon sinks in Russia.
Indicator LayerVariableContent of MeasurementUnits
InputLandArea of managed forests including shrubs1000 ha
LaborAverage number of forestry employees at the end of the yearPeople
CapitalExpenditures on delegated commitments in forestry1000 rubles
Expected OutputNet absorption
volume
Net balance of total carbon absorption by managed forests and carbon released due to clear cutting and forest degradation factors1000 tC
Undesirable OutputsDegradationForest degradation area due to forest fires and other disturbances1000 ha
DeforestationDeforestation area due to clear cutting and wood harvesting activities1000 ha
Table 3. Pearson correlation test between input and output variables.
LandLaborCapitalNet Absorption VolumeDegradationDeforestation
Land1
Labor0.6641
Capital0.8020.8181
Net absorption volume0.8720.7960.7721
Degradation0.8800.5140.7240.6421
Deforestation0.8770.6700.7960.7950.6421
Note: all Pearson correlations are significant at the 0.01 level (2-tailed).
Table 4. Forest carbon sink efficiency among economic regions in Russia from 2009 to 2021.
Economic Region (ER)2009201020112012201320142015201620172018201920202021Average
Kaliningrad ER1.0001.0001.0001.0001.0001.0001.0001.0001.0001.0001.0001.0001.0001.000
Northwestern ER0.8351.0001.0001.0000.8170.8000.8240.8910.8251.0001.0001.0001.0000.918
Northern ER0.6560.6140.7631.0001.0001.0001.0000.5850.6780.5380.5440.5020.4580.691
Central ER1.0001.0001.0001.0000.9470.8770.8451.0001.0001.0001.0001.0000.8060.957
Central Black Earth ER1.0001.0000.4950.4960.5530.4180.4390.5180.5420.5650.5550.5630.5410.570
North Caucasus ER1.0000.6661.0001.0000.5341.0001.0000.5500.5570.5610.5060.5290.5070.692
Volga ER0.6680.5710.5830.6300.6660.6360.6080.6820.6470.6090.5310.5230.5030.602
Volga-Vyatka ER1.0001.0001.0000.8400.8020.6950.6790.7410.8131.0001.0001.0001.0000.881
Ural ER1.0001.0001.0001.0001.0001.0001.0001.0001.0001.0001.0001.0000.9180.993
West Siberian ER1.0001.0001.0001.0001.0001.0001.0001.0001.0001.0001.0001.0001.0001.000
East Siberian ER0.6110.6400.7400.6860.7420.8230.8430.7080.7870.7210.6580.6540.6230.707
Far Eastern ER0.6110.6420.5710.6711.0000.7241.0000.6090.6600.5760.5130.5160.5320.648
National average0.8470.8230.8210.8380.8190.8080.8300.7510.7740.7700.7410.7390.7070.788
Table 5. Average redundancy rates of inputs and undesirable outputs of forest carbon sink efficiency in Russia among economic regions from 2009 to 2021.
Economic Region (ER)FCSE ValueSlack Variables
Redundancy Rates of InputsDeficiency Rate of Expected Output Redundancy Rates of Undesirable Outputs
LandLaborCapitalNet Absorption VolumeDegradationDeforestation
Kaliningrad Economic Region1.0000.00%0.00%0.00%0.00%0.00%0.00%
Northwestern Economic Region0.9181.52%12.51%11.32%0.00%18.18%8.30%
Northern Economic Region0.69153.64%17.36%25.19%0.00%0.00%55.93%
Central Economic Region0.9570.00%7.69%5.80%0.00%18.91%10.25%
Central Black Earth Economic Region0.57011.55%77.99%44.55%0.00%59.07%63.00%
North Caucasus Economic Region0.69220.54%52.00%25.46%0.00%60.35%8.44%
Volga Economic Region0.6024.51%74.16%43.20%0.00%75.93%51.38%
Volga-Vyatka Economic Region0.8815.13%10.25%21.45%0.00%43.69%27.83%
Ural Economic Region0.9931.98%0.00%0.13%0.00%4.51%4.11%
West Siberian Economic Region1.0000.00%0.00%0.00%0.00%0.00%0.00%
East Siberian Economic Region0.70740.73%21.30%27.39%0.00%81.68%65.04%
Far Eastern Economic Region0.64847.36%18.99%41.04%0.00%91.62%49.41%
National average0.78831.70%21.26%21.52%0.00%82.33%38.64%
Table 6. Technical efficiency changes and their decomposition values in forest carbon sinks of Russia from 2009 to 2021.
Time PeriodECPECSEC
2009–20100.9710.9720.999
2010–20110.9971.0780.925
2011–20121.0220.9681.056
2012–20130.9761.0460.934
2013–20140.9870.9341.056
2014–20151.0271.0061.021
2015–20160.9051.0140.893
2016–20171.0301.0550.976
2017–20180.9940.9351.064
2018–20190.9630.9860.976
2019–20200.9970.9891.008
2020–20210.9570.9850.971
National average0.9850.9960.989
Note: EC stands for technical efficiency change; PEC stands for pure technical efficiency change; SEC stands for scale efficiency change.
Disclaimer/Publisher’s Note: The statements, opinions and data contained in all publications are solely those of the individual author(s) and contributor(s) and not of MDPI and/or the editor(s). MDPI and/or the editor(s) disclaim responsibility for any injury to people or property resulting from any ideas, methods, instructions or products referred to in the content.

