Article

Tree Diameter at Breast Height Extraction Based on Mobile Laser Scanning Point Cloud

1
College of Information Science and Technology, Shihezi University, Shihezi 832002, China
2
Geospatial Information Engineering Research Center, Xinjiang Production and Construction Crops, Shihezi 832002, China
3
Xinjiang Production and Construction Corps Industrial Technology Research Institute, Shihezi 832002, China
4
School of Geophysics and Geomatics, China University of Geosciences, Wuhan 430074, China
*
Author to whom correspondence should be addressed.
Forests 2024, 15(4), 590; https://doi.org/10.3390/f15040590
Submission received: 7 February 2024 / Revised: 17 March 2024 / Accepted: 22 March 2024 / Published: 25 March 2024
(This article belongs to the Section Forest Inventory, Modeling and Remote Sensing)

Abstract

:
The traditional measurement method (e.g., field survey) of tree diameter circumference often has high labor costs and is time-consuming. Mobile laser scanning (MLS) is a powerful tool for measuring forest diameter at breast height (DBH). However, the accuracy of point cloud registration seriously affects the results of DBH measurements. To address this issue, this paper proposes a new method for extracting tree DBH parameters; it achieves the purpose of efficient and accurate extraction of tree DBH by point cloud filtering, single-tree instance segmentation, and least squares circle fitting. Firstly, the point cloud data of the plantation forest samples were obtained by a self-constructed unmanned vehicle-mounted mobile laser scanning system, and the ground point cloud was removed using cloth simulation filtering (CSF). Secondly, fast Euclidean clustering (FEC) was employed to segment the single-tree instances, and the point cloud slices at breast height were extracted based on the point sets of single-tree instances, which were then fitted in two dimensions using the horizontally projected point cloud slices. Finally, a circle fitting algorithm based on intensity weighted least squares (IWLS) was proposed to solve the optimal circle model based on 2D point cloud slices, to minimize the impact of misaligned point clouds on DBH measures. The results showed that the mean absolute error (MAE) of the IWLS method was 2.41 cm, the root mean square error (RMSE) was 2.81 cm, and the relative accuracy was 89.77%. Compared with the random sample consensus (RANSAC) algorithm and ordinary least squares (OLS), the MAE was reduced by 36.45% and 9.14%, the RMSE was reduced by 40.90% and 12.26%, and the relative accuracy was improved by 8.99% and 1.63%, respectively. The R2 value of the fitted curve of the IWLS method was the closest to 1, with the highest goodness of fit and a significant linear correlation with the true value. The proposed intensity weighted least squares circle-fitting DBH extraction method can effectively improve the DBH extraction accuracy of mobile laser scanning point cloud data and reduce the influence of poorly aligned point clouds on DBH fitting.

1. Introduction

Forests are an important component of global carbon stocks and are critical to climate change and ecological balance [1]. The diameter at breast height (DBH) is the diameter of a forest tree at breast height (usually 1.3 m above the ground) [2] and is one of the most important measurement factors in forest resource surveys. DBH provides basic data for forest management, forest resources surveys and carbon cycle modelling, and it is of great significance for obtaining DBH data quickly in forest ecosystem monitoring.
With the advancement of remote sensing technology, the extraction of forest structural parameters using optical and light detection and ranging (LiDAR) data has become a research hotspot. Optical remote sensing techniques can establish the correlation between forest structural parameters and spectral information [3,4,5,6] but are affected by the shading of the forest canopy, making it difficult to obtain complete vertical structural information [7,8]. In contrast, LiDAR technology can penetrate the forest canopy and measure the vertical and horizontal structure of the forest [9], providing more accurate data. Airborne laser scanning (ALS) has been widely used to obtain information on tree height, stand density, and depression [10,11]; however, it is unable to provide detailed structural information under the canopy due to the shading problem caused by the dense canopy. Although unmanned aerial vehicle-based laser scanning (ULS) has a higher resolution and penetration capability, which is suitable for fine forest resource investigation [12,13], it is still affected by canopy shading and does not perform well in sub-canopy parameter extraction [14,15], which is not applicable to the study of DBH extraction.
With the development of understory laser scanning technology, the extraction of understory structure information has become more mature. Terrestrial laser scanning (TLS) for static work can obtain high-quality point cloud data with millimeter-level accuracy; it was first used for tree DBH extraction, and many scholars have already investigated how to efficiently and accurately extract DBH, tree height, and other structural parameters using TLS data [16,17,18]. The limitations of TLS are its measurement efficiency and data integrity. Mobile laser scanning (MLS), as an alternative technology to TLS, has been applied to the 3D mapping of forest environments since 2013 [19] and has already demonstrated application advantages and development potential for plot-level forest resource surveys and assessments [20,21,22]. Compared to TLS, MLS data acquisition is more efficient, and the occlusion effect is low, resulting in a higher tree detection rate in MLS point clouds. The results of Gollob et al. [23] showed that under the condition of a tree DBH threshold of 5 cm, the tree detection rate of MLS was 96%, while that of TLS was 78.5%. MLS systems typically achieve precise positioning and orientation through the Global Navigation Satellite System (GNSS) and inertial measurement unit (IMU). New MLS systems also employ simultaneous localization and mapping (SLAM) techniques [24,25] to address GNSS access under the canopy. Although MLS acquires more complete point cloud data compared to TLS, it does not have a significant DBH extraction accuracy advantage [26]. SLAM-based MLS acquires point cloud data with a low accuracy (of centimeter level) and significantly higher noise [27]. MLS utilizes an IMU to compute the sensor’s positional information at different timestamps for real-time data collection and point cloud alignment. However, the drift characteristics of IMU result in errors accumulating over time, and although the SLAM algorithm can deal with drift-induced errors [28], the inaccuracy in the computation of the coordinate transformation matrices is unavoidable, which may lead to incorrect point cloud splicing [29]. Mis-splicing of the point cloud produces poorly aligned point cloud segments and mixed point noise data, which are the main errors during DBH extraction.
Several studies have pointed out that poorly aligned point cloud segments and mixed point noise data in MLS affect the accuracy of DBH extraction [28,29,30] and that general point cloud preprocessing algorithms have difficulty in removing this type of low-quality point. Annular neighboring points distribution analysis (ANPDA) [28] and stem surface node (SSN) [31] have been proposed as preprocessing methods for DBH extraction, aiming to minimize the effect of poorly aligned point clouds on the DBH extraction. ANPDA identifies outliers by iteratively removing the outermost points and analyzing the distribution of neighboring points, using relative entropy to determine the termination criterion. SSN converts horizontally projected points from Cartesian coordinates to polar coordinates and groups them based on polar angles to identify stem surface nodes. The surface nodes are then used to extract the DBH, replacing the use of the entire 2D projected point cloud in traditional methods. Moreover, there are also methods to enhance the accuracy of tree DBH extraction via MLS with the help of point cloud intensity information [30]. To the best of our knowledge, there is still a lack of methods for estimating the DBH without additional processing operations based on the conventional automated DBH extraction framework, which effectively reduces the effects of poorly aligned point cloud segments and mixed point noise data.
In summary, to improve the accuracy of MLS DBH extraction, this paper presents an improved method for tree DBH extraction based on the least squares method. The main research work of this paper is as follows: (1) An unmanned vehicle-mounted laser scanning system was constructed to realize the acquisition of understory structure information. (2) Combined with the least squares method to introduce the point cloud intensity information, an intensity-weighted least squares method is proposed to extract the tree DBH and to reduce the influence of poorly aligned point clouds on the DBH extraction.

2. Materials and Methods

2.1. Materials

2.1.1. Study Area

The study area was located in the woodland of a plantation forest in West Park, Shihezi City, Xinjiang Uygur Autonomous Region, China (44°17′49″ N, 86°1′17″ E), as shown in Figure 1. Shihezi City is located in the middle of the northern foothills of the Tianshan Mountains and the southern edge of the Junggar Basin, with a typical temperate continental arid climate characterized by severe cold in winter, scorching heat in summer, and drought with little rain. The average annual temperature is 11.2 °C, the annual sunshine duration is 2721–2818 h, the frost-free period is 168–171 d, the annual precipitation is 180–270 mm, and the evaporation is 1000–1500 mm. Four sample plots in the West Park of Shihezi City were selected for the study, with a total of 204 trees, the species of which were Pinus sylvestris var. mongholica Litv, Phellodendron amurense Rupr, Ulmus pumila L., and Betula platyphylla Sukaczev, with an average DBH of 27.83 cm, a minimum DBH of 11.53 cm, and a maximum DBH of 89.49 cm. The information of the sample plots is shown in Table 1.

2.1.2. Mobile Laser Scanning System

In this study, data acquisition was achieved by an autonomous unmanned vehicle-mounted laser-scanning system, and the system scheme is shown in Figure 2. The SCOUT MINI intelligent mobile chassis (the main parameters of which are shown in Table 2) was selected as the mobile platform of the scanning system, which was controlled by a FS-i6S remote controller. The industrial controller is the supercomputing platform Nvidia Xavier, which realizes the connection and control of external sensors (such as LiDAR) and inertial guidance. The data acquisition uses the smallest 3D LiDAR VLP-16 produced by Velodyne, San Jose, CA, USA; the main parameters of the device are shown in Table 3. The LiDAR motor speed is set to 600 rpm, corresponding to a scanning frequency of 10 Hz; the echo mode is set to the strongest single-echo mode; and the mounting position is 42 cm above the ground. With the inertial measurement unit CH110 produced by Supercore Electronics, which integrated a three-axis accelerometer, three-axis gyroscope, and microcontroller, the device and LiDAR VLP-16 synergized to complete the acquisition of 3D point cloud data. A robot operating system (ROS) running on Ubuntu 18.04 LTS (Bionic Beaver) is used as the software platform for data acquisition, which allows real-time processing and provides a data collection mechanism that allows offline processing. In conjunction with an external sensor solution, the tightly coupled laser-inertial odometry computational method LIO-SAM [32] was chosen to fuse LiDAR data and IMU data, in order to estimate the motion of the mobile scanning device and construct 3D point cloud map data of its surroundings.

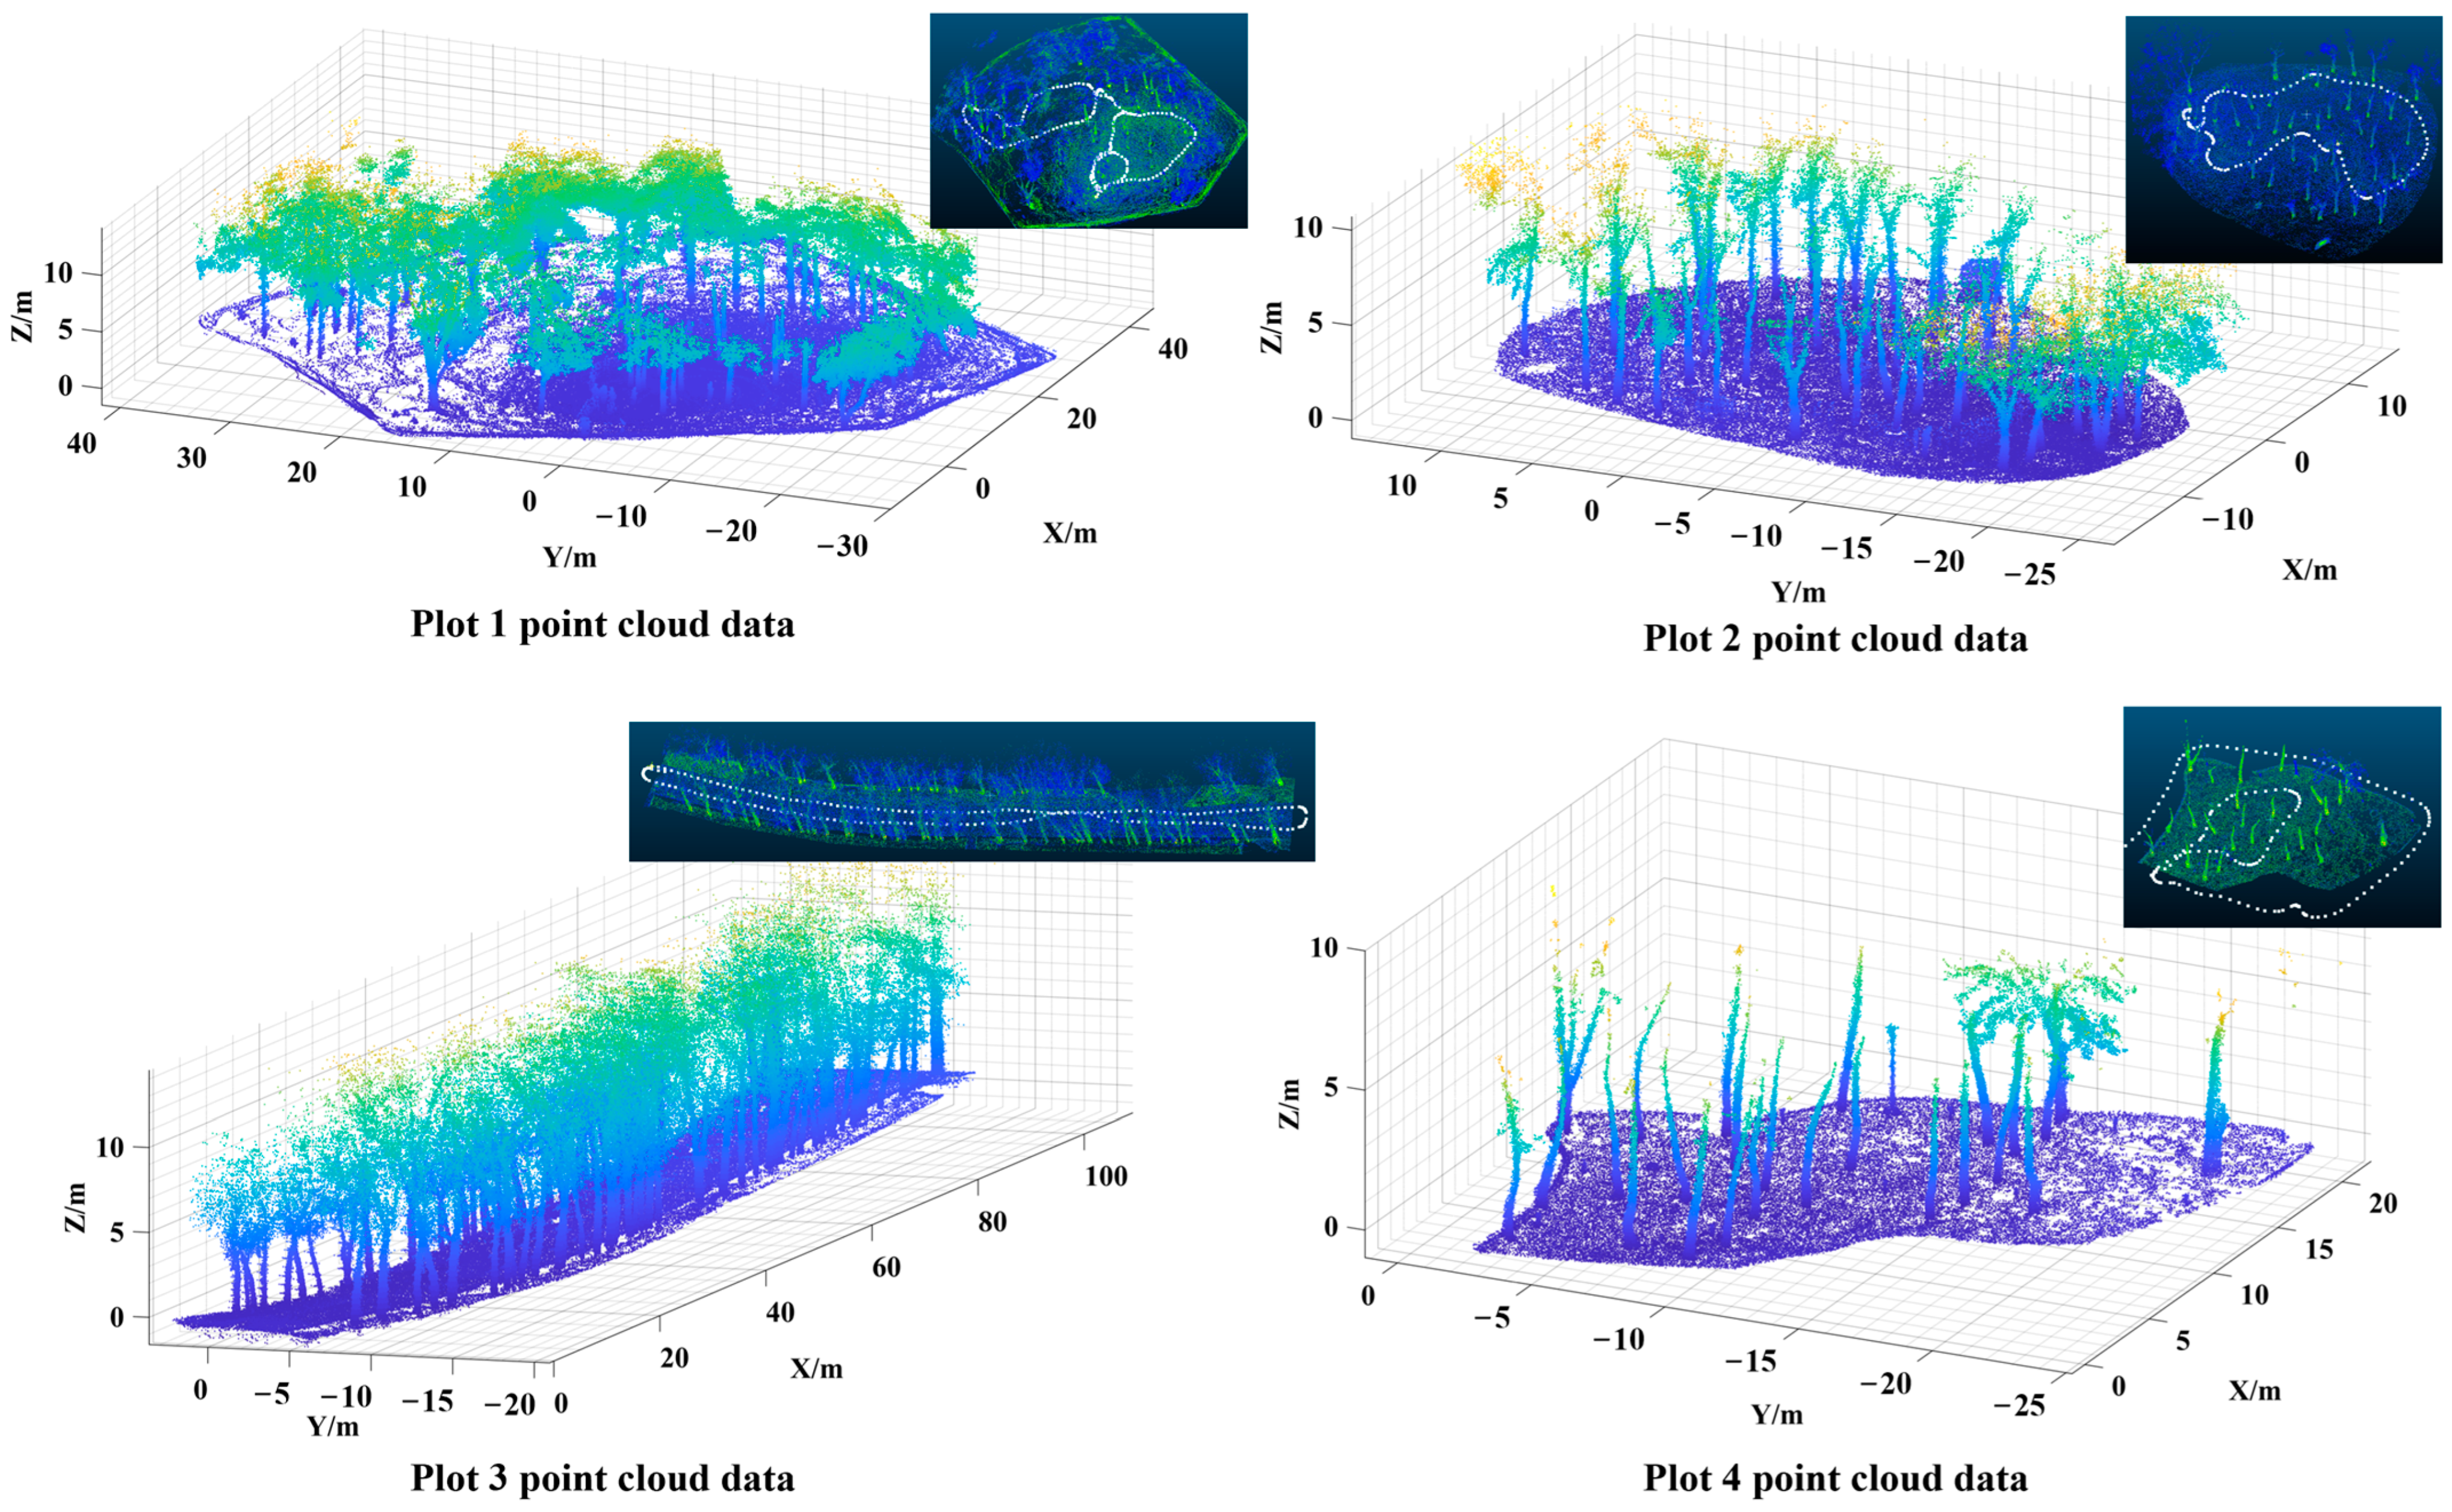
2.1.3. Data Acquisition

The scanning system was built independently (shown in Figure 2) and used to collect the sample site cloud data from four plantation forests in the study area. Lidar VLP-16 and inertial measurement unit CH110 were switched on by inputting commands into the industrial computer, the operator executed the laser SLAM algorithm, and the VLP-16 was tightly coupled with CH110 to start collecting the sample site cloud data. In order to obtain more complete sample site cloud data, the operator manually controlled the mobile platform through remote control, to ensure maximum coverage of the moving path of the sample site; furthermore, to improve the efficiency of data collection, the mobile platform travelled at a constant speed of about 1 m/s. Loop closure detection is a very important part of laser SLAM, which can correct the cumulative error to improve the accuracy and precision of the map. Therefore, when collecting data, the mobile platform is controlled to move in the four sample plots with loops, and LIO-SAM can real-time align the frame-by-frame point cloud data, avoiding the additional offline splicing and alignment operations and obtaining the corresponding PCD point cloud maps of each plot at the end of the collection. The offline cropping process is used to preserve the point cloud data in the area of interest of each site, and the acquired point cloud data are shown in Figure 3 (the white dotted line is the collection path of each site).
The DBHs of individual trees in the sample plots were measured one by one using a diameter at breast height ruler, and the measured values of the DBH for individual trees were obtained. Based on the acquired PCD point cloud map of the sample plot, the trees were numbered, and the point cloud data were corresponded to the measured data for accuracy verification. Measurements were made at the trunk position 1.3 m from the ground, and the recorded data were the circumference of the trunk at that position; the corresponding diameter data were regarded as the DBH of the single tree. In order to exclude the influence of environmental factors and random errors, the point cloud data and the measured DBH were obtained at the same point in time, and the average of the three measured DBHs was taken as the final recorded data; trees with a DBH of less than 5 cm were not recorded. The histogram of the distribution of DBH in the sample plot is shown in Figure 4.

2.2. Methods

In this study, the three-dimensional point cloud of trees, as acquired by the self-constructed laser scanning system, is used as the data source, and after a series of pre-processing operations such as point cloud filtering and elevation normalization, the clustering algorithm and the least squares circle fitting technique are used to achieve the non-contact and non-destructive automatic extraction of the tree DBH. The overall flow of the algorithm is shown in Figure 5, and the main steps include point cloud filtering and elevation normalization, segmentation of single tree instances based on the clustering algorithm, intensity-weighted least squares circle fitting, and extraction of the DBH.

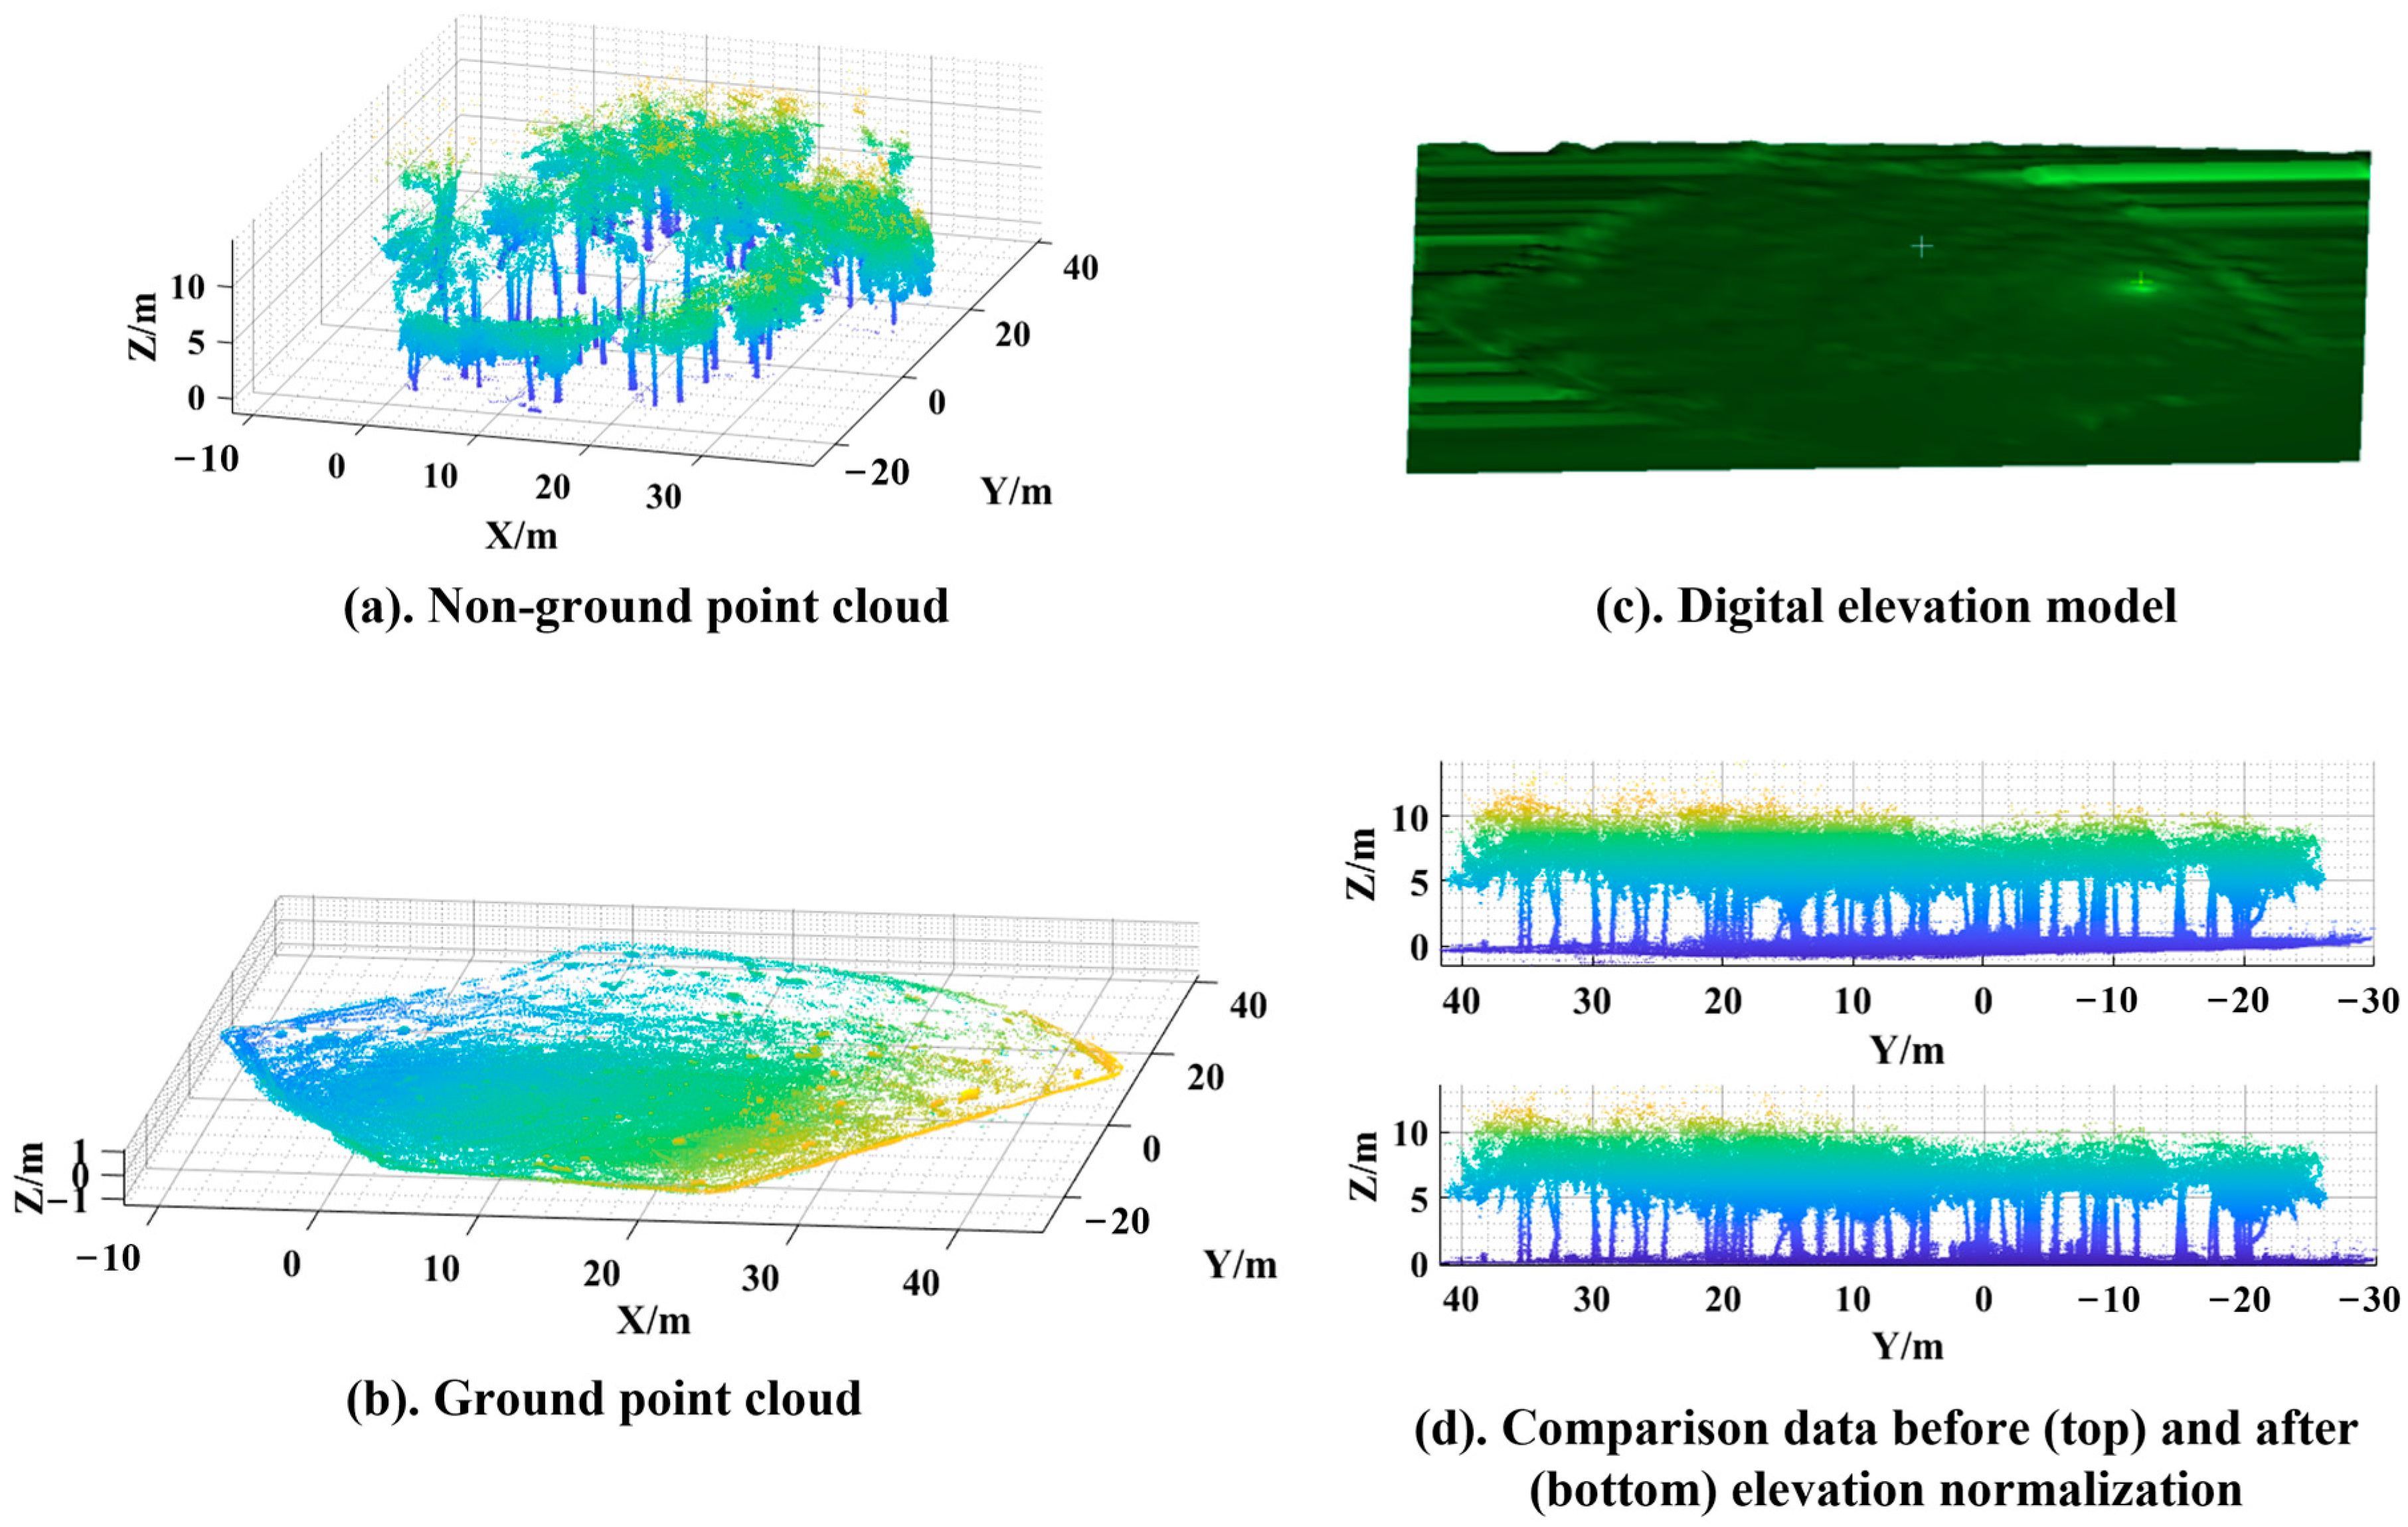
2.2.1. Point Cloud Filtering and Elevation Normalization

After importing the raw point cloud into CloudCompare v2.11.3, a 3D point cloud and mesh processing software, the Segment function of the software is used to crop out the non-interesting areas to obtain accurate sample location cloud data.
For each sample point cloud data, ground filtering is a necessary preprocessing procedure for segmentation of single-tree instances. The scanned sample point cloud contains not only trees but also numerous ground points, which can hinder the detection and extraction of tree point clouds. In addition, point cloud filtering is a prerequisite for separating the tree trunk from the ground, and it is easier to achieve single-tree instance segmentation based on non-ground point clouds. Cloth simulation filtering [33,34] (CSF) is an efficient point cloud ground filtering algorithm, whose basic principle is to determine the final morphology of the cloth by building a cloth model and analyzing the interaction between the cloth particles and the corresponding LiDAR points, and to classify the original points into ground and non-ground points based on the cloth. The algorithm is implemented by reversing the point cloud data, setting the fabric softness and grid size, and simulating the falling process. In this study, the CSF algorithm is chosen to remove the ground point cloud, as shown in Figure 6a,b.
As shown in Figure 6b, the ground point cloud has a height difference, so the bottoms of the trees are not on the same horizontal plane. In order to ensure that the point cloud of each tree’s breast-slice comes from the point cloud of the tree trunk at 1.3 m from the ground, it is necessary to perform elevation normalization on the tree point cloud, to transform the tree point cloud to the same height on the horizontal plane. The digital elevation model (DEM) generated from the ground point cloud is shown in Figure 6c, and elevation normalization is achieved with the help of the pixel values of the recorded point elevations in the DEM. The normalization process is as follows: the CSF is used to separate the ground points from the non-ground points, the nearest DEM pixels of the non-ground points are found, and the elevation value of the non-ground points is subtracted from the value of the nearest DEM pixel to complete the elevation normalization of the point cloud. For each point p = ( x p , y p , z p ) in the non-ground point cloud, the elevation-normalized point cloud p′ = ( x p , y p , z p ) can be obtained by the following equation:
x p = x p y p = y p z p = z p z p D E M
where z p D E M is the pixel value of pDEM, which represents the elevation of the point; pDEM is the nearest pixel in the DEM to the non-ground point cloud p. The elevation-normalized data is shown in Figure 6d.

2.2.2. Segmentation of Single-Tree Instances Based on Clustering Algorithms

The preprocessed tree point cloud data of the sample plots need to be segmented to extract the point sets of single tree instances, in order to form the point sets of single-tree DBH slices by extracting the parts of interest based on the point sets of a single tree. Single-tree segmentation of tree point cloud data can be roughly divided into two types of methods: two-dimensional methods and three-dimensional methods. Two-dimensional methods are based on the canopy height model (CHM) to segment the point cloud of single-tree instances [35]. Three-dimensional methods are directly based on the original point cloud for clustering, to achieve segmentation of the single-tree instance point cloud [36].
Similar to Euclidean clustering [37], the fast Euclidean clustering [38] (FEC) algorithm uses the Euclidean (L2) distance metric to measure the closeness of the unordered points and groups the close points into the same class of clusters, which can be described as
min P i P i 2 D t h
where C i = { P i P} is a different class cluster than C i = { P i P} and D t h is the maximum distance threshold. Unlike the class-by-class cluster scheme used in Euclidean clustering methods, where all points must be traversed, resulting in many points being judged repeatedly, the FEC algorithm uses a point-by-point scheme with point-indexed ordering, cycling through the points based on the input numbering order. This novel point-by-point scheme results in significantly fewer calls in the kd-tree search in the loop and is the key to FEC’s significant reduction in runtime. In this study, the FEC algorithm is used for single tree instance segmentation, and the pseudocode of the FEC algorithm is given in [38].
Considering the point cloud data collected in the understory, the information of the canopy part of the acquired data is not complete, and the point cloud of the trunk is richer. In order to exclude the influence of the crown part of the tree and more accurately segment the single-tree trunk point cloud, the strategy of controlling the number of point clouds of the smallest class clusters is used. Through several repeated attempts in the experiment, the clustering effect was observed to determine the best algorithm parameters and the minimum class cluster point cloud threshold for each sample site, and to optimize the segmentation results of single-tree instances. The segmentation results for each sample plot are shown in Figure 7.

2.2.3. Diameter at Breast Height Extraction Based on Intensity-Weighted Least Squares Circle Fitting

The point cloud data of each tree was obtained after the single-tree instance segmentation process, the point cloud slices at a height of 1.3 m on the trunk are only needed for the diameter at breast height extraction, the region of interest data need to be extracted from the point set slices of the single-tree instances before extraction, and the point cloud slices can be described as
P 1.3 = p i = x i , y i , z i P , z i 1.3 ± ϵ
where P 1.3 is the set of point clouds of a certain thickness at a height of 1.3 m from the trunk, p i is any point in the point set P of a single-wood instance, and ϵ is the parameter related to the thickness of the slices (in m). By reference to the optimal point cloud thickness for DBH extraction in [39] and the point cloud data density in this study, ϵ was selected to be 0.05. After obtaining the set of point cloud slices, the data were fitted by 2D projecting them to the XOY plane.
The shape of the cross-sectional profile at breast height of a standing tree is similar to a circle, and most 2D DBH extraction methods are based on the assumption of a circular model, mathematically represented as
( x A ) 2 + ( y B ) 2 = R 2
where (A, B) are the coordinates of the center of the hypothetical circle of the breast height profile, R is the radius of the hypothetical circle of the breast height profile, and the corresponding DBH is 2R. The main idea of the least-squares method is to minimize the sum of squares of the errors between the true and predicted values by determining the unknown parameters of the model. Least squares circle fitting means that the optimal circle model parameters are obtained by minimizing the sum of squares of the distances of all data points from the fitted circle.
In the laser SLAM algorithm, not every frame of LiDAR data is used for the construction of the final environment point cloud map. When the machine attitude changes over a preset threshold, the corresponding LiDAR data frames are marked as key frames, and the key frames are spliced together by feature point matching to finally construct the environmental point cloud map. There are errors in the splicing and fusion of different key frames collected at different locations, resulting in the presence of poorly aligned point cloud fragments and mixed point noise in the acquired data. It is known that all point data are involved in the optimal model parameters during least squares circle fitting, so the mixed point noise data and low-quality alignment data in the point cloud will affect the fitting results. The point cloud intensity value I is determined by the ratio of the laser received power P r to the laser transmitted power P e , and the point cloud intensity I [40] can be expressed as
I = P r P e = D r 2 ρ 4 r 2 η s y s η a t m c o s α = η a l l ρ c o s α r 2
where D r 2 is the laser receiver aperture, η sys is the optical system transmission coefficient, η a t m is the atmospheric transmission coefficient, η a l l is a constant related to the optical system parameter, α is the angle of incidence between the surface of the object and the laser beam, ρ is the reflectance of the surface of the target object, and r is the scanning distance. The point cloud intensity of the VLP-16 has been calibrated to be independent of the distance, and therefore of the tree trunk in the point cloud data; the point cloud intensity is affected by the reflectance of the tree surface and the incidence angle. The point cloud used in extracting the DBH is a single-tree trunk point cloud with the same surface reflectance, so the intensity of the point cloud in the DBH slices is mainly affected by the incidence angle. Differences in the angle of incidence of point clouds on the same tree trunk in different key frames can lead to variations in the reflected intensity values due to changes in the observation angle and position. The same or neighboring key frames have relatively small differences in incidence angle, the point cloud intensity values are small and concentrated, the geometric consistency of these point data is better, the noise level is lower, and the description of the trunk geometry is more accurate, which is more reliable in the point cloud data analysis. Therefore, with the help of point cloud intensity information, different quality point cloud data can be effectively distinguished to ensure that the high geometric consistency point data play a dominant role in the model fitting. In this study, based on the least-squares circle fitting method, we introduce the point cloud intensity information to construct the weighted coefficient matrix, and we propose a DBH extraction method based on intensity-weighted least-squares circle fitting, which reduces the influence of mixed point noise data and low-quality alignment data on the accuracy of DBH extraction.
The DBH slice projection point cloud data were treated as a circle and the best-fit model parameters for this point set were determined using intensity-weighted least squares circle fitting. The mathematical representation of the fitted model was the general equation for a circle:
f x , y = x 2 + y 2 a x b y c = 0
According to the principle of least squares, the sum of squares of the minimization error of the least squares circle fit can be expressed as
E ( a , b , c ) = i = 1 n f 2 ( x i , y i ) = i = 1 n ( x i 2 + y i 2 a x i b y i c ) 2
The objective is to determine the optimal values of a, b, and c such that E(a, b, c) is minimized. The general equation is written in matrix form for the least squares solution:
C X = D
C = x 1 y 1 1 x n y n 1 , X = a b c , D = x 1 2 + y 1 2 x n 2 + y n 2 .
Constructing the strength weighting coefficient matrix W, the optimal circular model parameter solution can be expressed as
X = C T W C 1 C T W D
W = w 1,1 w n , n
where w i , i is the weight value of the DBH slice point p i . According to the distribution characteristics of the intensity values of the point cloud of the same or neighboring key frames with better geometric consistency, as well as the distribution of the histogram of the intensity values, the intensity values of the sliced point cloud were divided into intervals, the proportion of the points in each interval to the total number of points was calculated, and the proportion value was the weight value of the points in the interval; the number of intervals was set to be 4 in this study. The weighting coefficient matrix was constructed for the purpose of adjusting the importance of the points of the data of different qualities, reducing the noise of the mixed point data and low-quality alignment data on the fitting results, making the fitting results more accurate.
The coordinates of the center of the fitted circle (A, B) and the radius R can be calculated from the solved parameters of the optimal circle model X = a b c T , which are calculated as A = a / 2 , B = b / 2 and R = c + A 2 + B 2 . The diameter of the circle model, d = 2 R , was taken as the value of the tree’s DBH.

2.2.4. Precision Evaluation
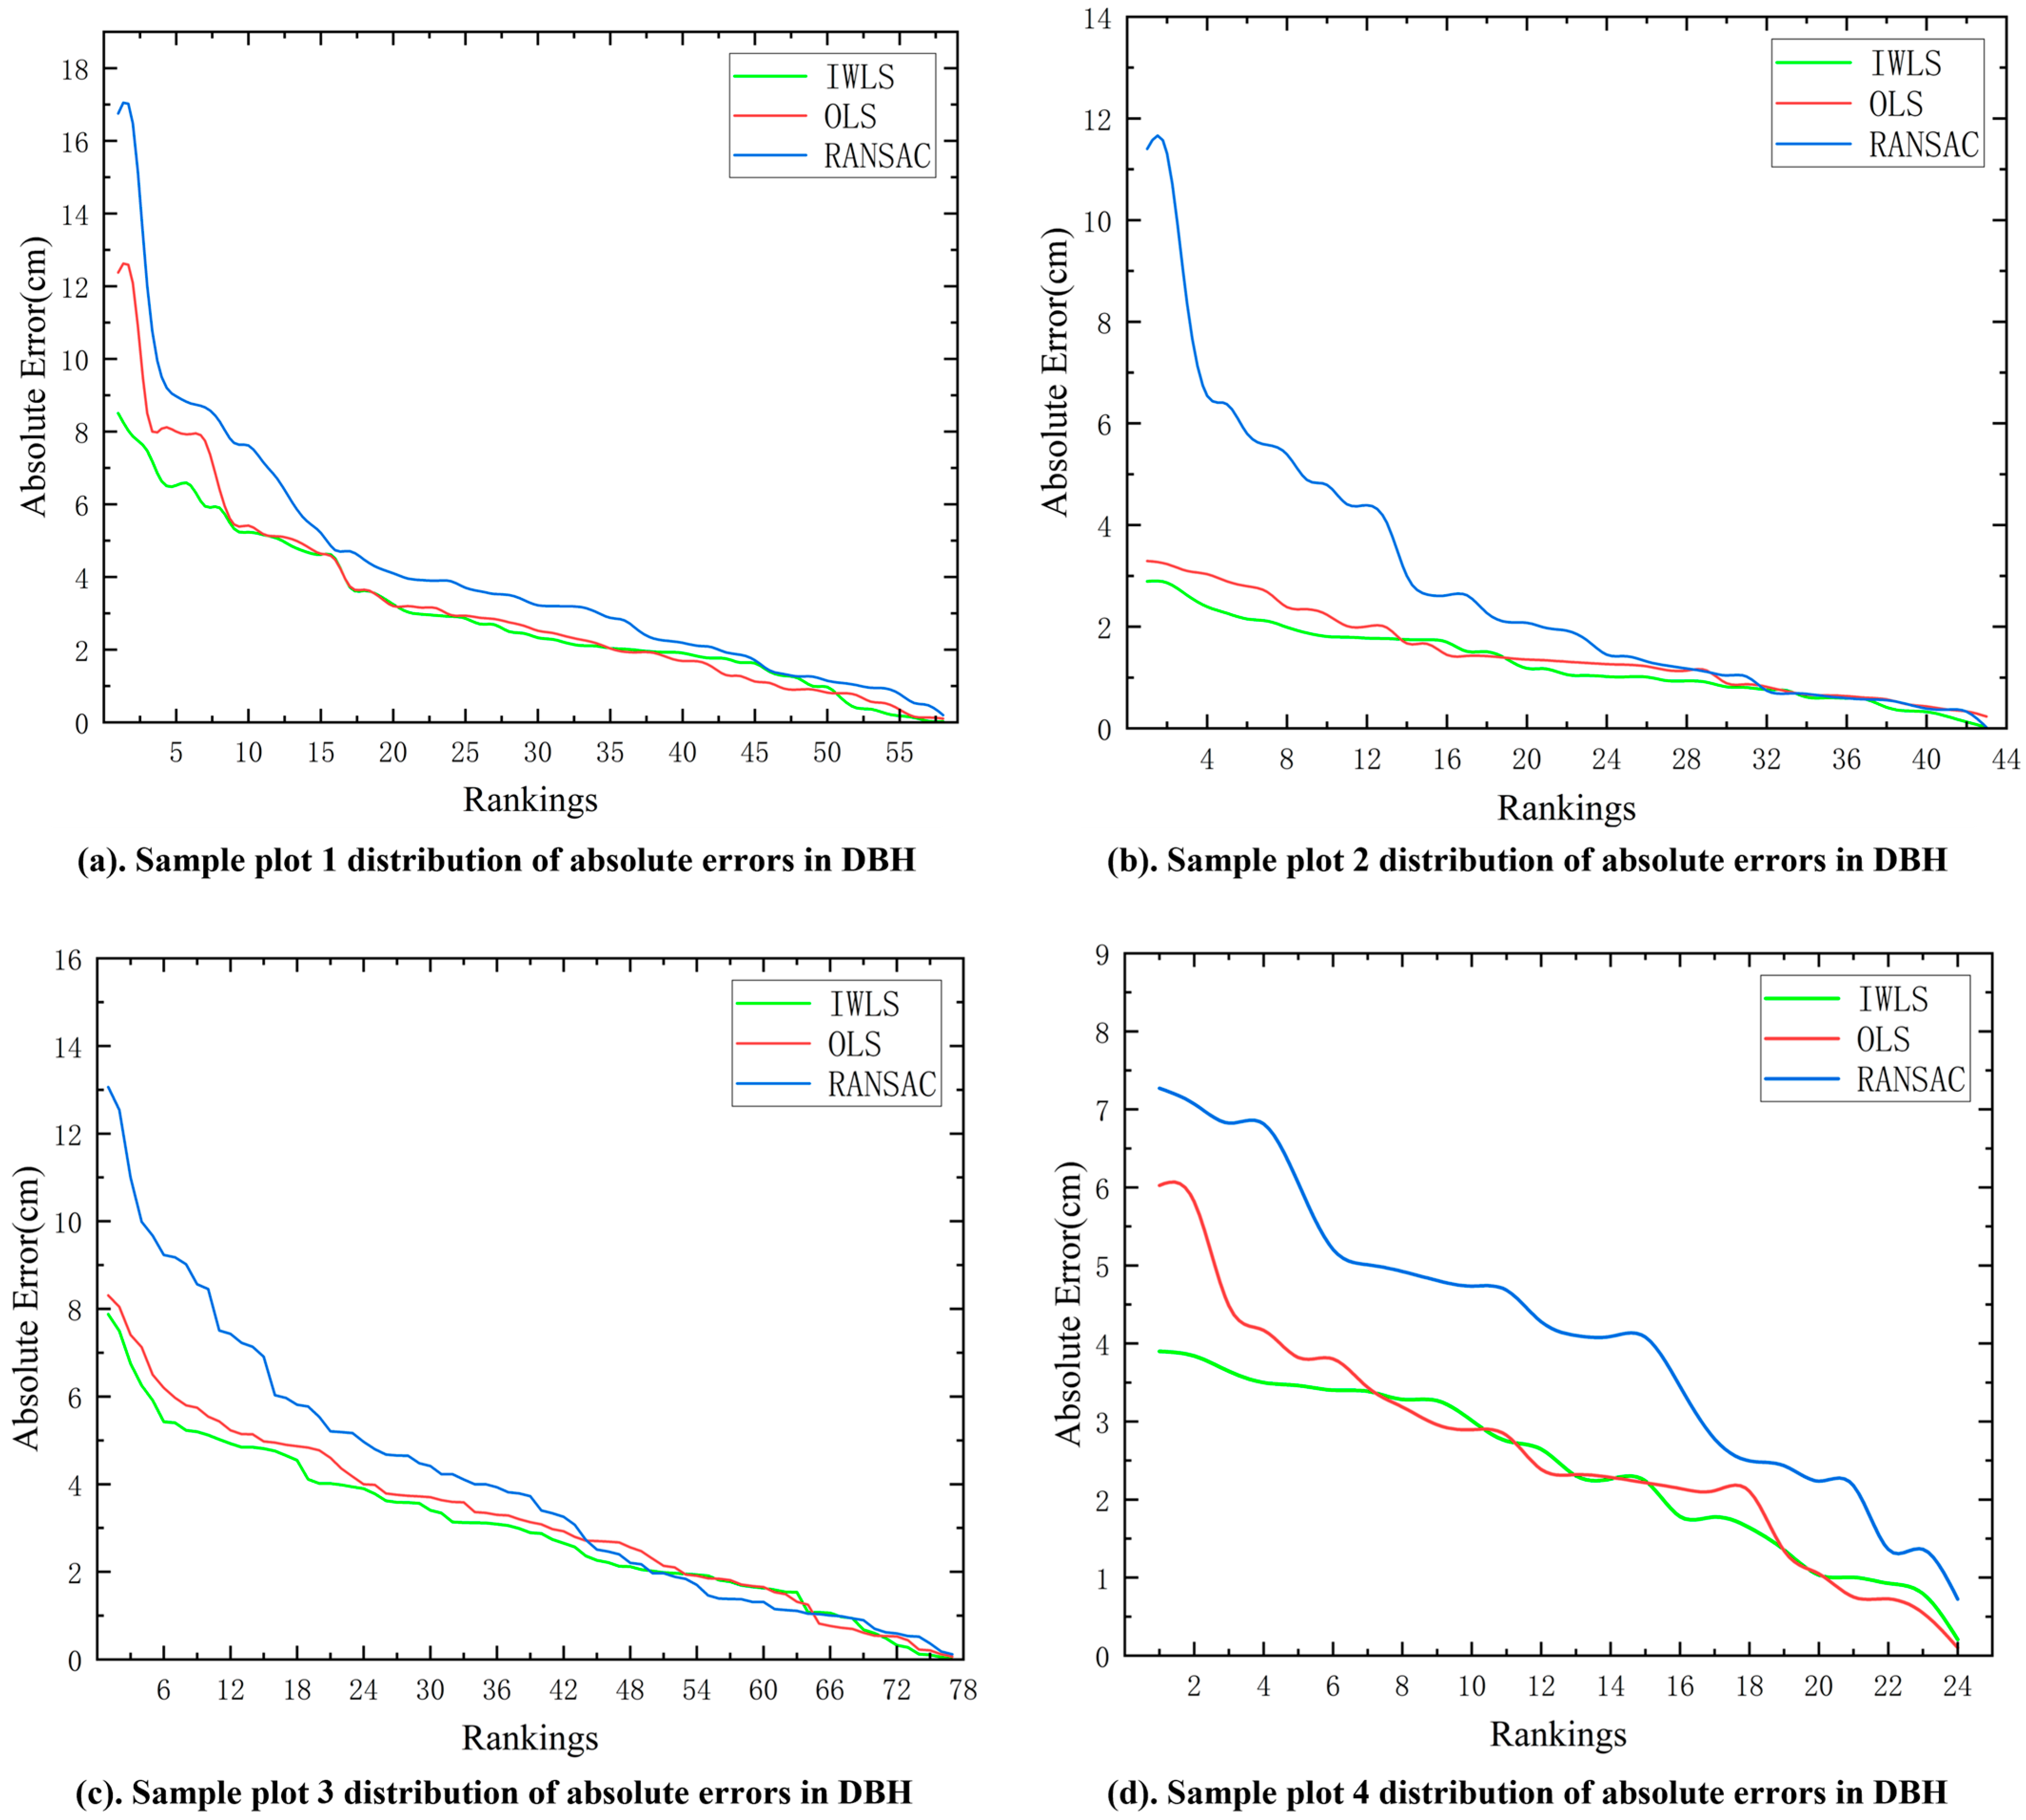
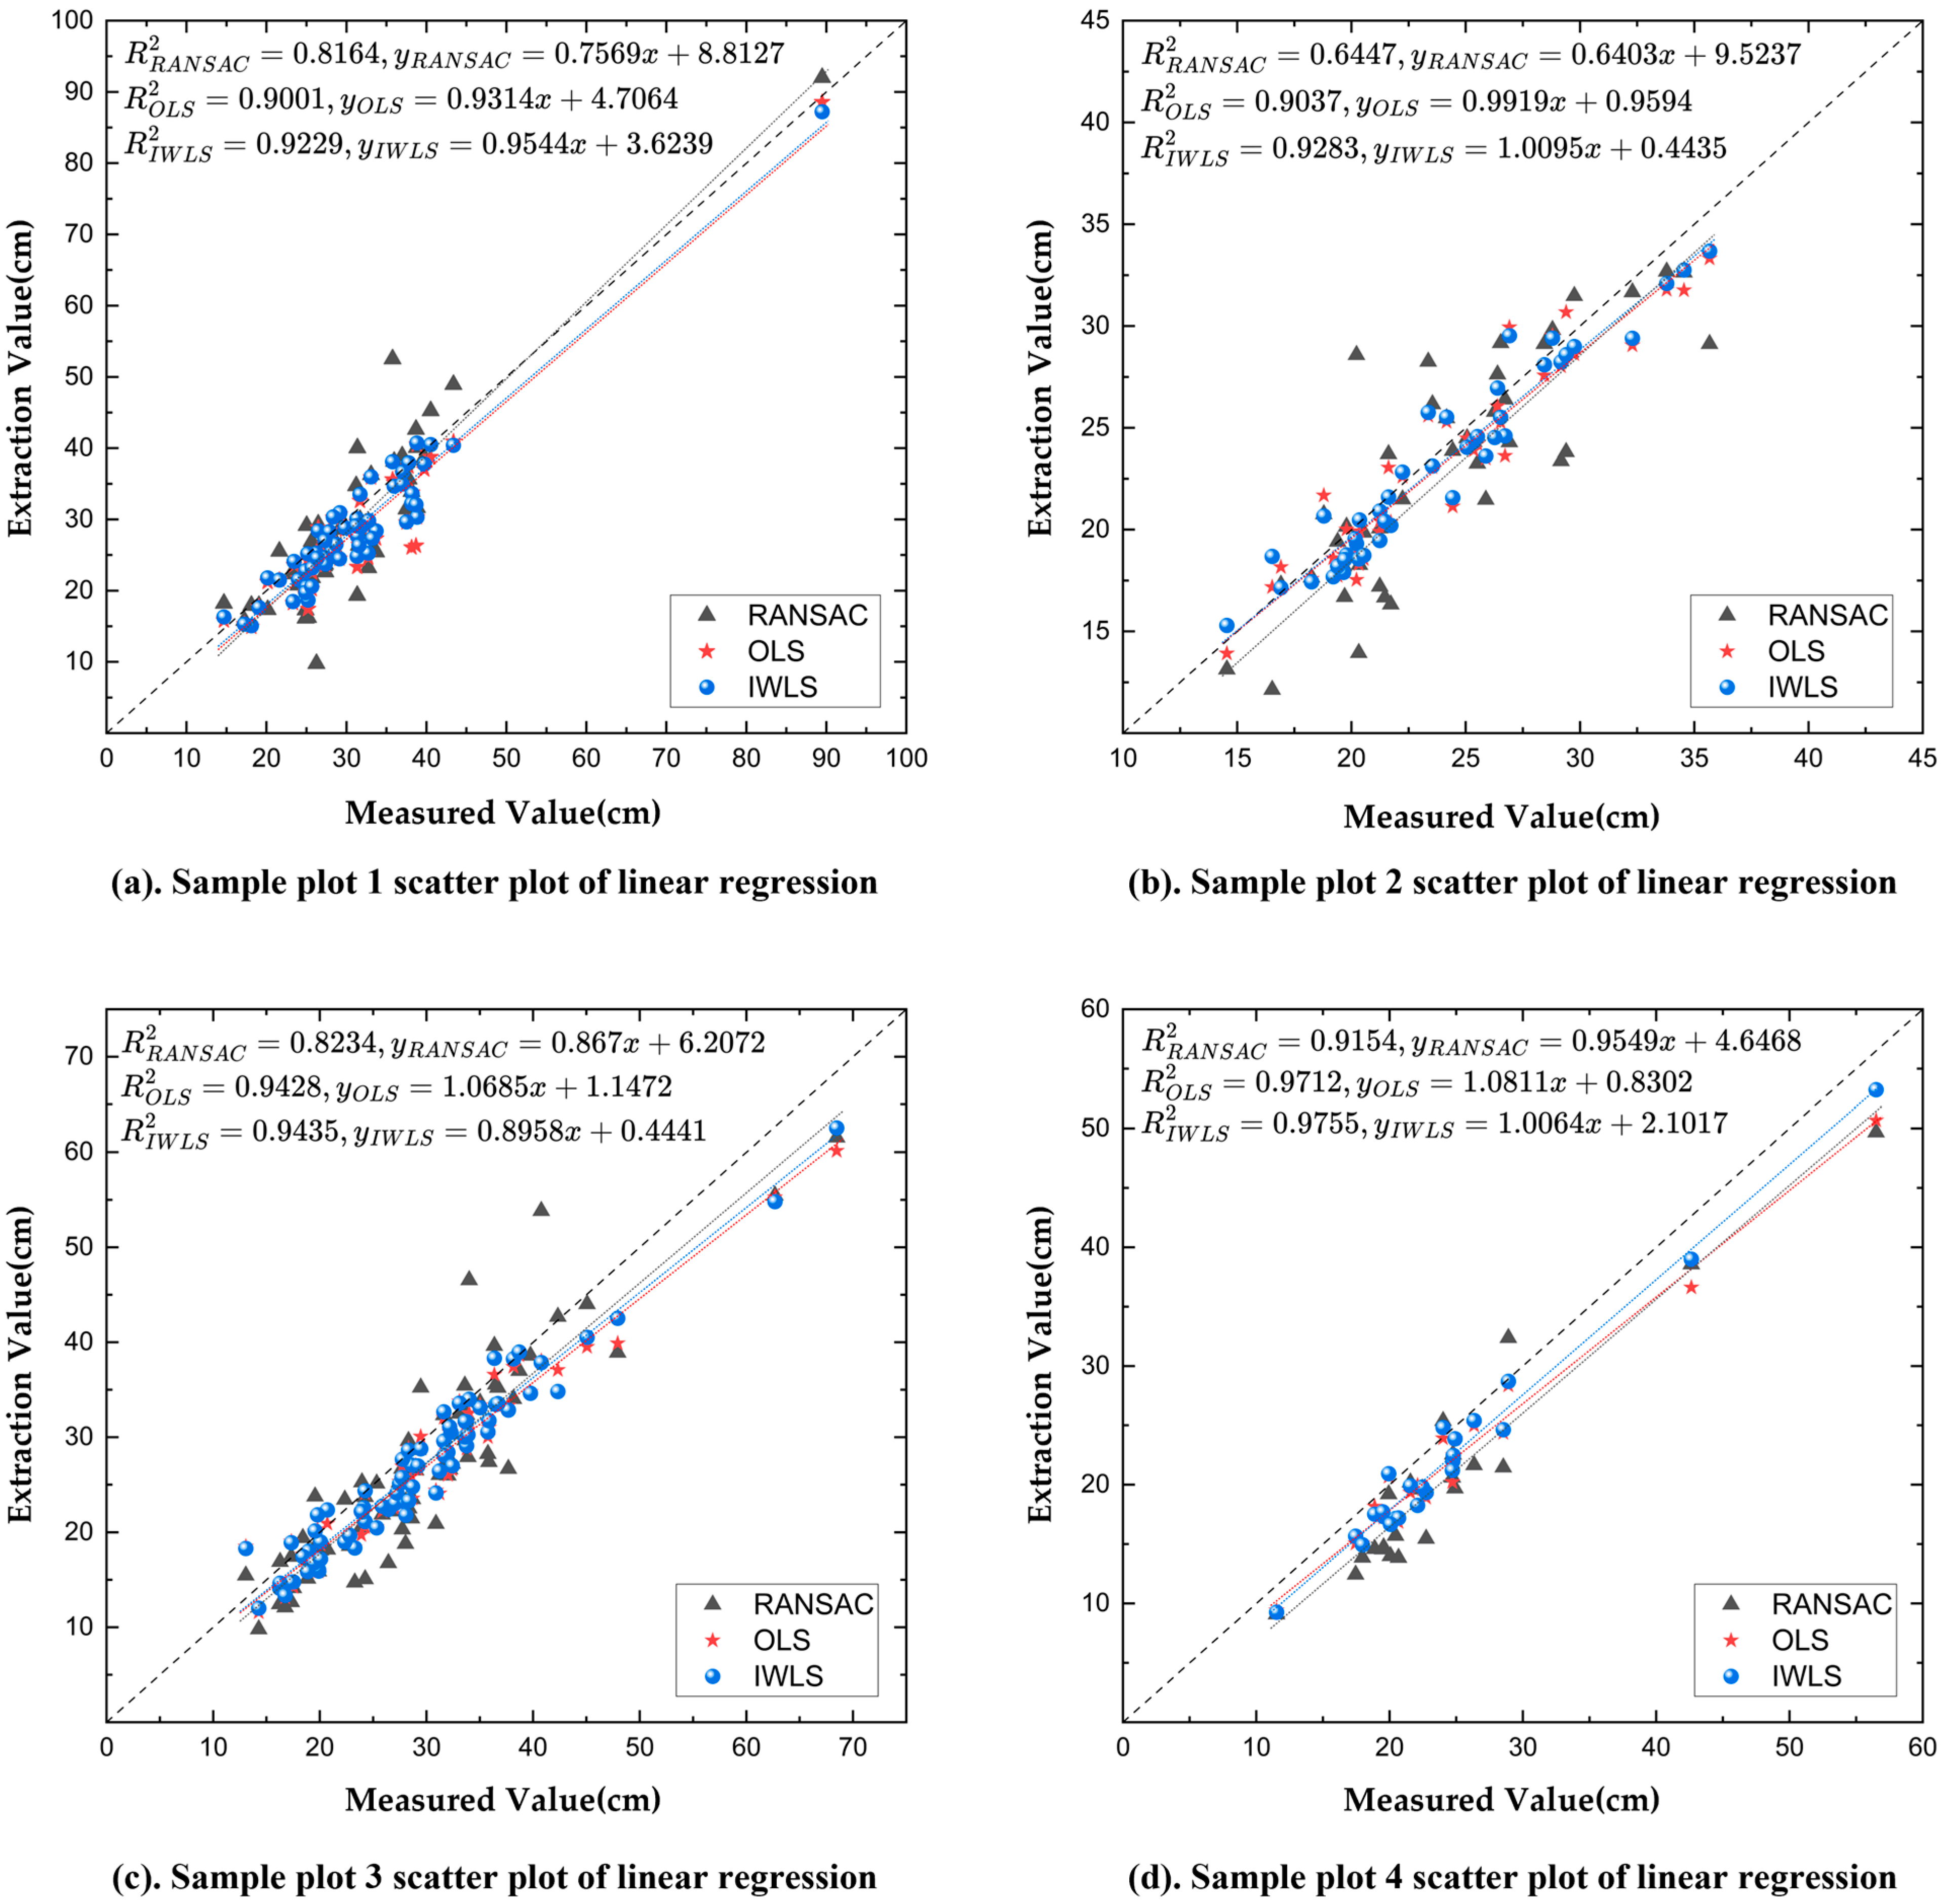
The measured single-tree DBH was used as a standard reference to compare the results of the single-tree DBH extracted from the vehicle-mounted laser scanning point cloud, to assess the accuracy of the DBH extraction. Four evaluation indexes, namely, root mean square error (RMSE), mean absolute error (MAE), coefficient of determination ( R 2 ), and relative accuracy (RA), were selected to evaluate the accuracy of the extracted DBHs, and RMSE and AE were used to evaluate the difference between the extracted results and the measured data; the smaller the value was, the better the extraction effect was. The relative accuracy indicates the accuracy of the extraction results close to the measured data, and the larger the value, the more accurate the extraction results. R 2 reflects the linear correlation between the extracted values and the measured values, and the larger the R 2 is (close to 1), the better it is. The evaluation indexes are as follows:
R M S E = i = 1 n D B H i D B H r e f i 2 n
M A E = 1 n i = 1 n D B H i D B H r e f i
R 2 = i = 1 n D B H i D B H i ¯ 2 i = 1 n D B H r e f i D B H i ¯ 2
R A = 1 R M S E D B H r e f ¯ × 100 %
where n is the number of trees in the sample plot, D B H i is the extracted DBH, D B H r e f i is the measured DBH, D B H i ¯ is the average of extracted DBH, and D B H r e f ¯ is the average of measured DBH.
Among the 204 trees in the four sample plots of this study, there were two trees exhibiting trunk bifurcation into multiple trunks at breast height. The point cloud slices at breast height of standing trees with branching points lower than 1.3 m would cause a significant reduction in the accuracy of the automatic extraction of DBH, affecting the assessment of the accuracy of the extraction algorithm. Therefore, the point cloud data of these trees with branching points lower than 1.3 m were not used to evaluate the accuracy of the DBH extraction algorithm.

3. Results

In order to verify the effectiveness of the proposed intensity weighted least squares (IWLS) DBH extraction method based on the point cloud intensity, the point cloud data of the same trees in the same area were used to carry out DBH extraction experiments by using the random sample consensus (RANSAC) algorithm and the ordinary least squares (OLS) algorithm. The three extraction results were compared in terms of accuracy. Based on the PCL point cloud library [41], the above three algorithms were implemented using the C++ programming language, and all of them conduct DBH extraction experiments according to the flow shown in Figure 5. The accuracy of the three algorithms for DBH extraction was evaluated by calculating and counting the absolute error AE, mean absolute error MAE, root mean square error RMSE, relative accuracy RA, and coefficient of determination R 2 .
The results in Table 4 show that the IWLS extraction method proposed in this study performed best among the three methods. In all four sample plots, the two accuracy evaluation metrics (AE and RMSE) used to reflect the error decreased, and the relative accuracy was the highest in all of them. In Sample Plot 1, the IWLS extraction method had an MAE of 2.99 cm and an RMSE of 3.65 cm, with a relative accuracy of 88.12%. Compared to the RANSAC and OLS extraction methods, the MAE decreased by 28.95% and 8.75%, the RMSE decreased by 33.28% and 14.55%, and the relative accuracy increased by 7.21% and 2.35%, respectively. In Sample Plot 2, the IWLS extraction method had a MAE of 1.28 cm and a RMSE of 1.48 cm, with a relative accuracy of 93.80%. Compared to the RANSAC and OLS extraction methods, the MAE was reduced by 54.84% and 13.53%, the RMSE was reduced by 62.74% and 13.75%, and the relative accuracy was improved by 12.51% and 1.06%, respectively. In Sample Plot 3, the MAE of the IWLS extraction method was 2.98 cm and the RMSE was 3.48 cm, with a relative accuracy of 88.00%. Compared to the RANSAC and OLS extraction methods, the MAE was reduced by 25.63% and 7.42%, the RMSE was reduced by 31.16% and 7.88%, and the relative accuracy was improved by 6.58% and 1.18%, respectively. In Sample Plot 4, the IWLS extraction method had a MAE of 2.39 cm and a RMSE of 2.63 cm, with a relative accuracy of 89.15%. Compared to the RANSAC and OLS extraction methods, the MAE was reduced by 41.99% and 9.59%, the RMSE was reduced by 41.93% and 13.80%, and the relative accuracy was improved by 9.63% and 1.99%, respectively.
From Table 4, it can be seen that the AE maximum values of the three extraction methods differed greatly, with an AE maximum value of 16.75 cm for the RANSAC extraction method in Sample Plot 1 and 2.89 cm for the IWLS extraction method in Sample Plot 2. The AE minimum values of the three extraction methods differed less: except for the AE minimum value of 0.72 cm for the RANSAC extraction method in Sample Plot 4, none of them exceeded 0.23 cm. In order to further analyze the absolute error values of the three extraction methods in the four sample plots, they were displayed in descending order, as shown in Figure 8. The distribution of the absolute error results shows that the absolute error of the RANSAC-based extraction method in the four sample plots is significantly larger than that of the OLS and IWLS methods, which are both based on all point data to solve the optimal model parameters, so the distribution of the two absolute errors is relatively similar but the absolute error between the extracted values of the DBH for the fitted circular model under the IWLS method and the measured values are smaller overall and have decreased. By further analyzing and comparing the absolute errors of the three methods, it can be proved that the IWLS extraction method outperforms both RANSAC and OLS methods.
The scatter plots of the extracted and measured values of DBH in each sample plot are shown in Figure 9. Comparing the linear regression scatter plots of different methods in the same sample plot, the scatter distribution of the IWLS extraction method is closer to the scatter regression line, the R 2 is closer to 1, and the goodness-of-fit is the highest, which indicates that the extraction results of the method have a significant linear correlation with the measured values. The scatter plots indicate that adjusting the importance of data points by intensity information can reduce the influence of low-quality point cloud data on the extraction accuracy of DBH and improve the accuracy of the DBH fitting results.
In this study, we compared and analyzed the accuracy of tree DBHs extracted from mobile laser scanning point cloud based on RANSAC, OLS, and IWLS. The experimental results show that the MAE of the IWLS method is 2.41 cm, which is better than the RANSAC method (3.79 cm) and the OLS (2.65 cm) method, with a reduction of 36.45% and 9.14%, respectively, in the tests of four sample plots; the average RMSE of the IWLS method is 2.81 cm, which is also better than the RANSAC method (4.76 cm) and the OLS methods (3.20 cm), which were reduced by 40.90% and 12.26%, respectively. In addition, the average relative accuracy of the IWLS method is 89.77%, which is higher than that of the RANSAC method (82.37%) and the OLS method (88.33%), with an improvement of 8.99% and 1.63%, respectively. In summary, the experimental results verified that the intensity-weighted least squares circular model fitting method can effectively improve the accuracy of tree DBH extraction.
Referring to the national standard “Forest Resources Planning and Design Survey Technical Specification” (GB/T 26424-2010) [2] in the DBH class division standard, the trees in the sample plot were divided into three diameter groups to analyze the performance of each method in different diameter groups; the data are shown in Table 5. In the table, A represents the medium diameter group with a DBH of 12–24 cm; B represents the large diameter group with a DBH of 24–36 cm; C represents the extra-large diameter group with a DBH of 36 cm or more. For the statistical data of different diameter groups in each sample site (provided in Table 5), the analysis is as follows: the average relative accuracy of the RANSAC method is higher in the C diameter group, the average relative accuracy of the A and B diameter groups is lower, and there is a certain fluctuation of accuracy between different diameter groups, so the overall adaptability is poor; the average relative accuracy of the OLS method is higher in the B diameter group, and the A and C diameter groups are slightly lower than that of the B diameter group, which is suitable for measuring the diameter of medium-sized and fine trees. The average relative accuracy of the IWLS method is higher in all three groups, and the fluctuation of accuracy between different groups is small, so the method has the widest adaptability and is suitable for the measurement of the diameter of trees of different thicknesses and finenesses. In conclusion, the IWLS method is the most adaptable method and has the best performance in different diameter groups.

4. Discussion

Poorly aligned point cloud segments and mixed point noise data in MLS affect DBH extraction accuracy. There have been some methods such as ANPDA [28] and SSN [31] aiming to minimize this effect, but there is still a lack of methods based on the conventional automatic DBH extraction framework without additional processing operations. Drawing on the idea of leveraging point cloud intensity information, as presented in [30], this study constructs a DBH estimation method without additional processing operations based on a conventional automatic DBH extraction framework, which effectively reduces the influence of poorly aligned point cloud segments and mixed point noise data.
The four sample plots differed in extraction accuracy. Through further analyses, this was found to be due to the different species and phenotypic characteristics of the trees in each sample plot, the choice of collection paths, and the terrain conditions. Different tree species in different sample plots have different trunk phenotypic characteristics, which affect the dispersion of LiDAR reflection data and data quality to some extent. In addition, differences in the diameter sizes of the trees also have an impact [42], which is reflected in differences in the shape and structure characteristics captured in the data. Differences in acquisition paths affect the angle and distance at which the LiDAR scans the trees, which in turn affects the density and quality of the point cloud data. Terrain differences [28], such as slope and undulation, affect the stability and scanning range of the scanning equipment, further affecting data accuracy. Combining these factors, each sample plot presents different characteristics during data acquisition and processing, leading to differences in final DBH extraction accuracy.
In addition, the experimental results show that the extraction accuracy of the RANSAC method is lower compared to the OLS and IWLS methods, mainly because of the irregular circular boundaries of the tree trunk point cloud data acquired by mobile laser scanning. The uneven distribution of contour points, with dense points in some regions and sparse points in others, makes different sampling subsets of RANSAC produce very different circle centers and radii, leading to difficulties in locating the circle center and unstable radius estimation, which in turn leads to lower extraction accuracies. The intensity-weighted least squares method proposed in this study ensures that highly geometrically consistent data play a dominant role in model fitting, thereby reducing the impact of low-quality alignment data and noise on the extraction accuracy of DBH.
In future research, there is a need to continue work in the following aspects: (1) The single-tree instance segmentation part requires human setting of parameter thresholds, which increases the factor of manual intervention. In order to improve the degree of automation, subsequent research can explore the adaptive setting of parameter thresholds based on point cloud features, to reduce the manual parameter tuning process. (2) Although the shape of the trunk cross-section resembles a circle, it is usually not a standard circle, and fitting the trunk DBH based on a circular model introduces errors into the fitting process to a certain extent. In subsequent studies, non-circular models such as polynomials can be attempted, to more accurately simulate the actual shape of the tree trunk cross-section, reduce the error introduced by the assumption of circular models, and improve the accuracy of the extraction of the chest diameter parameters.

5. Conclusions

In this study, point cloud data of trees in four plantation forest sample plots were collected using a mobile laser scanning system. The data were processed to extract parameters of single-tree DBHs through point cloud filtering, elevation normalization, single-tree instance segmentation, and intensity weighted least square circle model fitting. The extraction accuracy was evaluated by comparing with measured DBH values. Compared with traditional RANSAC and OLS methods, the proposed IWLS method, utilizing point cloud intensity information, demonstrated improvements in accuracy. The introduction of intensity information reduced the influence of low-quality points, enhancing parameter fitting accuracy. The IWLS method showed a stable performance across different tree thicknesses and diameter classes, exhibiting strong adaptability.

Author Contributions

Y.S.: methodology, software, writing, editing, data analysis, result verification. Q.Z.: funding acquisition, methodology, supervision. X.W.: methodology, review. Y.L.: data curation, review. X.Y.: methodology, supervision. All authors have read and agreed to the published version of the manuscript.

Funding

This study was supported by the National Natural Science Foundation of China (32260388) and the Xinjiang Production and Construction Corps Key Field Science and Technology Tackling Program Project (2023CB008-22).

Data Availability Statement

The authors do not have permission to share data.

Conflicts of Interest

The authors declare no conflicts of interest.

References

  1. Bonan, G.B. Forests, climate, and public policy: A 500-year interdisciplinary odyssey. Annu. Rev. Ecol. Evol. Syst. 2016, 47, 97–121. [Google Scholar] [CrossRef]
  2. GB/T 26424-2010; Technical Regulations for Inventory for Forest Management Planning and Design. China National Standardization Administration Committee: Beijing, China, 2011. Available online: https://openstd.samr.gov.cn/bzgk/gb/newGbInfo?hcno=18D1658E2885CD74F5976BEA0A3B2991 (accessed on 6 February 2024).
  3. Wang, X.; Zhao, Q.; Han, F.; Ma, Y.; Long, X.; Jiang, P. Application of Airborne Multispectral Image Semantic Segmentation Model in Farmland Shelterbelt Extraction. J. Geo-Inf. Sci. 2020, 22, 1702–1713. [Google Scholar]
  4. Zhao, Q.; Jiang, P.; Wang, X.; Zhang, L.; Zhang, J. Classification of protection forest tree species based on UAV hyperspectral data. Trans. Chin. Soc. Agric. Mach. 2021, 52, 190–199. [Google Scholar]
  5. Liu, Y.; Zhao, Q.; Wang, X. A tree species classification model based on improved YOLOv7 for shelterbelts. Front. Plant Sci. 2024, 14, 1265025. [Google Scholar] [CrossRef] [PubMed]
  6. Wu, Y.; Zhao, Q.; Yin, X.; Wang, Y.; Tian, W. Multi-parameter health assessment of jujube trees based on unmanned aerial vehicle hyperspectral remote sensing. Agriculture 2023, 13, 1679. [Google Scholar] [CrossRef]
  7. Ferreira, M.P.; Zortea, M.; Zanotta, D.C.; Shimabukuro, Y.E.; de Souza Filho, C.R. Mapping tree species in tropical seasonal semi-deciduous forests with hyperspectral and multispectral data. Remote Sens. Environ. 2016, 179, 66–78. [Google Scholar] [CrossRef]
  8. Srestasathiern, P.; Rakwatin, P. Oil palm tree detection with high resolution multi-spectral satellite imagery. Remote Sens. 2014, 6, 9749–9774. [Google Scholar] [CrossRef]
  9. Guo, Q.; Liang, X.; Li, W.; Jin, S.; Guan, H.; Cheng, K.; Su, Y.; Tao, S. LiDAR Remote Sensing of Forest Ecosystems: Applications and Prospects. In New Thinking in GIScience; Springer: Berlin/Heidelberg, Germany, 2022; pp. 221–231. [Google Scholar]
  10. Mielcarek, M.; Kamińska, A.; Stereńczak, K. Digital aerial photogrammetry (DAP) and airborne laser scanning (ALS) as sources of information about tree height: Comparisons of the accuracy of remote sensing methods for tree height estimation. Remote Sens. 2020, 12, 1808. [Google Scholar] [CrossRef]
  11. Zhang, R.-Y.; Pang, Y.; Li, Z.-Y.; Bao, Y.-H. Canopy closure estimation in a temperate forest using airborne LiDAR and LANDSAT ETM+ data. Chin. J. Plant Ecol. 2016, 40, 102–115. [Google Scholar]
  12. Kubišta, J.; Surový, P. Individual Tree Identification in ULS Point Clouds Using a Crown Width Mixed-Effects Model Based on NFI Data. Remote Sens. 2022, 14, 926. [Google Scholar] [CrossRef]
  13. Zhang, Y.; Yu, W.; Zhao, X.; Lv, Y.; Feng, W.; Li, Z.; Hu, S. Interactive tree segmentation and modeling from ALS point clouds. J. Graph. 2021, 42, 599. [Google Scholar]
  14. Brede, B.; Lau, A.; Bartholomeus, H.M.; Kooistra, L. Comparing RIEGL RiCOPTER UAV LiDAR derived canopy height and DBH with terrestrial LiDAR. Sensors 2017, 17, 2371. [Google Scholar] [CrossRef]
  15. Kuželka, K.; Slavík, M.; Surový, P. Very high density point clouds from UAV laser scanning for automatic tree stem detection and direct diameter measurement. Remote Sens. 2020, 12, 1236. [Google Scholar] [CrossRef]
  16. Liang, X.; Hyyppä, J.; Kaartinen, H.; Lehtomäki, M.; Pyörälä, J.; Pfeifer, N.; Holopainen, M.; Brolly, G.; Francesco, P.; Hackenberg, J. International benchmarking of terrestrial laser scanning approaches for forest inventories. ISPRS J. Photogramm. Remote Sens. 2018, 144, 137–179. [Google Scholar] [CrossRef]
  17. Liu, L.; Pang, Y.; Li, Z.; Xu, G.; Li, D.; Zheng, G. Retrieving structural parameters of individual tree through terrestrial laser scanning data. J. Remote Sens. 2014, 18, 365–377. [Google Scholar]
  18. Kuželka, K.; Marušák, R.; Surový, P. Inventory of close-to-nature forest stands using terrestrial mobile laser scanning. Int. J. Appl. Earth Obs. Geoinf. 2022, 115, 103104. [Google Scholar] [CrossRef]
  19. Holopainen, M.; Kankare, V.; Vastaranta, M.; Liang, X.; Lin, Y.; Vaaja, M.; Yu, X.; Hyyppä, J.; Hyyppä, H.; Kaartinen, H. Tree mapping using airborne, terrestrial and mobile laser scanning—A case study in a heterogeneous urban forest. Urban For. Urban Green. 2013, 12, 546–553. [Google Scholar] [CrossRef]
  20. Liang, X.; Hyyppä, J.; Kukko, A.; Kaartinen, H.; Jaakkola, A.; Yu, X. The use of a mobile laser scanning system for mapping large forest plots. IEEE Geosci. Remote Sens. Lett. 2014, 11, 1504–1508. [Google Scholar] [CrossRef]
  21. Liang, X.; Kukko, A.; Hyyppä, J.; Lehtomäki, M.; Pyörälä, J.; Yu, X.; Kaartinen, H.; Jaakkola, A.; Wang, Y. In-situ measurements from mobile platforms: An emerging approach to address the old challenges associated with forest inventories. ISPRS J. Photogramm. Remote Sens. 2018, 143, 97–107. [Google Scholar] [CrossRef]
  22. Hartley, R.J.; Jayathunga, S.; Massam, P.D.; De Silva, D.; Estarija, H.J.; Davidson, S.J.; Wuraola, A.; Pearse, G.D. Assessing the potential of backpack-mounted mobile laser scanning systems for tree phenotyping. Remote Sens. 2022, 14, 3344. [Google Scholar] [CrossRef]
  23. Gollob, C.; Ritter, T.; Nothdurft, A. Forest inventory with long range and high-speed personal laser scanning (PLS) and simultaneous localization and mapping (SLAM) technology. Remote Sens. 2020, 12, 1509. [Google Scholar] [CrossRef]
  24. Shao, J.; Zhang, W.; Mellado, N.; Wang, N.; Jin, S.; Cai, S.; Luo, L.; Lejemble, T.; Yan, G. SLAM-aided forest plot mapping combining terrestrial and mobile laser scanning. ISPRS J. Photogramm. Remote Sens. 2020, 163, 214–230. [Google Scholar] [CrossRef]
  25. Fan, Y.; Feng, Z.; Shen, C.; Yan, F.; Su, J.; Wang, W. Design and Experiment of Forest Plot Survey System Based on Improved LOAM. Trans. Chin. Soc. Agric. Mach. 2022, 53, 291–300. [Google Scholar]
  26. Cabo, C.; Del Pozo, S.; Rodríguez-Gonzálvez, P.; Ordóñez, C.; González-Aguilera, D. Comparing terrestrial laser scanning (TLS) and wearable laser scanning (WLS) for individual tree modeling at plot level. Remote Sens. 2018, 10, 540. [Google Scholar] [CrossRef]
  27. Chen, S.; Liu, H.; Feng, Z.; Shen, C.; Chen, P. Applicability of personal laser scanning in forestry inventory. PLoS ONE 2019, 14, e0211392. [Google Scholar] [CrossRef]
  28. Duanmu, J.; Xing, Y. Annular neighboring points distribution analysis: A novel pls stem point cloud preprocessing algorithm for dbh estimation. Remote Sens. 2020, 12, 808. [Google Scholar] [CrossRef]
  29. Bauwens, S.; Bartholomeus, H.; Calders, K.; Lejeune, P. Forest inventory with terrestrial LiDAR: A comparison of static and hand-held mobile laser scanning. Forests 2016, 7, 127. [Google Scholar] [CrossRef]
  30. Cai, S.; Xing, Y.-Q.; Duanmu, J.-L. Extraction of DBH from filtering out low intensity point cloud by backpack laser scanning. For. Eng. 2021, 37, 12–19. [Google Scholar]
  31. Duanmu, J.; Xing, Y. Estimating diameter at breast height using personal laser scanning data based on stem surface nodes in polar coordinates. Remote Sens. Lett. 2020, 11, 1051–1059. [Google Scholar] [CrossRef]
  32. Shan, T.; Englot, B.; Meyers, D.; Wang, W.; Ratti, C.; Rus, D. Lio-sam: Tightly-coupled lidar inertial odometry via smoothing and mapping. In Proceedings of the 2020 IEEE/RSJ International Conference on Intelligent Robots and Systems (IROS), Las Vegas, NV, USA, 24 October 2020–24 January 2021; pp. 5135–5142. [Google Scholar]
  33. Zhang, W.; Qi, J.; Wan, P.; Wang, H.; Xie, D.; Wang, X.; Yan, G. An easy-to-use airborne LiDAR data filtering method based on cloth simulation. Remote Sens. 2016, 8, 501. [Google Scholar] [CrossRef]
  34. Guenther, M.; Heenkenda, M.K.; Leblon, B.; Morris, D.; Freeburn, J. Estimating Tree Diameter at Breast Height (DBH) Using iPad Pro LiDAR Sensor in Boreal Forests. Can. J. Remote Sens. 2024, 50, 2295470. [Google Scholar] [CrossRef]
  35. Li, Y.; Da, Z.; Yan, Y. Artificial Platycladus orientalis (L.) Franco Single Wood Segmentation Based on UAV-based Lidar Point Cloud Data. J. Northwest For. Univ. 2023, 38, 171–179. [Google Scholar]
  36. Wang, P.; Tang, Y.; Liao, Z.; Yan, Y.; Dai, L.; Liu, S.; Jiang, T. Road-side individual tree segmentation from urban MLS point clouds using metric learning. Remote Sens. 2023, 15, 1992. [Google Scholar] [CrossRef]
  37. Miao, Y.; Li, S.; Wang, L.; Li, H.; Qiu, R.; Zhang, M. A single plant segmentation method of maize point cloud based on Euclidean clustering and K-means clustering. Comput. Electron. Agric. 2023, 210, 107951. [Google Scholar] [CrossRef]
  38. Cao, Y.; Wang, Y.; Xue, Y.; Zhang, H.; Lao, Y. FEC: Fast Euclidean Clustering for Point Cloud Segmentation. Drones 2022, 6, 325. [Google Scholar] [CrossRef]
  39. Fan, W.; Liu, H.; Xu, Y.; Lin, W. Comparison of estimation algorithms for individual tree diameter at breast height based on hand-held mobile laser scanning. Scand. J. For. Res. 2021, 36, 460–473. [Google Scholar] [CrossRef]
  40. Wang, H.; Wang, C.; Xie, L. Intensity-slam: Intensity assisted localization and mapping for large scale environment. IEEE Robot. Autom. Lett. 2021, 6, 1715–1721. [Google Scholar] [CrossRef]
  41. Rusu, R.B.; Cousins, S. 3D is here: Point cloud library (pcl). In Proceedings of the 2011 IEEE International Conference on Robotics and Automation, Shanghai, China, 9–13 May 2011; pp. 1–4. [Google Scholar]
  42. Gollob, C.; Ritter, T.; Kraßnitzer, R.; Tockner, A.; Nothdurft, A. Measurement of forest inventory parameters with Apple iPad pro and integrated LiDAR technology. Remote Sens. 2021, 13, 3129. [Google Scholar] [CrossRef]
Figure 1. Schematic map of the study area.
Forests 15 00590 g001
Figure 2. Data acquisition system scheme.
Forests 15 00590 g002
Figure 3. Sample plot point cloud data.
Forests 15 00590 g003
Figure 4. Histogram of DBH distribution.
Forests 15 00590 g004
Figure 5. Flowchart of DBH extraction.
Forests 15 00590 g005
Figure 6. Ground point separation and elevation normalization.
Forests 15 00590 g006
Figure 7. Point cloud clustering segmentation of a single-tree instance.
Forests 15 00590 g007
Figure 8. Distribution of absolute errors in DBH.
Forests 15 00590 g008
Figure 9. Scatter plot of linear regression of extracted and measured values of DBH.
Forests 15 00590 g009
Table 1. Sample plot information.
SpeciesPhenotypic FeaturesDBH (cm)
MinMaxMean
Pinus sylvestris var. mongholica LitvCrown spire-shaped, grey-brown bark, deep longitudinal fissures14.6889.4930.77
Phellodendron amurense RuprCrown rounded to broadly ovate, dark grey bark, scale-like fissures14.5535.6723.86
Ulmus pumila L.Crown widely rounded, grey-brown bark, deep longitudinal fissures13.0668.4728.98
Betula platyphylla SukaczevCrown narrowly tower-shaped, white bark, longitudinally fissured11.5356.5024.21
Table 2. SCOUT MINI parameters.
ParametersNumerical Values
Size627 mm × 550 mm × 252 mm
(L × W × H)
Wheel base451 mm
Wheel track450 mm
Maximum velocity20 km/h
Maximum stroke10 km
Curb weight23 kg
Rated travelling load10 kg
Operating temperature−20 °C–60 °C
Table 3. VLP-16 LiDAR parameters.
ParametersNumerical ValuesParametersNumerical Values
Size103 mm × 72 mmScan frequency5–20 Hz
Maximum distance measured100 mSafety classClass 1 (human eye-safe)
Ranging accuracy±3 cmWeight830 g
Scan rateSingle echo 300,000 point/s
Dual echo 600,000 point/s
Power consumption8 W
Vertical perspective−15°–+15°Voltage9–18 V
Vertical angular resolutionWorking temperature−10 °C–+60 °C
Table 4. Extraction errors and accuracy of different methods.
PlotMethodAbsolute Error (cm)Root Mean Square Error (cm)Relative Accuracy (%)
MaxMinMean
1RANSAC16.750.204.215.4882.20
OLS12.370.103.274.2886.10
IWLS8.510.032.993.6588.12
2RANSAC11.400.022.843.9783.37
OLS3.290.231.481.7192.82
IWLS2.890.021.281.4893.80
3RANSAC13.060.124.005.0582.57
OLS8.310.063.213.7786.98
IWLS7.880.002.983.4888.00
4RANSAC7.270.724.124.5281.32
OLS6.030.102.653.0587.41
IWLS3.900.212.392.6389.15
Table 5. Extraction error and precision of different methods in each diameter group.
PlotMethodMean Absolute Error (cm)Root Mean Square Error (cm)Relative Accuracy (%)
ABCABCABC
1RANSAC1.964.933.742.376.354.2988.2678.2089.96
OLS1.803.224.462.333.856.0888.4786.7986.77
IWLS1.973.063.492.363.594.4888.2987.6789.51
2RANSAC3.462.12-1.302.84-93.4989.95-
OLS1.251.75-1.441.98-92.8192.98-
IWLS1.121.47-1.301.66-93.4994.14-
3RANSAC2.804.494.713.365.446.2682.4881.8685.76
OLS2.603.284.152.953.774.9584.6287.4388.73
IWLS2.502.914.042.773.404.6785.5888.6689.36
4RANSAC4.133.795.454.544.175.6276.8983.8688.66
OLS2.482.125.922.642.615.9286.5389.8988.05
IWLS2.511.933.462.652.323.4686.4891.0593.02
Overall meanRANSAC3.093.834.632.894.705.3985.2883.4788.13
OLS2.032.594.842.343.055.6588.1189.2787.85
IWLS2.032.343.662.272.744.2088.4690.3890.63
Note: A, B, and C indicate different diameter groups, according to the size of the diameter at breast height (DBH) values. ‘-’ indicates that there are no trees belonging to this size group in the sample.
Disclaimer/Publisher’s Note: The statements, opinions and data contained in all publications are solely those of the individual author(s) and contributor(s) and not of MDPI and/or the editor(s). MDPI and/or the editor(s) disclaim responsibility for any injury to people or property resulting from any ideas, methods, instructions or products referred to in the content.

