
Ecosystem Services Value Realization and Ecological Industry Design in Scenic Areas of Karst in South China


Abstract
1. Introduction
2. Materials and Methods
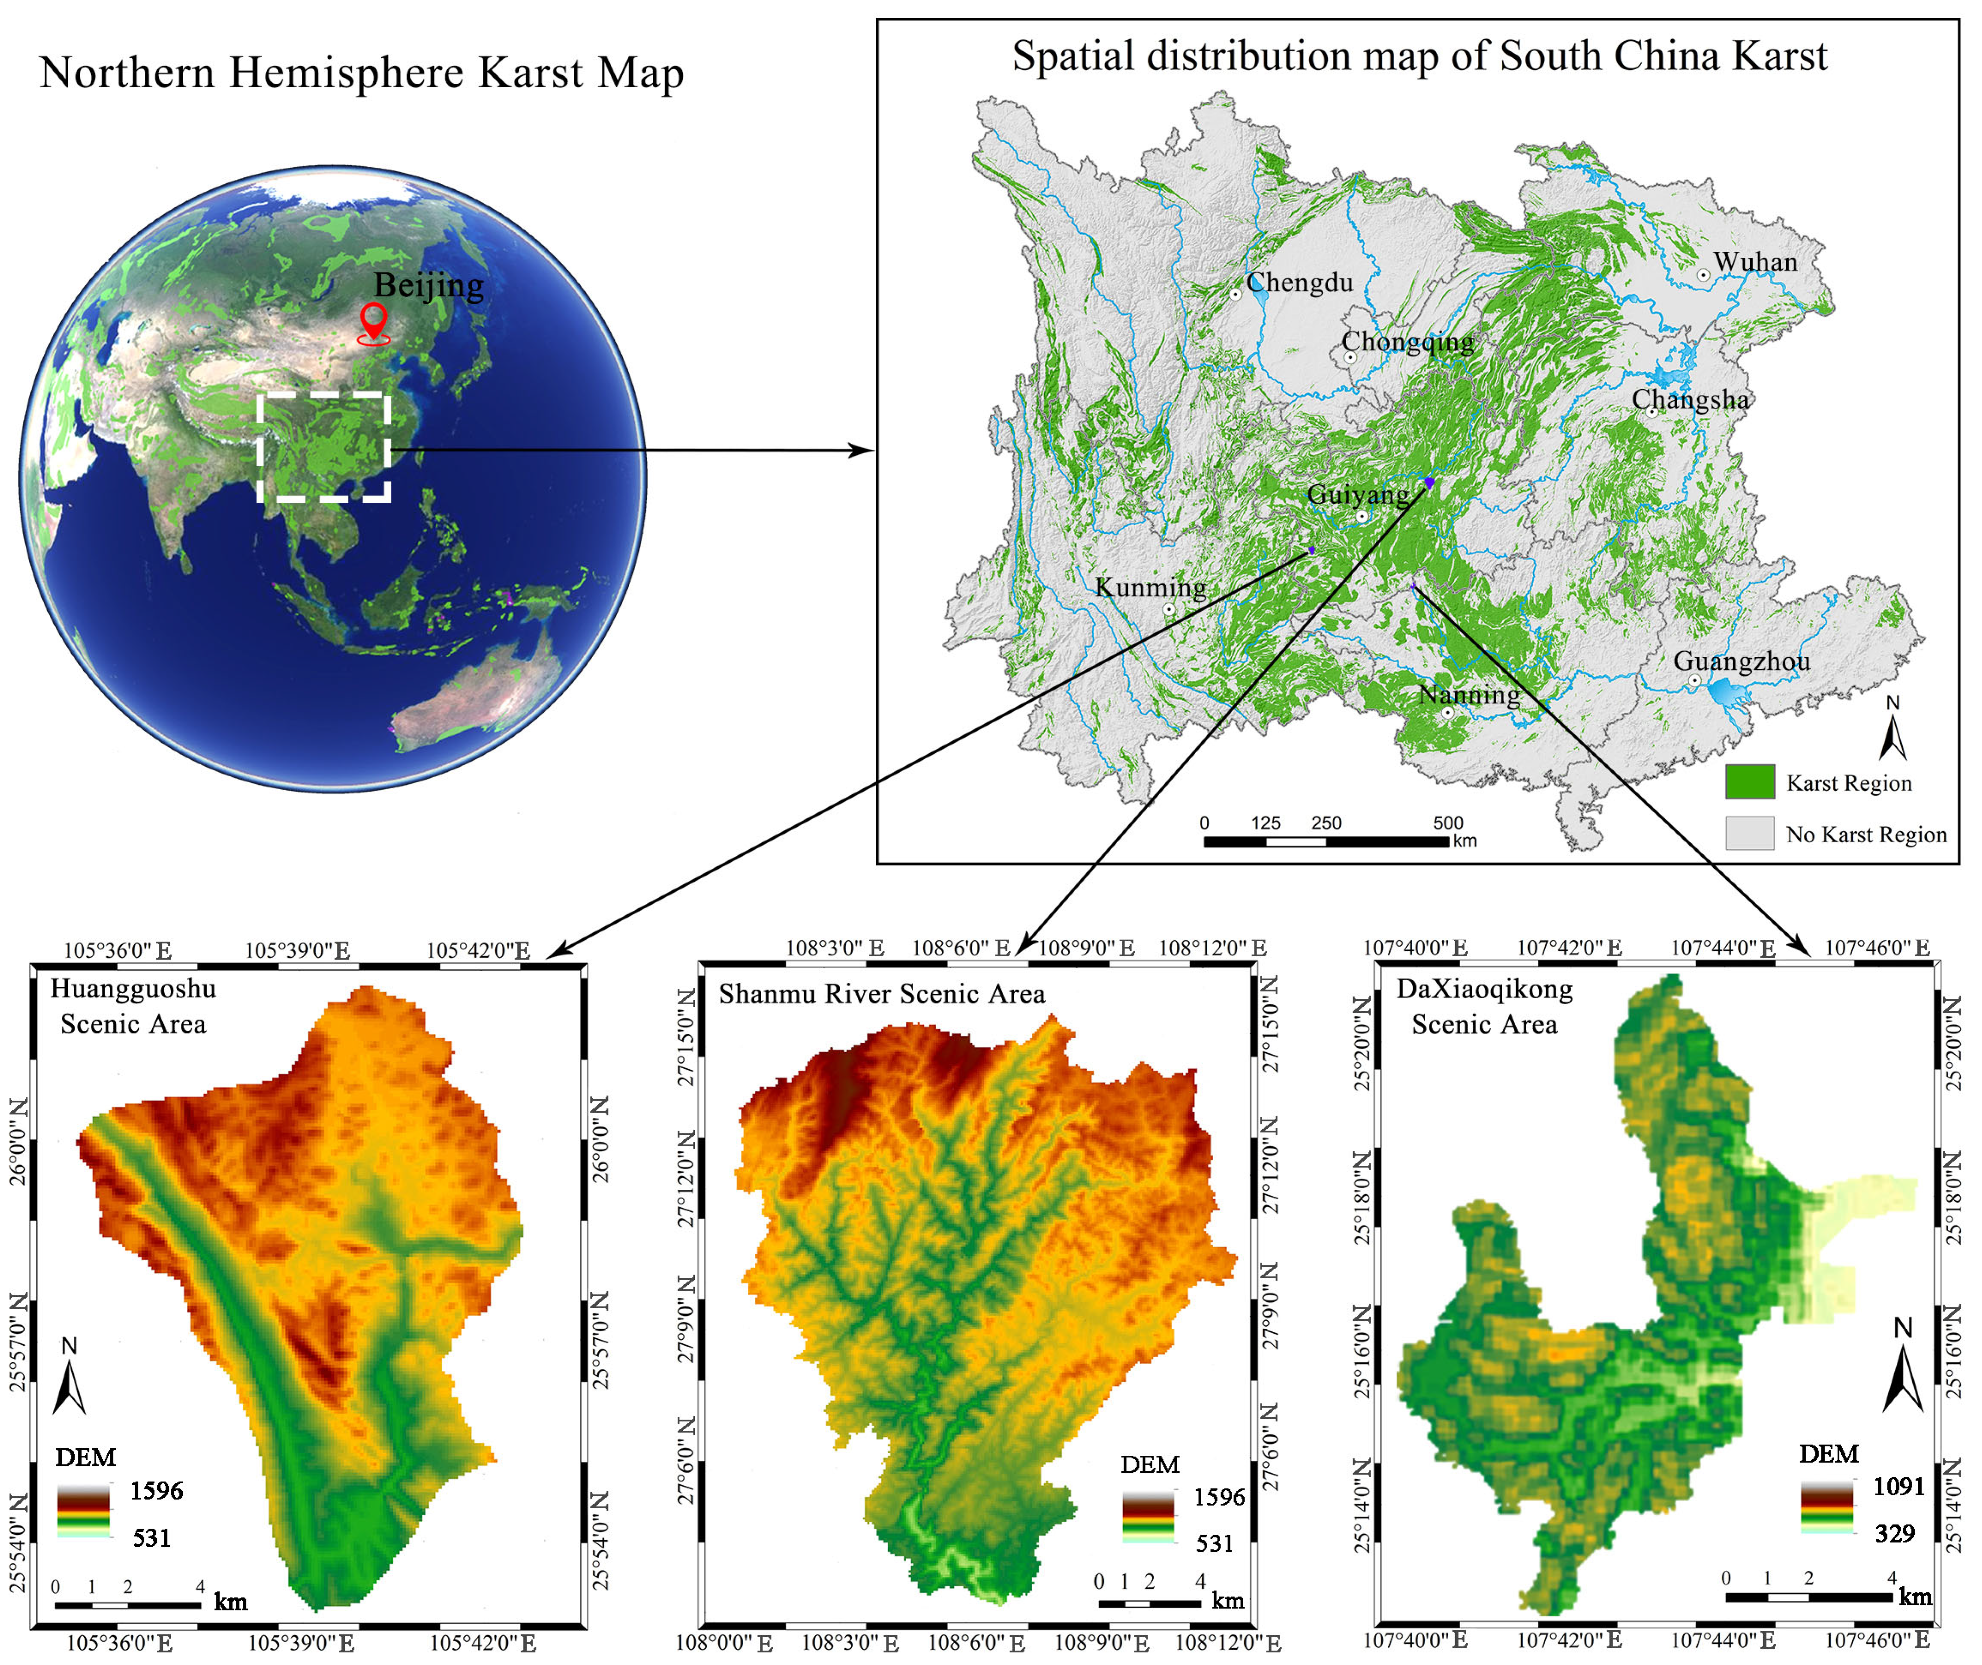
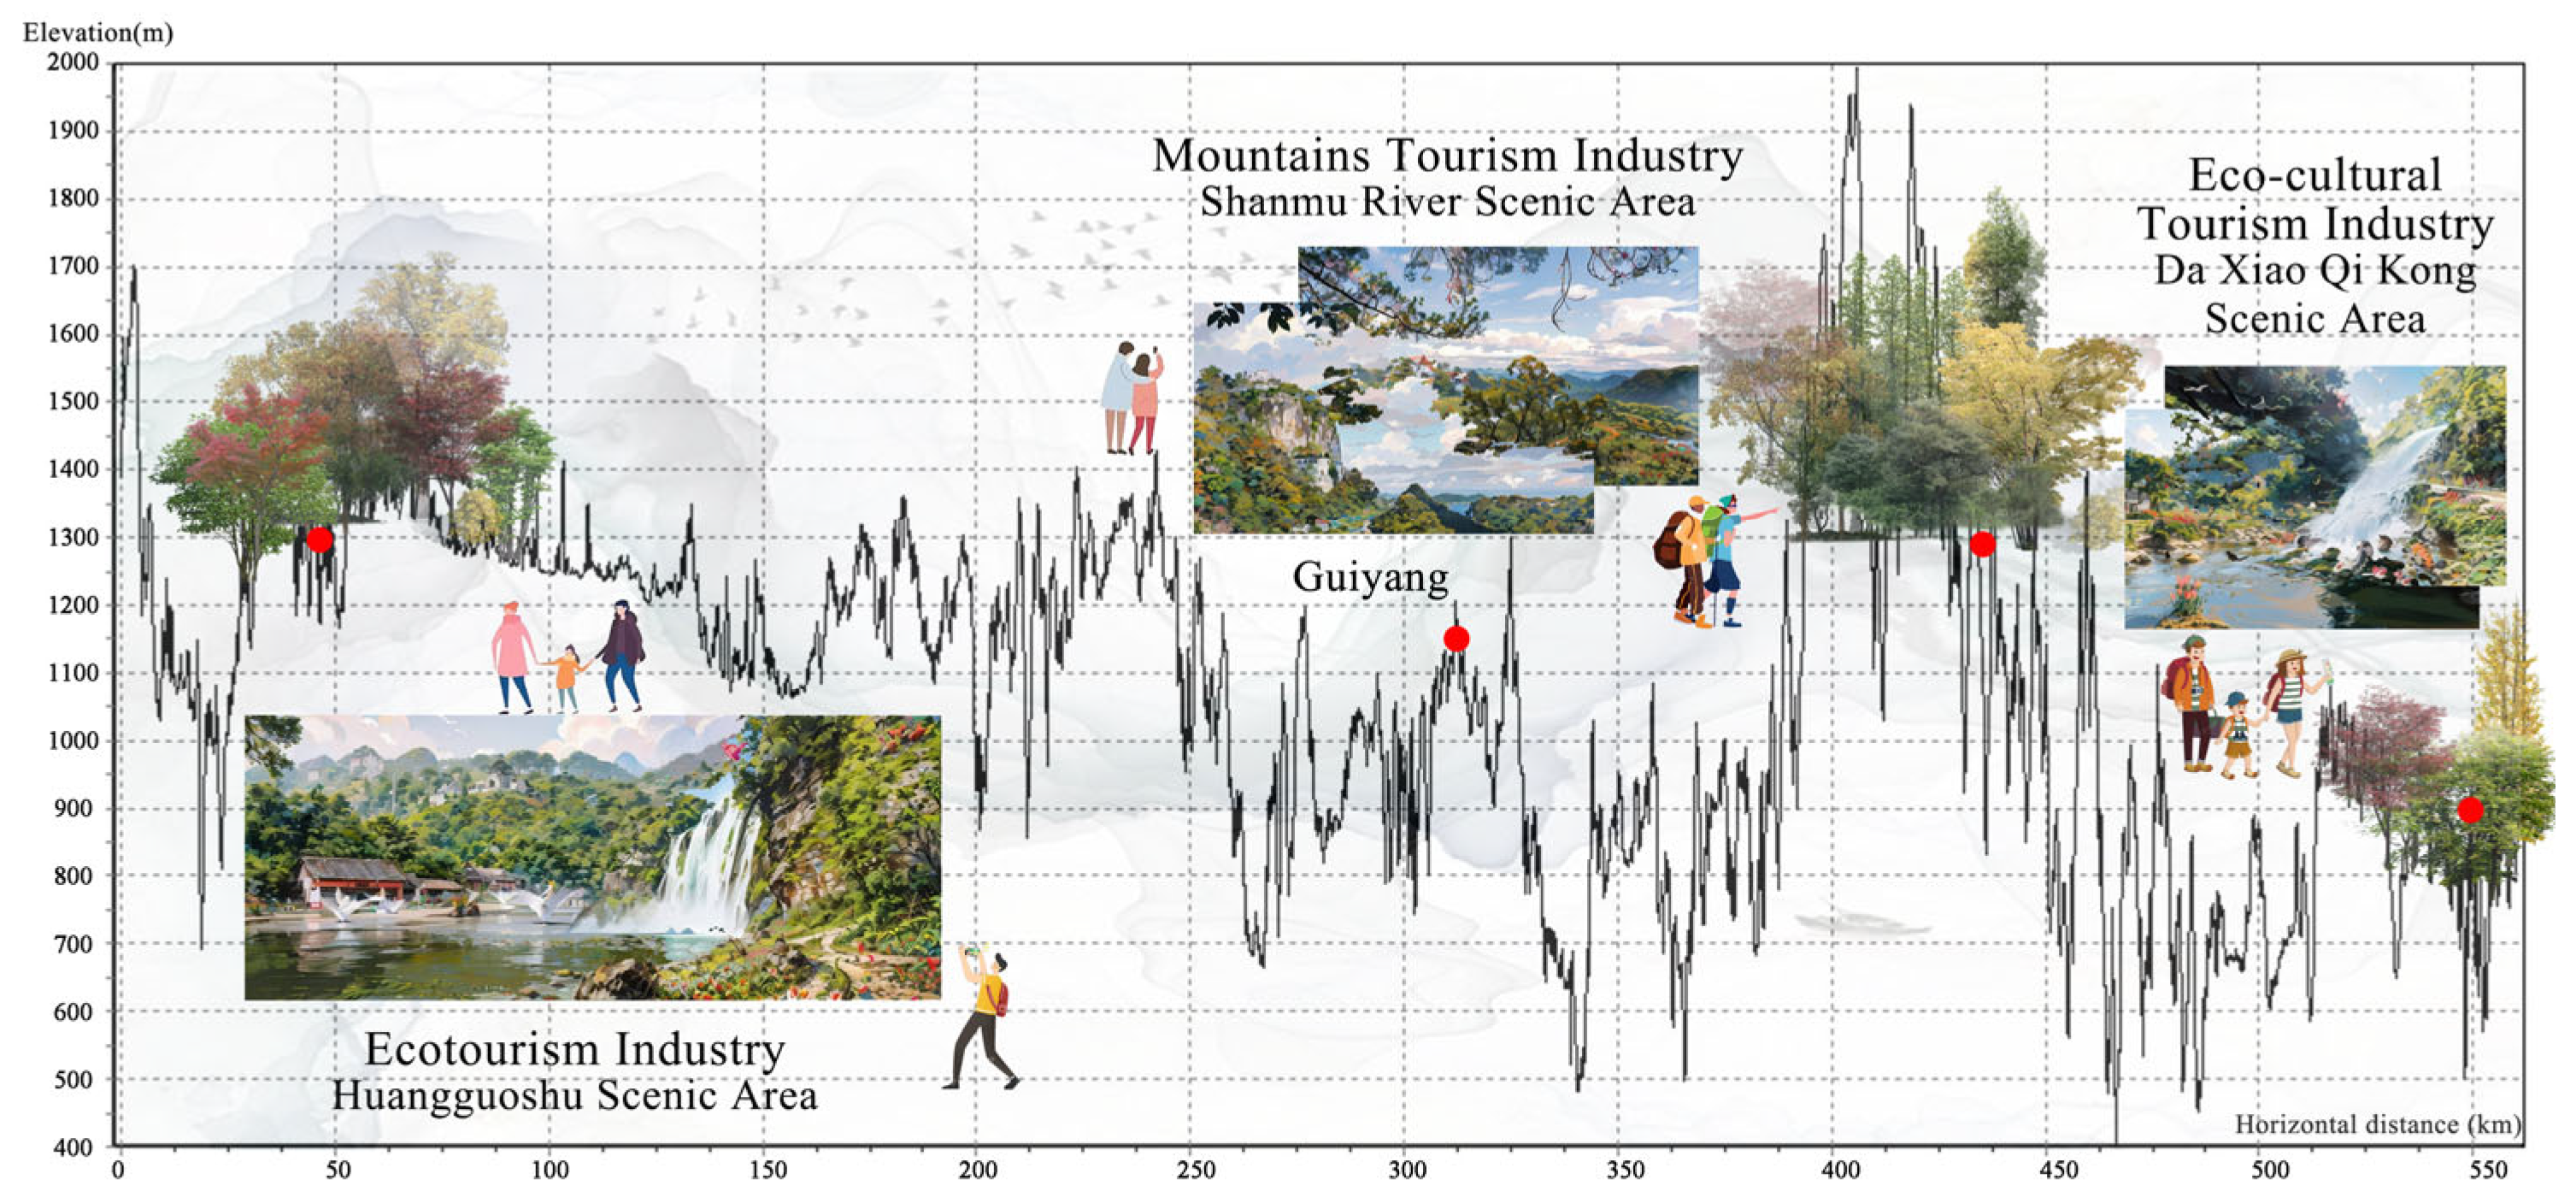
2.1. Study Area
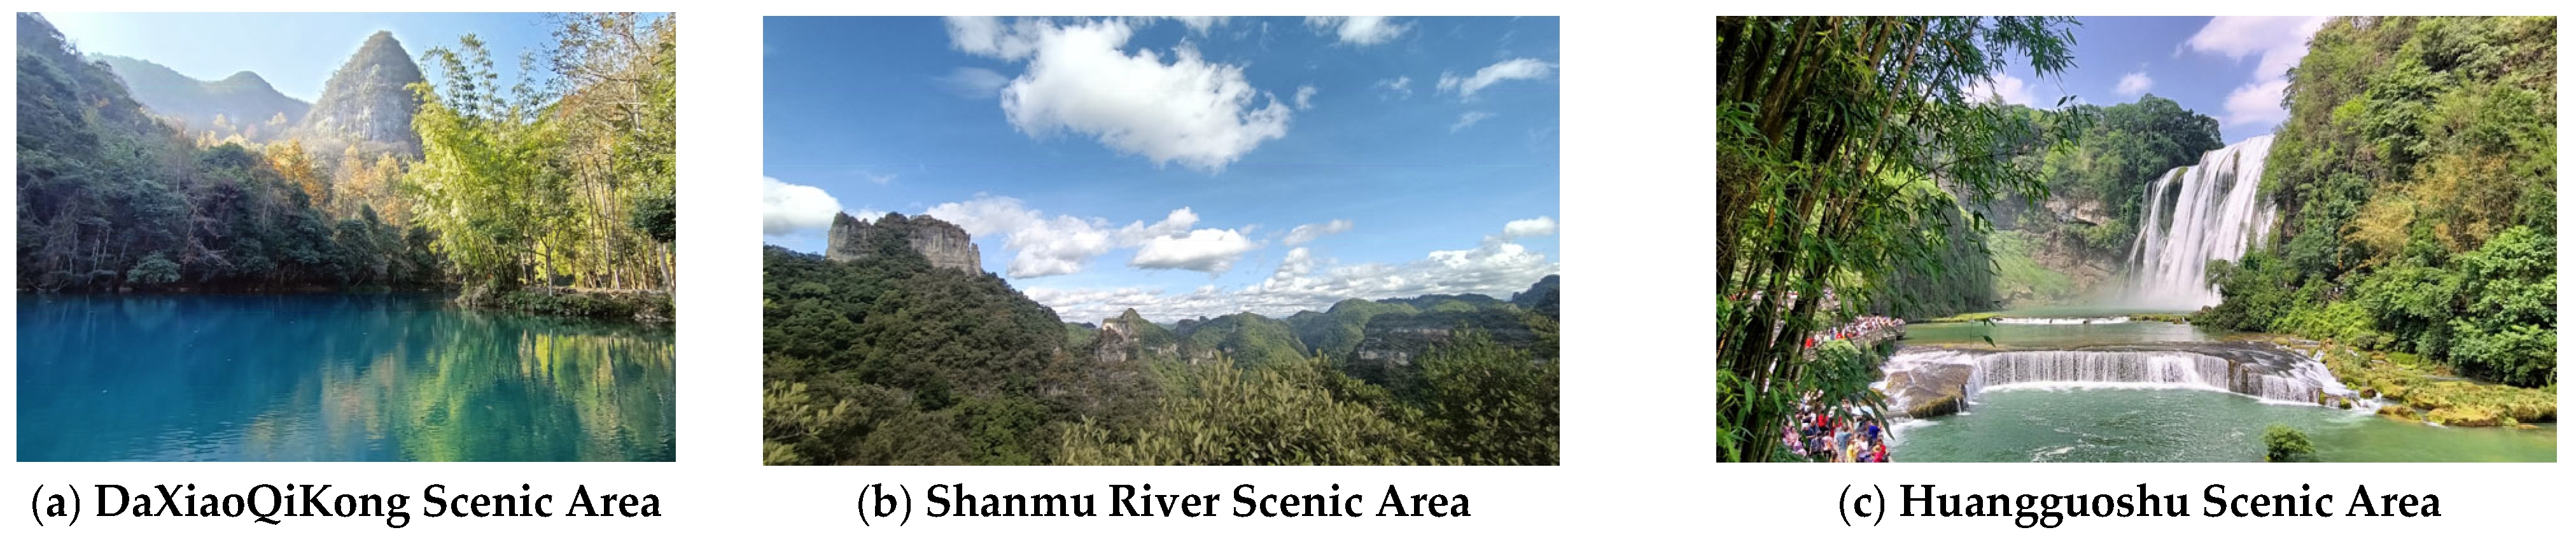
- Libo Zhangjiang National Scenic Area, Da Qi Kong Scenic Area—Xiao Qi Kong Scenic Area (DaXiaoQiKong Scenic Area)
- 2.
- Wuyang River National Scenic Area, Yuntai Mountain Scenic Area, Shanmu River Scenic Area, and Water Source Ecological Reserve (Shanmu River Scenic Area)
- 3.
- Huangguoshu National Waterfalls Scenic Area (Huangguoshu Scenic Area)
2.2. Research Methods
2.2.1. Spatial Analysis Method
2.2.2. Equivalent Factor Method
2.2.3. Web Text Data Mining
2.2.4. PEFI Model
3. Results
3.1. Total Spatial EPV
3.1.1. Accounting Indicators for the EPV in Scenic Areas
3.1.2. Unit Area EPV
3.1.3. Identification of Landscape Values
3.2. Anatomy of a PEFI Model Based on Landscape Perception
3.2.1. Landscape Sensing Data Processing
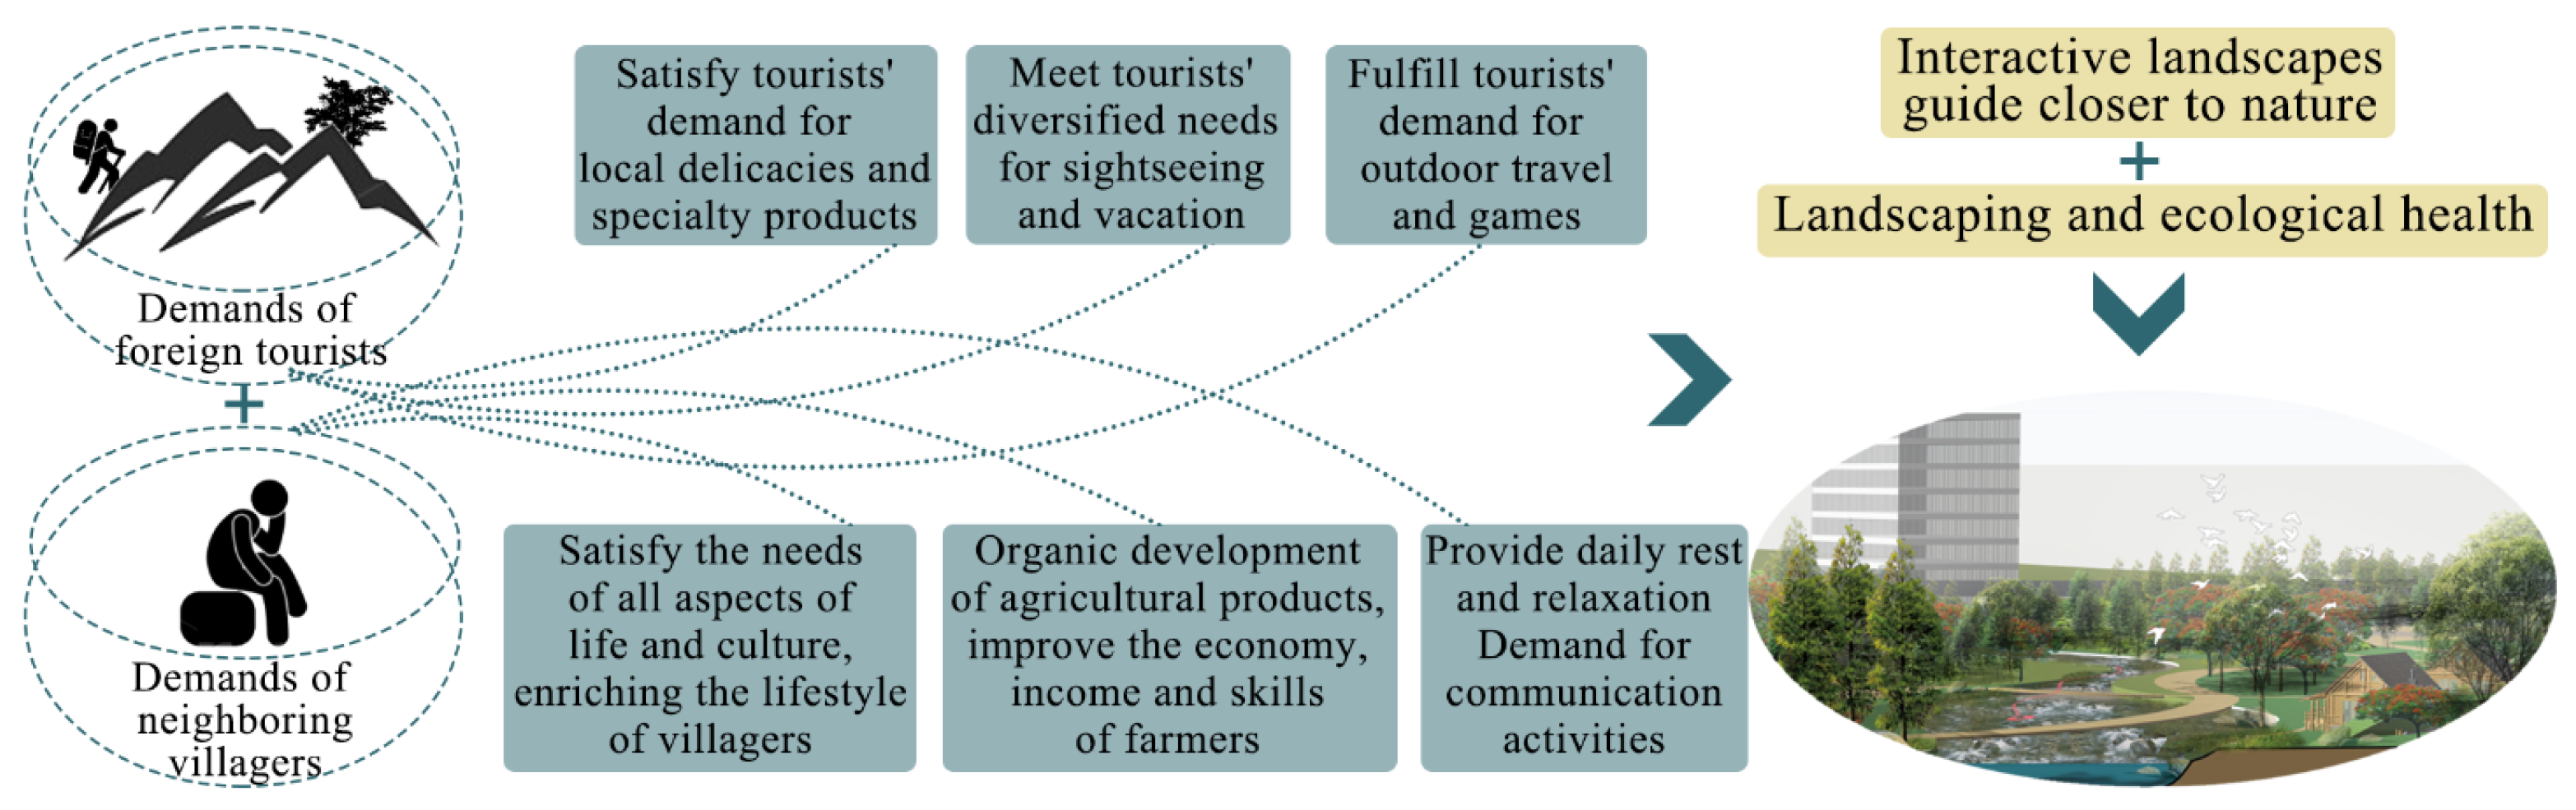
3.2.2. Analysis of the PEFI Model’s Application
- Eco-Products (Product)
- 2.
- Tourist Experience (Experience)
- 3.
- Information Feedback (Feedback)
- 4.
- Improvement of Absorption (Improvement)
4. Discussion
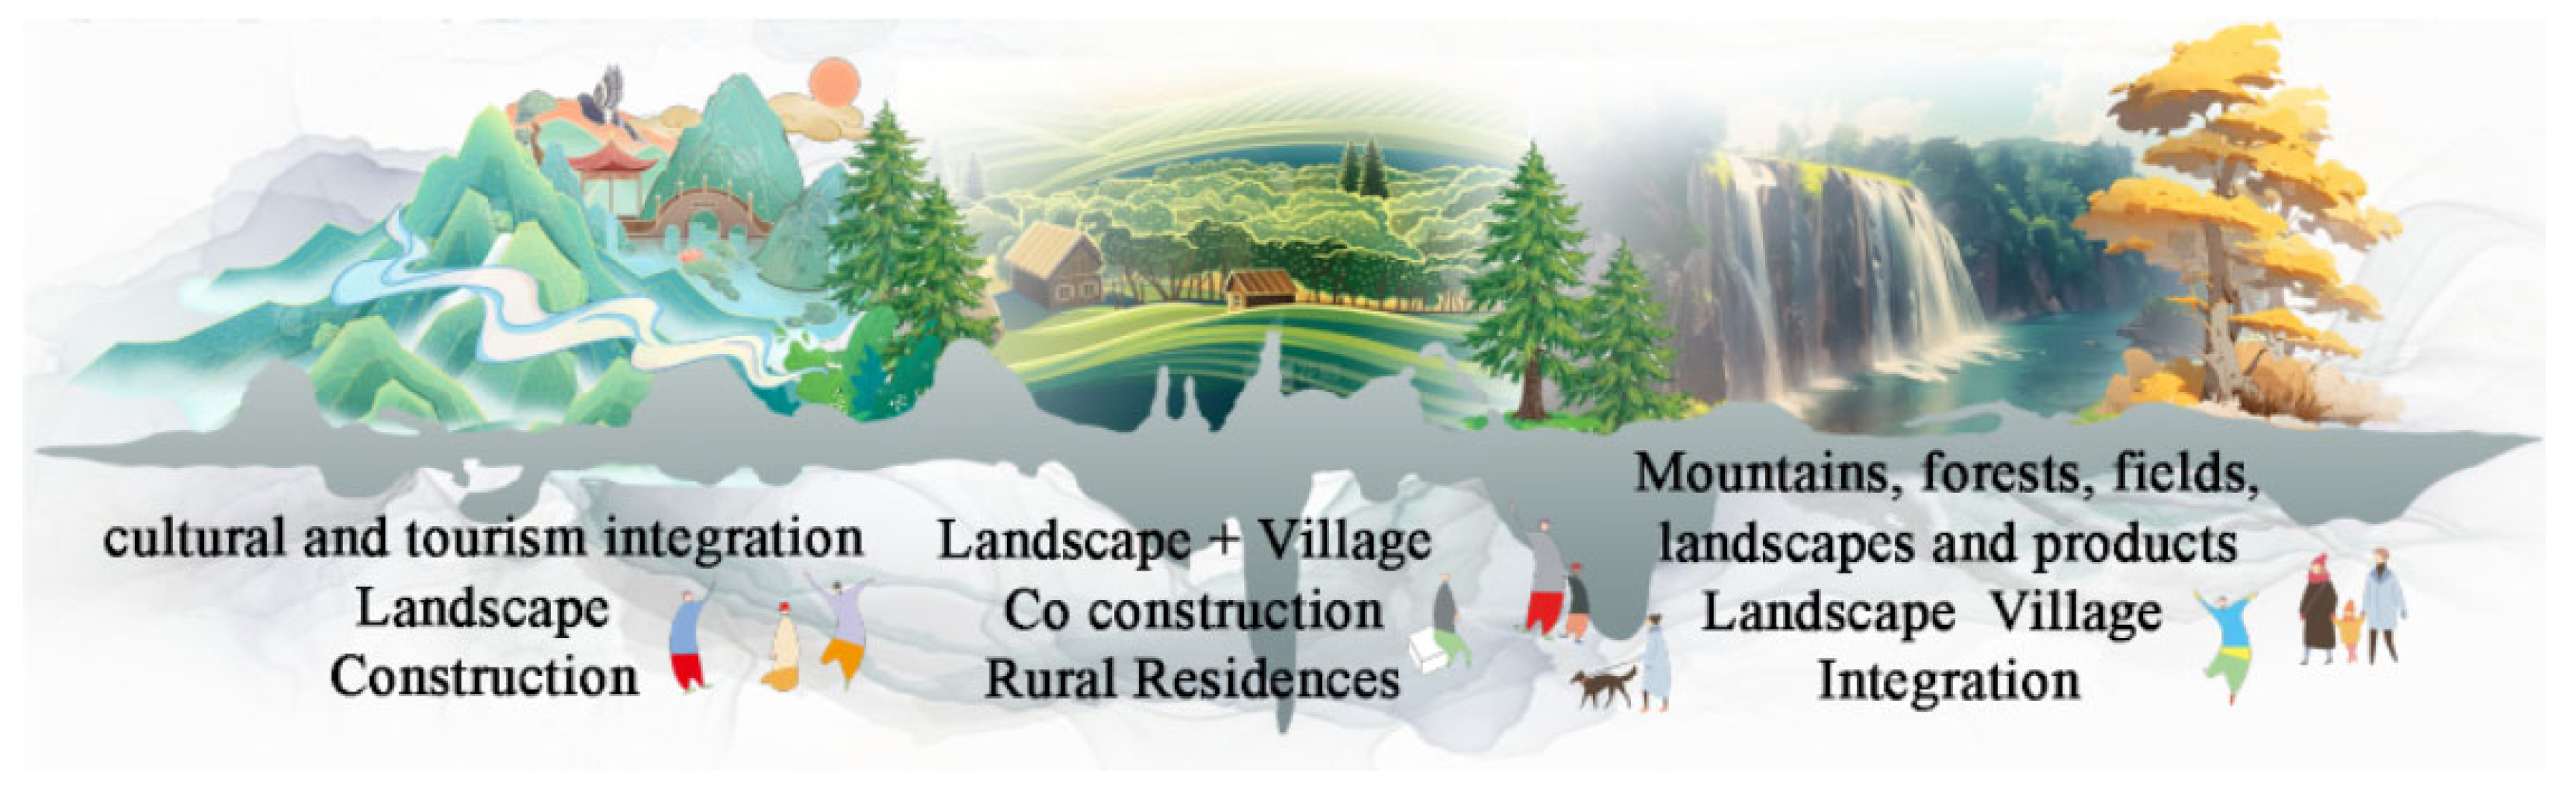
4.1. ”Staggered Development” Strategy
4.2. Territorial Development and Industrial Clustering
5. Conclusions
Author Contributions
Funding
Data Availability Statement
Acknowledgments
Conflicts of Interest
References
- Li, L.; Qian, Y.; Yan, W. Research on the Evaluation Index System for Ecological Civilizaion Construction in Major Function Zoning. J. Cent. South Univ. For. Technol. (Soc. Sci.) 2021, 15, 1–8. [Google Scholar] [CrossRef]
- Costanza, R.; d’Arge, R.; de Groot, R.; Farber, S.; Grasso, M.; Hannon, B.; Limburg, K.; Naeem, S.; O’Neill, R.V.; Paruelo, J.; et al. The value of the world’s ecosystem services and natural capital. Ecol. Econ. 1998, 25, 3–15. [Google Scholar] [CrossRef]
- Alcamo, J.; Bennett, E. Ecosystems and Human Well-Being: A Framework for Assessment; Island Press: Washington, DC, USA, 2003; pp. xiv, 245. [Google Scholar]
- Ehrlich, P.R.; Ehrlich, A.H.; Daily, G.C. Food Security, Population, and Environment. Popul. Dev. Rev. 1993, 19, 1. [Google Scholar] [CrossRef]
- Daily, G.C.; Matson, P.A. Ecosystem services: From theory to implementation. Proc. Natl. Acad. Sci. USA 2008, 105, 9455–9456. [Google Scholar] [CrossRef] [PubMed]
- Daily, G.C. The Future of Nature’s Services: Societal Dependence on Natural Ecosystems (1997). In The Future of Nature; Yale University Press: Yale, CT, USA, 2013; pp. 454–464. [Google Scholar] [CrossRef]
- Zhang, Z.; Xiong, K.; Huang, D.; Zhang, W.; Chang, H. Spatial Zoning of the Value Realization Models for Ecological Products in Shibing Karst Natural World Heritage Site. Forests 2023, 14, 1449. [Google Scholar] [CrossRef]
- Wang, N.; Xu, C.Y.; Kong, F.B. Value Realization and Optimization Path of Forest Ecological Products—Case Study from Zhejiang Province, China. Int. J. Environ. Res. Public Health 2022, 19, 7538. [Google Scholar] [CrossRef]
- Zeng, D.Z.; Cheng, L.; Shi, L.; Luetkenhorst, W. China’s green transformation through eco-industrial parks. World Dev. 2021, 140, 105249. [Google Scholar] [CrossRef]
- Qian, W.; Tilt, C.; Belal, A. Social and environmental accounting in developing countries: Contextual challenges and insights. Account. Audit. Account. J. 2021, 34, 1021–1050. [Google Scholar] [CrossRef]
- Xu, Y.; Zhao, W.; Zhang, Z. The practice of nature-based solutions in China: Ecosystem product value realization. Curr. Opin. Environ. Sci. Health 2023, 36, 100514. [Google Scholar] [CrossRef]
- Li, Z. A Study of Measuring Ecological Values and Mechanism of Realization. J. Shanxi Norm. Univ. (Soc. Sci. Ed.) 2022, 49, 43–52. [Google Scholar] [CrossRef]
- Zhang, Y.; Ma, Z.; Sun, M.; Song, J.; Yang, Y.; Li, Q.; Jing, Y. Quantitatively Evaluating the Ecological Product Value of Nine Provinces in the Yellow River Basin from the Perspective of the Dual-Carbon Strategy. Land 2023, 12, 516. [Google Scholar] [CrossRef]
- Bourassa, S.C. Toward a theory of landscape aesthetics. Landsc. Urban Plan. 1988, 15, 241–252. [Google Scholar] [CrossRef]
- Fu, B.; Chen, L.; Ma, K.; Wang, Y.L. Landscape Ecology Theory and Application; Science Press: Beijing, China, 2002. [Google Scholar]
- Turner, M.G. Landscape ecology in North America: Past, present, and future. Ecol. Soc. 2005, 86, 1967–1974. [Google Scholar] [CrossRef]
- Jun, B.; Kim, I.; Shin, J.; Kwon, H. Development of landscape conservation value map of Jeju island, Korea for integrative landscape management and planning using conservation value of landscape typology. PeerJ 2021, 9, e11449. [Google Scholar] [CrossRef]
- Dong, R.; Sun, X.; Han, L.; Weng, C.; Wang, C.; Zhang, Y.; Ma, H.; Liu, W.; Li, S.; Yu, T.; et al. The discussion on facilitating the value realization methods of ecological products based on the Landsenses ecology. Acta Ecol. Sin. 2023, 43, 7660–7669. [Google Scholar] [CrossRef]
- Wartmann, F.M.; Stride, C.; Kienast, F.; Hunziker, M. Relating landscape ecological metrics with public survey data on perceived landscape quality and place attachment. Landsc. Ecol. 2021, 36, 2367–2393. [Google Scholar] [CrossRef]
- Dong, J.; Jiang, H.; Gu, T.; Liu, Y.; Peng, J. Sustainable landscape pattern: A landscape approach to serving spatial planning. Landsc. Ecol. 2022, 37, 31–42. [Google Scholar] [CrossRef]
- Wang, K.; Zhang, C.; Chen, H.; Yue, Y.; Zhang, W.; Zhang, M.; Qi, X.; Fu, Z. Karst landscapes of China: Patterns, ecosystem processes and services. Landsc. Ecol. 2019, 34, 2743–2763. [Google Scholar] [CrossRef]
- Nazik, L.; Poyraz, M.; Karabiyikoglu, M. Karstic Landscapes and Landforms in Turkey. In Landscapes and Landforms of Turkey; Springer: Berlin/Heidelberg, Germany, 2019; pp. 181–196. [Google Scholar]
- Opdyke, N.D.; Spangler, D.P.; Smith, D.L.; Jones, D.S.; Lindquist, R.C. Origin of the epeirogenic uplift of Pliocene-Pleistocene beach ridges in Florida and development of the Florida karst. Geology 1984, 12, 226–228. [Google Scholar] [CrossRef]
- Xiong, K.; Li, G.; Wang, L. Study on the Protection and Sustainable Development of South China Karst Libo World Natural Heritage Site. Chin. Landsc. Archit. 2012, 28, 66–71. [Google Scholar] [CrossRef]
- Yang, Y.; Xiong, K.; Huang, H.; Xiao, J.; Yang, B.; Zhang, Y. A Commented Review of Eco-Product Value Realization and Ecological Industry and Its Enlightenment for Agroforestry Ecosystem Services in the Karst Ecological Restoration. Forests 2023, 14, 448. [Google Scholar] [CrossRef]
- Pickett, S.T.; Cadenasso, M.L. Landscape ecology: Spatial heterogeneity in ecological systems. Science 1995, 269, 331–334. [Google Scholar] [CrossRef] [PubMed]
- Ren, Y.; Wei, X.; Wang, D.; Luo, Y.; Song, X.; Wang, Y.; Yang, Y.; Hua, L. Linking landscape patterns with ecological functions: A case study examining the interaction between landscape heterogeneity and carbon stock of urban forests in Xiamen, China. For. Ecol. Manag. 2013, 293, 122–131. [Google Scholar] [CrossRef]
- Xie, G.; Lu, C.; Leng, Y.; Zheng, D.; Li, S. Ecological assets valuation of the Tibetan Plateau. J. Nat. Resour. 2003, 2, 189–196. [Google Scholar] [CrossRef]
- Liberati, M.R.; Sowa, S.P.; May, C.A.; Doran, P.J. Making measures count: Structured indicator selection to improve program success. Environ. Sustain. Indic. 2020, 8, 100077. [Google Scholar] [CrossRef]
- Huang, K. Big Data Based Optimization of Rural Ecotourism Industry Structure for a Smart City. J. Test. Eval. 2022, 51, 1361–1374. [Google Scholar] [CrossRef]
- Xu, Y.; Huang, W.; Ming, Y. Research on the Value Co-creation Model and Realization Mechanism of Tourist Attractions—A Case Study of Longi Terrace Scenic Spot in Guilin. J. Guilin Univ. Technol. 2023, 2. Available online: http://kns.cnki.net/kcms/detail/45.1375.N.20230530.1328.004.html (accessed on 8 February 2024).
- Liao, L.Y.; Fu, T.Q.; Wu, Y.P.; Lan, S.R. Optimization of Municipal Protected Area System Based on Ecosystem Services Assessment: A Case Study of Fuzhou City. Landsc. Archit. 2022, 29, 80–85. [Google Scholar] [CrossRef]
- Xie, G.; Zhang, C.; Zhang, L.; Chen, W.; Li, S. Improvement of the Evaluation Method for Ecosystem Service Value Based on Per Unit Area. J. Nat. Resour. 2015, 30, 1243–1254. [Google Scholar] [CrossRef]
- Yang, H.; Gou, X.; Ma, W.; Tang, C.; Xue, B. The progress of value assessment of forest ecosystem services in China in recent ten years. Chin. J. Ecol. 2023, 5. Available online: http://kns.cnki.net/kcms/detail/21.1148.Q.20230714.1044.002.html (accessed on 8 February 2024).
- Xie, G.; Zhang, C.; Zhen, L.; Zhang, L. Dynamic changes in the value of China’s ecosystem services. Ecosyst. Serv. 2017, 26, 146–154. [Google Scholar] [CrossRef]
- Wang, J.N.; Wang, Z.K.; Liu, G.H.; Ma, G.X.; Wang, X.H.; Zhao, Y.H.; Cheng, L.; Wen, Y.H.; Yu, F.; Yang, W. A framework research of theory and its practice of the fourth industry of ecological products. Chin. J. Environ. Manag. 2021, 13, 5–13. [Google Scholar] [CrossRef]
- Stein, A.; Riley, J.; Halberg, N. Issues of scale for environmental indicators. Agric. Ecosyst. Environ. 2001, 87, 215–232. [Google Scholar] [CrossRef]
- Zhao, Y.; Jiao, L. Resources development and tourism environmental carrying capacity of ecotourism industry in Pingdingshan City, China. Ecol. Process. 2019, 8, 7. [Google Scholar] [CrossRef]
- Cao, S.; Liu, Z.; Li, W.; Xian, J. Balancing ecological conservation with socioeconomic development. Ambio 2021, 50, 1117–1122. [Google Scholar] [CrossRef] [PubMed]
- Gao, J.; Wu, B. Revitalizing traditional villages through rural tourism: A case study of Yuanjia Village, Shaanxi Province, China. Tour. Manag. 2017, 63, 223–233. [Google Scholar] [CrossRef]
- Smardon, R. Ecosystem Services for Scenic Quality Landscape Management: A Review. Land 2021, 10, 1123. [Google Scholar] [CrossRef]
- Zhan, K.; Xu, S.; Ren, W. Research on Landscape Perception of Urban Parks based on Online Comments. Chin. Overseas Archit. 2023, 8. [Google Scholar] [CrossRef]
- Hlee, S.; Lee, H.; Koo, C. Hospitality and Tourism Online Review Research: A Systematic Analysis and Heuristic-Systematic Model. Sustainability 2018, 10, 1141. [Google Scholar] [CrossRef]
- Li, J.; Xu, L.; Tang, L.; Wang, S.; Li, L. Big data in tourism research: A literature review. Tour. Manag. 2018, 68, 301–323. [Google Scholar] [CrossRef]
- Butler, R.W. Tourism, environment, and sustainable development. Environ. Conserv. 1991, 18, 201–209. [Google Scholar] [CrossRef]
- Conway, T.; Cawley, M. Defining ecotourism: Evidence of provider perspectives from an emerging area. J. Ecotourism 2016, 15, 122–138. [Google Scholar] [CrossRef]
- Han, H. Consumer behavior and environmental sustainability in tourism and hospitality: A review of theories, concepts, and latest research. J. Sustain. Tour. 2021, 29, 1021–1042. [Google Scholar] [CrossRef]
- Richards, G. The traditional quantitative approach. surveying cultural tourists: Lessons from the ATLAS cultural tourism research project. Cult. Tour. Res. Methods 2010, 21, 13–32. [Google Scholar] [CrossRef]
- Zhou, P. Tourism Development Modes and Development Experience with Chinese Characteristics. In The Theory and Practice of China’s Tourism Economy (1978–2017); Zhou, P., Ed.; Springer: Singapore, 2019; pp. 81–98. [Google Scholar]
- Li, X.; Li, M.; Wu, Y. Research on effects of integration of primary, secondary, and tertiary industries in rural areas of developing countries: An approach of rural capital subsidies. Asia-Pac. J. Account. Econ. 2023, 13. [Google Scholar] [CrossRef]
- Signes, E.; Calvo Palomares, R.; Merino, B.; García-Adán, I. Transition towards a tourist innovation model: The smart tourism destination. J. Innov. Knowl. 2019, 5, 99. [Google Scholar] [CrossRef]
- Feng, X. All-for-One Tourism: The Transformation and Upgrading Direction of Regional Tourism Industry. J. Soc. Sci. Res. 2017, 11, 2374–2378. [Google Scholar] [CrossRef]
- Wei, D.; Wang, Z.; Zhang, B. Traditional Village Landscape Integration Based on Social Network Analysis: A Case Study of the Yuan River Basin in South-Western China. Sustainability 2021, 13, 13319. [Google Scholar] [CrossRef]
- Qiu, Y.; Yin, J.; Zhang, T.; Du, Y.; Zhang, B. Spatiotemporal Dynamic Analysis of A-Level Scenic Spots in Guizhou Province, China. ISPRS Int. J. Geo-Inf. 2021, 10, 568. [Google Scholar] [CrossRef]
- Liu, J.; Yang, X. Research on sustainable tourism development and planning in ecotourism destinations. J. Nat. Resour. 1999, 14, 5. [Google Scholar] [CrossRef]


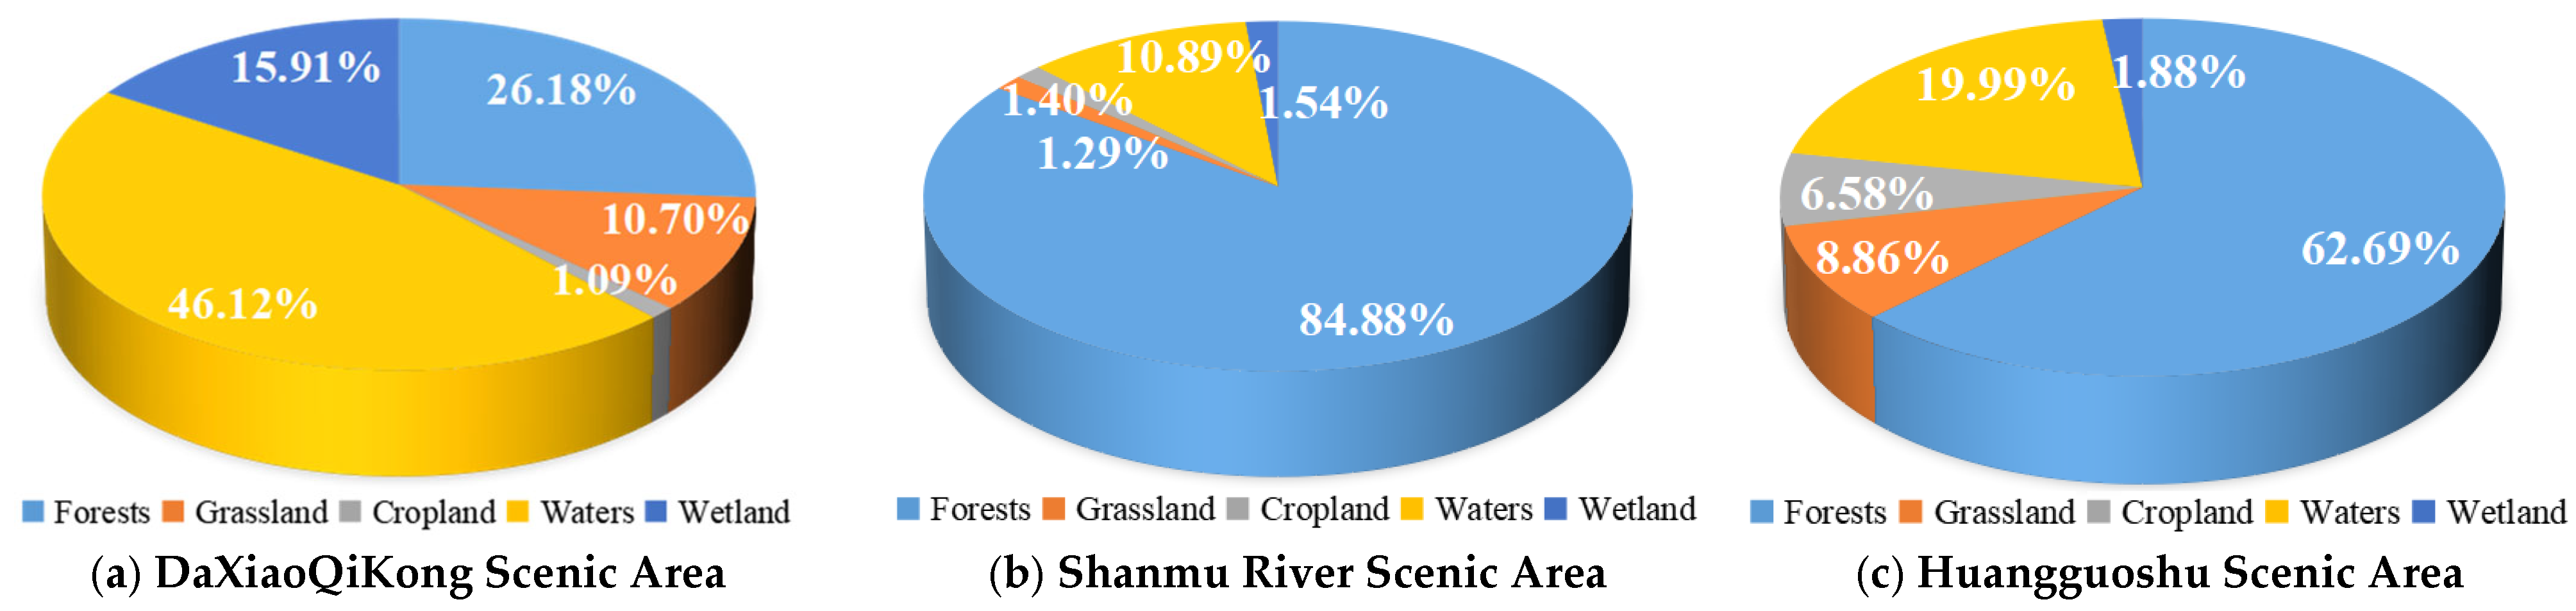
| DaXiaoQiKong Scenic Area | |||
|---|---|---|---|
| Data Acquisition | Land Use Type | Current Area (km2) | Spatial Distribution of Land Use Types |
| Time: 11–16 December 2022; Venue: DaXiaoQiKong Scenic Area, Zhangjiang Scenic Area Management Office in Libo County, China, Cultural and Tourism Bureau in Libo County, etc. | Tree forest | 21.42 |  |
| Shrubs | 17.34 | ||
| Grassland | 15.74 | ||
| Cropland | 7.86 | ||
| Water | 10.64 | ||
| Wetlands | 8.86 | ||
| Shanmu River Scenic Area | |||
| Data acquisition | Land use type | Current area (km2) | Spatial distribution of land use types |
| Time: 24–30 August 2022; 4–10 December 2022; Venue: Shanmu River Scenic Area; Shibing Karst World Heritage and Scenic Area Management Bureau: Guizhou Bashan Bingshui Tourism Development Co., Ltd.; Shibing County Cultural, Sports, Radio; Television and Tourism Bureau/Shibing County Chengguan Town Music Fountain Tourist Service Center; etc. | Tree forest | 163.422 | 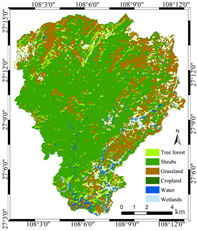 |
| Shrubs | 18.987 | ||
| Grassland | 3.403 | ||
| Cropland | 15.436 | ||
| Water | 4.151 | ||
| Wetlands | 1.415 | ||
| Huangguoshu Scenic Area | |||
| Data acquisition | Land use type | Current area (km2) | Spatial distribution of land use types |
| Time: 8–15 September 2023; Venue: Huangguoshu Scenic Area Management Committee, Huangguoshu Tourist Service Center, Huangguoshu Scenic Area, Dishuitan Waterfall, Huangguo Fruits Base, etc. | Tree forest | 33.815 | 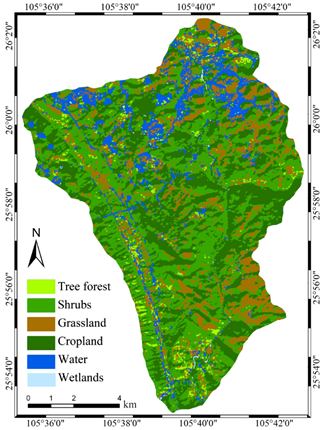 |
| Shrubs | 29.062 | ||
| Grassland | 8.784 | ||
| Cropland | 31.998 | ||
| Water | 3.105 | ||
| Wetlands | 0.705 | ||
| Ecosystems Classification | Provisioning Services | Regulating Services | Support Services | Cultural Services | ||||||||
|---|---|---|---|---|---|---|---|---|---|---|---|---|
| Primary Classification | Secondary Classification | Food Production | Raw Material Production | Water Resource Supply | Gas Regulation | Climate Regulation | Hydrological Regulation | Environmental Purification | Soil Conservation | Maintaining Nutrient Cycling | Biodiversity | Aesthetic Landscape |
| Farmland | Dry land | 0.85 | 0.40 | 0.02 | 0.67 | 0.36 | 0.27 | 0.10 | 1.03 | 0.12 | 0.13 | 0.06 |
| Paddy | 1.36 | 0.09 | −2.63 | 1.11 | 0.57 | 2.72 | 0.17 | 0.01 | 0.19 | 0.21 | 0.09 | |
| Forests | Coniferous | 0.31 | 0.71 | 0.37 | 2.35 | 7.03 | 3.51 | 1.99 | 2.86 | 0.22 | 2.60 | 1.14 |
| Shrubs | 0.19 | 0.43 | 0.22 | 1.41 | 4.23 | 3.35 | 1.28 | 1.72 | 0.13 | 1.57 | 0.69 | |
| Coniferous | 0.22 | 0.52 | 0.27 | 1.70 | 5.07 | 3.34 | 1.49 | 2.06 | 0.16 | 1.88 | 0.82 | |
| Broad leaf | 0.29 | 0.66 | 0.34 | 2.17 | 6.50 | 4.74 | 1.93 | 2.65 | 0.20 | 2.41 | 1.06 | |
| Grassland | Scrub | 0.38 | 0.56 | 0.31 | 1.97 | 5.21 | 3.82 | 1.72 | 2.40 | 0.18 | 2.18 | 0.96 |
| Meadow | 0.22 | 0.33 | 0.18 | 1.14 | 3.02 | 2.21 | 1.00 | 1.39 | 0.11 | 1.27 | 0.56 | |
| Grassland | 0.10 | 0.14 | 0.08 | 0.51 | 1.34 | 0.98 | 0.44 | 0.62 | 0.05 | 0.56 | 0.25 | |
| Water | Water | 0.80 | 0.23 | 8.29 | 0.77 | 2.29 | 102.24 | 5.55 | 0.93 | 0.07 | 2.55 | 1.89 |
| Glacial snow | 0.00 | 0.00 | 2.16 | 0.18 | 0.54 | 7.13 | 0.16 | 0.00 | 0.00 | 0.01 | 0.09 | |
| Wetlands | Wetlands | 0.51 | 0.50 | 2.59 | 1.90 | 3.60 | 24.23 | 3.60 | 2.31 | 0.18 | 7.87 | 4.73 |
| Deserts | Deserts | 0.01 | 0.03 | 0.02 | 0.11 | 0.10 | 0.21 | 0.31 | 0.13 | 0.01 | 0.12 | 0.05 |
| Bare ground | 0.00 | 0.00 | 0.00 | 0.02 | 0.00 | 0.03 | 0.10 | 0.02 | 0.00 | 0.02 | 0.01 | |
| Year | Total Production (t) | Sown Area (hm2) | Yield per Unit Area (kg/hm2) |
|---|---|---|---|
| 2020 | 376,400 | 82,837 | 4543.863 |
| 2019 | 375,500 | 81,221 | 4623.189 |
| 2018 | 381,700 | 88,977 | 4289.873 |
| 2017 | 436,600 | 109,250 | 3996.339 |
| 2016 | 437,100 | 111,767 | 3910.814 |
| Average value | 2,007,300 | 474,052 | 4234.456 |
| Provisioning Services | Regulating Services | Support Services | Cultural Services | ||||||||||
|---|---|---|---|---|---|---|---|---|---|---|---|---|---|
| Classification | Food Production | Raw Material Production | Water Resource Supply | Gas Regulation | Climate Regulation | Hydrological Regulation | Environmental Purification | Soil Conservation | Maintaining Nutrient Cycling | Biodiversity | Aesthetic Landscape | Total | Percentage |
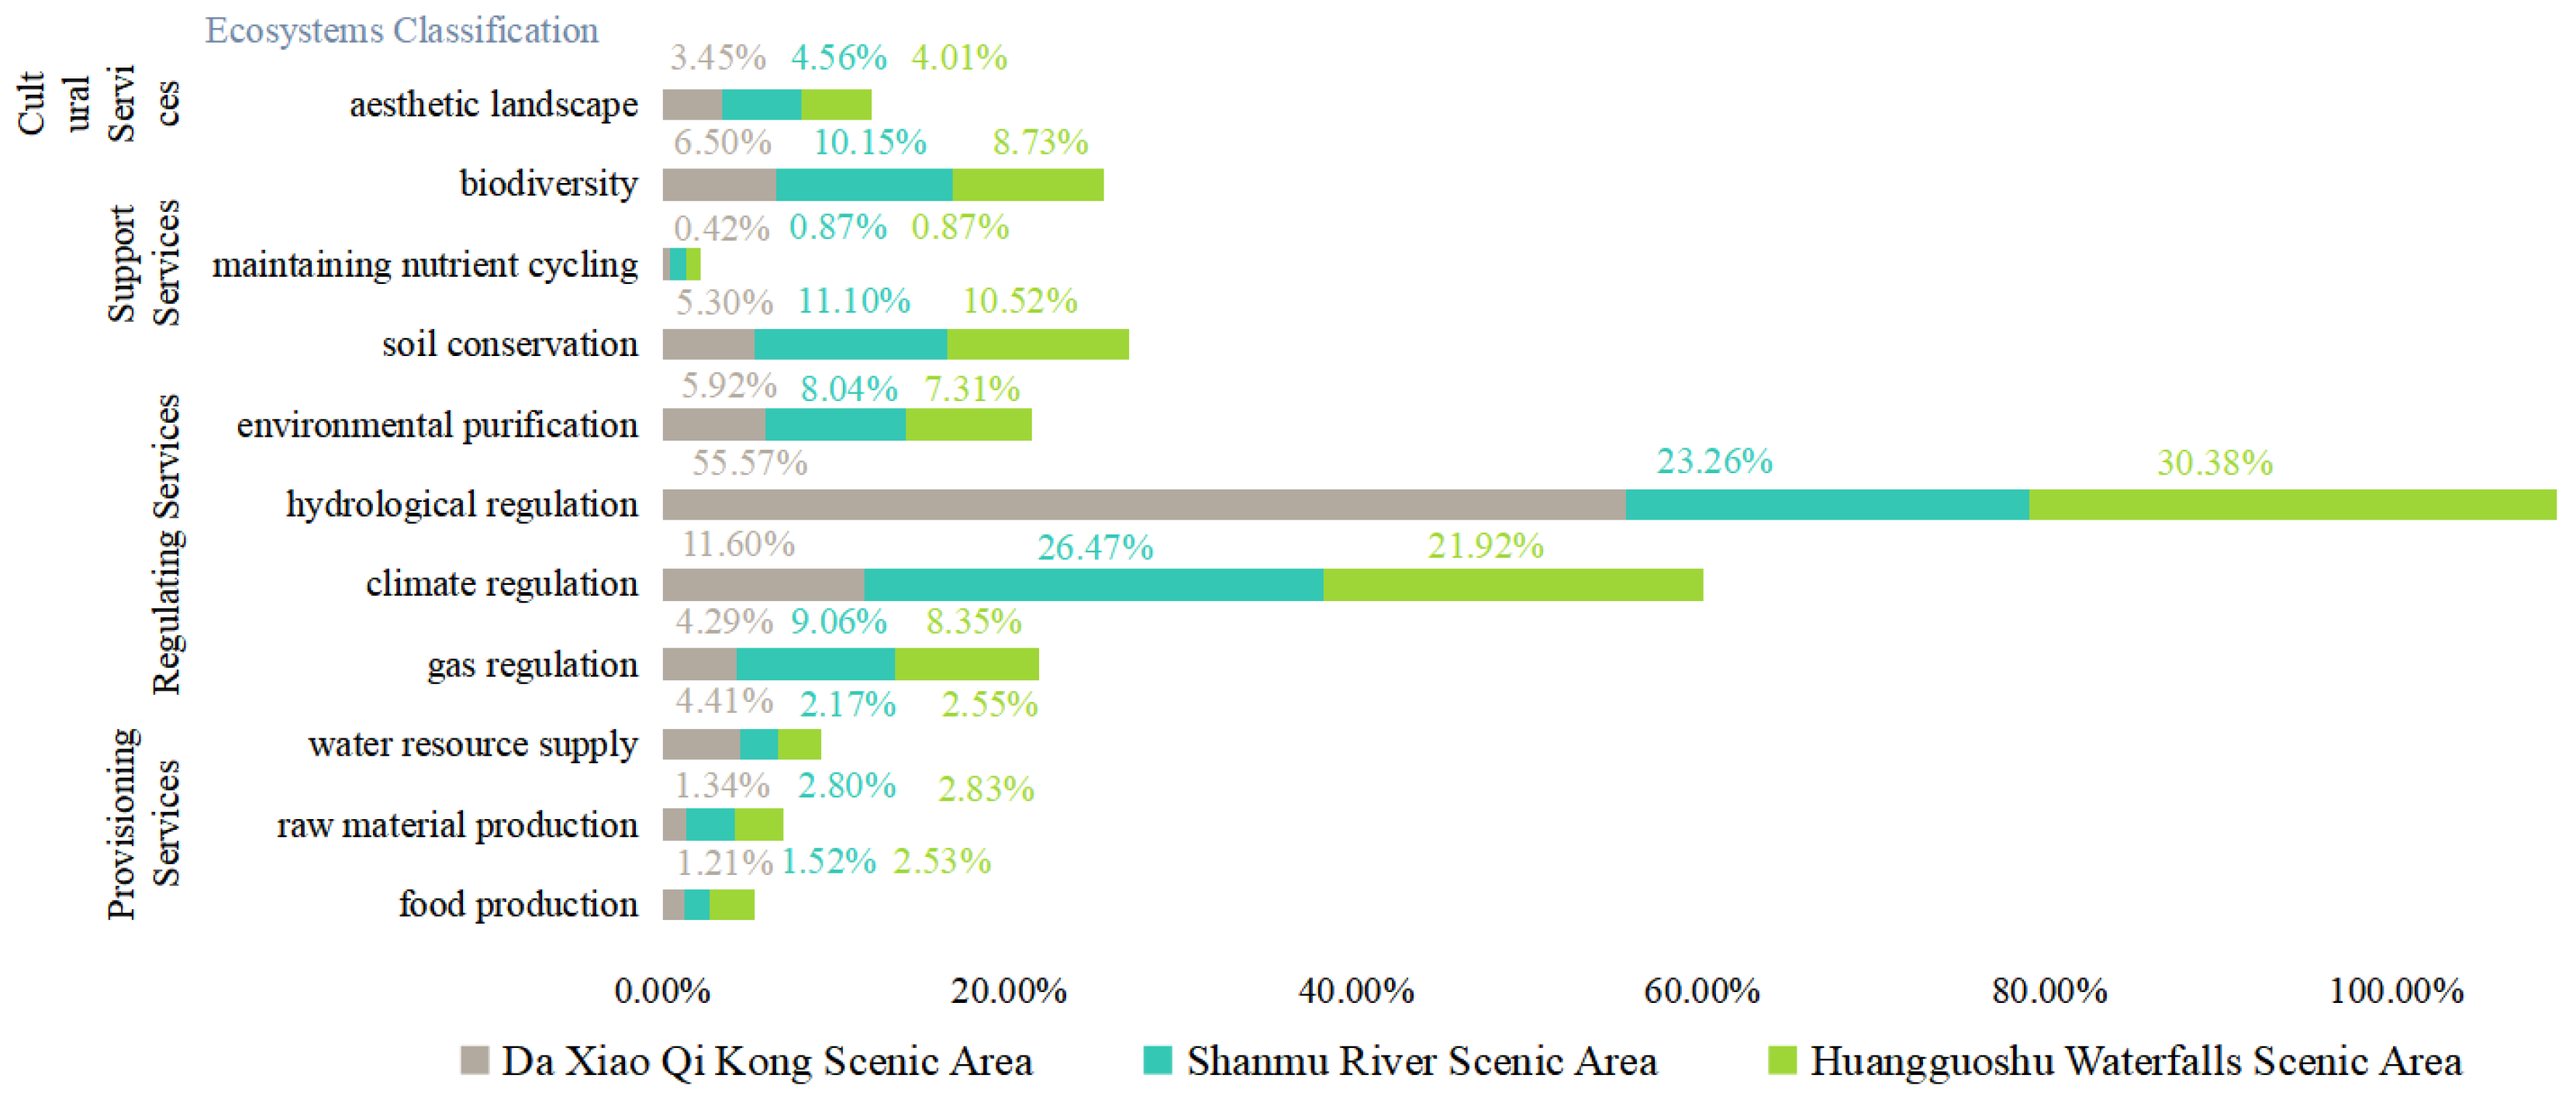
| DaXiaoQiKongScenic Area EPV | |||||||||||||
| Forests | 1.36 | 3.10 | 1.61 | 10.22 | 30.61 | 30.61 | 8.86 | 12.45 | 0.95 | 11.34 | 4.97 | 91.34 | 32.87% |
| Grassland | 0.30 | 0.44 | 0.24 | 1.55 | 4.09 | 3.00 | 1.35 | 1.88 | 0.14 | 1.71 | 0.75 | 11.72 | 4.22% |
| Farmland | 0.91 | 0.43 | 0.02 | 0.72 | 0.39 | 0.29 | 0.11 | 1.11 | 0.13 | 0.14 | 0.06 | 2.93 | 1.05% |
| Water | 0.94 | 0.27 | 9.79 | 0.91 | 2.70 | 120.77 | 6.56 | 1.10 | 0.08 | 3.01 | 2.23 | 144.17 | 51.89% |
| Wetlands | 0.34 | 0.33 | 1.72 | 1.26 | 2.39 | 16.10 | 2.39 | 1.53 | 0.12 | 5.23 | 3.14 | 27.67 | 9.96% |
| Total | 3.85 | 4.57 | 13.38 | 14.66 | 40.19 | 170.77 | 19.27 | 18.08 | 1.42 | 21.43 | 11.17 | 277.86 | 100.00% |
| Shanmu River Scenic Area EPV | |||||||||||||
| Forests | 7.42 | 16.98 | 8.84 | 56.16 | 168.04 | 87.12 | 47.78 | 68.36 | 5.25 | 62.16 | 27.26 | 419.6 | 82.33% |
| Grassland | 0.18 | 0.26 | 0.14 | 0.92 | 2.42 | 1.78 | 0.80 | 1.12 | 0.08 | 1.01 | 0.45 | 6.95 | 1.36% |
| Farmland | 1.79 | 0.84 | 0.04 | 1.41 | 0.76 | 0.57 | 0.21 | 2.17 | 0.25 | 0.27 | 0.13 | 5.75 | 1.13% |
| Water | 0.45 | 0.13 | 4.70 | 0.44 | 1.30 | 58.02 | 3.15 | 0.53 | 0.04 | 1.45 | 1.07 | 69.26 | 13.59% |
| Wetlands | 0.10 | 0.10 | 0.50 | 0.37 | 0.70 | 4.69 | 0.70 | 0.45 | 0.03 | 1.52 | 0.92 | 8.08 | 1.59% |
| Total | 9.94 | 18.31 | 14.23 | 59.30 | 173.22 | 152.17 | 52.64 | 72.63 | 5.66 | 66.42 | 29.82 | 509.63 | 100.00% |
| Huangguoshu Scenic Area EPV | |||||||||||||
| Forests | 2.19 | 4.99 | 2.58 | 16.47 | 49.31 | 29.54 | 14.29 | 20.06 | 1.53 | 18.26 | 8.01 | 127.38 | 59.78% |
| Grassland | 0.46 | 0.67 | 0.37 | 2.37 | 6.26 | 4.59 | 2.07 | 2.88 | 0.22 | 2.62 | 1.15 | 17.94 | 8.42% |
| Farmland | 3.72 | 1.75 | 0.09 | 2.93 | 1.57 | 1.18 | 0.44 | 4.51 | 0.52 | 0.57 | 0.26 | 11.94 | 5.60% |
| Water | 0.34 | 0.10 | 3.52 | 0.33 | 0.97 | 43.40 | 2.36 | 0.39 | 0.03 | 1.08 | 0.80 | 51.82 | 24.32% |
| Wetlands | 0.05 | 0.05 | 0.25 | 0.18 | 0.35 | 2.34 | 0.35 | 0.22 | 0.02 | 0.76 | 0.46 | 4.03 | 1.89% |
| Total | 6.75 | 7.56 | 6.81 | 22.27 | 58.46 | 81.04 | 19.49 | 28.06 | 2.32 | 23.29 | 10.69 | 213.07 | 100.00% |
| DaXiaoQiKong Scenic Area | Shanmu River Scenic Area | Huangguoshu Scenic Area | |||||||
|---|---|---|---|---|---|---|---|---|---|
| Website | Number of Comments/Piece | Number of Positive Reviews/Piece | Positive Review Rate | Number of Comments/Piece | Number of Positive Reviews/Piece | Positive Review Rate | Number of Comments/Piece | Number of Positive Reviews/Piece | Positive Review Rate |
| Trip.com Group | 2765 | 2293 | 82.929% | 78 | 64 | 82.051% | 2846 | 2384 | 83.767% |
| Tongcheng Travel Holdings Limited | 947 | 793 | 83.738% | 116 | 100 | 86.207% | 2559 | 2116 | 81.447% |
| Perceived Tendency | Frequency/Times | Proportion (%) | Intensity | Frequency/Times | Proportion (%) | Field |
|---|---|---|---|---|---|---|
| Positive perception | 8018 | 74.41 | Normal | 2741 | 25.44 | Recommended, spectacular, picturesque, mountainous, and green |
| Moderate | 2350 | 21.81 | Convenient and time-saving | |||
| High | 2927 | 27.16 | Poorly managed, to be redeveloped, and over-commercialized | |||
| Neutral perception | 73 | 0.68 | Convenient and time-saving | |||
| Negative perception | 2685 | 24.92 | Normal | 588 | 5.46 | Poorly managed, to be redeveloped, and over-commercialized |
| Moderate | 165 | 1.53 | ||||
| High | 123 | 1.14 |
Disclaimer/Publisher’s Note: The statements, opinions and data contained in all publications are solely those of the individual author(s) and contributor(s) and not of MDPI and/or the editor(s). MDPI and/or the editor(s) disclaim responsibility for any injury to people or property resulting from any ideas, methods, instructions or products referred to in the content. |
© 2024 by the authors. Licensee MDPI, Basel, Switzerland. This article is an open access article distributed under the terms and conditions of the Creative Commons Attribution (CC BY) license (https://creativecommons.org/licenses/by/4.0/).
Share and Cite
Chang, H.; Xiong, K.; Zhu, D.; Zhang, Z.; Zhang, W. Ecosystem Services Value Realization and Ecological Industry Design in Scenic Areas of Karst in South China. Forests 2024, 15, 363. https://doi.org/10.3390/f15020363
Chang H, Xiong K, Zhu D, Zhang Z, Zhang W. Ecosystem Services Value Realization and Ecological Industry Design in Scenic Areas of Karst in South China. Forests. 2024; 15(2):363. https://doi.org/10.3390/f15020363
Chicago/Turabian StyleChang, Huanhuan, Kangning Xiong, Dayun Zhu, Zhenzhen Zhang, and Wenxiu Zhang. 2024. "Ecosystem Services Value Realization and Ecological Industry Design in Scenic Areas of Karst in South China" Forests 15, no. 2: 363. https://doi.org/10.3390/f15020363
APA StyleChang, H., Xiong, K., Zhu, D., Zhang, Z., & Zhang, W. (2024). Ecosystem Services Value Realization and Ecological Industry Design in Scenic Areas of Karst in South China. Forests, 15(2), 363. https://doi.org/10.3390/f15020363