Article

Growth Response of Thai Pine (Pinus latteri) to Climate Drivers in Tak Province of Northwestern Thailand

by
Sasiwimol Inthawong
1,
Nathsuda Pumijumnong
1,*,
Chotika Muangsong
2,3,4,*,
Supaporn Buajan
1,
Binggui Cai
3,4,
Rattanakorn Chatwatthana
1,
Uthai Chareonwong
1 and
Uthaiwan Phewphan
2
1
Faculty of Environment and Resource Studies, Mahidol University, Nakhon Pathom 73170, Thailand
2
Innovation for Social and Environmental Management, Mahidol University, Amnatcharoen Campus, Amnatcharoen 37000, Thailand
3
Key Laboratory for Humid Subtropical Eco-Geographical Processes of the Ministry of Education, Fujian Normal University, Fuzhou 350007, China
4
Institute of Geography, Fujian Normal University, Fuzhou 350007, China
*
Authors to whom correspondence should be addressed.
Forests 2024, 15(2), 345; https://doi.org/10.3390/f15020345
Submission received: 2 January 2024 / Revised: 7 February 2024 / Accepted: 8 February 2024 / Published: 9 February 2024
(This article belongs to the Section Forest Meteorology and Climate Change)

Abstract

:
The long-term effects of climate change and climate extremes have been associated with changes in tree growth and forest productivity worldwide, and dendrochronological analyses are important tools that can be used to investigate the influence of climatic forces on tree growth at a particular site. In this study, a 180-year tree ring width chronology (spanning from 1843 to 2022) of living pine trees (Pinus latteri) in Tak province, northwestern Thailand, was developed. The analysis of the climate–tree growth relationship indicated the influences of the annual total rainfall (r = 0.60, p < 0.001) and annual averaged relative humidity (r = 0.47, p < 0.001) on tree growth in this area. Anomalously high (for example, in 1853, 1984, 2011, and 2018) and low growths (for example, in 1954, 1983, 1992, and 1996) were found. Growth anomalies in the Thai pine in this study were related to changes in abnormal and extreme rainfall (r = 0.94, p < 0.001) and the El Niño Southern Oscillation (ENSO). Our results confirm that rainfall and relative humidity are the main climatic factors regulating the radial growth of Thai pine. This finding could be an important contribution to further research on the effects of climate change and extreme weather events on the vulnerability of tropical and subtropical trees in this region.

1. Introduction

Climate change is regarded as one of the largest and most pervasive threats to global ecosystems and biodiversity [1,2,3]. Several studies have found that long-term climate change and climate extremes have strong negative impacts on forest productivity worldwide, more specifically tree growth and wood production [4,5,6]. Moreover, Asia’s tropical and subtropical forests are considered some of the most diverse terrestrial ecosystems and play important roles in regulating regional and global climate dynamics, as well as the global carbon balance, due to the massive amounts of terrestrial biomass and soil organic carbon stored in tropical and subtropical forest areas [7,8,9,10]. The proportion of carbon storage and biomass preserved in trees is closely related to the variety of tree stem sizes (i.e., tree radial growth) [11,12], and the loss of forest productivity under a changing climate could affect the carbon stock of forests. Adapting forest management to future climate change thus requires an understanding of long-term tree growth dynamics in response to long-term climate change under various local climate conditions.
Thailand is a country in Southeast Asia. The El Niño Southern Oscillation (ENSO) has played a very important role in regulating the seasonal to annual climate variability in Thailand in recent decades [13,14,15,16,17,18,19,20] and longer timescales [21,22,23,24,25,26]. Previous studies showed that a lower temperature and higher rainfall are associated with El Niño events and vice versa for La Niña events [17,18,19,20]. Dendrochronological analyses (i.e., tree ring studies) serve as important tools that can be used to investigate the influence of climatic forces on tree growth [27,28,29,30,31,32,33] and are widely used for climatic reconstructions in many regions [34,35,36,37,38,39], particularly Asia [40,41,42,43,44,45,46]. The understanding of Thai tree-growth dynamics has been limited in space and time due to the scarcity of long-term tree-growth data (e.g., [47]). Moreover, the driving forces behind the growth rates of tropical and subtropical tree species, particularly Thai trees (e.g., [48]), appear to be highly complicated due to the complex interplay between climate, soil, and other factors [49,50,51,52,53,54].
Previously, successful tree ring research in Thailand has mainly been conducted on tree ring parameters (tree ring widths, stable oxygen, and carbon isotopes) in Thai teak (Tectona grandis Linn.) [21,55,56] and two pine species (Pinus latterri and Pinus kesiya) [57,58,59,60,61,62,63,64]. Those studies demonstrated the potential of Thai tree ring proxies to be used to examine the influence of ENSO on Thailand’s climate over the past hundred years [21]. In particular, tree ring records from Mae Hong Son [21] and Tak [64] provinces of northwestern Thailand show that the cycles of 2–7 years correspond to the ENSO frequencies.
Among those tree species, the tree ring width (hereafter referred to as TRW) time series derived from P. latteri trees have more complicated climatic signals than those from teak trees [21,57,59,63,64]. P. latteri trees within the same region can respond differently to specific climate variables (for example, rainfall (RF), relative humidity (RH), and temperature (T)) [59,61,64]. These responses can also vary across sites, depending on the local climate and altitude [47]. Although the hitherto longest pre-monsoon temperature reconstruction (1834–2000) derived from P. latteri chronologies in northwestern Thailand has been previously shown in other studies (e.g., [61]), additional studies with the use of P. latteri TRW are needed in order to compare the tree ring records between various sites as well as to investigate the potential of P. latteri stands growing in other locations to extend the previous TRW chronologies further back in time.
In this study, we present a new TRW index of P. latteri trees collected from Tak province in northwestern Thailand, covering a 180-year period between 1843 and 2022. This study investigated the growth-climate relationship and the growth patterns of P. latteri stands from northwestern Thailand. The results indicated that our tree ring records contain strong signals of RF and RH, indicating the potential of using the TRW of P. latteri to study these metrics. Growth anomalies of Thai pine and anomalous rainfall in the study site were identified, and teleconnections with the ENSO were discussed. Thus, this study is an important contribution to further research on the effects of climate change and extreme weather events on the vulnerability of tropical and subtropical trees in this region.

2. Materials and Methods

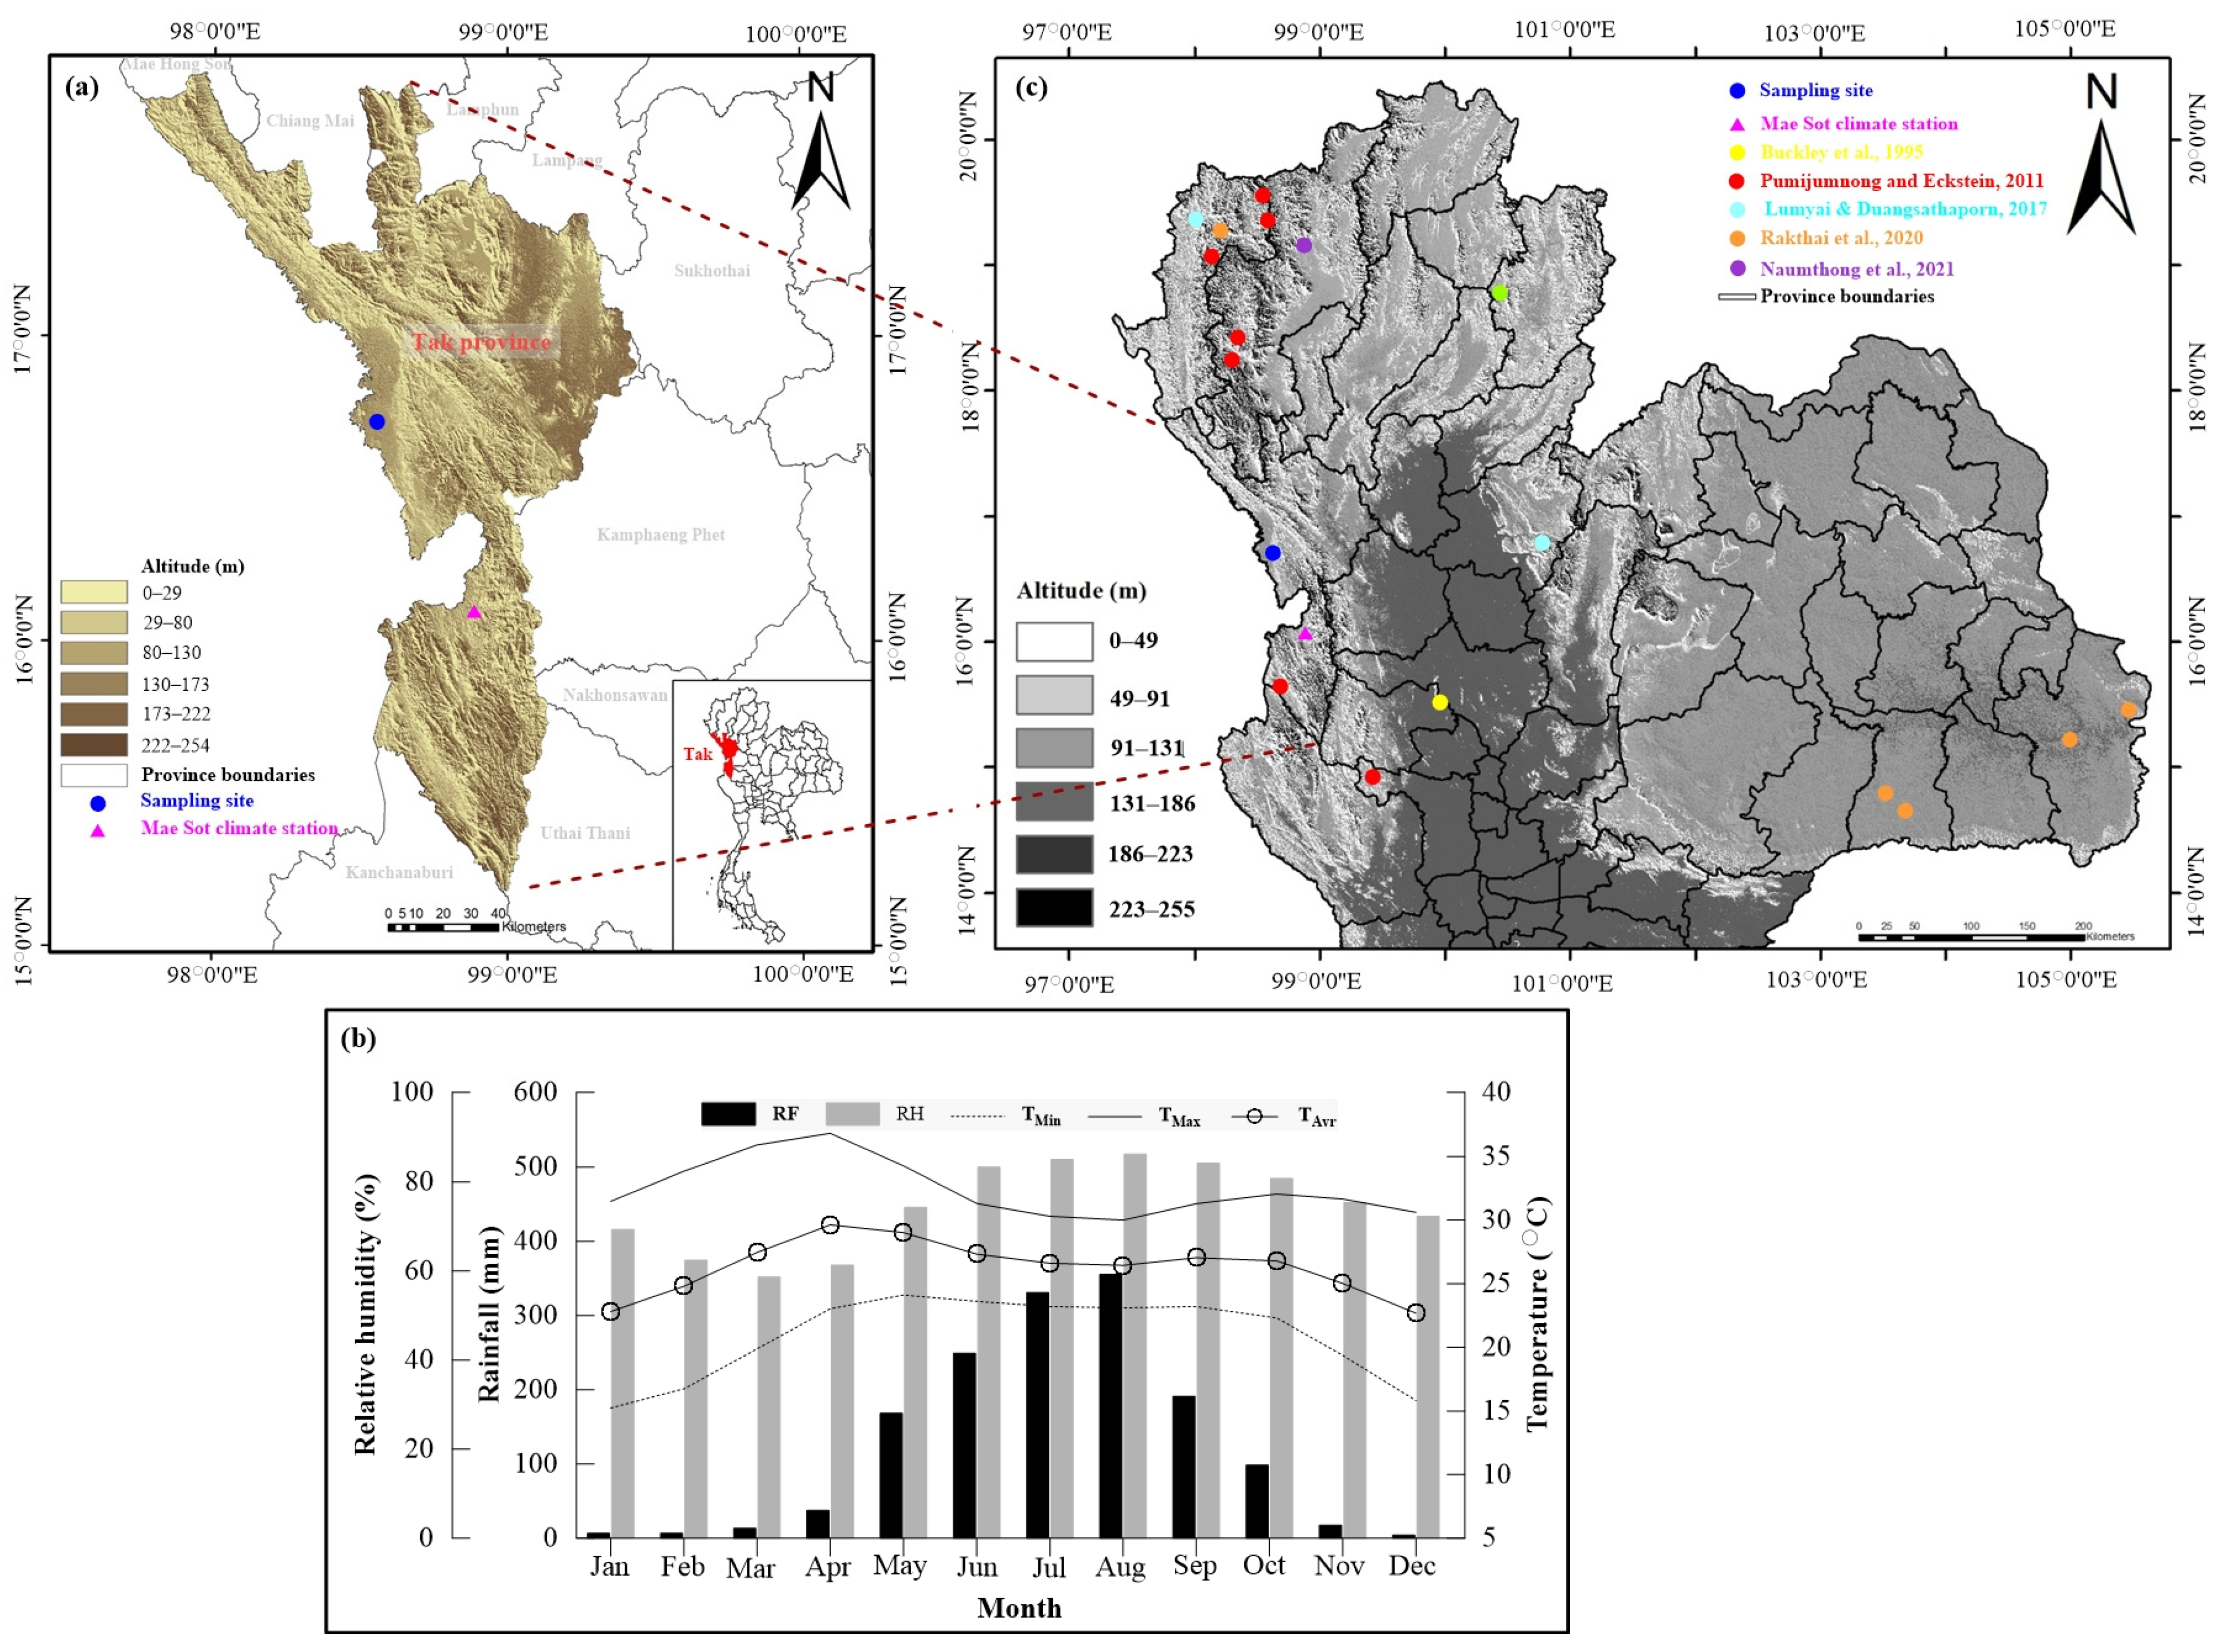
2.1. Study Area and Climate

This research was conducted in the Umphang district of Tak province in northwestern Thailand (Figure 1a). The tree ring sampling site (16°05′17.8″ N 98°51′38.6″ E; 375 m asl) is located in the main area of the natural forest in Ban Mai Pa Kha village of Umphang district, adjacent to the Umphang Wildlife Sanctuary (Figure 1a).
The climate of Thailand is influenced by the Asian monsoon system. Climate seasonality in the study area is strongly regulated by seasonal monsoon circulations, namely the southwest (SW) and northeast (NE) monsoon winds. The SW monsoon (or summer monsoon) is generally associated with heavy rainfall and starts in mid-May and ends at the end of October (hereafter referred to as MO), and it is regarded as the rainy season in Thailand. The NE monsoon, or winter monsoon, known as the winter season, is associated with a cold and dry air mass that generates the winter season from November to February of the following year. The pre-monsoon or summer season, from March to early May (hereafter referred to as MAM), is regarded as the hottest period of the year. According to the climatological datasets obtained from the local Mae Sot meteorological station (16°40′ N 98°33′ E; 196 m asl) between 1951 and 2022 [65] (Figure 1b), monthly total rainfall during the rainy season varies from 98 mm in October to 355 mm in August. Approximately 94% (1393 mm) of total rainfall falls during the summer monsoon or rainy season. December (i.e., a winter month) is the coldest month (22.7 °C), whereas April (a summer month) is the hottest month (29.6 °C) in the study area. Yearly (or annually) averaged temperature, relative humidity, and total rainfall values between 1951 and 2022 are 26.3 °C (24.8–28.1 °C), 74% (68%–78%), and 1479 mm (715–2389 mm), respectively (Figure 1b).

2.2. Tree Ring Collection, Preparation, and Chronology Development

Two cores per tree were taken at breast height using a 5-mm-diameter increment borer from 20 healthy pine (P. latteri) trees in 2022. Each core was fixed on support wood slaps and stored dry at room temperature for 1–2 weeks. The cores were subsequently sanded using progressively finer sandpaper sheets until their surfaces showed clear, visible ring patterns.
A LINTAB moving stage table equipped with a Leica GZ6 microscope with a precision of 0.001 mm (RINNTECH®, Heidelberg, Germany) was employed to measure the ring width of core samples [66,67]. The crossdating technique was performed on ring-width series using the TSAP-Win software package (Version 4.64) [69,70,71,72]. The quality of chronologies was accessed using COFECHA software (Version 6.02). ARSTAN software (Version 48d2) generated the standard and residual chronologies by detrending the tree ring series to remove age-related or non-climatic trends [73,74,75,76,77]. To remove non-climatic signals, the cubic smoothing spline curve was applied to standardize the TRW series with a 50% cutoff frequency [77]. A new pine tree ring width chronology (i.e., master chronology) derived from residual chronology was therefore constructed and referred to as the TRW index. Statistical characteristics of raw tree ring width chronologies, including the expressed population signal (EPS), the mean interseries correlation (Rbar), and mean ring sensitivity (MS), were calculated using ARSTAN software to evaluate the quality of the tree ring width chronology (i.e., the TRW index) [76,77].

2.3. Climate Datasets and Data Analysis

Climatological datasets in recent decades, including relative humidity (RH), rainfall (RF), minimum (TMin), maximum (TMax), and average (TAvr) temperatures, were obtained from the Mae Sot meteorological station (16°40′ N 98°33′ E; 196 m asl) [65] (Figure 1a,b). Monthly, seasonal, and annual averaged values of climate data from the previous year to the current year between 1951 and 2022 were compared with the tree ring series. Because climate seasonality within and between years has a significant impact on Thai tree growth, the climate datasets were further divided into pre-monsoon or summer season (MAM), summer monsoon or rainy season (MO), and winter season (ND of the current year and JF of the following year) for comparison with the TRW index. For longer time scales, the TRW index was compared with the TRW index-based (hereafter referred to as the PC1 index) pre-monsoon weather conditions in northwestern Thailand [61] between 1814 and 2008 to confirm the regional representativeness of our tree ring series. Pearson correlation analysis assessed the relationships between the TRW index and other parameters. The double standard deviation technique [78,79,80] was applied to identify abnormal and extreme growths in the TRW index, as well as rainfall anomalies. The values of the TRW index higher than the mean +2 and +1 standard deviation (sd/σ) are defined as extremely and abnormally positive growth years, respectively, and vice versa for extremely and abnormally negative growth years. REDFIT spectral analysis [81,82,83] was performed on the TRW index to obtain the periodicities of the TRW index using the Paleontological Statistics (PAST) software package version 3.25 [81].

3. Results

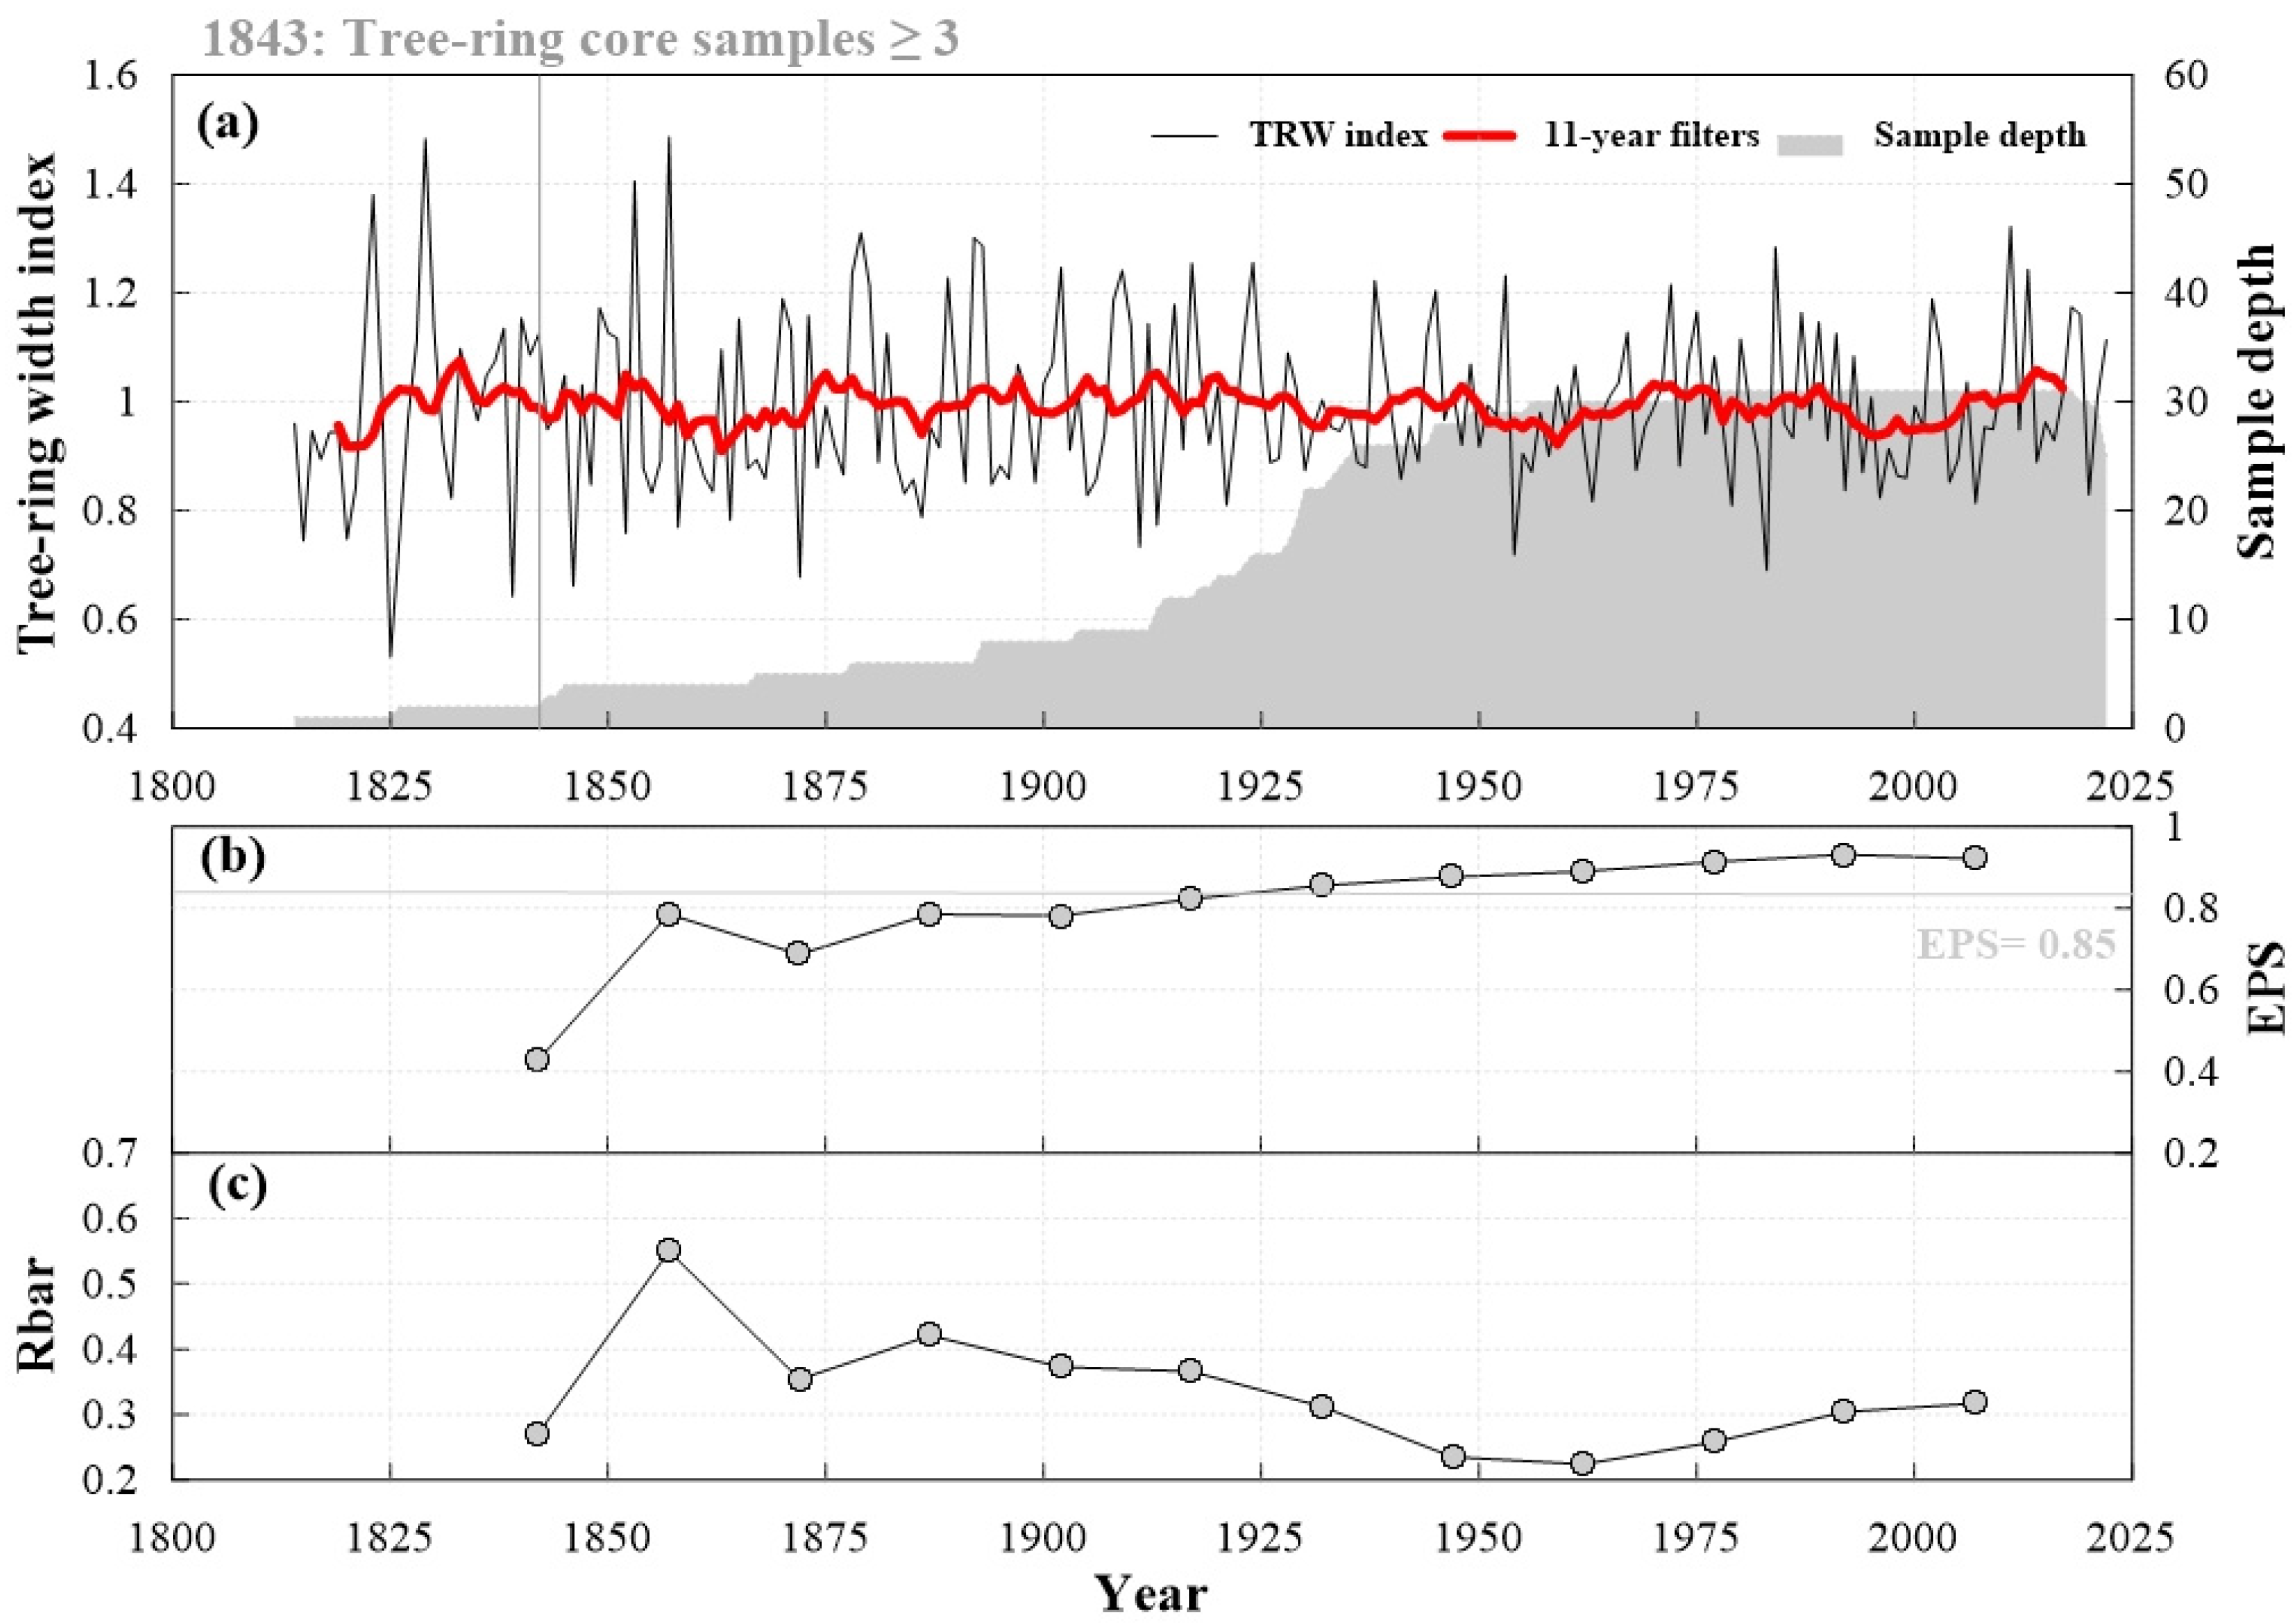
3.1. Tree-Ring Chronology Characteristics

Four trees were excluded as they showed individual growth patterns (poorly cross-dated with their pairs and master chronology). A total of 31 cores from 16 trees were used to develop a TRW chronology of P. latteri via TRW synchronization (Table 1 and Figure 2). According to the raw TRW data (i.e., the non-standardized growth), most of the decadal growth patterns indicated higher growth rates during the juvenile stage [84,85,86,87], which lasts from a few years up to approximately 30–40 years [84,85], and a gradual decrease in these rates until remaining constant during the mature stage, such as in UPPKE05C, PKPME40A, and PKPME30B, for example (Figure 3). Slightly increasing trends in previous decades were also observed in some pine trees—for example, UPPKE19B, UPPKE04C, and PKPME36B (Figure 3). In general, the selected individual ring-width time series with different ages derived from living pine trees in our studied site showed somewhat similar growth patterns over time.
A residual chronology (i.e., the TRW index) that contains high-frequency fluctuations—spanning a 180-year period from 1843 to 2022—was selected for further climate analysis (Figure 2). The mean ring width values were 0.212 cm per year. The Rbar and EPS values varied from 0.22 to 0.55 and 0.69 to 0.93, respectively (Figure 2 and Table 1). The mean Rbar and EPS values were 0.34 and 0.84, respectively (Figure 2 and Table 1).

3.2. Growth Anomalies in the Tree Ring Records

The TRW index contains high- and low-frequency variations in the growth rate over the 209-year period (Figure 2). The greatest frequency was found in the early part of the TRW index (Figure 2). Growth anomalies were observed in approximately 49 of the observed years (accounting for 23% of the total). A total of 5 years (accounting for 2% of the total) were identified as extremely positive growth (above mean +2σ or 1.30), 23 years (accounting for 11% of the total) as abnormally positive (above mean +σ or 1.15), 4 years (accounting for 2% of the total) as extremely negative (below mean −2σ or 0.68), and 17 years (accounting for 8% of the total) as abnormally negative (below mean −σ or 0.84) (Table 2). Extremely positive growth was observed in 1853, 1857, and 2011, whereas extremely negative growth was observed in 1846 and 1872 (Table 2).

3.3. Tree Growth Responses to Climate Drivers

Correlational analyses between the TRW index and climatic factors exhibited significantly positive correlations with RF, RH, and TMin and a negative correlation with TMax values (Figure 4a,b). In the comparisons with monthly climate variables, correlations were observed with monthly total RF in October (r = 0.29, p < 0.016) and December (r = 0.31, p < 0.009) from the previous year to March (r = 0.24, p < 0.046) and August (r = 0.26, p < 0.026) of the current year (Figure 4a). Weak positive correlations were also found with the monthly averaged RH from the previous December (r = 0.28, p < 0.019) to the current January to April, June, and August (r values ranging from 0.24 in April to 0.36 in March) (Figure 4a). The growth–climate relationship was positively associated with monthly averaged TMin from the previous December (r = 0.26, p < 0.025) to the current January (r = 0.27, p < 0.024), as well as negatively correlated with TMax with the current March (r = −0.27, p < 0.022) (Figure 4b). For the seasonal climate, the TRW index was significantly and positively correlated with seasonal RF and RH during the summer monsoon (MO) season (RF: r = 0.29, p < 0.014 and RH: r = 0.24, p < 0.044) and with RH during the pre-monsoon (MAM) season (r = 0.25, p < 0.031) (Figure 4a). There was no observed significant correlation with seasonally and annually averaged temperatures (Figure 4b). The highest significant correlation values were observed with annual total RF (r = 0.60, p < 0.001) and annual averaged RH (r = 0.47, p < 0.001) (Figure 4a), indicating that the annual RF and RH are the two main climate drivers regulating tree growth in the studied site.
An analysis of extreme and abnormal growths (Table 2) indicated the close linkage between the growth anomalies of Thai pine trees and rainfallMay-Jul reconstruction (r = 0.60, p < 0.001) (Figure 5a) over the entire common period from 1814 to 2008 [61]. Both extreme and abnormal pine tree growth occurred with anomalous rainfall (i.e., extreme and abnormal rainfallMay-Jul) (r = 0.64, p < 0.001) (Figure 5b), demonstrating that rainfall anomalies significantly impact Thai pine growth in this area.

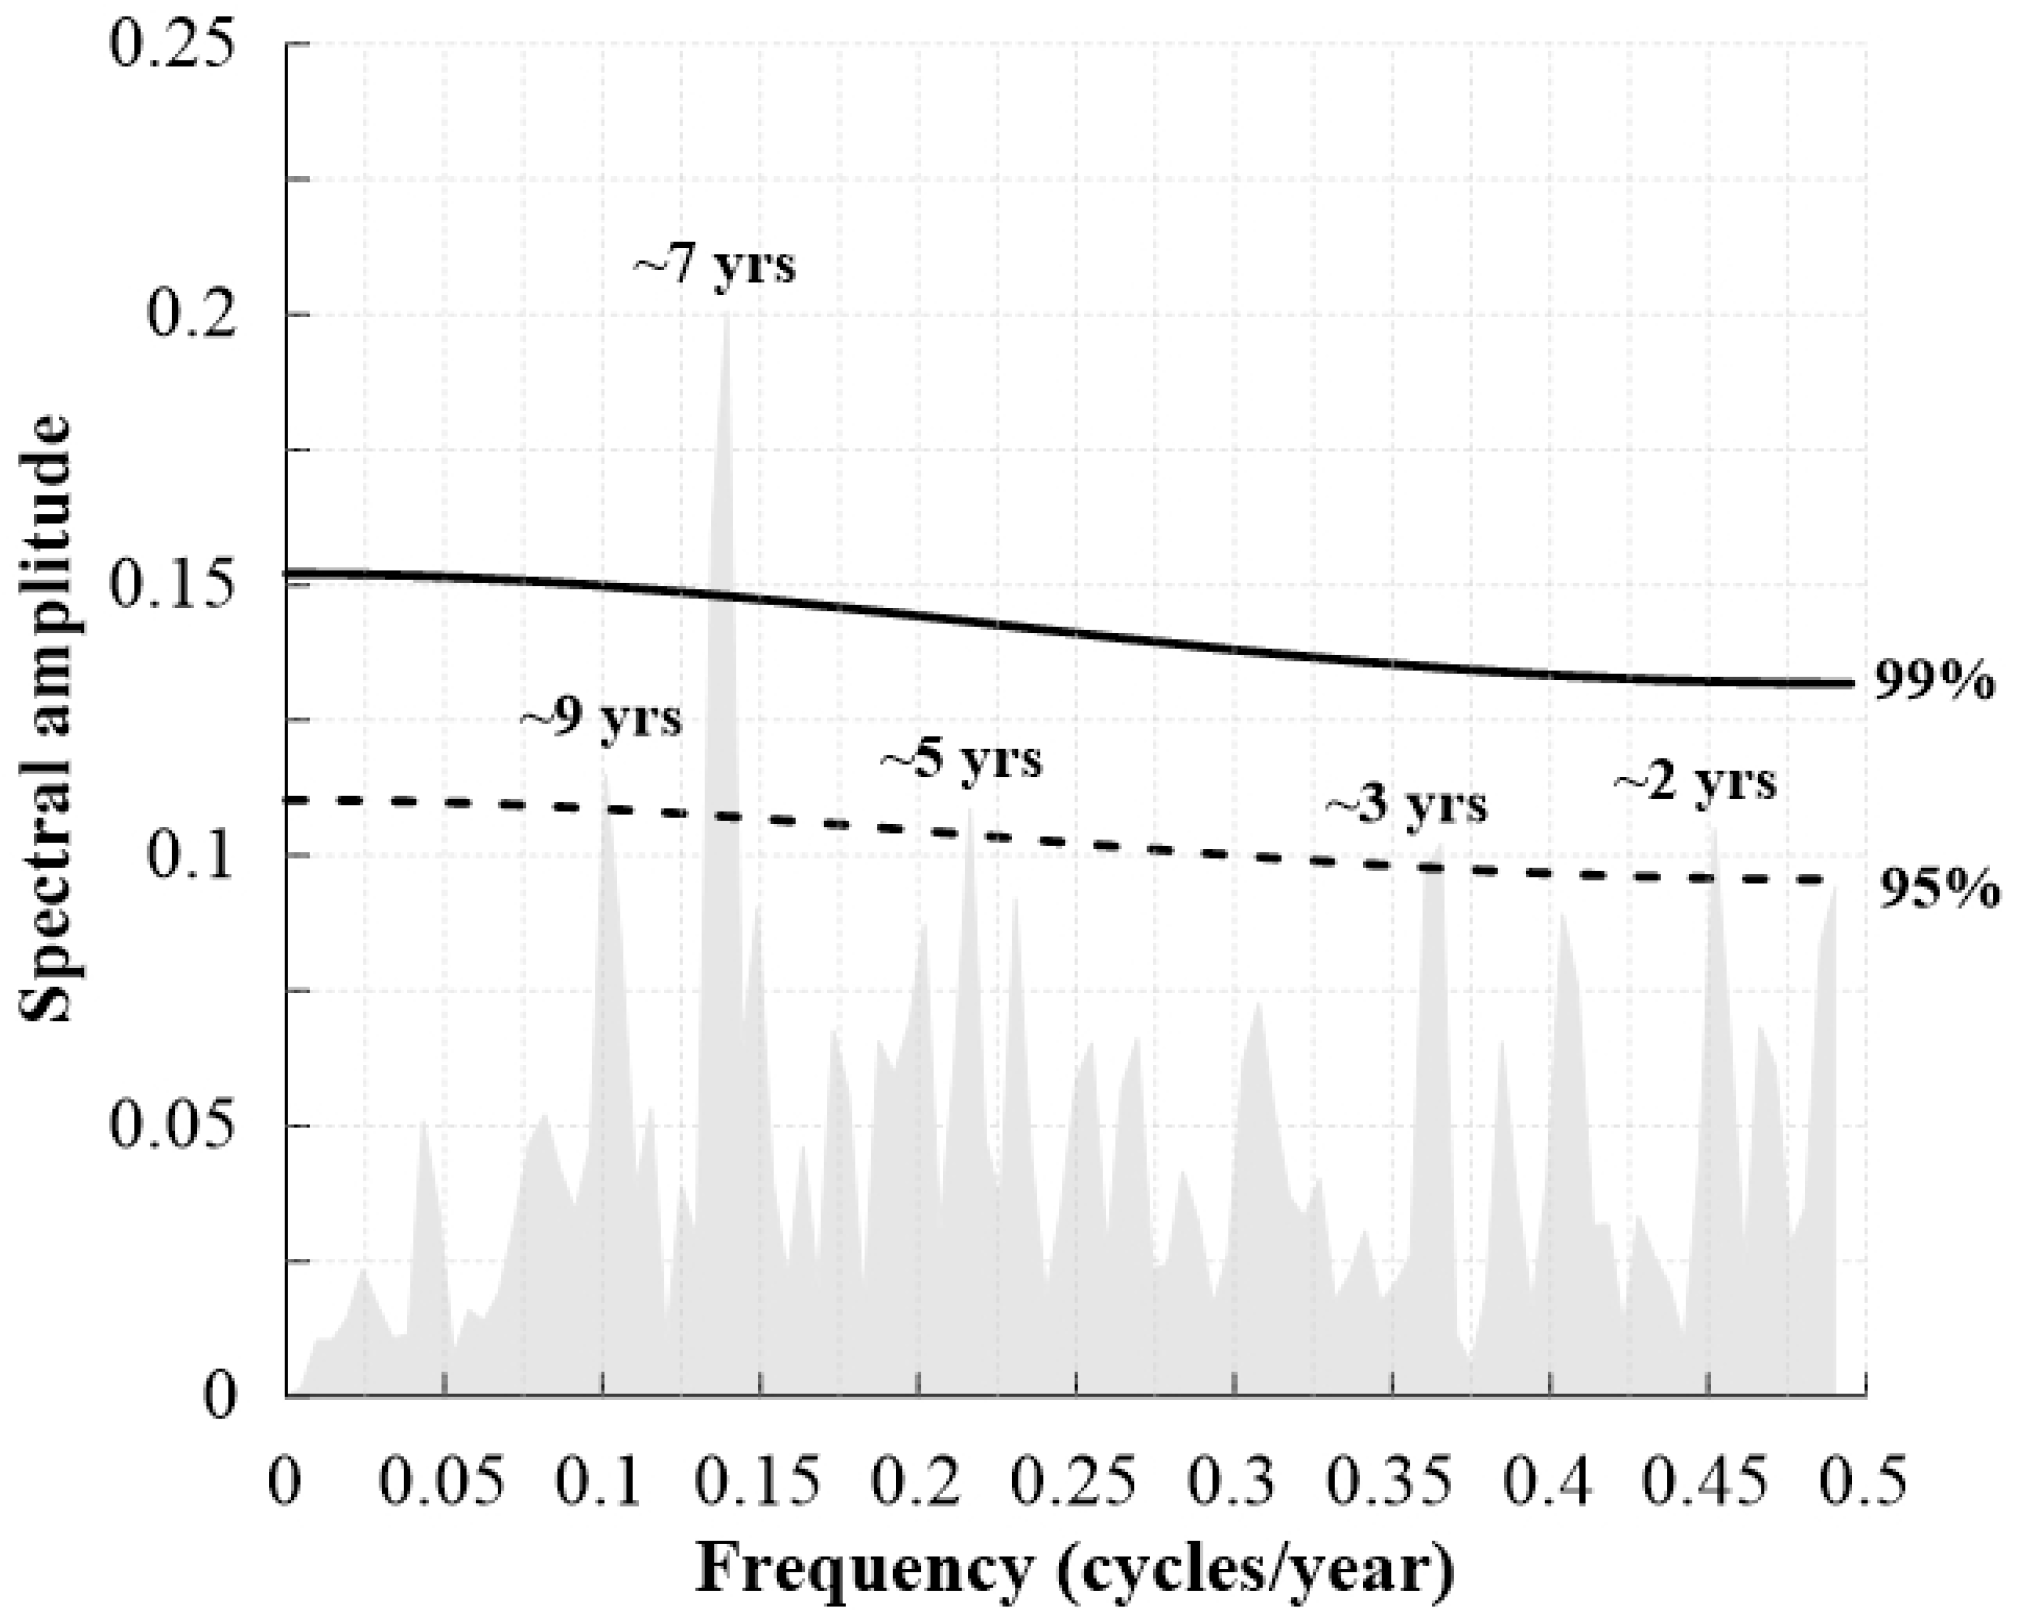
3.4. Periodicity of TRW Chronologies

The spectral amplitude of the TRW chronologies exhibited statistically significant cyclicities at approximately 2–3, 5, and 9 years that reached the 95% confidence limit, with the highest amplitude at approximately 7 years (99% confidence limit) (Figure 6).

4. Discussion

4.1. Chronological Characteristics and Comparison with the Pine Tree Ring Index from Northwestern Thailand

Although the mean EPS value of 0.84 is slightly lower than the recommended threshold of 0.85 [89,90], the calibration period (i.e., comparison with the available instrumental climate data from recent periods) falls within a reliable data period with a high replication of samples and/or an EPS value of ≥0.85, allowing us to investigate the influence of climate on tree growth. A mean EPS value as high as 0.84 is therefore considered acceptable in our study, as our main focus is the investigation of the tree growth–climate relationship without the need for climate reconstruction.
The TRW index in this study was positively correlated (r = 0.48, p < 0.001, n = 167) (Figure 6) with the PC1 index-based pre-monsoon weather conditions from northwestern Thailand [61] between 1843 and 2008, when a longer time scale was used. Higher fluctuations in the TRW series were observed for the pre-1875 period in both series (Figure 7). Correlational analysis between the TRW index and the PC1 index confirmed the common signals stored in pine tree ring proxies within the same region. It also indicated the reliability and suitability of the TRW index to investigate the effect of climate change on tree growth in this area.

4.2. Possible Driving Factors Controlling Tree Growth

Extensive studies on P. latteri from many parts of Thailand (Figure 1c) indicated close relationships between the growth rates of P. latteri and either RF (RF amounts or number of raining days) together with T [61,66,68,91] or T individually [60], with a relatively few reports on the growth rates’ relationship with RH (e.g., [68]). Recent studies found the combination effects of RF, T, and RH on P. latteri growths [64,67]. Although the responses of Thai pines to climate parameters may differ significantly from site to site due to site-specific effects, especially altitude [47], previous research has confirmed that the growth of Thai pine species is highly sensitive to climatic changes [64,67] and extreme weather conditions [67,91].
Similar to the previous research on P. latteri in northern and/or northeastern Thailand [64,67], we also found that RF and RH were the two major climatic factors regulating pine growth in northwestern Thailand, with a minor influence from T (i.e., TMax and TMin). These three climatic parameters (RF, RH, and T) are the crucial factors significantly affecting the availability of atmospheric and soil moisture (i.e., water availability); in turn, moisture availability can increase and/or decrease tree radial growth as trees adjust their physiological stomatal behaviors in response to moisture availability and other factors [92]. The moderately positive correlations observed between our TRW index and RF and RH and the low negative correlation with TMax implied that wetter conditions (i.e., higher RH and RH and lower T) possibly lead to increased photosynthetic assimilation rates and reactivation of the cambium [64] and enhance tree growth at our study site, and vice versa for drier conditions.
A wide variety of Thai pine growth behaviors are observed in response to different monthly and/or seasonal climates [47]. The growth of Thai pine was positively correlated with monthly rainfall in March, April [47,64,67], May [68], September, and December [64]. For RH, monthly averaged RH values from February to September [70] and April [68] were also positively correlated with pine TRW indices from northern Thailand.
Our study on P. latteri from northwestern Thailand confirmed the findings of previous studies that the growth of P. latteri in Thailand is largely controlled by RF and RH over the whole period of consecutive months within a year, covering the pre-monsoon (March to April), summer or SE monsoon (March to October), as well as the dry winter season or NE monsoon months, as indicated by positive correlations with annual total RF and annual averaged RH. Our results indicate that a continuous supply of water under wetter (or drier) conditions is one of the important factors regulating cell division and cambium development, which in turn increase the radial growth of pine tree stems in northwestern Thailand.

4.3. Growth Anomalies and Their Connection with Large-Scale Climate Drivers

Analyzing tree growth anomalies in response to rainfall over long periods is critically important to better understand how specific tree species—in this case, Thai pine—respond to climate change and/or extreme climate events. Abnormal and extremely positive growths (for example in 1853, 1915, 1917, 1924, 1945, and 1972 (Table 2)) were in good agreement with cool and wet periods in northwestern Thailand (for example during 1834–1862, 1911–1930, 1940–1950, and 1970–1978) [64]. Abnormal and extremely negative growths (for example, in 1884–1885, 1905, and 1954 (Table 2)) corresponded to the drought periods recorded in the tree ring width chronologies from northwestern Thailand [64] and Vietnam [93] during 1880–1910 and 1950–1965. Anomalous annual growth values of the pine trees in this study were likely caused by anomalous rainfall events.
A previous study showed that the wet and dry periods recorded for pine TRW from northern Thailand were associated with ENSO [91]. Similar to a previous study, some of the anomalous positive growth years (for example in 1972, 1984, and 2018) and negative growth years (for example in 1954, 1983, and 1992) observed in our TRW correspond to La Niña and El Niño events, respectively [94,95]. In addition, the periodicity of approximately 7 years corresponds to the typical 2–8-year cycles for ENSO [96,97]. Previous studies on Thailand’s monsoon rainfall have also shown the spectral coherence of rainfall and ENSO at 2–5 years [21,60,63]. ENSO events may partially be responsible for the anomalous growth of Thai pine, which is in turn associated with the local climate conditions. The TRW index of P. latteri from northwestern Thailand can be further used as an indicator to investigate long-term climate change and the effects of past extreme rainfall events.

5. Conclusions

We developed a 180-year tree ring width chronology (i.e., the TRW index) of living pine trees (Pinus latteri) in Tak province of northwestern Thailand, spanning from 1843 to 2022. The TRW index was moderately correlated with annual total rainfall (r = 0.60, p < 0.001) and annual averaged relative humidity (r = 0.47, p < 0.001). Correlational analysis between the TRW index and the tree ring series from nearby sites (r = 0.48, p < 0.001) confirmed the common signals preserved in pine tree ring proxies within the same region. Anomalously high (for example, in 1853, 1984, 2011, and 2018) and low growths (for example, in 1954, 1983, 1992, and 1996) were found. Moreover, growth anomalies in the Thai pine in this study were related to changes in abnormal and extreme rainfall (r = 0.94, p < 0.001). An analysis of TRW periodicity exhibited that the approximately 7-year cycles correspond to the typical 2–8-year cycles for ENSO. This shows that ENSO events may be partially responsible for the anomalous growth of Thai pine, which is, in turn, associated with the local climate conditions. The TRW index of P. latteri from northwestern Thailand can be further used as an indicator to investigate long-term climate change and the effects of past extreme rainfall events in relation to ENSO.

Author Contributions

Conceptualization, N.P. and C.M.; methodology, data collection, experiment, and analysis, N.P., C.M., S.I., R.C., U.C. and U.P.; writing—original draft preparation, C.M. and S.I.; writing—review and editing, N.P., C.M. and S.I.; supervision, B.C. and U.C.; project administration, C.M. and S.B. All authors have read and agreed to the published version of the manuscript.

Funding

This research project is supported by Mahidol University (Fundamental Fund: fiscal year 2023 by National Science Research and Innovation Fund (NSRF)), grant number FF-117/2566 to Pumijumnong, N., Mahidol University (Fundamental Fund: fiscal year 2023 by National Science Research and Innovation Fund (NSRF)), grant number FF-121/2566 to Muangsong, C. This research project has been funded by Mahidol University (Fundamental Fund: fiscal year 2024 by the National Science Research and Innovation Fund (NSRF)), grant number FF-153/2567 to Muangsong, C., and the National Natural Science Foundation of China (grant numbers 42072213 and 41661144021) to Cai, B.

Data Availability Statement

Data will be made available on request.

Acknowledgments

We thank the editors and anonymous reviewers for their helpful comments.

Conflicts of Interest

The authors declare no conflicts of interest.

References

  1. Bhuiyan, M.A.; Jabeen, M.; Zaman, K.; Khan, A.; Ahmad, J.; Hishan, S.S. The impact of climate change and energy resources on biodiversity loss: Evidence from a panel of selected Asian countries. Renew. Energy 2018, 117, 324–340. [Google Scholar] [CrossRef]
  2. Weiskopf, S.R.; Rubenstein, M.A.; Crozier, L.G.; Gaichas, S.; Griffis, R.; Halofsky, J.E.; Hyde, K.J.W.; Morelli, T.L.; Morisette, J.T.; Muñoz, R.C.; et al. Climate change effects on biodiversity, ecosystems, ecosystem services, and natural resource management in the United States. Sci. Total Environ. 2020, 733, 137782. [Google Scholar] [CrossRef]
  3. Chettri, N.; Adhikari, B.; Chaudhary, S.; Wangchuk, K. Changing discourses in the third pole: A systematic review of climate change impact on biodiversity in the Hindu Kush Himalaya. Ecol. Indic. 2023, 155, 111046. [Google Scholar] [CrossRef]
  4. Rahman, M.; Slam, M.; Bräuning, A. Tree radial growth is projected to decline in South Asian moist forest trees under climate change. Glob. Planet. Chang. 2018, 170, 106–119. [Google Scholar] [CrossRef]
  5. de Wergifosse, L.; André, F.; Goosse, H.; Boczon, A.; Cecchini, S.; Ciceu, A.; Collalti, A.; Cools, N.; D’Andrea, E.; De Vos, B.; et al. Simulating tree growth response to climate change in structurally diverse oak and beech forests. Sci. Total Environ. 2022, 806, 150422. [Google Scholar] [CrossRef]
  6. Wu, G.; Xu, G.; Wang, B.; Liu, X.; Chen, T.; Kang, H. Post-drought moisture condition determines tree growth recovery after extreme drought events in the Tianshan Mountains, northwestern China. Ecol. Indic. 2023, 151, 110275. [Google Scholar] [CrossRef]
  7. Ngo, K.M.; Turner, B.L.; Muller-Landau, H.C.; Davies, S.J.; Larjavaara, M.; Nik Hassan, N.F.; Lum, S. Carbon stocks in primary and secondary tropical forests in Singapore. For. Ecol. Manag. 2013, 296, 81–89. [Google Scholar] [CrossRef]
  8. Deb, J.C.; Phinn, S.; Butt, N.; McAlpine, C.A. Identifying risks for tropical Asia climate change impacts on tropical forests. J. Trop. For. Sci. 2018, 30, 182–194. [Google Scholar]
  9. Raj, A.; Jhariya, M.K. Carbon storage, flux and mitigation potential of tropical Sal mixed deciduous forest ecosystem in Chhattisgarh, India. J. Environ. Manag. 2021, 293, 112829. [Google Scholar] [CrossRef] [PubMed]
  10. Gaisberger, H.; Fremout, T.; Kettle, C.J.; Vinceti, B.; Kemalasari, D.; Kanchanarak, T.; Thomas, E.; Serra-Diaz, J.M.; Svenning, J.-C.; Slik, F.; et al. Tropical and subtropical Asia’s valued tree species under threat. Conserv. Biol. 2022, 36, e13873. [Google Scholar] [CrossRef] [PubMed]
  11. Bordin, K.M.; Esquivel-Muelbert, A.; Bergamin, R.S.; Klipel, J.; Picolotto, R.C.; Frangipani, M.A.; Zanini, K.J.; Cianciaruso, M.V.; Jarenkow, J.A.; Jurinitz, C.F.; et al. Climate and large-sized trees, but not diversity, drive above-ground biomass in subtropical forests. For. Ecol. Manag. 2021, 490, 119126. [Google Scholar] [CrossRef]
  12. Hauck, M.; Csapek, G.; Dulamsuren, C. The significance of large old trees and tree cavities for forest carbon estimates. For. Ecol. Manag. 2023, 546, 121319. [Google Scholar] [CrossRef]
  13. Kripalani, R.H.; Singh, S.V.; Panchawagh, N.; Brikshavana, M. Variability of the summer monsoon rainfall over Thailand—Comparison with features over India. Int. J. Climatol. 1995, 15, 657–672. [Google Scholar] [CrossRef]
  14. Singhrattna, N.; Rajagopalan, B.; Clark, M.; Krishna Kumar, K. Seasonal forecasting of Thailand summer monsoon rainfall. Int. J. Climatol. 2005, 25, 649–664. [Google Scholar] [CrossRef]
  15. Limsakul, A.; Goes, J.I. Empirical evidence for interannual and longer period variability in Thailand surface air temperatures. Atmos. Res. 2008, 87, 89–102. [Google Scholar] [CrossRef]
  16. Räsänen, T.A.; Kummu, M. Spatiotemporal influences of ENSO on precipitation and flood pulse in the Mekong River Basin. J. Hydrol. 2013, 476, 154–168. [Google Scholar] [CrossRef]
  17. Ueangsawat, K. The impacts of ENSO phases on the variation of rainfall and stream flow in the Upper Ping River Basin, northern Thailand. Environ. Nat. Resour. J. 2013, 11, 97–119. [Google Scholar]
  18. Limsakul, A.; Singhruck, P. Long-term trends and variability of total and extreme precipitation in Thailand. Atmos. Res. 2016, 169, 301–317. [Google Scholar] [CrossRef]
  19. Limsakul, A.; Singhruck, P.; Wang, L. Climatology and spatio-temporal variability of wintertime total and extreme rainfall in Thailand during 1970–2012. EnvironmentAsia 2017, 10, 162–176. [Google Scholar]
  20. Trakolkul, C.; Charoenphon, C.; Satirapod, C. Impact of El Niño–Southern Oscillation (ENSO) on the Precipitable Water Vapor in Thailand from Long Term GPS Observation. Int. J. Geoinformatics 2022, 18, 13–20. [Google Scholar]
  21. Buckley, B.M.; Palakit, K.; Duangsathaporn, K.; Sanguantham, P.; Prasomsin, P. Decadal scale droughts over northwestern Thailand over the past 448 years: Links to the tropical Pacific and Indian Ocean sectors. Clim. Dyn. 2007, 29, 63–71. [Google Scholar] [CrossRef]
  22. Ummenhofer, C.C.; D’Arrigo, R.D.; Anchukaitis, K.J.; Buckley, B.M.; Cook, E.R. Links between Indo-Pacific climate variability and drought in the Monsoon Asia Drought Atlas. Clim. Dyn. 2013, 40, 1319–1334. [Google Scholar] [CrossRef]
  23. Muangsong, C.; Cai, B.; Pumijumnong, N.; Hu, C.; Cheng, H. An annually laminated stalagmite record of the changes in Thailand monsoon rainfall over the past 387 years and its relationship to IOD and ENSO. Quat. Int. 2014, 349, 90–97. [Google Scholar] [CrossRef]
  24. Räsänen, T.A.; Lindgren, V.; Guillaume, J.H.A.; Buckley, B.M.; Kummu, M. On the spatial and temporal variability of ENSO precipitation and drought teleconnection in mainland Southeast Asia. Clim. Past 2016, 12, 1889–1905. [Google Scholar] [CrossRef]
  25. Tan, L.; Shen, C.-C.; Löwemark, L.; Chawchai, S.; Edwards, R.L.; Cai, Y.; Breitenbach, S.F.M.; Cheng, H.; Chou, Y.-C.; Duerrast, H.; et al. Rainfall variations in central Indo-Pacific over the past 2700 y. Proc. Natl. Acad. Sci. USA 2019, 116, 17201–17206. [Google Scholar] [CrossRef] [PubMed]
  26. Chawchai, S.; Liu, G.; Bissen, R.; Scholz, D.; Riechelmann, D.F.C.; Vonhof, H.; Mertz-Kraus, R.; Chiang, H.-W.; Tan, L.; Wang, X. Hydroclimate variability of western Thailand during the last 1400 years. Quat. Sci. Rev. 2020, 241, 106423. [Google Scholar] [CrossRef]
  27. Hughes, M.K. Dendrochronology in climatology—The state of the art. Dendrochronologia 2002, 20, 95–116. [Google Scholar] [CrossRef]
  28. Martinelli, N. Climate from dendrochronology: Latest developments and results. Glob. Planet. Change 2004, 40, 129–139. [Google Scholar] [CrossRef]
  29. Smith, D.; Lewis, D. Dendrochronology. In Encyclopedia of Quaternary Science; Elias, S.A., Ed.; Elsevier: Oxford, UK, 2007; pp. 459–465. [Google Scholar]
  30. Vlam, M.; Baker, P.J.; Bunyavejchewin, S.; Zuidema, P.A. Temperature and rainfall strongly drive temporal growth variation in Asian tropical forest trees. Oecologia 2014, 174, 1449–1461. [Google Scholar] [CrossRef] [PubMed]
  31. Thomte, L.; Shah, S.K.; Mehrotra, N.; Saikia, A.; Bhagabati, A.K. Dendrochronology in the tropics using tree-rings of Pinus kesiya. Dendrochronologia 2023, 78, 126070. [Google Scholar] [CrossRef]
  32. Gebrekirstos, A.; Bräuning, A.; Sass-Klassen, U.; Mbow, C. Opportunities and applications of dendrochronology in Africa. Curr. Opin. Environ. Sustain. 2014, 6, 48–53. [Google Scholar] [CrossRef]
  33. Allen, K.J.; Freund, M.B.; Palmer, J.G.; Simkin, R.; Williams, L.; Brookhouse, M.; Cook, E.R.; Stewart, S.; Baker, P.J. Hydroclimate extremes in a north Australian drought reconstruction asymmetrically linked with Central Pacific Sea surface temperatures. Glob. Planet. Chang. 2020, 195, 103329. [Google Scholar] [CrossRef]
  34. Buckley, B.M.; Duangsathaporn, K.; Palakit, K.; Butler, S.; Syhapanya, V.; Xaybouangeun, N. Analyses of growth rings of Pinus merkusii from Lao P.D.R. For. Ecol. Manag. 2007, 253, 120–127. [Google Scholar] [CrossRef]
  35. Fan, Z.-X.; Bräuning, A.; Tian, Q.-H.; Yang, B.; Cao, K.-F. Tree ring recorded May–August temperature variations since A.D. 1585 in the Gaoligong Mountains, southeastern Tibetan Plateau. Palaeogeogr. Palaeoclimatol. Palaeoecol. 2010, 296, 94–102. [Google Scholar] [CrossRef]
  36. Ljungqvist, F.C.; Piermattei, A.; Seim, A.; Krusic, P.J.; Büntgen, U.; He, M.; Kirdyanov, A.V.; Luterbacher, J.; Schneider, L.; Seftigen, K.; et al. Ranking of tree-ring based hydroclimate reconstructions of the past millennium. Quat. Sci. Rev. 2020, 230, 106074. [Google Scholar] [CrossRef]
  37. Lopez-Saez, J.; Corona, C.; von Arx, G.; Fonti, P.; Slamova, L.; Stoffel, M. Tree-ring anatomy of Pinus cembra trees opens new avenues for climate reconstructions in the European Alps. Sci. Total Environ. 2023, 855, 158605. [Google Scholar] [CrossRef] [PubMed]
  38. Bolles, K.C.; Williams, A.P.; Cook, E.R.; Cook, B.I.; Bishop, D.A. Tree-Ring Reconstruction of the Atmospheric Ridging Feature That Causes Flash Drought in the Central United States Since 1500. Geophys. Res. Lett. 2021, 48, e2020GL091271. [Google Scholar] [CrossRef]
  39. Zheng, Z.; Jin, L.; Li, J.; Chen, J.; Zhang, X.; Wang, Z. Moisture variation inferred from tree rings in north central China and its links with the remote oceans. Sci. Rep. 2021, 11, 16463. [Google Scholar] [CrossRef]
  40. Li, Q.; Liu, Y.; Nakatsuka, T.; Song, H.; McCarroll, D.; Yang, Y.; Qi, J. The 225-year precipitation variability inferred from tree-ring records in Shanxi Province, the North China, and its teleconnection with Indian summer monsoon. Glob. Planet. Chang. 2015, 132, 11–19. [Google Scholar] [CrossRef]
  41. Harada, M.; Watanabe, Y.; Nakatsuka, T.; Tazuru-Mizuno, S.; Horikawa, Y.; Subiyanto, B.; Sugiyama, J.; Tsuda, T.; Tagami, T. Assessment of sungkai tree-ring δ18O proxy for paleoclimate reconstruction in western Java, Indonesia. Quat. Int. 2017, 432, 33–38. [Google Scholar] [CrossRef]
  42. Sano, M.; Li, Z.; Murakami, Y.; Jinno, M.; Ura, Y.; Kaneda, A.; Nakatsuka, T. Tree ring oxygen isotope dating of wood recovered from a canal in the ancient capital of Japan. J. Archaeol. Sci. Rep. 2022, 45, 103626. [Google Scholar] [CrossRef]
  43. Tang, W.; Fang, K.; Mei, Z.; Zhou, F.; Wu, H.; Seftigen, K.; Cao, X.; Dong, Z.; Bai, M.; Chen, Y. Drought variations in the southeastern Tibetan Plateau region since 1704 and their link to the Atlantic Multidecadal Oscillation. Palaeogeogr. Palaeoclimatol. Palaeoecol. 2023, 630, 111813. [Google Scholar] [CrossRef]
  44. Zhao, Y.; Xu, C.; Liu, Y.; An, W.; Guo, Z. Irrawaddy River experienced more frequent hydrological drought events with global warming: Evidence from a 400-year tree ring oxygen isotope record. Catena 2023, 232, 107455. [Google Scholar] [CrossRef]
  45. Liu, S.; Xu, C.; Fontana, C.; An, W.; Tomazello-Filho, M.; Zhao, Q.; Zhao, Y.; Liu, Y.; Guo, Z. Monthly Precipitation Reconstruction in Subtropical South America Using Seasonal Tree-Ring Oxygen Isotopes. J. Geophys. Res. Biogeosciences 2023, 128, e2023JG007490. [Google Scholar] [CrossRef]
  46. Xu, C.; Huang, R.; An, W.; Zhao, Q.; Zhao, Y.; Ren, J.; Liu, Y.; Guo, Z. Tree ring oxygen isotope in Asia. Glob. Planet. Chang. 2024, 232, 104348. [Google Scholar] [CrossRef]
  47. Pumijumnong, N.; Muangsong, C.; Buajan, S.; Songtrirat, P.; Chatwatthana, R.; Chareonwong, U. Factors Affecting Cambial Growth Periodicity and Wood Formation in Tropical Forest Trees: A Review. Forests 2023, 14, 1025. [Google Scholar] [CrossRef]
  48. Palakit, K.; Duangsathaporn, K.; Siripatanadilok, S. Climatic fluctuations trigger false ring occurrence and radial-growth variation in teak (Tectona grandis L.f.). iForest 2015, 9, 286–293. [Google Scholar] [CrossRef]
  49. Sharma, B.; Fan, Z.-X.; Panthi, S.; Gaire, N.P.; Fu, P.-L.; Zaw, Z. Warming induced tree-growth decline of Toona ciliata in (sub-) tropical southwestern China. Dendrochronologia 2022, 73, 125954. [Google Scholar] [CrossRef]
  50. Yang, R.-Q.; Fu, P.-L.; Fan, Z.-X.; Panthi, S.; Gao, J.; Niu, Y.; Li, Z.-S.; Bräuning, A. Growth-climate sensitivity of two pine species shows species-specific changes along temperature and moisture gradients in southwest China. Agric. For. Meteorol. 2022, 318, 108907. [Google Scholar] [CrossRef]
  51. Zhou, B.; Sterck, F.; Kruijt, B.; Fan, Z.-X.; Zuidema, P.A. Diel and seasonal stem growth responses to climatic variation are consistent across species in a subtropical tree community. New Phytol. 2023, 240, 2253–2264. [Google Scholar] [CrossRef]
  52. Quesada-Román, A.; Ballesteros-Cánovas, J.A.; St. George, S.; Stoffel, M. Tropical and subtropical dendrochronology: Approaches, applications, and prospects. Ecol. Indic. 2022, 144, 109506. [Google Scholar] [CrossRef]
  53. Wang, H.; Zhu, A.; Duan, A.; Wu, H.; Zhang, J. Responses to subtropical climate in radial growth and wood density of Chinese fir provenances, southern China. For. Ecol. Manag. 2022, 521, 120428. [Google Scholar] [CrossRef]
  54. Zhang, R.; Hu, Z.; Cherubini, P.; Cooper, D.J.; Zhu, L.; Lei, P. Tree-ring data reveal trees are suffering from severe drought stress in the humid subtropical forest. For. Ecol. Manag. 2023, 546, 121330. [Google Scholar] [CrossRef]
  55. Lumyai, P.; Duangsathaporn, K. Climate reconstruction on the growth of teak in umphang wildlife sanctuary, Thailand. Environ. Nat. Resour. J. 2018, 16, 21–30. [Google Scholar]
  56. Pumijumnong, N. Teak Tree Ring Widths: Ecology and Climatology Research in Northwest Thailand. Sci. Technol. Dev. 2012, 31, 165–174. [Google Scholar]
  57. Lumyai, P.; Palakit, K.; Duangsathaporn, K.; Wanthongchai, K. A 324-years temperature reconstruction from Pinus latteri mason at highland in Chiang Mai Province, Thailand. Biodiversitas 2020, 21, 3938–3945. [Google Scholar] [CrossRef]
  58. Nguyen, H.T.T.; Galelli, S.; Xu, C.; Buckley, B.M. Droughts, Pluvials, and Wet Season Timing Across the Chao Phraya River Basin: A 254-Year Monthly Reconstruction from Tree Ring Widths and δ18O. Geophys. Res. Lett. 2022, 49, e2022GL100442. [Google Scholar] [CrossRef]
  59. Pumijumnong, N.; Wanyaphet, T. Seasonal cambial activity and tree-ring formation of Pinus merkusii and Pinus kesiya in Northern Thailand in dependence on climate. For. Ecol. Manag. 2006, 226, 279–289. [Google Scholar] [CrossRef]
  60. Lumyai, P.L.; Duangsathaporn, K. Pine growth variation and climate change: Opportunities for dendroclimatology in central Thailand. J. Trop. For. Res. 2017, 1, 23–35. [Google Scholar]
  61. Pumimnong, N.; Eckstein, D. Reconstruction of pre-monsoon weather conditions in northwestern Thailand from the tree-ring widths of Pinus merkusii and Pinus kesiya. Trees 2011, 25, 125–132. [Google Scholar] [CrossRef]
  62. Xu, C.; Pumijumnong, N.; Nakatsuka, T.; Sano, M.; Li, Z. A tree-ring cellulose δ18O-based July–October precipitation reconstruction since AD 1828, northwest Thailand. J. Hydrol. 2015, 529, 433–441. [Google Scholar] [CrossRef]
  63. Duangsathaporn, K.; Palakit, K. Climatic Signals Derived from the Growth Variation and Cycles of Pinus merkusii in Easternmost Thailand. Thai J. For. 2022, 32, 9–23. [Google Scholar]
  64. Pumijumnong, N.; Muangsong, C.; Panthi, S.; Buajan, S.; Cai, B.; Kulsuwan, P.; Kongsombat, P. A 225-year pine (Pinus latteri) tree-ring record of pre-monsoon relative humidity variation in Nan province of northern Thailand and the linkage with large-scale ocean-atmospheric circulations. Glob. Planet. Chang. 2023, 230, 104277. [Google Scholar] [CrossRef]
  65. Thai Meteorological Department. Average Rainfall, Temperature, and Relative Humidity Data. 2023. Available online: http://www.tmd.go.th/ (accessed on 1 January 2023).
  66. Buckley, B.M.; Barbetti, M.; Watanasak, M.; Arrigo, R.D.; Boonchirdchoo, S.; Sarutanon, S.J.I.J. Dendrochronological Investigations in Thailand. Iawa J. 1995, 16, 393–409. [Google Scholar] [CrossRef]
  67. Rakthai, S.; Fu, P.-L.; Fan, Z.-X.; Gaire, N.P.; Pumijumnong, N.; Eiadthong, W.; Tangmitcharoen, S. Increased Drought Sensitivity Results in a Declining Tree Growth of Pinus latteri in Northeastern Thailand. Forests 2020, 11, 361. [Google Scholar] [CrossRef]
  68. Naumthong, M.; Palakit, K.; Duangsathaporn, K.; Prasomsin, P.; Lumyai, P. Climate effects on the growth of Pinus latteri and Pinus kesiya at the intakin silvicultural research station, Chiang mai province, Thailand. Biodiversitas 2021, 22, 2512–2519. [Google Scholar] [CrossRef]
  69. Rinn, F. TSAP-WinTM: Time Series Analysis and Presentation for Dendrochronology and Related Applications; Version 4.64 for Microsoft Windows User Reference; Rinntech: Heidelberg, Germany, 2011. [Google Scholar]
  70. Ng’andwe, P.; Chungu, D.; Tailoka, F.; Bwembya, M. Tree-ring chronology data of non-native Pinus kesiya (Royle ex Gordon) in Zambia. Data Brief 2021, 38, 107447. [Google Scholar] [CrossRef] [PubMed]
  71. Rohner, B.; Weber, P.; Thürig, E. Bridging tree rings and forest inventories: How climate effects on spruce and beech growth aggregate over time. For. Ecol. Manag. 2016, 360, 159–169. [Google Scholar] [CrossRef]
  72. Altieri, S.; Niccoli, F.; Kabala, J.P.; Liyaqat, I.; Battipaglia, G. Influence of drought and minimum temperature on tree growth and water use efficiency of Mediterranean species. Dendrochronologia 2024, 83, 126162. [Google Scholar] [CrossRef]
  73. Holmes, R.L. Dendrochronology Program Library, Installation and Program Manual; Lab. of Tree-Ring Research, University of Arizona: Tucson, AZ, USA, 1992. [Google Scholar]
  74. Grissino-Mayer, H.D. Evaluating crossdating accuracy: A manual and tutorial for the computer program COFECHA. Tree-Ring Res. 2001, 57, 205–221. [Google Scholar]
  75. Diao, H.; Wang, A.; Gharun, M.; Saurer, M.; Yuan, F.; Guan, D.; Dai, G.; Wu, J. Tree-ring δ13C of Pinus koraiensis is a better tracer of gross primary productivity than tree-ring width index in an old-growth temperate forest. Ecol. Indic. 2023, 153, 110418. [Google Scholar] [CrossRef]
  76. Cook, E.; Krusic, P. Program ARSTAN: A Tree-Ring Standardization Program Based on Detrending and Autoregressive Time Series Modeling, with Interactive Graphics; Lamont-Doherty Earth Observatory, Columbia University: New York, NY, USA, 2005. [Google Scholar]
  77. Cook, E.R.; Peters, K. The smoothing spline: A new approach to standardizing forest interior Tree-Ring widths series for dendroclimatic studies. Tree-Ring Bull. 1981, 41, 45–53. [Google Scholar]
  78. Davis, C.J.; Hanna, E.G. Temperature and rainfall trends in northern Australia 1911−2013mimplications for human activity and regional development. Clim. Res. 2016, 71, 1–16. [Google Scholar] [CrossRef]
  79. Zaveri, E.; Russ, J.; Damania, R. Rainfall anomalies are a significant driver of cropland expansion. Proc. Natl. Acad. Sci. USA 2020, 117, 10225–10233. [Google Scholar] [CrossRef] [PubMed]
  80. Wang, T.; Bao, A.; Xu, W.; Yu, R.; Zhang, Q.; Jiang, L.; Nzabarinda, V. Tree-ring-based assessments of drought variability during the past 400 years in the Tianshan mountains, arid Central Asia. Ecol. Indic. 2021, 126, 107702. [Google Scholar] [CrossRef]
  81. Hammer, Ø.; Harper, D.A.T.; Ryan, P.D. PAST: Paleontological statistics software package for education and data analysis. Palaeontol. Electron. 2001, 4, 1–9. [Google Scholar]
  82. Menking, K.M. Decadal to millennial-scale solar forcing of Last Glacial Maximum climate in the Estancia Basin of central New Mexico. Quat. Res. 2015, 83, 545–554. [Google Scholar] [CrossRef]
  83. Azharuddin, S.; Govil, P.; Singh, A.D.; Mishra, R.; Shekhar, M. Solar insolation driven periodicities in southwest monsoon and its impact on NE Arabian Sea paleoceanography. Geosci. Front. 2019, 10, 2251–2263. [Google Scholar] [CrossRef]
  84. Hackett, W.P. Juvenility and Maturity. In Cell and Tissue Culture in Forestry: General Principles and Biotechnology; Bonga, J.M., Durzan, D.J., Eds.; Springer: Dordrecht, The Netherlands, 1987; pp. 216–231. [Google Scholar]
  85. Pretzsch, H. The course of tree growth. Theory and reality. For. Ecol. Manag. 2020, 478, 118508. [Google Scholar] [CrossRef]
  86. Tonelli, E.; Vitali, A.; Piermattei, A.; Urbinati, C. Are young trees suitable for climate-growth analysis? A trial with Pinus nigra in the central Apennines treeline. Dendrochronologia 2020, 62, 125720. [Google Scholar] [CrossRef]
  87. Esper, J.; Niederer, R.; Bebi, P.; Frank, D. Climate signal age effects—Evidence from young and old trees in the Swiss Engadin. For. Ecol. Manag. 2008, 255, 3783–3789. [Google Scholar] [CrossRef]
  88. Schulz, M.; Mudelsee, M. REDFIT: Estimating red-noise spectra directly from unevenly spaced paleoclimatic time series. Comput. Geosci. 2002, 28, 421–426. [Google Scholar] [CrossRef]
  89. Wigley, T.M.L.; Briffa, K.R.; Jones, P.D. On the Average Value of Correlated Time Series, with Applications in Dendroclimatology and Hydrometeorology. J. Appl. Meteorol. Climatol. 1984, 23, 201–213. [Google Scholar] [CrossRef]
  90. Briffa, K.R.; Jones, P.D. Basic chronology statistics and assessment. In Methods of Dendrochronology: Applications in the Environmental Sciences; Cook, E.R., Kairiukstis, L.A., Eds.; Kluwer Academic Publishers: Norwell, MA, USA, 1990; pp. 137–152. Available online: https://www.springer.com/gb/book/9780792305866 (accessed on 30 August 2023).
  91. Pumijumnong, N.; Palakit, K. Effects of Climate Variability on the Annual and Intra-annual Ring Formation of Pinus merkusii growing in Central Thailand. Environ. Nat. Resour. J. 2020, 18, 234–248. [Google Scholar] [CrossRef]
  92. Panthi, S.; Fan, Z.-X.; van der Sleen, P.; Zuidema, P.A. Long-term physiological and growth responses of Himalayan fir to environmental change are mediated by mean climate. Glob. Change Biol. 2020, 26, 1778–1794. [Google Scholar] [CrossRef] [PubMed]
  93. Sano, M.; Buckley, B.M.; Sweda, T. Tree-ring based hydroclimate reconstruction over northern Vietnam from Fokienia hodginsii: Eighteenth century mega-drought and tropical Pacific influence. Clim. Dyn. 2009, 33, 331–340. [Google Scholar] [CrossRef]
  94. Gergis, J.L.; Fowler, A.M. Classification of synchronous oceanic and atmospheric El Niño-Southern Oscillation (ENSO) events for palaeoclimate reconstruction. Int. J. Climatol. 2005, 25, 1541–1565. [Google Scholar] [CrossRef]
  95. Gergis, J.L.; Fowler, A.M. A history of ENSO events since A.D. 1525: Implications for future climate change. Clim. Chang. 2009, 92, 343–387. [Google Scholar] [CrossRef]
  96. D’Arrigo, R.; Cook, E.R.; Wilson, R.J.; Allan, R.; Mann, M.E. On the variability of ENSO over the past six centuries. Geophys. Res. Lett. 2005, 32, L03711. [Google Scholar] [CrossRef]
  97. Li, J.; Xie, S.-P.; Cook, E.R.; Huang, G.; D’Arrigo, R.; Liu, F.; Ma, J.; Zheng, X.-T. Interdecadal modulation of El Niño amplitude during the past millennium. Nat. Clim. Chang. 2011, 1, 114–118. [Google Scholar] [CrossRef]
Figure 1. (a) A map of Tak province in northwestern Thailand showing the locations of the tree ring sampling site (16°05′17.8″ N 98°51’38.6″ E; 375 m asl) and Mae Sot meteorological station (16°40′ N 98°33′ E; 196 m asl). The inserted image shows a map of the study region, highlighting the area of Tak province. (b) The monthly average rainfall (RF) (black vertical bars); relative humidity (RH) (gray vertical bars); and minimum (TMin) (black dashed line), maximum (TMax) (black solid line), and average (TAvr) (black solid line with symbols) temperatures obtained from Tak meteorological station between 1951 and 2022 [65]. (c) A large-scale map of the upper part of Thailand showing the tree ring sampling site (blue solid symbol), the Mae Sot meteorological station (pink solid symbol), and the distribution of P. latteri trees obtained from previous published research on the TRW of P. latteri in Thailand, including Lumyai and Duangsathaporn [60] (cyan solid symbol), Pumijumnong [61] (red solid symbol), Buckly [66] (yellow solid symbol), Rakthai et al. [67] (orange solid symbol), and Naumthong et al. [68] (purple solid symbol).
Forests 15 00345 g001
Figure 2. (a) Tree ring width residual chronology (TRW index) (black line), the 11-year running average filters (red line), and sample depths (gray shaded area) between 1814 and 2022. The solid vertical line indicates the core samples ≥ 3 after 1843; (b) the expressed population signal (EPS) (solid black line with circles); and (c) the mean interseries correlation (Rbar) (solid black line with circles). The horizontal gray solid line represents the EPS level of 0.85.
Forests 15 00345 g002
Figure 3. Average tree-ring width of Thai pine by decades between 1814 and 2022.
Forests 15 00345 g003
Figure 4. Correlation coefficients between TRW chronology of P. latterri and monthly (from October of the previous year (p) to December of the current year (c)), seasonal (MAM and MO), and annual climate parameters, including (a) monthly total rainfall (RF) (black vertical bars) and averaged relative humidity (RH) (gray vertical bars) and (b) temperatures (TMin (black vertical bars), TMax (gray vertical bars), and TAvr (solid black line with symbols)) of the Mae Sot meteorological station for the 1951–2022 period. The gray horizontal solid and dashed lines indicate correlation coefficients at the 99% (p < 0.01) and 95% (p < 0.05) confidence levels, respectively.
Forests 15 00345 g004
Figure 5. Correlational analyses of extreme and abnormal growth obtained from the TRW index with (a) rainfallMay-Jul reconstruction (1843–2008) and (b) anomalous rainfallMay-Jul reconstruction in this area derived from [61]. Linear regressions are shown in black lines; r represents Pearson’s correlation coefficient, p indicates a statistically significant value, and n is the number of samples.
Forests 15 00345 g005
Figure 6. Spectral analysis of the TRW index using Redfit [88]. Gray-shaded areas indicate the power spectrum of the growth rings. The solid and dashed lines represent the 99% and 95% confidence limits, respectively, relative to the red-noise spectrum. The confidence limits were estimated using a Monte Carlo simulation. Significant peaks are labeled for each period.
Forests 15 00345 g006
Figure 7. Comparison between the TRW index (gray line) and the PC1 index (gray line) from northwestern Thailand [61]. The black solid line represents the 9-year running average filter. r represents Pearson’s correlation coefficient, p indicates a statistically significant value, and n is the number of samples.
Forests 15 00345 g007
Table 1. Statistical characteristics of the TRW chronology of Pinus latteri in Tak province of northwestern Thailand.
Statistical ItemsStatistical Values
Cores/Trees (n)31/16
Time span (AD)1843–2022
Number of years180
Mean length of series (year)111
Mean sensitivity (MS)0.25
Mean interseries correlation (Rbar)0.34
Expressed population signal (EPS)0.84
First year in which EPS value ≥0.85 (number of trees)1918 (13)
Table 2. The abnormal (mean +σ and −σ) and extreme (mean +2σ and −2σ) positive and negative growth years derived from the TRW index.
ClassifiedYears
Abnormally positive1870, 1873,1878, 1880, 1889, 1892, 1893, 1902, 1908, 1910, 1915, 1917, 1924, 1938, 1945, 1953, 1972, 1984, 1987, 2013, 2018, 2019
Extremely positive1853, 1857, 1879, 2011
Abnormally negative1852, 1855, 1858, 1862, 1864, 1884, 1885, 1905, 1911, 1913, 1921, 1954, 1983, 1992, 1996
Extremely negative1846, 1872
Disclaimer/Publisher’s Note: The statements, opinions and data contained in all publications are solely those of the individual author(s) and contributor(s) and not of MDPI and/or the editor(s). MDPI and/or the editor(s) disclaim responsibility for any injury to people or property resulting from any ideas, methods, instructions or products referred to in the content.

