
Changing Dynamic of Tree Species Composition and Diversity: A Case Study of Secondary Forests in Northern China in Response to Climate Change
Abstract
1. Introduction
2. Methods
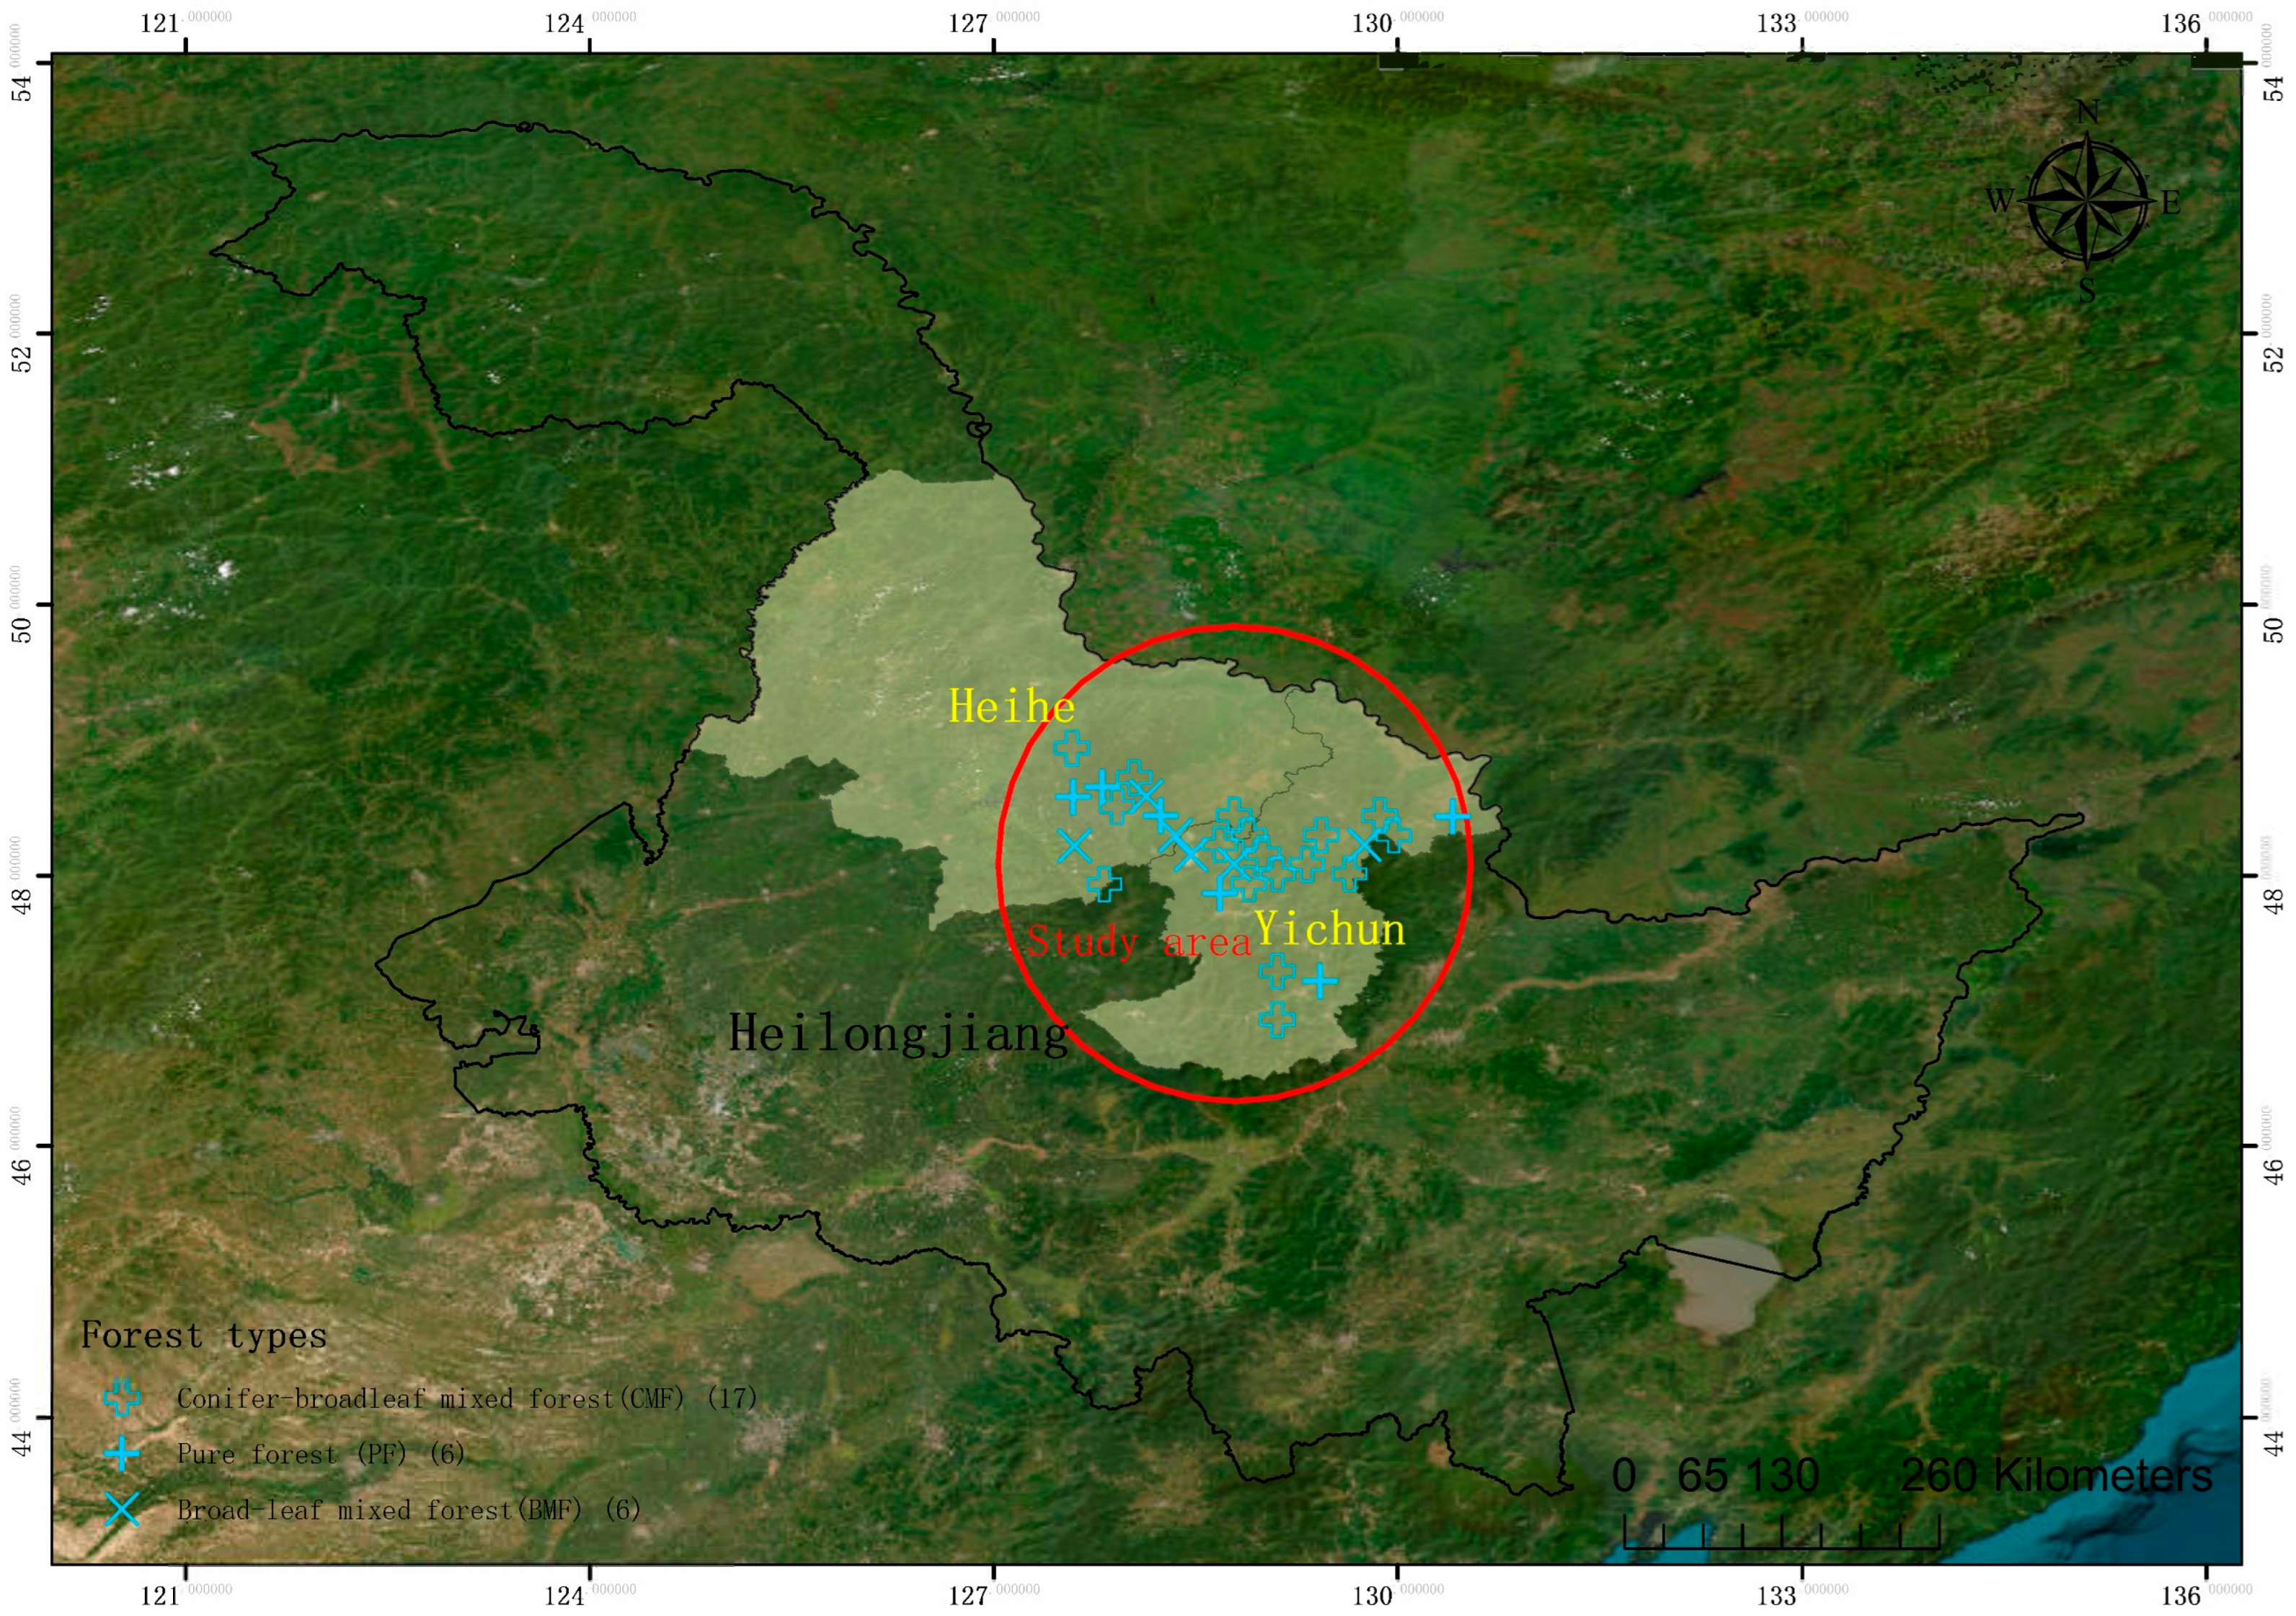
2.1. Study Area
2.2. Experimental Design
2.3. Climatic Data
2.4. Data Analysis
3. Results
3.1. Analysis of Regional Climate Change
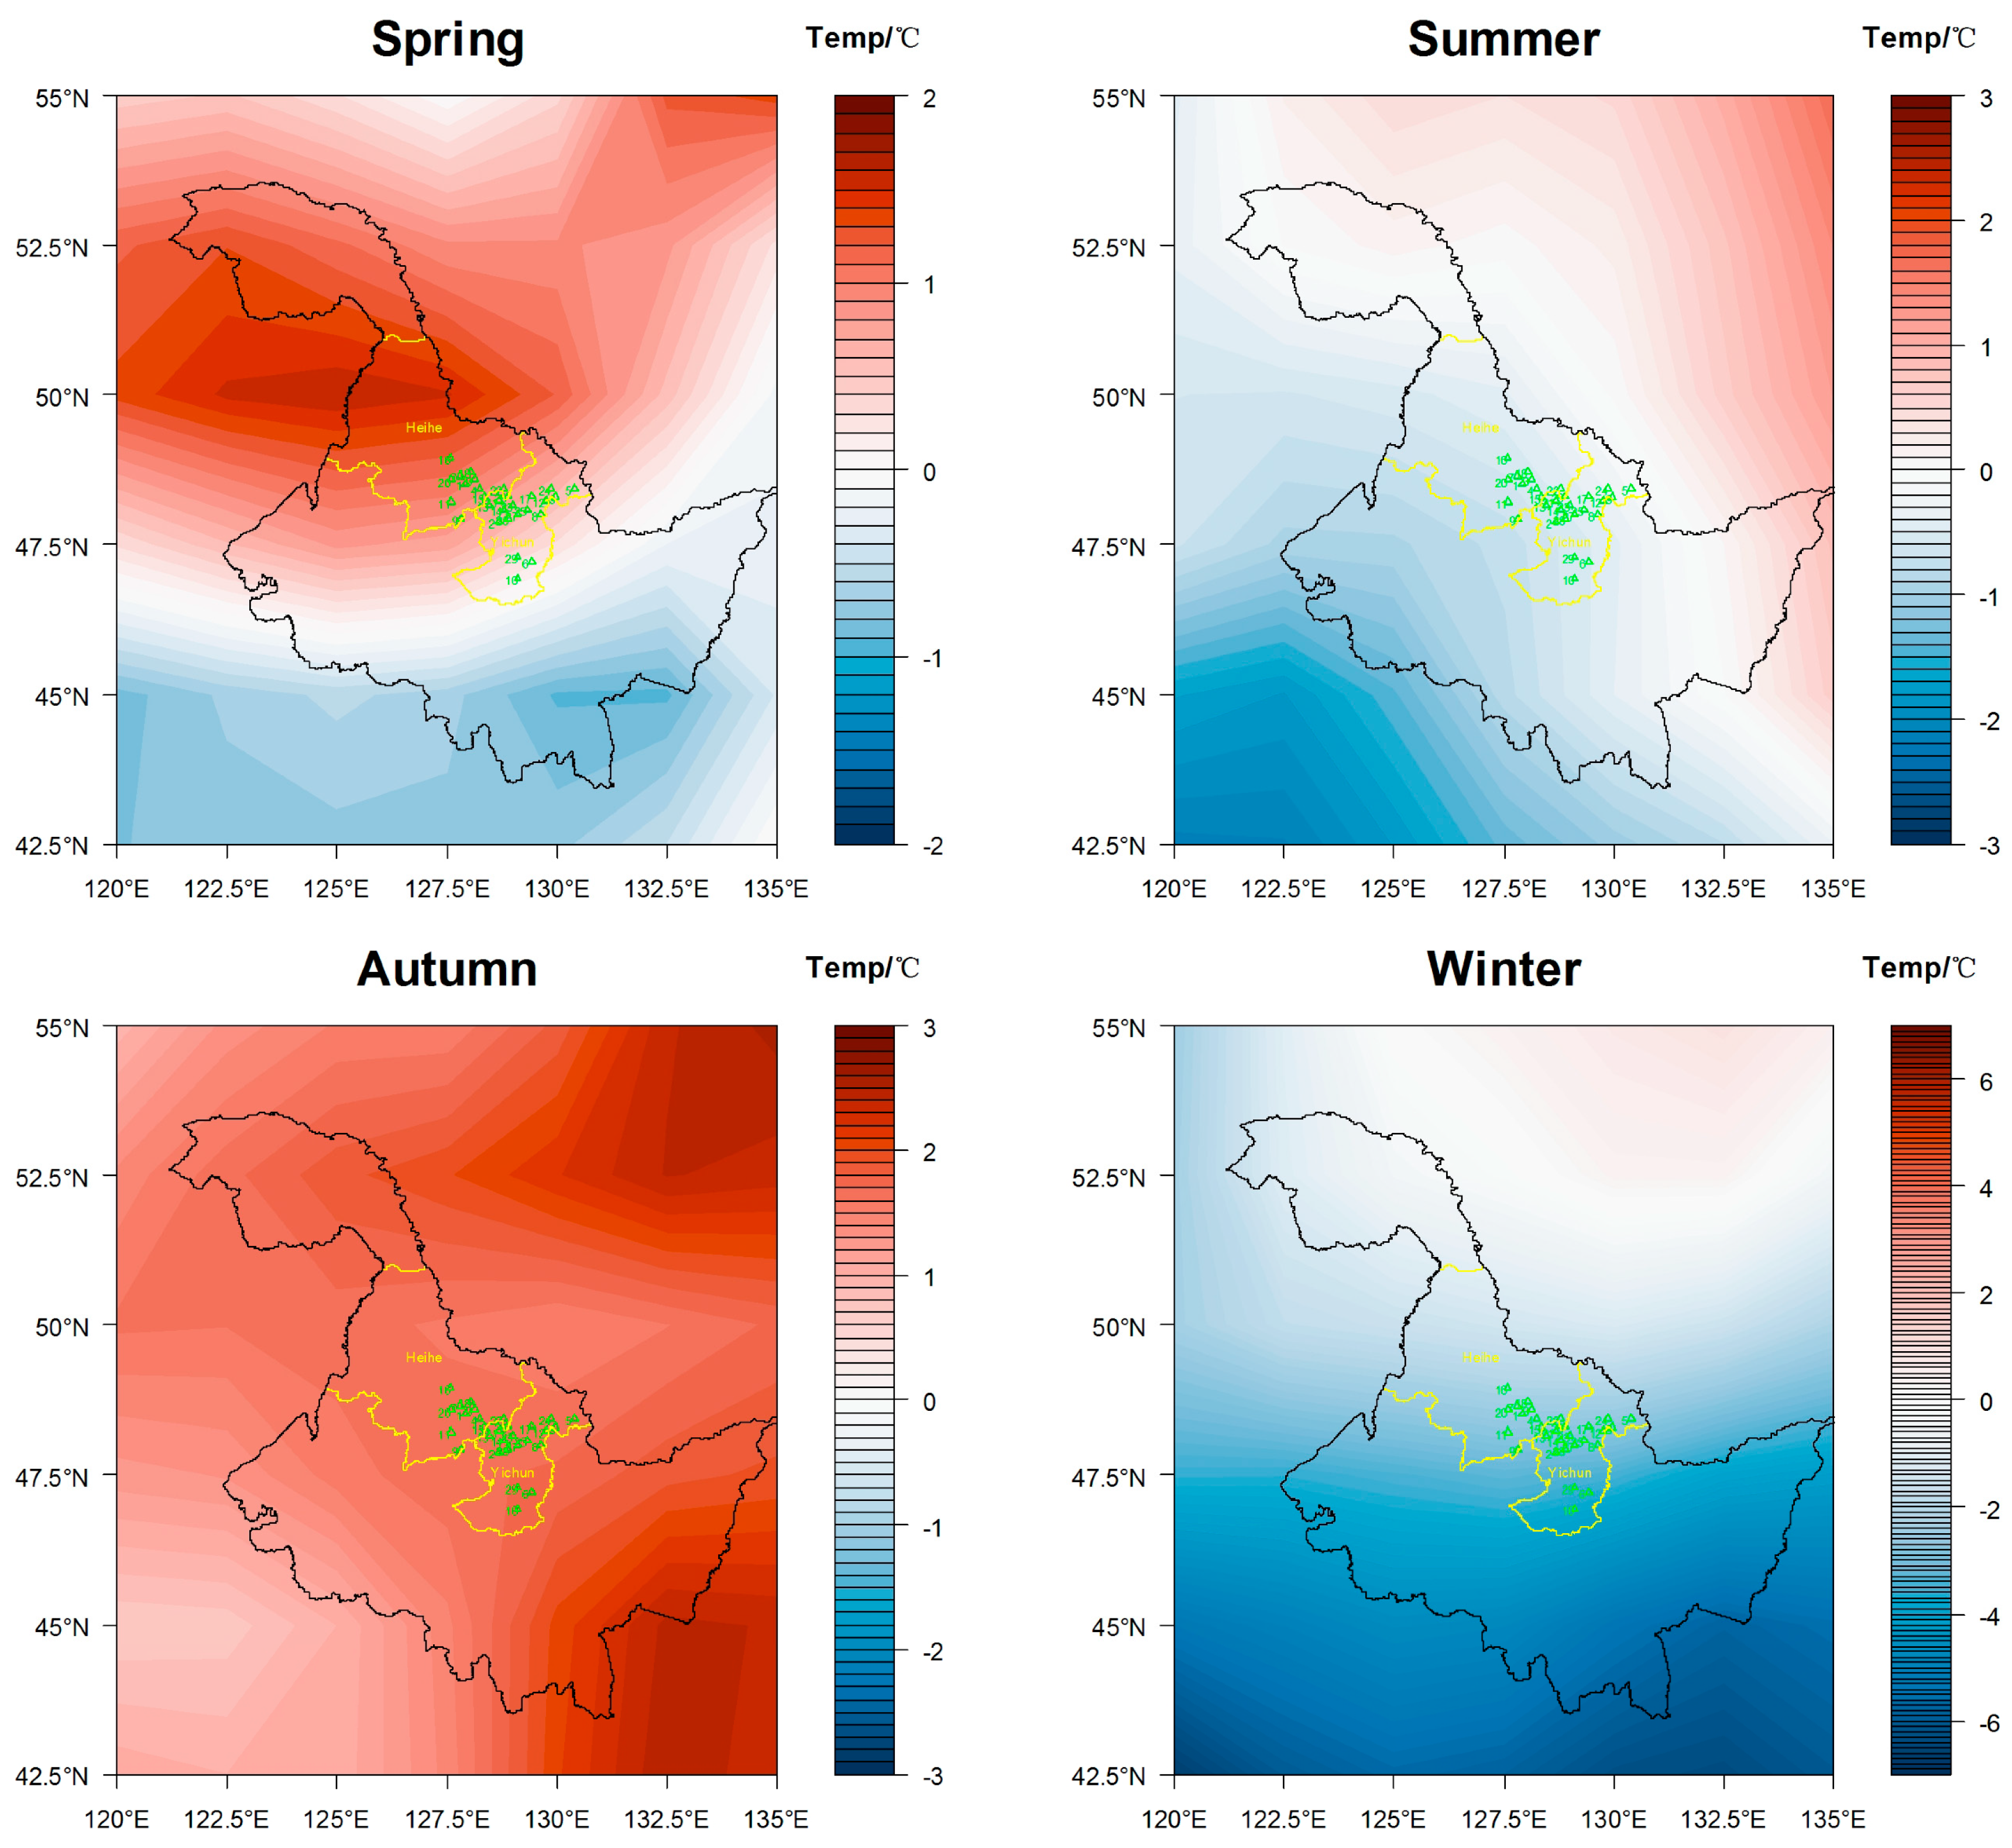
3.1.1. Temperature
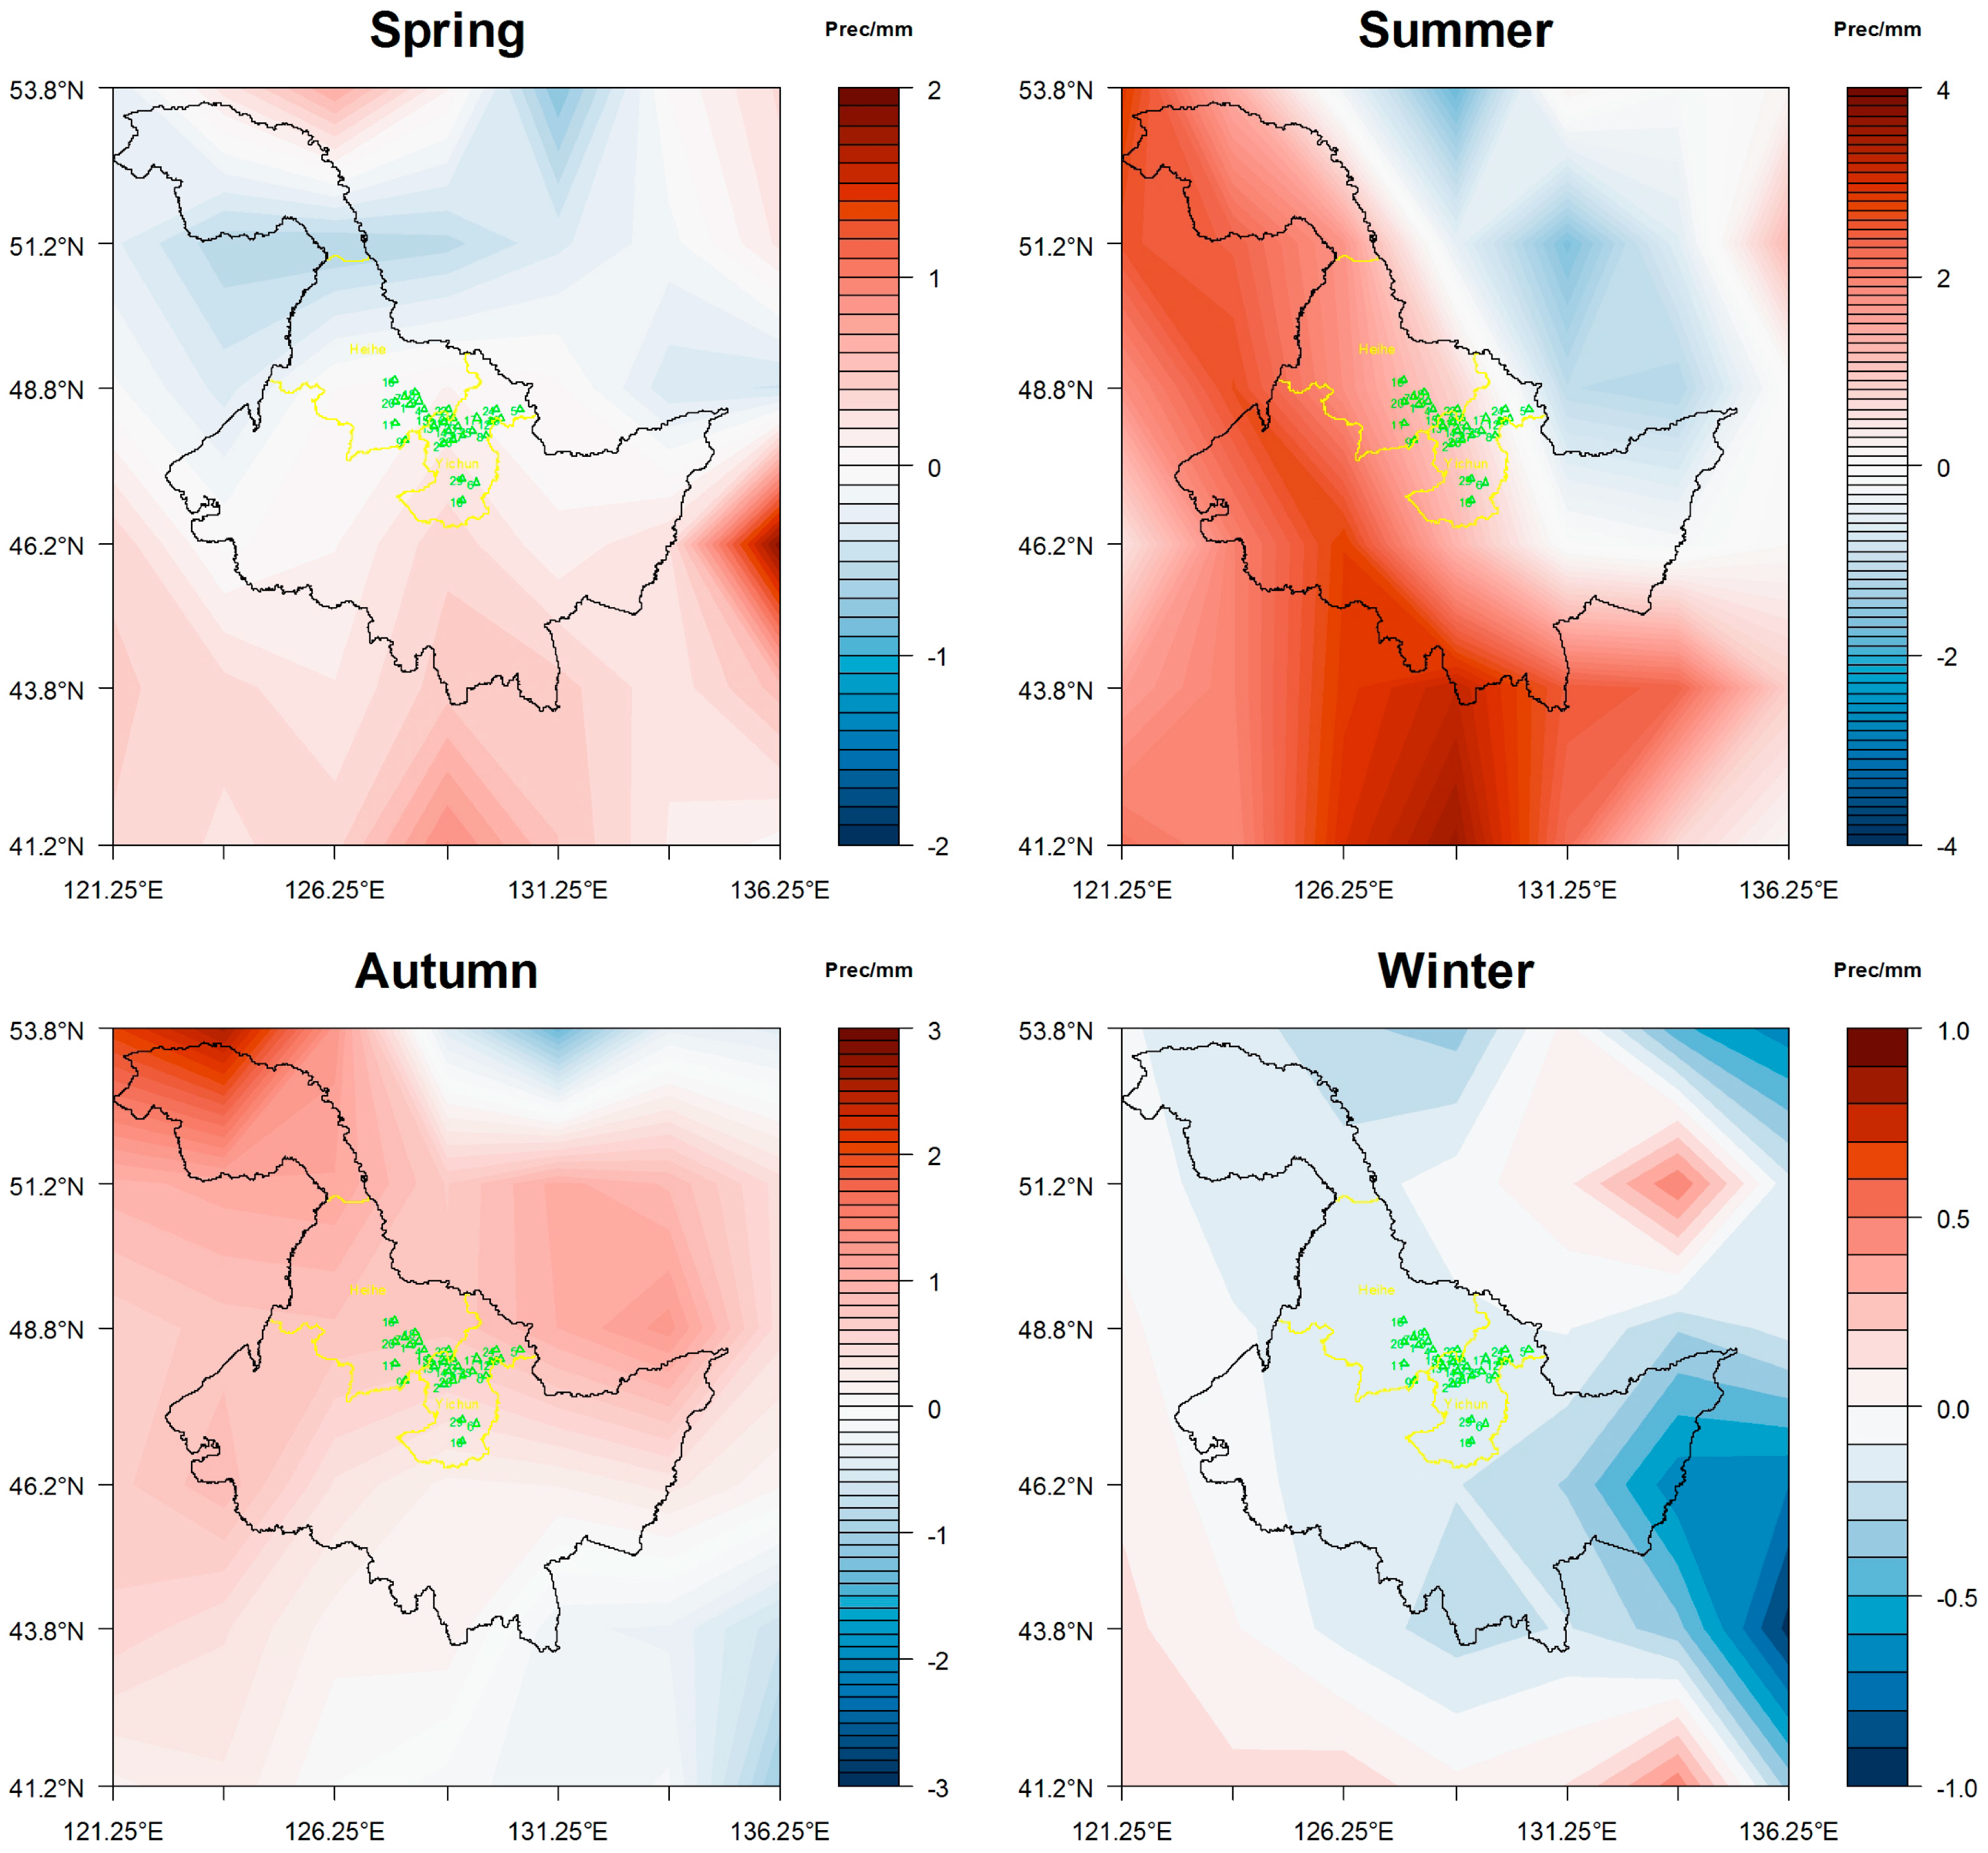
3.1.2. Precipitation
3.2. Changes in the Composition of Tree Species
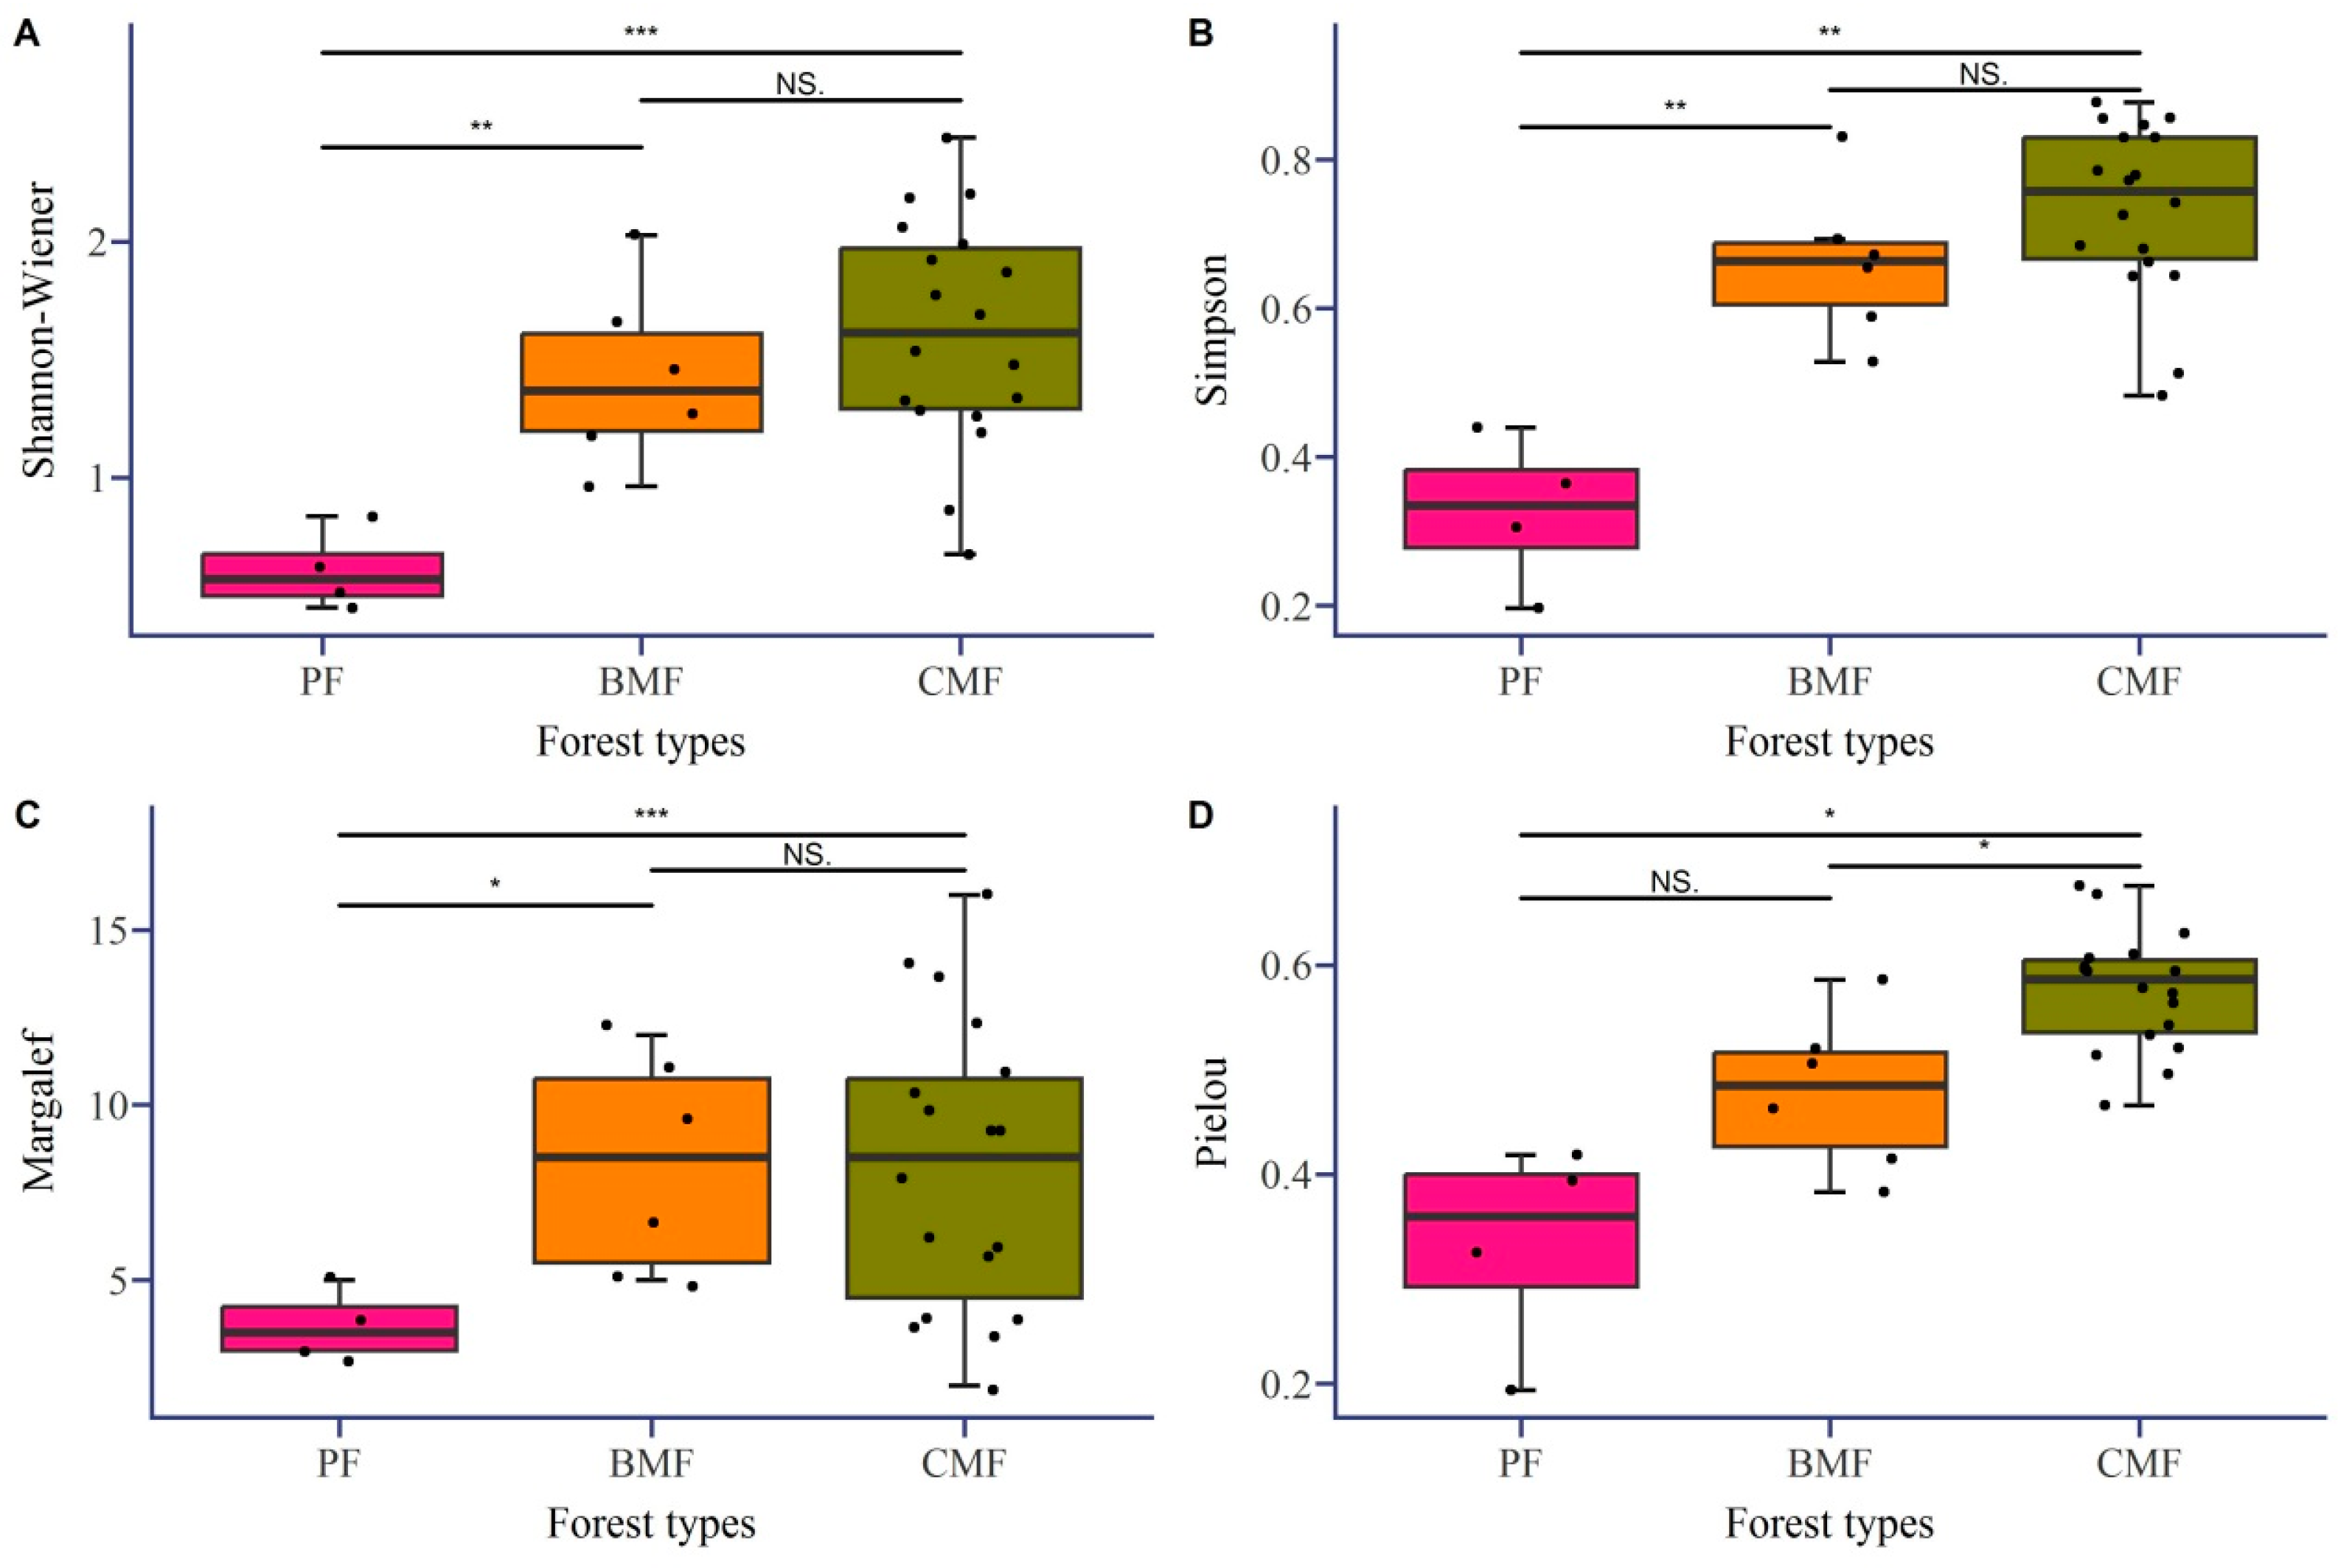
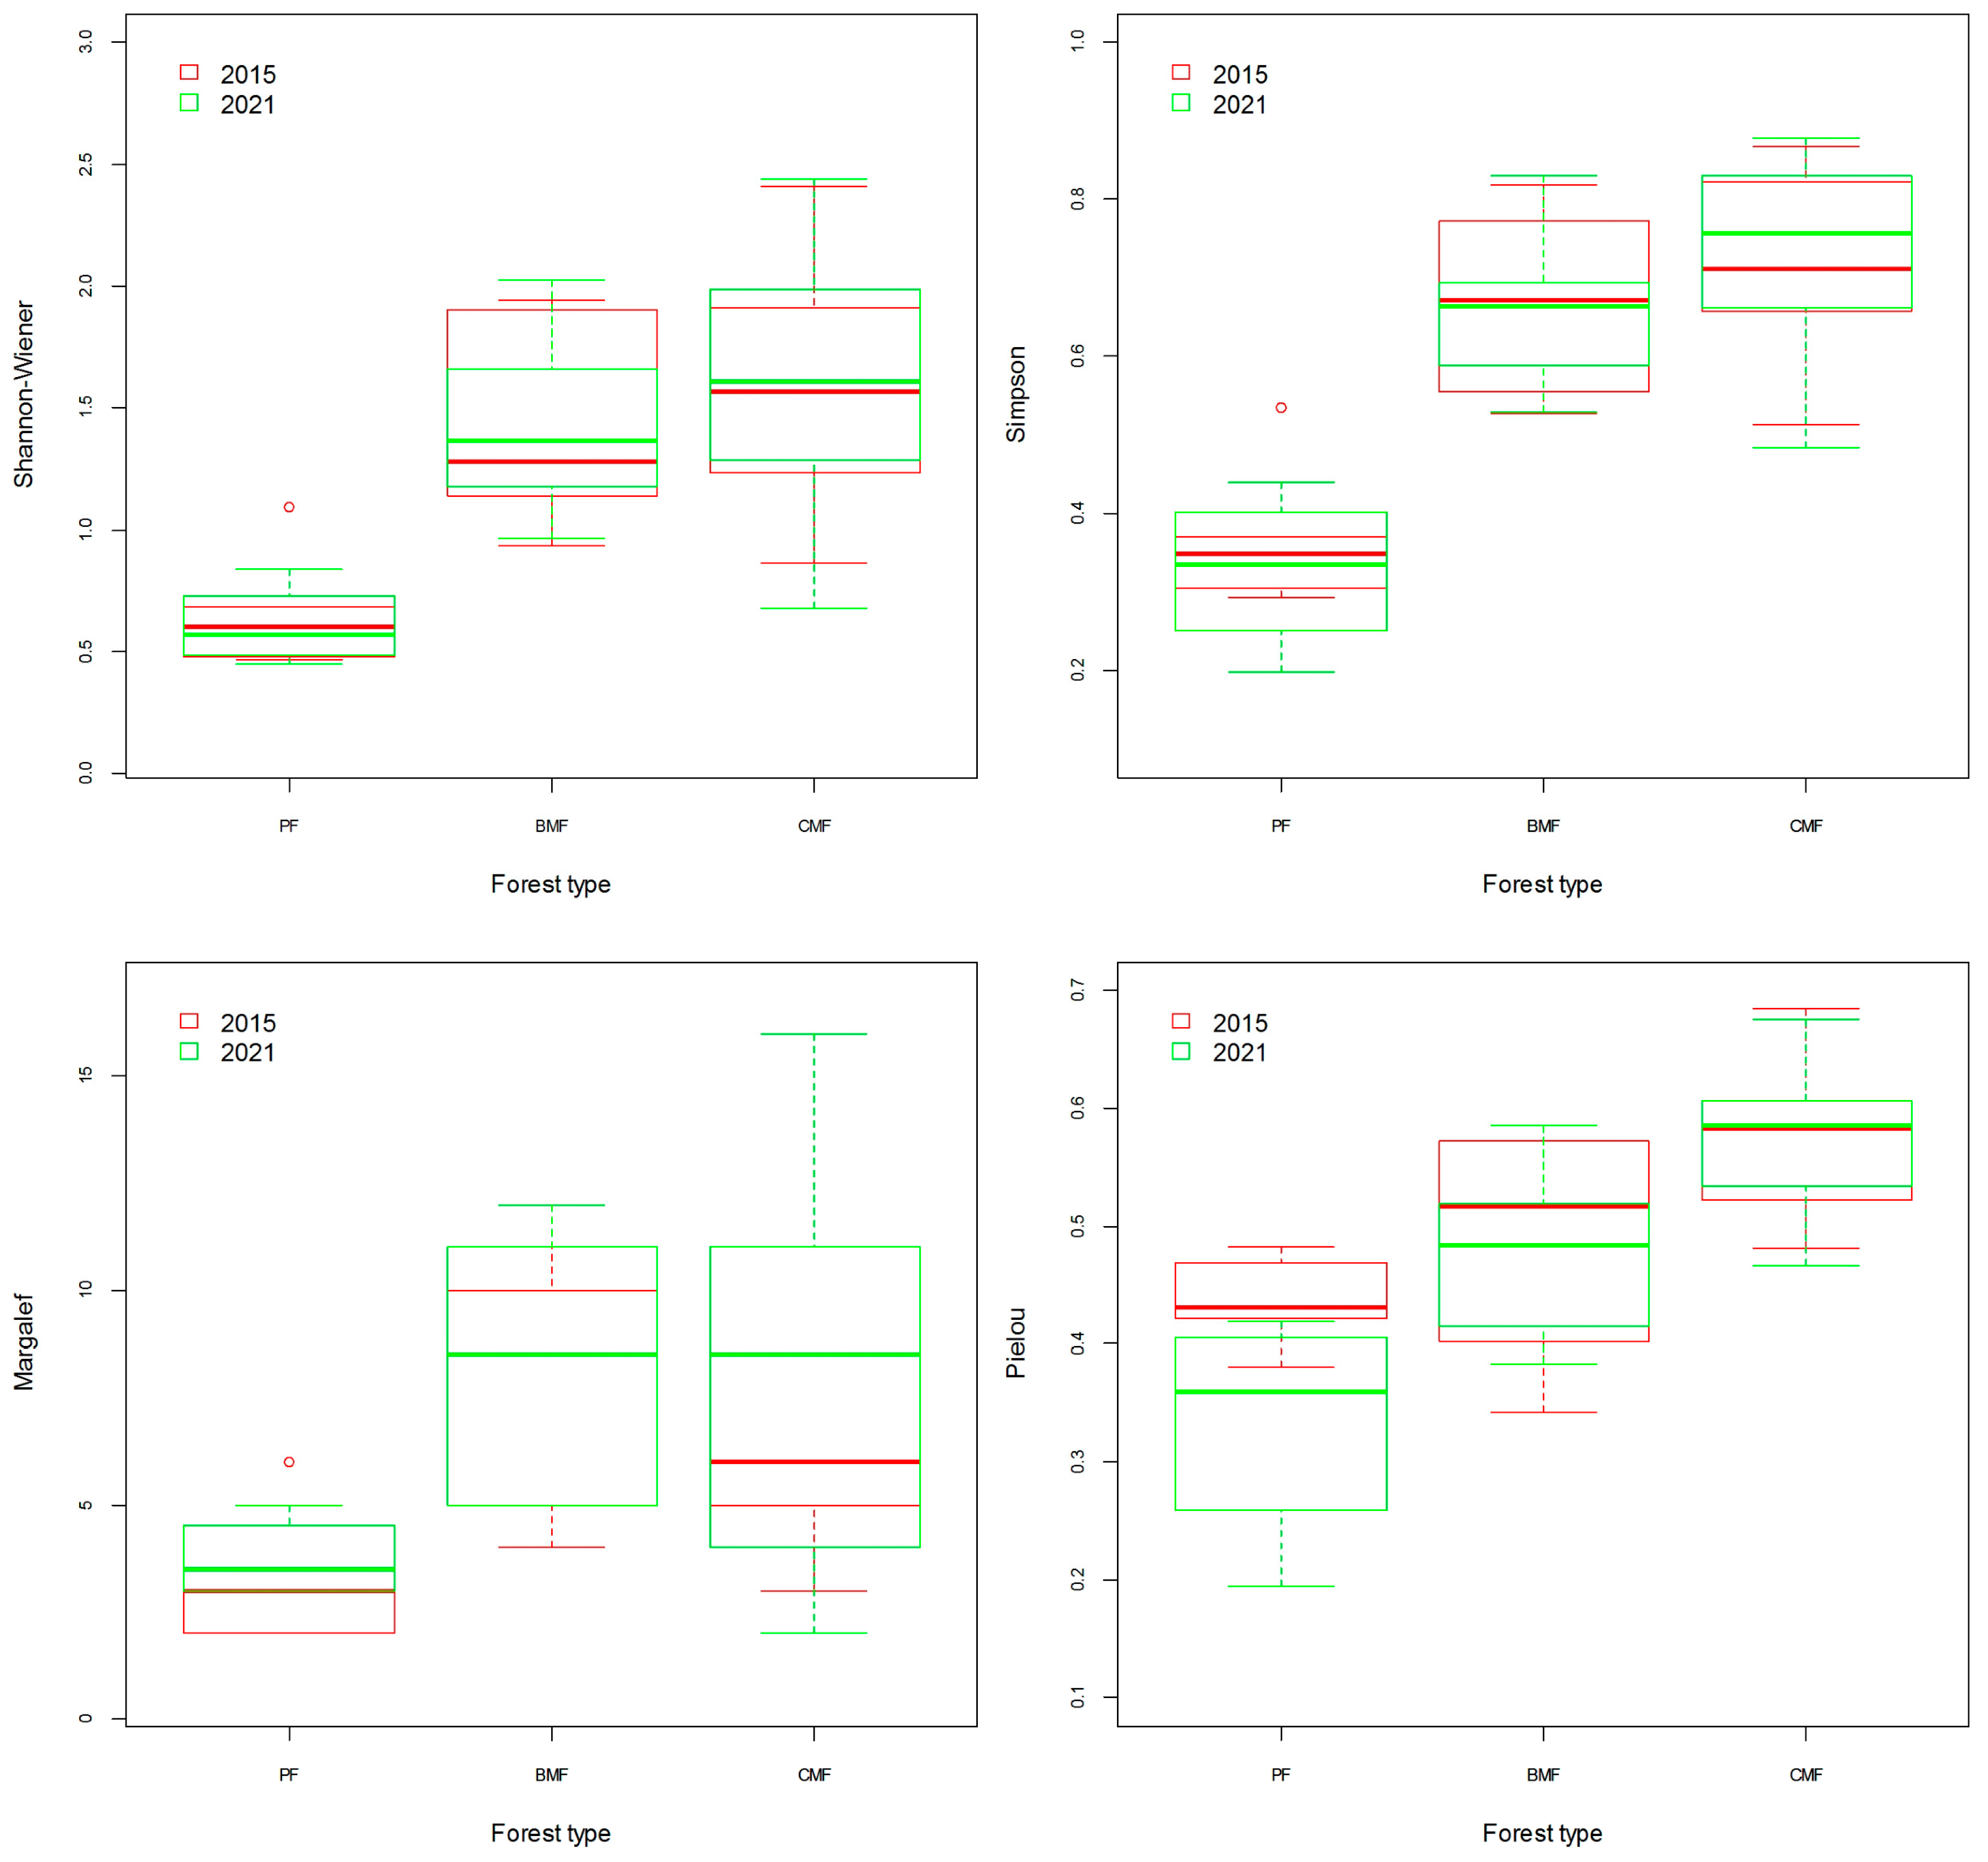
3.3. Analysis of Diversity of Tree Species
4. Discussion
5. Conclusions
Author Contributions
Funding
Data Availability Statement
Conflicts of Interest
References
- Lee, H.; Calvin, K.; Dasgupta, D.; Krinner, G.; Mukherji, A.; Thorne, P.; Trisos, C.; Romero, J.; Aldunce, P.; Barret, K.; et al. Summary for Policymakers. In Climate Change 2023: Contribution of Working Groups I, II and III to the Sixth Assessment Report of the Intergovernmental Panel on Climate Change; Core Writing Team, Lee, H., Romero, J., Eds.; Synthesis Report; IPCC: Geneva, Switzerland, 2023; pp. 1–34. [Google Scholar]
- Jonathan, A.P.; Diarmid, C.; Tracey, H.; Jonathan, A.F. Impact of regional climate change on human health. Nature 2005, 438, 310–317. [Google Scholar]
- Pan, S.A.; Li, X.H.; Feng, Q.H.; Liu, X.L.; Sun, J.X. Response of Abies faxoniana to future climate change and its potential distribution patterns in Sichuan Province. Acta Ecol. Sin. 2022, 42, 4055–4064. [Google Scholar]
- Gaston, K.J. Global patterns in biodiversity. Nature 2000, 405, 220–227. [Google Scholar] [CrossRef] [PubMed]
- MacDougall, A.S.; McCann, K.S.; Gellner, G.; Turkington, R. Diversity loss with persistent human disturbance increases vulnerability to ecosystem collapse. Nature 2013, 494, 86–89. [Google Scholar] [CrossRef] [PubMed]
- Liao, Z.; Chen, Y.; Pan, K.; Dakhil, M.A.; Lin, K.; Tian, X.; Zhang, F.; Wu, X.; Pandey, B.; Wang, B.; et al. Current climate overrides past climate change in explaining multi-site beta diversity of Lauraceae species in China. For. Ecosyst. 2022, 9, 100018. [Google Scholar] [CrossRef]
- Klein, J.A.; Harte, J.; Zhao, X.-Q. Experimental warming causes large and rapid species loss, dampened by simulated grazing, on the Tibetan Plateau. Ecol. Lett. 2004, 7, 1170–1179. [Google Scholar] [CrossRef]
- Fonty, E.; Sarthou, C.; Larpin, D.; Ponge, J. A 10-year decrease in plant species richness on a neotropical inselberg: Detrimental effects of global warming? Glob. Chang. Biol. 2009, 15, 2360–2374. [Google Scholar] [CrossRef]
- Yang, H.; Wu, M.; Liu, W.; Zhang, Z.; Zhang, N.; Wan, S. Community structure and composition in response to climate change in a temperate steppe. Glob. Chang. Biol. 2010, 17, 452–465. [Google Scholar] [CrossRef]
- Yang, Y.; Wang, G.; Klanderud, K. Plant community responses to five years of simulated climate warming in an high altitude fen of the Qinghai-Tibetan Plateau. Plant Ecol. Divers. 2015, 8, 211–218. [Google Scholar] [CrossRef]
- Wangchuk, K.; Darabant, A.; Nirola, H.; Wangdi, J.; Gratzer, G. Climate Warming Decreases Plant Diversity but Increases Community Biomass in High-Altitude Grasslands. Rangel. Ecol. Manag. 2021, 75, 51–57. [Google Scholar] [CrossRef]
- Kazakis, G.; Ghosn, D.; Vogiatzakis, I.N.; Papanastasis, V.P. Vascular plant diversity and climate change in the alpine zone of the Lefka Ori, Crete. Biodivers. Conserv. 2006, 16, 1603–1615. [Google Scholar] [CrossRef]
- Pickering, C.; Hill, W.; Green, K. Vascular plant diversity and climate change in the alpine zone of the Snowy Mountains, Australia. Biodivers. Conserv. 2008, 17, 1627–1644. [Google Scholar] [CrossRef]
- Klanderud, K.; Birks, H.J.B. Recent increases in species richness and shifts in altitudinal distributions of Norwegian mountain plants. Holocene 2003, 13, 1–6. [Google Scholar] [CrossRef]
- Rafferty, N.E.; Ives, A.R. Effects of experimental shifts in flowering phenologyvon plant pollinator interactions. Ecol. Lett. 2011, 14, 69–74. [Google Scholar] [CrossRef] [PubMed]
- Wehn, S.; Taugourdeau, S.; Johansen, L.; Hovstad, K.A. Effects of abandonment on plant diversity in semi-natural grasslands along soil and climate gradients. J. Veg. Sci. 2017, 28, 838–847. [Google Scholar] [CrossRef]
- Bellard, C.; Bertelsmeier, C.; Leadley, P.; Thuiller, W.; Courchamp, F. Impacts of climate change on the future of biodiversity. Ecol. Lett. 2012, 15, 365–377. [Google Scholar] [CrossRef] [PubMed]
- Qingchen, C.; Rouke, L.; Tong, C. Scientific progress and future prospects in climate change: An interpretation of Part 1 of China’s Fourth National Assessment Report on Climate Change. China Popul. Resour. Environ. 2023, 33, 74–79. [Google Scholar]
- He, Y.L.; Zhang, Y.P.; Yang, X.B. Climate change in tropical area of southwestern china since 1950s. Sci. Geogr. Sin. 2007, 27, 499–505. [Google Scholar]
- Peng, C.; Zhou, X.; Zhao, S.; Wang, X.; Zhu, B.; Piao, S.; Fang, J. Quantifying the response of forest carbon balance to future climate change in Northeastern China: Model validation and prediction. Glob. Planet. Chang. 2009, 66, 179–194. [Google Scholar] [CrossRef]
- Ren, G.; Ding, Y.; Zhao, Z.; Zheng, J.; Wu, T.; Tang, G.; Xu, Y. Recent progress in studies of climate change in China. Adv. Atmospheric Sci. 2012, 29, 958–977. [Google Scholar] [CrossRef]
- Wang, R.S.; Zhang, B.S.; Liu, H.P.; Li, G.S.; Li, X.A.; Zhang, H.L.; Zhang, Q.G. Diversity of tree species for broadleaf secondary forests in Yichun. For. Sicence Technol. 2010, 35, 14–17. [Google Scholar]
- Deng, L.P.; Bai, X.J.; Qin, S.J.; Wei, Y.W.; Bin Zhou, Y.; Li, L.L.; Niu, S.S.; Na Han, M. Spatial distribution and scale effect of species diversity of secondary forests in montane region of eastern Liaoning Province, China. J. Appl. Ecol. 2016, 27, 2197–2204. [Google Scholar]
- Wang, J.; Xu, S.; Yan, T.; Ma, W.J.; Yan, Q.L. Effects of soil nutrients on seeding growth of major tree species in montane region of eastern Liaoning Proince, China. Chin. J. Ecol. 2017, 36, 3148–3159. [Google Scholar]
- Zong, G.; Bai, X.J.; Zhang, S.Y.; Cai, J.Q. Spatial pattern and interspecific spatial association of tree seedlings in a secondary forest in montane region of eastern Liaoning Province, China. J. Appl. Ecol. 2018, 29, 18–24. [Google Scholar]
- Liu, X.L.; Li, X.H.; Liu, S.; Li, W.; Cai, L.; Zhang, L.; Pan, H.; Feng, Q.; Xu, Z.; Li, H.; et al. Effects of human disturbance on natural secondary forests in China: I. Tree growth, regeneration and community structure. J. Sichuan For. Sci. Technol. 2022, 43, 1–12. [Google Scholar]
- Liu, F.; Tan, C.; Yang, Z.; Li, J.; Xiao, H.; Tong, Y. Regeneration and growth of tree seedlings and saplings in created gaps of different sizes in a subtropical secondary forest in southern China. For. Ecol. Manag. 2022, 511, 120143. [Google Scholar] [CrossRef]
- Liu, H.M.; Xing, Z.K.; Gu, Y.S.; Gao, Y.X.; Han, Y.Z. Spatial structure of natural secondary broad-leaved mixed forest in eastern mountainous area of Liaoning Province. J. Northwest For. Univ. 2012, 27, 150–154. [Google Scholar]
- Ye, N.N.; Shen, N.P.; Shang, T.Q.; Gao, H.; Guan, J.; Yi, L. Vegetation structure and internal relationship between distribution patterns of vegetation and environment in ecological service forest o Rui’an city in Zhejiang Province. Chin. Bull. Bot. 2017, 52, 496–510. [Google Scholar]
- Zhang, H.D.; Wang, R.Z.; Mao, Y.X.; Yan, T.; Wei, W.; You, W. Characteristics and quantitative classification of natural secondary forests in the mountainous area of eastern Liaoning Province, China. Ecol. Environ. Sci. 2020, 29, 1953–1960. [Google Scholar]
- You, W.Z.; Zhao, G.; Zhang, H.D.; Guo, Y.T.; Yan, T.W.; Wei, W.J.; Mao, Y.X. Effects of thinning on growth of Mongolian oak (Quercus mongolica) secondary forests. Acta Ecol. Sin. 2015, 35, 56–64. [Google Scholar]
- Liu, Y.; Zhang, D.-P.; Ji, L.; Xu, L.-Y.; Dong, L.-B.; Yang, L.-X. Effects of selective cutting on the distribution pattern and inter-specific association of arbor seedlings in Tilia amurensis secondary forest. Chin. J. Appl. Ecol. 2020, 31, 3296–3304. [Google Scholar]
- Yan, B.; Sun, L.; Li, J.; Liang, C.; Wei, F.; Xue, S.; Wang, G. Change in composition and potential functional genes of soil bacterial and fungal communities with secondary succession in Quercus liaotungensis forests of the Loess Plateau, western China. Geoderma 2020, 364, 114199. [Google Scholar] [CrossRef]
- Zhang, X.; Zhao, W.; Liu, Y.; He, H.; Kou, Y.; Liu, Q. Dominant plant species and soil properties drive differential responses of fungal communities and functions in the soils and roots during secondary forest succession in the subalpine region. Rhizosphere 2022, 21, 100483. [Google Scholar] [CrossRef]
- Zhang, X.; Huang, J.; Chen, J.; Li, G.; He, H.; Huang, T.; Ding, J. Changes in diversity patterns and assembly processes of soil nematode communities during forest secondary succession on the Loess Plateau. For. Ecol. Manag. 2023, 529, 120734. [Google Scholar] [CrossRef]
- Wang, J.F.; Zheng, X.X. Species diversity and community succession of evergreen broad-leaved secondary forests in Sanming. J. Northwest For. Univ. 2015, 30, 39–45. [Google Scholar]
- Yan, W.M.; Sun, B.; Pei, N.; Wang, X.; Li, F.; Luo, X.; Zou, B. Correlation analyses on plant diversity and soil physical-chemical properties between evergreen broad-leaved plantations and natural secondary forests in North Guangdong, China. Ecol. Environ. Sci. 2019, 28, 898–907. [Google Scholar]
- Xiao, S.H.; Zhang, W.Q.; Huang, Y.H.; Cai, J.; Gao, C.J.; Sun, H.B.; Wang, Z.L. Species diversity and soil chemical properties of typical secondary forest in Tiegang-Shiyan natural reserve in Shenzhen. For. Environ. Sci. 2020, 36, 35–40. [Google Scholar]
- Yuan, Z.; Guan, Q.; Chen, X.; Zou, P.; Gu, Y.; Wu, Q.; Niu, Y.; Meshack, A.O. Tree diversity increases soil C and N stocks of secondary forests in subtropical China. CATENA 2023, 222, 106812. [Google Scholar] [CrossRef]
- Li, J.; Li, S.; Huang, X.; Tang, R.; Zhang, R.; Li, C.; Xu, C.; Su, J. Plant diversity and soil properties regulate the microbial community of monsoon evergreen broad-leaved forest under different intensities of woodland use. Sci. Total. Environ. 2022, 821, 153565. [Google Scholar] [CrossRef]
- Li, X.Y.; Pan, P.; Zang, H.; Ning, J.; Ouyang, X.; Li, X.; Gui, Y.; Wu, Z. Study on factors affecting natural regeneration of natural secondary Phoebe bournei forest. For. Res. 2017, 30, 701–708. [Google Scholar]
- Wang, P.; Gou, Z.H.; Nong, S.Q.; Huang, C.T.; Lin, L.; Yu, X.B. Species diversity and floristic components tropical secondary forests in hilly areas of central Hainan. Chin. J. Trop. Crops 2018, 39, 802–808. [Google Scholar]
- Nong, Y.; Lu, L.H.; You, J.H.; Lei, L.Q.; Wang, Y.N.; Li, H.; Yang, G.F. The plant diversity and biomass of trees in different successional stages of secondary forest of south subtropical. J. Cent. South Univ. For. Technol. 2018, 38, 83–88. [Google Scholar]
- Wu, Q.Z. Species diversity analysis of natural secondary forest of Castanopsis fargesii in Mingxi, Fujian. Subtrop. Agric. Res. 2019, 15, 217–222. [Google Scholar]
- Zhang, H.; Chen, S.; Zheng, X.; Ge, X.; Li, Y.; Fang, Y.; Cui, P.; Ding, H. Neighborhood diversity structure and neighborhood species richness effects differ across life stages in a subtropical natural secondary forest. For. Ecosyst. 2022, 9, 100075. [Google Scholar] [CrossRef]
- Ma, L.; Zhang, Z.; Shi, G.; Su, H.; Qin, R.; Chang, T.; Wei, J.; Zhou, C.; Hu, X.; Shao, X.; et al. Warming changed the relationship between species diversity and primary productivity of alpine meadow on the Tibetan Plateau. Ecol. Indic. 2022, 145, 109691. [Google Scholar] [CrossRef]
- Xu, Y.; Ding, Y.H.; Zhao, Z.C. Confidence analysis of NCEP/NCAR 50-year global reanalyzed data in climate change research in China. J. Appl. Meteor. Sci. 2001, 12, 337–347. [Google Scholar]
- Wang, L.; Chang, J.L.; Zhou, S.B.; Wang, X.Y.; Zhang, J.Q.; Yan, S.K.; Zhang, J.M.; Chen, X.; Zhao, X.; Wang, Z. Species diversity and interspecific association of trees in the Yaoluoping Nation Nature Reserve. Acta Ecol. Sin. 2019, 39, 309–319. [Google Scholar]
- Sinervo, B. Erratum: Erosion of lizard diversity by climate change and altered thermal niches (science (894)). Science 2010, 328, 1354. [Google Scholar] [CrossRef]
- Yang, Q.; Li, S.; Li, J.; Du, J.; Wang, J. Response of phenology phases of four deciduous trees to climate change in Xi’an. Acta Ecol. Sin. 2022, 42, 1462–1473. [Google Scholar] [CrossRef]
- Zhang, N.; Shugart, H.H.; Yan, X. Simulating the effects of climate changes on Eastern Eurasia forests. Clim. Chang. 2009, 95, 341–361. [Google Scholar] [CrossRef]
- Li, J. Vulnerability of Six Typical Deciduous Broad-Leaved Tree Species to Future Climate Change in China. Master’s Thesis, Northwest A & F University, Xianyang, China, 2020. [Google Scholar]
- Chen, Y.H.; Lu, Y.W.; Yin, X.J. Predicting habitat suitability of 12 coniferous forest tree species in southwest China based on climate change. J. Nanjing For. Univ. Nat. Sci. Ed. 2019, 43, 113–120. [Google Scholar]
- Wang, X.; Bao, Y. Divergent tree radial growth at alpine coniferous forest ecotone and corresponding responses to climate change in northwestern China. Ecol. Indic. 2020, 121, 107052. [Google Scholar] [CrossRef]
- Angela, M.V.; Juan, F.B.; Gabriel, J.C.; Francisco, E.F. The importance of old secondary forests for understory birds in the tropical Andes. Glob. Ecol. Conserv. 2023, 47, e02658. [Google Scholar]
- Carnevale, N.J.; Montagnini, F. Facilitating regeneration of secondary forests with the use of mixed and pure plantations of indigenous tree species. For. Ecol. Manag. 2002, 163, 217–227. [Google Scholar] [CrossRef]
- Kelty, M.J. The role of species mixtures in plantation forestry. For. Ecol. Manag. 2006, 233, 195–204. [Google Scholar] [CrossRef]
- Vaz, A.S.; Honrado, J.P.; Lomba, A. Replacement of pine by eucalypt plantations: Effects on the diversity and structure of tree assemblages under land abandonment and implications for landscape management. Landsc. Urban Plan. 2019, 185, 61–67. [Google Scholar] [CrossRef]
- Yu, Q.; Rao, X.; Chu, C.; Liu, S.; Lin, Y.; Sun, D.; Tan, X.; Hanif, A.; Shen, W. Species dominance rather than species asynchrony determines the temporal stability of productivity in four subtropical forests along 30 years of restoration. For. Ecol. Manag. 2019, 457, 117687. [Google Scholar] [CrossRef]
- Wang, Y.J.; Lu, H.F.; Lin, Y.B.; Zhou, L.; Cai, H.; Zhou, D. Plant community structure and health development dynamics of different restoration modes in Guangdong-Hong Kong-Macao Bay Area. Acta Ecol. Sin. 2021, 41, 3669–3688. [Google Scholar]
- Rajesh, M.; Prem, R.N.; Michael, K. Climate change impacts: Vegetation shift of broad-leaved and coniferous forests. Trees For. People 2023, 14, 100457. [Google Scholar]


| ID of Quadrat | Vegetation Information | Topography | |||||||
|---|---|---|---|---|---|---|---|---|---|
| Dominant Species | Number of Trees | Average DBH/cm | Average Height/m | Crown Density | Coverage/% | Elevation/m | Slope/° | Aspect | |
| 1 | L. gmelinii, B. platyphylla | 11 | 23.1 | 18.8 | 0.2 | 95 | 420 | 2 | — |
| 2 | L. gmelinii | 30 | 15.0 | 12.8 | 0.3 | 85 | 270 | 1 | — |
| 3 | B. platyphylla, Populus davidiana | 88 | 12.5 | 15.6 | 0.7 | 80 | 470 | 2 | — |
| 4 | B. platyphylla | 113 | 8.9 | 12.3 | 0.6 | 95 | 450 | 1 | — |
| 5 | A. sibirica | 103 | 7.1 | 6.2 | 0.7 | 95 | 240 | 3 | — |
| 6 | Q. mongolica | 70 | 16.6 | 8.0 | 0.7 | 85 | 400 | 38 | South |
| 7 | Picea koraiensis | 71 | 17.8 | 12.9 | 0.7 | 90 | 400 | 6 | Southeast |
| 8 | Picea koraiensis, A. ukurunduense, Pinus koraiensis | 60 | 12.7 | 15.3 | 0.5 | 90 | 630 | 6 | Northeast |
| 9 | B. platyphylla, L. gmelinii, P. jezoensis var. microsperma | 42 | 17.6 | 16.9 | 0.4 | 90 | 450 | 2 | — |
| 10 | Picea koraiensis, Pinus koraiensis, Ulmus davidiana var. Japonica | 75 | 15.1 | 14.9 | 0.7 | 85 | 350 | 7 | Southeast |
| 11 | Syringa reticulate, Betula costata, Ulmus macrocarpa | 89 | 10.6 | 18.3 | 0.7 | 90 | 460 | 2 | — |
| 12 | B. platyphylla, Populus davidiana, Fraxinus mandshurica | 56 | 13.2 | 16.5 | 0.5 | 95 | 494 | 5 | South |
| 13 | B. platyphylla, Populus davidiana, A. pictum | 126 | 13.9 | 17.5 | 0.8 | 85 | 473 | 4 | — |
| 14 | B. platyphylla, U. macrocarpa, A. sibirica | 74 | 11.3 | 15.4 | 0.5 | 65 | 340 | 2 | — |
| 15 | B. platyphylla, Populus davidiana | 146 | 10.5 | 12.7 | 0.6 | 80 | 549 | 2 | — |
| 16 | B. platyphylla, L. gmelinii, A. sibirica | 99 | 11.7 | 14.8 | 0.7 | 95 | 444 | 5 | Northwest |
| 17 | B. platyphylla, L. gmelinii, Picea koraiensis, A. sibirica | 64 | 16.8 | 13.9 | 0.6 | 95 | 352 | 2 | — |
| 18 | B. platyphylla, L. gmelinii, A. sibirica | 52 | 10.1 | 12.1 | 0.4 | 95 | 480 | 1 | — |
| 19 | B. costata, A. nephrolepis | 73 | 17.8 | 16.7 | 0.7 | 95 | 534 | 4 | — |
| 20 | B. platyphylla | 37 | 16.3 | 14.8 | 0.5 | 85 | 430 | 3 | — |
| 21 | B. platyphylla, L. gmelinii, B. dahurica, T. amurensis | 54 | 13.3 | 14.2 | 0.5 | 95 | 373 | 3 | — |
| 22 | B. platyphylla, A. nephrolepis | 148 | 12.6 | 14.4 | 0.7 | 90 | 520 | 5 | Northwest |
| 23 | B. platyphylla, B. costata, A. nephrolepis | 79 | 17.3 | 15.7 | 0.7 | 80 | 442 | 14 | North |
| 24 | B. platyphylla, P. jezoensis var. microsperma, B. costata, A. nephrolepis | 122 | 10.5 | 13.9 | 0.8 | 95 | 540 | 6 | Northwest |
| 25 | A. ukurunduense, B. costata, A. nephrolepis, Acer tegmentosum | 48 | 19.8 | 16.3 | 0.7 | 90 | 458 | 15 | East |
| 26 | Picea koraiensis, A. ukurunduense, B. costata, A. nephrolepis | 74 | 12.6 | 13.9 | 0.6 | 90 | 666 | 5 | Northwest |
| 27 | Pinus koraiensis, B. costata, A. nephrolepis | 66 | 14.2 | 12.6 | 0.7 | 95 | 365 | 4 | — |
| 28 | B. platyphylla, L. gmelinii, T. amurensis | 65 | 13.6 | 14.4 | 0.7 | 95 | 318 | 4 | — |
| 29 | B. costata, A. pictum, A. nephrolepis, A. tegmentosum, U. laciniata | 67 | 13.4 | 17.5 | 0.6 | 95 | 517 | 10 | Northeast |
| Tree Species | 2015 | 2021 | ||||||
|---|---|---|---|---|---|---|---|---|
| rh | ra | rc | IV | rh | ra | rc | IV | |
| Betula platyphylla | 29.2 | 21.1 | 12.2 | 20.8 | 26.0 | 20.5 | 11.2 | 19.2 |
| Larix gmelinii | 7.5 | 14.1 | 7.1 | 9.6 | 6.2 | 13.9 | 7.0 | 9.0 |
| Abies nephrolepis | 9.5 | 13.2 | 5.6 | 9.4 | 8.8 | 12.6 | 5.1 | 8.8 |
| Betula costata | 5.5 | 9.5 | 5.6 | 6.9 | 4.7 | 8.6 | 5.6 | 6.3 |
| Picea koraiensis | 6.8 | 6.8 | 5.1 | 6.2 | 6.3 | 7.0 | 5.6 | 6.3 |
| Populus davidiana | 7.3 | 6.8 | 2.5 | 5.5 | 6.0 | 6.7 | 2.8 | 5.2 |
| Pinus koraiensis | 2.7 | 5.1 | 5.1 | 4.3 | 2.7 | 5.0 | 4.7 | 4.1 |
| Tilia amurensis | 2.5 | 3.6 | 6.6 | 4.2 | 2.7 | 3.6 | 6.1 | 4.1 |
| Quercus mongolica | 4.6 | 5.7 | 2.0 | 4.1 | 4.1 | 4.9 | 2.3 | 3.8 |
| Alnus sibirica | 4.5 | 2.0 | 5.1 | 3.9 | 4.0 | 2.1 | 4.7 | 3.6 |
| Acer pictum | 2.8 | 2.5 | 5.6 | 3.6 | 2.6 | 2.3 | 5.6 | 3.5 |
| Acer ukurunduense | 3.4 | 0.9 | 5.6 | 3.3 | 4.8 | 1.2 | 5.6 | 3.9 |
| Picea jezoensis var. microsperma | 2.0 | 1.9 | 5.6 | 3.2 | 1.9 | 2.1 | 5.1 | 3.0 |
| Acer tegmentosum | 1.9 | 1.0 | 4.1 | 2.3 | 2.5 | 1.2 | 3.7 | 2.5 |
| Betula dahurica | 1.5 | 1.3 | 3.6 | 2.1 | 1.3 | 1.3 | 3.3 | 2.0 |
| Syringa reticulata | 2.1 | 0.5 | 2.0 | 1.5 | 2.7 | 0.8 | 1.9 | 1.8 |
| Ulmus laciniata | 0.6 | 1.3 | 2.5 | 1.5 | 0.6 | 1.1 | 2.3 | 1.3 |
| Prunus davidiana | 0.9 | 0.5 | 2.5 | 1.3 | 0.9 | 0.8 | 2.3 | 1.3 |
| Salix taraikensis | 0.6 | 0.2 | 2.5 | 1.1 | 5.2 | 1.1 | 2.8 | 3.1 |
| Fraxinus mandshurica | 0.9 | 0.6 | 1.5 | 1.0 | 1.1 | 0.8 | 1.4 | 1.1 |
| Ulmus macrocarpa | 1.2 | 0.7 | 1.0 | 1.0 | 1.8 | 1.1 | 0.9 | 1.3 |
| Salix raddeana | 0.5 | 0.3 | 1.0 | 0.6 | 0.4 | 0.3 | 0.9 | 0.5 |
| Padus racemosa | 0.2 | 0.03 | 1.5 | 0.6 | 0.2 | 0.03 | 1.4 | 0.5 |
| Ulmus davidiana var. japonica | 0.8 | 0.3 | 0.5 | 0.5 | 0.9 | 0.5 | 0.9 | 0.8 |
| Phellodendron amurense | 0.2 | 0.1 | 1.0 | 0.4 | 0.2 | 0.1 | 1.4 | 0.6 |
| Sorbus pohuashanensis | 0.2 | 0.1 | 1.0 | 0.4 | 0.2 | 0.1 | 0.9 | 0.4 |
| Ulmus pumila | 0.1 | 0.02 | 0.5 | 0.2 | 0.1 | 0.04 | 0.5 | 0.2 |
| Rhamnus davurica | 0.1 | 0.01 | 0.5 | 0.2 | 0.1 | 0.02 | 0.5 | 0.2 |
| Aralia elata | 0.1 | 0.01 | 0.5 | 0.2 | 0.1 | 0.02 | 0.9 | 0.4 |
| Alnus japonica | — | — | — | — | 0.9 | 0.2 | 0.5 | 0.5 |
| Acer tataricum | — | — | — | — | 0.1 | 0.01 | 0.5 | 0.2 |
| Salix matsudana | — | — | — | — | 0.1 | 0.01 | 0.5 | 0.2 |
| Sorbus alnifolia | — | — | — | — | 0.1 | 0.01 | 0.5 | 0.2 |
| Malus baccata | — | — | — | — | 0.1 | 0.01 | 0.5 | 0.2 |
| ID of Quadrat | 2015 | 2021 | Changes |
|---|---|---|---|
| 1 | L. gmelinii + B. platyphylla (63.6% + 27.3%) | L. gmelinii + B. platyphylla (63.6% + 27.3%) | No |
| 2 | L. gmelinii (81.3%) | B. platyphylla + L. gmelinii (59.3% + 40.7%) | Yes |
| 3 | B. platyphylla + Populus davidiana (62.0% + 30.4%) | B. platyphylla + Populus davidiana (61.7% + 29.6%) | No |
| 4 | B. platyphylla (82.2%) | B. platyphylla (81.4%) | No |
| 5 | A. sibirica (77.8%) | S. taraikensis (89.3%) | Yes |
| 6 | Q. mongolica (100.0%) | Q. mongolica (100.0%) | No |
| 7 | Picea koraiensis (72.4%) | Picea koraiensis (72.4%) | No |
| 8 | Picea koraiensis + A. ukurunduense + Pinus koraiensis (47.8% + 15.2% + 13.0%) | Picea koraiensis + A. ukurunduense + A. tegmentosum + Pinus koraiensis (38.3% + 28.3% + 11.7% + 10.0%) | Yes |
| 9 | L. gmelinii + B. platyphylla + P. jezoensis var. microsperma (43.2% + 37.8% + 10.8%) | L. gmelinii + B. platyphylla + P. jezoensis var. microsperma (40.0% + 37.5% + 12.5%) | No |
| 10 | Picea koraiensis + U. davidiana var. Japonica + Pinus koraiensis (20.6% + 20.6% + 17.5%) | U. davidiana var. Japonica + Picea koraiensis + Pinus koraiensis (23.5% + 19.1% + 16.2%) | Yes |
| 11 | S. reticulate + B. costata + U. macrocarpa (43.9% + 15.2% + 10.6%) | S. reticulate + B. costata (54.7% + 11.6%) | Yes |
| 12 | B. platyphylla + F. mandshurica + Populus davidiana (27.5% + 25.0% + 17.5%) | F. mandshurica + B. platyphylla + Populus davidiana (29.6% + 20.4% + 13.0%) | Yes |
| 13 | Populus davidiana + B. platyphylla + A. pictum (50.5% + 20.4% + 15.5%) | Populus davidiana + B. platyphylla + A. pictum (48.6% + 19.6% + 15.0%) | No |
| 14 | B. platyphylla + U. macrocarpa + A. sibirica (50.0% + 28.6% + 19.0%) | U. macrocarpa + B. platyphylla + A. sibirica (44.4% + 33.3% + 19.0%) | Yes |
| 15 | B. platyphylla + Populus davidiana (62.5% + 25.0%) | B. platyphylla + Populus davidiana (59.1% + 23.6%) | No |
| 16 | B. platyphylla + L. gmelinii + A. sibirica (46.7% + 28.0% + 25.3%) | B. platyphylla + L. gmelinii + A. sibirica (46.4% + 26.2% + 22.6%) | No |
| 17 | Picea koraiensis + L. gmelinii + A. sibirica + B. platyphylla (45.7% + 23.9% + 19.6% + 10.9%) | Picea koraiensis + L. gmelinii + A. sibirica + B. platyphylla (45.7% + 23.9% + 19.6% + 10.9%) | No |
| 18 | L. gmelinii + B. platyphylla + A. sibirica (46.2% + 26.9% + 26.9%) | A. japonica + B. platyphylla + L. gmelinii+ A. sibirica (35.3% + 27.5% + 23.5% + 13.7%) | Yes |
| 19 | A. nephrolepis + B. costata (56.3% + 15.6%) | A. nephrolepis + B. costata (56.3% + 15.6%) | No |
| 20 | B. platyphylla (77.1%) | B. platyphylla (77.1%) | No |
| 21 | B. platyphylla + L. gmelinii + B. dahurica + T. amurensis (31.4% + 28.6% + 14.3% + 14.3%) | T. amurensis + B. platyphylla + L. gmelinii + B. dahurica (23.1% + 21.2% + 21.2% + 11.5%) | Yes |
| 22 | B. platyphylla + A. nephrolepis (38.3% + 25.0%) | B. platyphylla + A. nephrolepis (37.4% + 24.4%) | No |
| 23 | B. costata + A. nephrolepis + B. platyphylla (30.3% + 27.3% + 22.7%) | B. costata + A. nephrolepis + B. platyphylla (29.4% + 26.5% + 22.1%) | No |
| 24 | B. platyphylla + A. nephrolepis + P. jezoensis var. microsperma + B. costata (27.3% + 20.5% + 15.9% + 10.2%) | B. platyphylla + A. nephrolepis + P. jezoensis var. microsperma (24.6% + 20.3% + 11.9%) | Yes |
| 25 | A. nephrolepis + B. costata + A. ukurunduense + A. tegmentosum (28.6% + 23.8% + 11.9% + 11.9%) | A. nephrolepis + B. costata + A. ukurunduense + A. tegmentosum (27.3% + 22.7% + 13.6% + 11.4%) | No |
| 26 | A. ukurunduense + B. costata + A. nephrolepis + Picea koraiensis (39.1% + 26.1% + 17.4% + 13.0%) | A. ukurunduense + B. costata + A. nephrolepis (53.8% + 18.5% + 15.4%) | Yes |
| 27 | A. nephrolepis + B. costata + P. koraiensis Sieb. et Zucc. (30.4% + 10.0% + 8.9%) | A. nephrolepis + Pinus koraiensis + B. costata (27.4% + 12.9% + 9.7%) | Yes |
| 28 | B. platyphylla + L. gmelinii + T. amurensis (48.8% + 23.3% + 11.6%) | B. platyphylla + Picea koraiensis + L. gmelinii + T. amurensis (36.8% + 21.1% + 17.5% + 10.5%) | Yes |
| 29 | B. costata + A. tegmentosum + A. nephrolepis + U. laciniata + A. pictum (25.6% + 16.3% + 11.6% + 11.6% + 11.6%) | A. nephrolepis + B. costata + A. tegmentosum + A. pictum (25.8% + 16.7% + 16.7% + 12.1%) | Yes |
Disclaimer/Publisher’s Note: The statements, opinions and data contained in all publications are solely those of the individual author(s) and contributor(s) and not of MDPI and/or the editor(s). MDPI and/or the editor(s) disclaim responsibility for any injury to people or property resulting from any ideas, methods, instructions or products referred to in the content. |
© 2024 by the authors. Licensee MDPI, Basel, Switzerland. This article is an open access article distributed under the terms and conditions of the Creative Commons Attribution (CC BY) license (https://creativecommons.org/licenses/by/4.0/).
Share and Cite
Liu, B.; Liao, C.; Chang, Y. Changing Dynamic of Tree Species Composition and Diversity: A Case Study of Secondary Forests in Northern China in Response to Climate Change. Forests 2024, 15, 322. https://doi.org/10.3390/f15020322
Liu B, Liao C, Chang Y. Changing Dynamic of Tree Species Composition and Diversity: A Case Study of Secondary Forests in Northern China in Response to Climate Change. Forests. 2024; 15(2):322. https://doi.org/10.3390/f15020322
Chicago/Turabian StyleLiu, Beichen, Chengrui Liao, and Youhong Chang. 2024. "Changing Dynamic of Tree Species Composition and Diversity: A Case Study of Secondary Forests in Northern China in Response to Climate Change" Forests 15, no. 2: 322. https://doi.org/10.3390/f15020322
APA StyleLiu, B., Liao, C., & Chang, Y. (2024). Changing Dynamic of Tree Species Composition and Diversity: A Case Study of Secondary Forests in Northern China in Response to Climate Change. Forests, 15(2), 322. https://doi.org/10.3390/f15020322