1. Introduction
Timely and up-to-date information about economic measures resulting from natural resource-based industries including forestry is crucial for emphasizing the importance of such industries to regional economies, for understanding intra-industry linkages, and for justifying supporting policies and funding needs. Therefore, proponents of natural resource industries have long used economic contribution and impact analyses as tools for highlighting the economic importance of such industries to regional economies [
1,
2,
3,
4,
5]. Economic contribution and impact analyses are theoretically based on the input–output (I-O) modeling approach developed by Wassily Leontief in the late 1930s. I-O analysis is a macroeconomic modeling approach that relies on the interdependence of industries in an economy. The I-O model is used for estimating the impacts of an initial shock on the economic system and analyzing the ripple effects of such shocks throughout the economy [
6].
Economic contribution analysis is derived from the economic base theory and is an ex-post analysis based on the existing economy as described by the social accounting matrix (SAM) [
7]. The SAM is a comprehensive economy-wide database that describes the structure of an economy in terms of the links or transactions between production, income distribution, and demand for a specified period [
8,
9]. Economic base theory describes contributions in terms of gross—an industry selling its output to local industries and households keeping money in a region—and base—an industry’s supply-chain expenditures bringing money into the region [
7]. In other words, economic contribution analysis estimates the relative importance of an existing industry to the regional economy and addresses “what is” questions. On the other hand, economic impact analysis addresses the “what if” questions by estimating the net changes in new economic activity attributed to an industry, event, or policy in an existing regional economy [
10]. That is, impact analysis estimates the net changes to the economic base of a region given an exogenous shock such as the entry of a new industry. Both economic impact and contribution analyses can depict the economic effects at three levels: direct, indirect, and induced. Direct effects measure production changes or expenditures made by producers/consumers because of an activity or a policy being considered. Indirect effects are those associated with inter-industry transactions in the supply chain. Induced effects include the effects stemming from household spending of labor income via goods and services purchased due to the direct and indirect spending by industries in the study region [
2,
3,
11,
12,
13,
14,
15]. Economic effects can be presented using various economic measures such as industry output (or total sales), employment generated, value added, labor income, taxes paid, and so on.
Some of the commonly used standard commercial input–output models for estimating the economic effects of natural resource industries include Impact Analysis for Planning (IMPLAN), the Regional Input–Output Modeling System (RIMS II), and Regional Economic Models Inc. (REMI). These economic modeling systems have their own merits and limitations [
12]. RIMS II is a static model developed by the United States Bureau of Economic Analysis in the 1970s in which the underlying production functions cannot be adjusted and new industries cannot be added. Thus, RIMS II has limited use when it comes to custom analysis despite having a cost advantage over REMI and IMPLAN [
12]. REMI is a dynamic model that allows price fluctuations and incorporates I-O models, continuous general equilibrium models, econometrics, and economic geography. REMI accounts for constrained resources better than IMPLAN or RIMS II. However, the model is complicated and could be less affordable, and many sectors are aggregated [
12]. Out of the three I-O modeling systems, IMPLAN is the most often used and is a static general equilibrium model, originating in the United States Forest Service (USFS) in the 1980s to analyze the economic impact of land management planning, to estimate and trace the spending through the United States economy [
16]. As demand for regional models grew outside of the USFS, IMPLAN was established as an independent private corporation for developing and advancing IMPLAN databases and software.
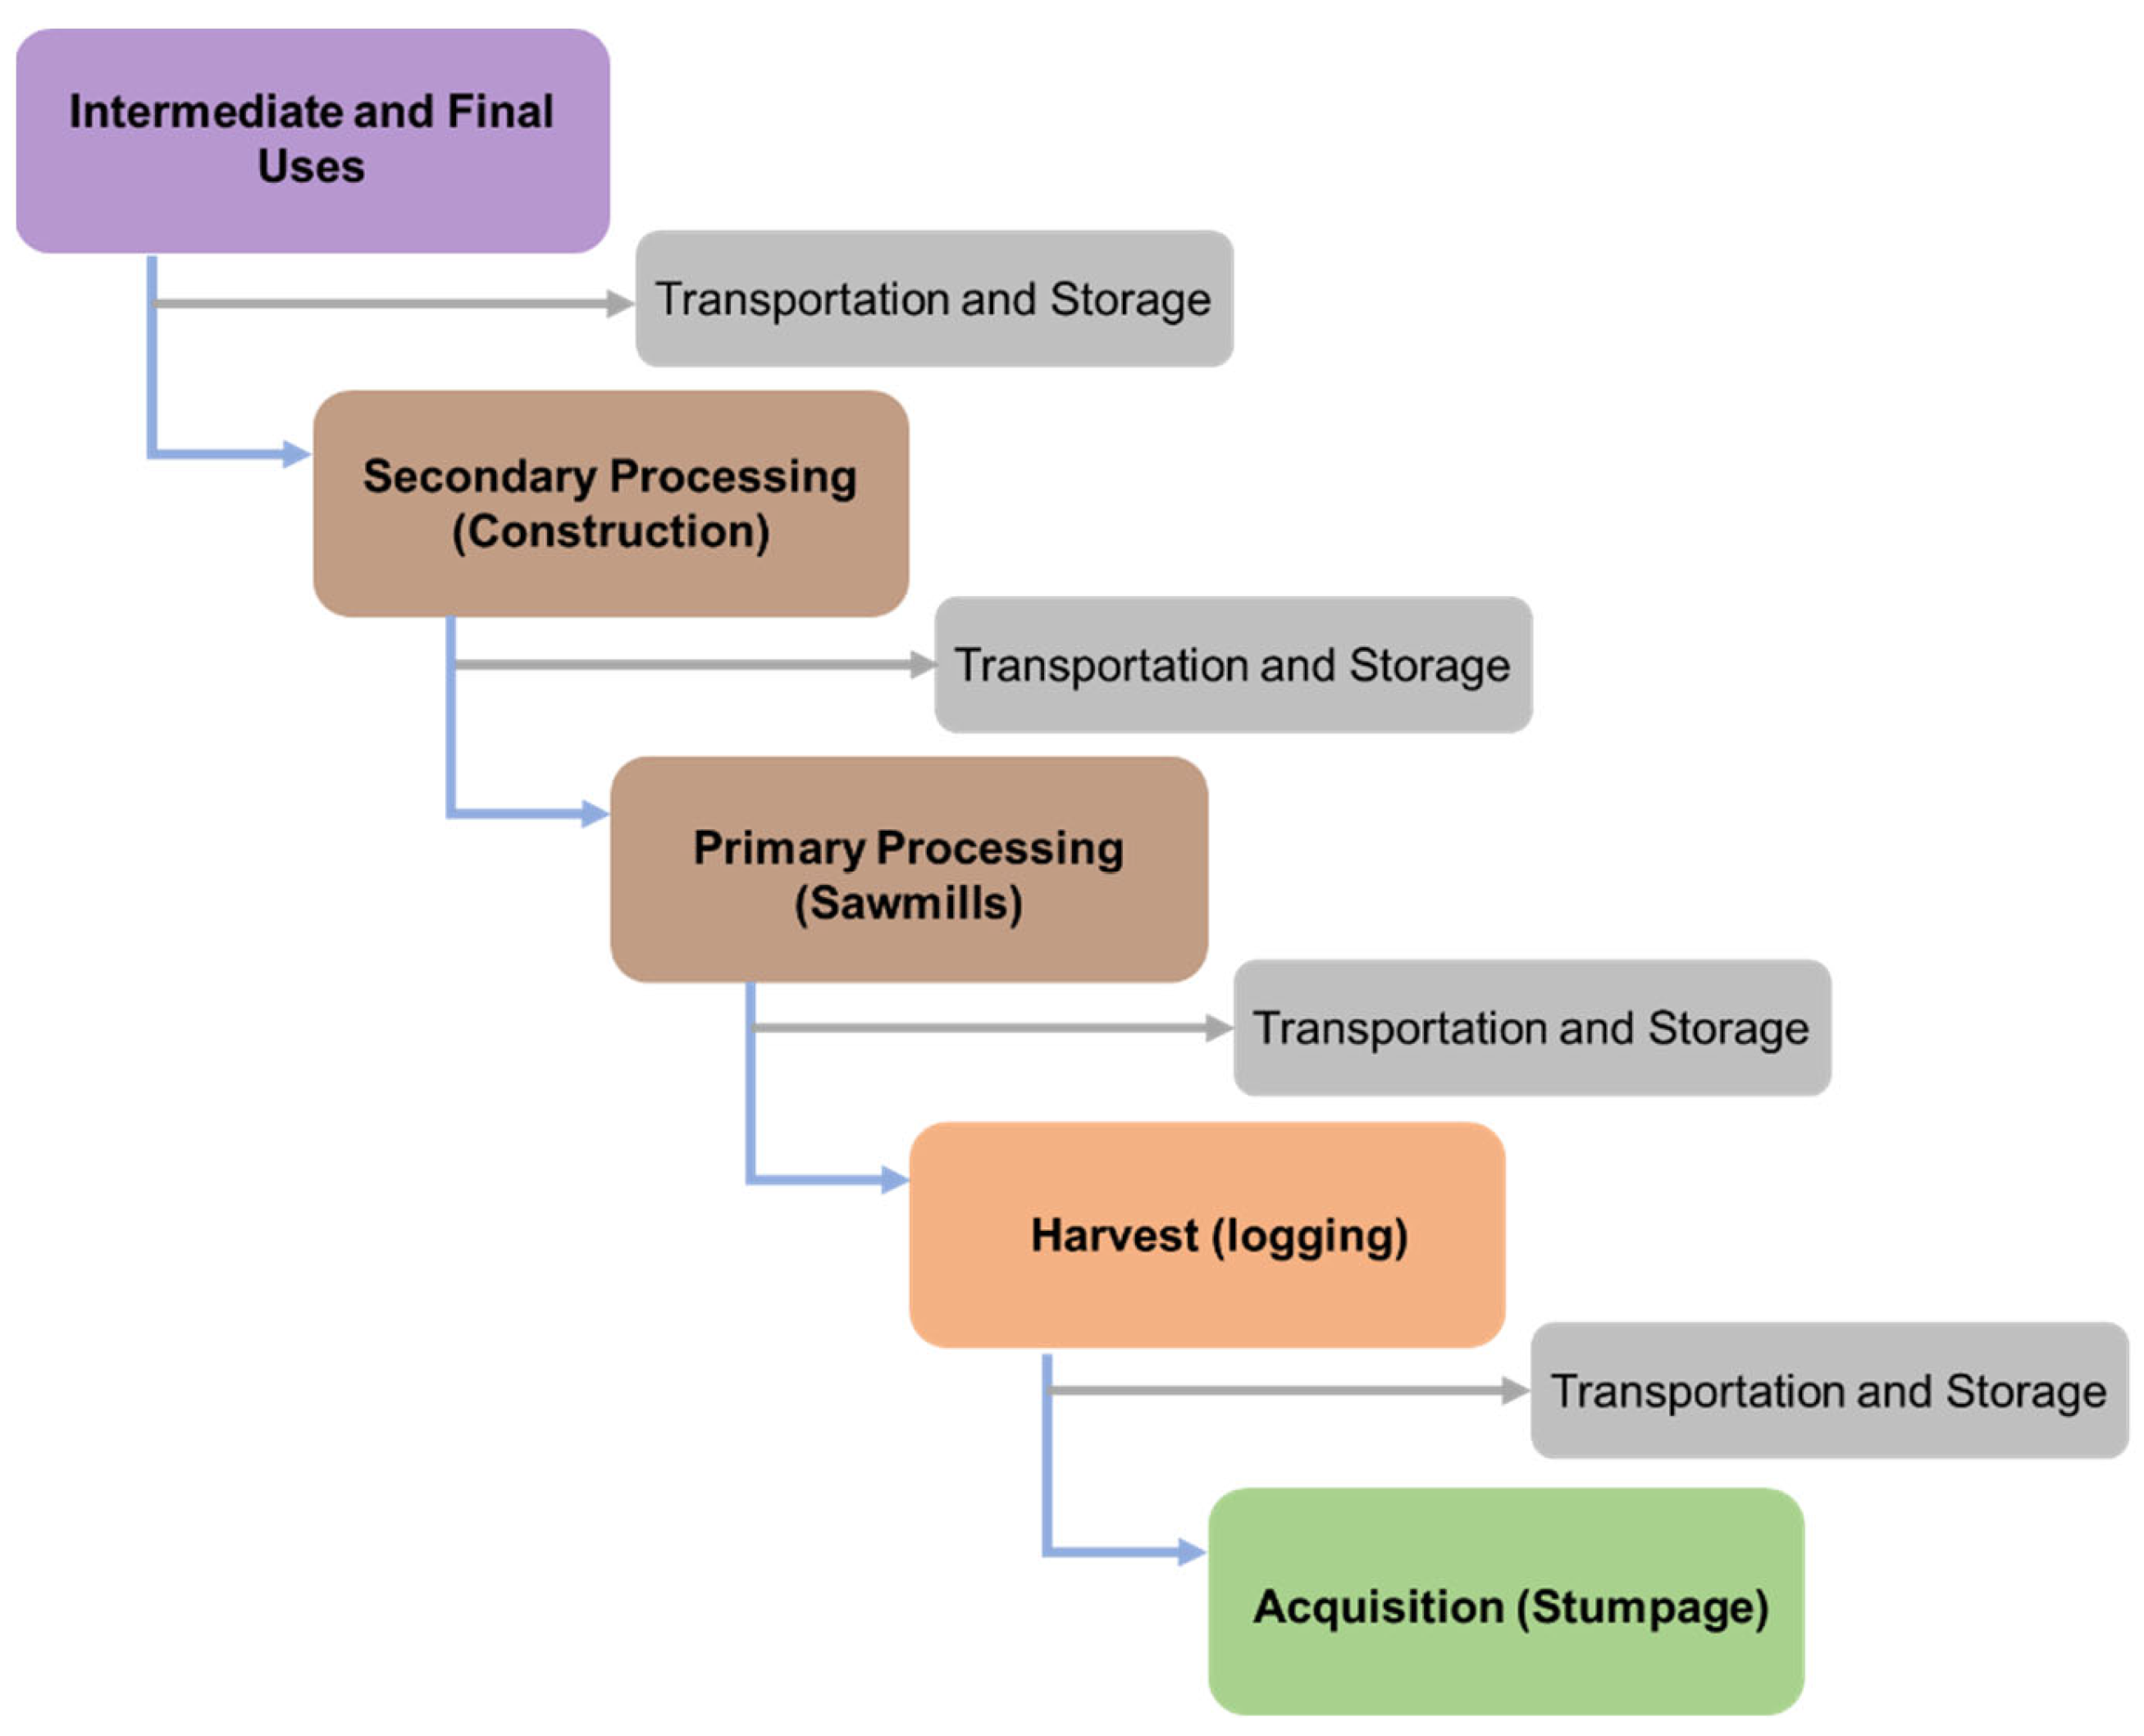
Irrespective of the I-O modeling software, past economic contributions and impact analyses of natural resource industries report the economic contributions or impacts of an industry at the final industry level, producing the final output and making little effort to break down the economic effects along the value chain. Pertaining to forest products industry contribution and ecological analyses, several studies have examined the economic contributions and impacts based on the industry type at the individual or aggregated level, spatial coverage, and even comparative studies before and after cyclical and long-term trends [
1,
2,
3,
4,
13,
14,
15]. Aggregating different final and value-chain forest product industries might result in bias and distort the exact contribution of both the value chain and final forest product industry in the economy. These studies report direct, indirect, and induced economic effects associated with a particular industry of interest and do not parse out the value-chain activities involved in producing and supplying products needed to meet the input requirements of the final industry. For instance, in the case of an industry using wood resources as its input for production, there are activities associated with acquiring the timber resources (which involve growing stumpage and harvesting it) and processing it in primary and secondary industrial facilities. Between each of these activities, there are transportation and storage involved (
Figure 1).
Parsing out the contribution of activities in the value chain is an area of active research in input–output economics called “structural path analysis”. Defourny and Thorbecke [
17] in 1984 and Xu and Liang [
18], as recently as 2019, shed light on generalized methods to identify structural paths and decomposing multipliers to fully understand the structure of the economy. Lack of knowledge of the economic effects along the value chain when estimating economic contribution takes focus away from the value-chain actors that are instrumental in the production and delivery of the final product. Thus, the value-chain sectors are deprived of receiving appropriate attention in terms of favorable policies or supportive measures. Examining the contribution of value-chain components is crucial to a better understanding of the economic importance of each value-chain industry to the final economic output [
19]. The decomposition of economic contributions from value-chain industries in forestry can help policymakers identify and prioritize opportunities for growth in the forestry sector and attribute contributions or impacts where they occur but not at the final industry or facility. This is particularly crucial because wood products are harvested from rural counties or areas and transported to counties or cities that are generally economically better off, with processing facilities. Despite the impacts being reported at the processing locations, the actual activities do not take place there. This leads to a misreporting of the economic contributions from these rural areas to the location where the facility is situated. Parsing out the contribution of activities in value-chain industries could overcome this barrier in I-O analysis. Several studies on forest product industries [
20,
21,
22] reported challenges faced by value-chain actors such as the commercial logging and trucking industries to remain in business and operate profitably despite being indispensable for the smooth functioning of all primary and secondary forest product industries. Baker et al. [
21] concluded a shrinking gap between the prices paid for logging services and logging costs in recent times, suggesting reduced profit margins for logging businesses in the South of the United States [
23]. Declining profit levels have also been reported by logging businesses in other parts of the country, affecting the economic viability of value-chain industries and the overall forest product industry [
23,
24,
25]. Additionally, the shortage of truck drivers to transport harvested logs from forests to mills threatens the smooth functioning of forest product industries throughout the country [
26]. Given this, highlighting the significance of value-chain industries such as logging and trucking can help emphasize the role of these industries in regional economies and secure much-needed attention to these industries.
Our study establishes a value chain for industries that use wood as an input to produce the final output and highlights the economic contributions of value-chain industries and activities associated with the resource. The aim of the study is to develop a methodology that decomposes or parses out the economic contribution of value-chain activities from the total economic contribution of the wood-using industry. To illustrate this, we present the case studies of four industries that rely on wood as an input—biomass power generation, sawmills, paper mills, and the construction of new single-family residential structures in the Lake States region (Michigan, Minnesota, and Wisconsin) in the United States. This study builds on the theoretical model used for estimating the economic contribution analysis and employs matrix decomposition by exporting the SAM industry by industry (I X I’) multipliers and Type I output multipliers from IMPLAN (2017) into Microsoft Excel for estimating economic contributions along the value chain.
2. Materials and Methods
2.1. Theoretical Model for Economic Contribution Analysis
Input–Output accounts are related to National Income and Product Accounts (NIPA), both of which are part of an overall System of National Accounts. A fundamental NIPA accounting identity for national income (i.e., Gross Domestic Income (GDI) = Gross Domestic Product (GDP)) is:
where
is national income (i.e., GDI), measured from the “income side” as returns to labor and capital factors of production (i.e., value-added in I-O terms).
is personal consumption expenditure,
is investment,
is government consumption,
is exports, and
is imports, so
describes net exports. The right-hand side of Equation (1),
, represents the national product (i.e., GDP), measured from the “product side” as the sum of all goods and services consumed net of imports (i.e., final demand in I-O terms).
Equation (1) can be rearranged as follows:
where
is value-added plus imports (in I-O terms) equals
or total final demand (in I-O terms). It is important to note that in the standard I-O accounting schema, value-added plus imports equal total final demand only in aggregate, not on a sector-by-sector basis. This is because value-added and imports are recorded in the I-O accounts on an industry basis while final demands are recorded on a product basis. Since the inputs of many intermediate industries are required to produce a single product, the standard I-O accounting schema falls short.
This shortcoming is rectified by assuming the array of inputs required by each industry to produce its product is proportional to the industry’s total outlay. This matrix is commonly referred to as the Direct Requirements matrix
in I-O terms. Using this matrix, the I-O accounting identity for total output x is the sum of intermediate demand
Ax plus final demand as shown in Equation (3):
where,
is a vector of gross industry outputs,
is a vector of final demands,
is the matrix of direct coefficients (a
ij) which represents intermediate input supplied by industry
i per unit of gross output in industry
j, and
is a matrix of intermediate demand. Solving Equation (3) for
gives the descriptive form of the standard I-O model [
27] as in Equation (4).
where the matrix
=
is called the Leontief inverse or the total requirement matrix. The Leontief matrix is a transformation matrix that relates the multiple inputs from multiple industries that are required to produce a final demand product. Each column of the Leontief matrix can be interpreted as a complex derivative (i.e., a vector or tensor instead of a scalar) relating the multiple inputs required to produce a product. In formal terms, matrix
can be described as a matrix consisting of column tensors, with each tensor representing the rate at which multiple inputs are transformed into a final product.
Following Watson et al. [
7], Equation (4) can be modified via a “column-space expansion” of
and is described by Equation (5):
where
is a diagonal matrix of total final demands,
is a column-space expansion matrix of total industry output by the final product,
is the Leontief Inverse,
is the total industry output, and
is the total final product outlay.
Matrix can be interpreted in useful ways. Each column of contains the direct and indirect inputs required to produce the column’s product. While a column of the direct coefficient matrix describes “one-hop” (i.e., “direct”) input transactions, a column of the output matrix describes both “one-hop” and “multi-hop” (i.e., “indirect”) input transactions required to produce a product. For example, the direct coefficient for wood input (from the biomass power generation column of the A matrix) to biomass power generation describes a “one-hop” transaction of the biomass power facility directly buying logs and chips from loggers. In contrast, the column for the electricity product produced by biomass power generation contains two inputs related to wood: the “one-hop” direct transaction of biomass power generation buying logs from loggers and the “two-hop” indirect transaction of loggers buying stumpage from forest landowners. In other words, a column of the direct coefficient matrix describes only a single “tier” of an input’s value chain (e.g., wood purchased from loggers), whereas a column of the output matrix describes all inputs regardless of how many tiers (or “hops”) the input is removed from the product (e.g., stumpage sold to loggers to sell logs to biomass power generation). Each “hop” between industries represents a tier in an input’s value chain, and a complete resource–product value chain (like wood for biomass power generation) consists of the sequence of industries from growing stumpage, through harvesting, to delivery for fuel to generate electricity. Each tensor vector of represents the sum of indirect input transactions summed over all value-chain tiers. Value-chain decomposition is the process of separating the tiers in the resource–product for a particular resource input from the tensor vector totals.
Equation (5) describes the detailed production of products and can be considered the primal form of the I-O accounting system. The dual or “cost-side” form of the I-O system is presented in Equation (6):
In the above relationship, is a diagonal matrix of total value-added/output ratios, is a matrix of total value-added, and is the Leontief Inverse. The matrix has the same structure and interpretations as the matrix, except that it deals with inputs (labor and capital inputs collectively referred to as value-added in I-O terms) instead of outputs.
Equation (7) applies the same logic to import inputs:
where
is a diagonal matrix of total import/output ratios,
is a matrix of total imports, and
is the Leontief Inverse.
In addition, Equation (8) applies the same logic to employment inputs:
In the above equation, is a diagonal matrix of total employment/output ratios, is a matrix of total employment, and is the Leontief Inverse.
Returning to Equation (2), the scalar national income identity can be reconciled with the multi-sector I-O accounting system in Equation (9):
where
is a diagonal matrix of total final demand,
is a matrix of total imports, and
is a matrix of value-added. In Equation (9), total final demand is equal to value-added plus imports both in aggregate and on a sector-by-sector basis, which illustrates the direct relationship between multiple inputs with specific product outputs given by the Leontief transformation matrix
.
2.2. Matrix Decomposition for Estimating the Economic Contributions along the Value Chain
As noted above, each tensor column vector of the matrix contains all the information about both the direct and indirect inputs required to produce a particular product. Unfortunately, the tensor column vector contains the sums of all indirect inputs rather than enumerating the explicit tiers or “hops” between indirect input suppliers that correspond to specific resource–product value chains. A series of steps outlined below comprise a heuristic method for parsing or “decomposing” the value-chain tiers for any resource–product pair from within the column space of any tensor column vector of the and/or matrices.
2.3. Process Workflow for Decomposing the Economic Contributions of Forest Resource Industries
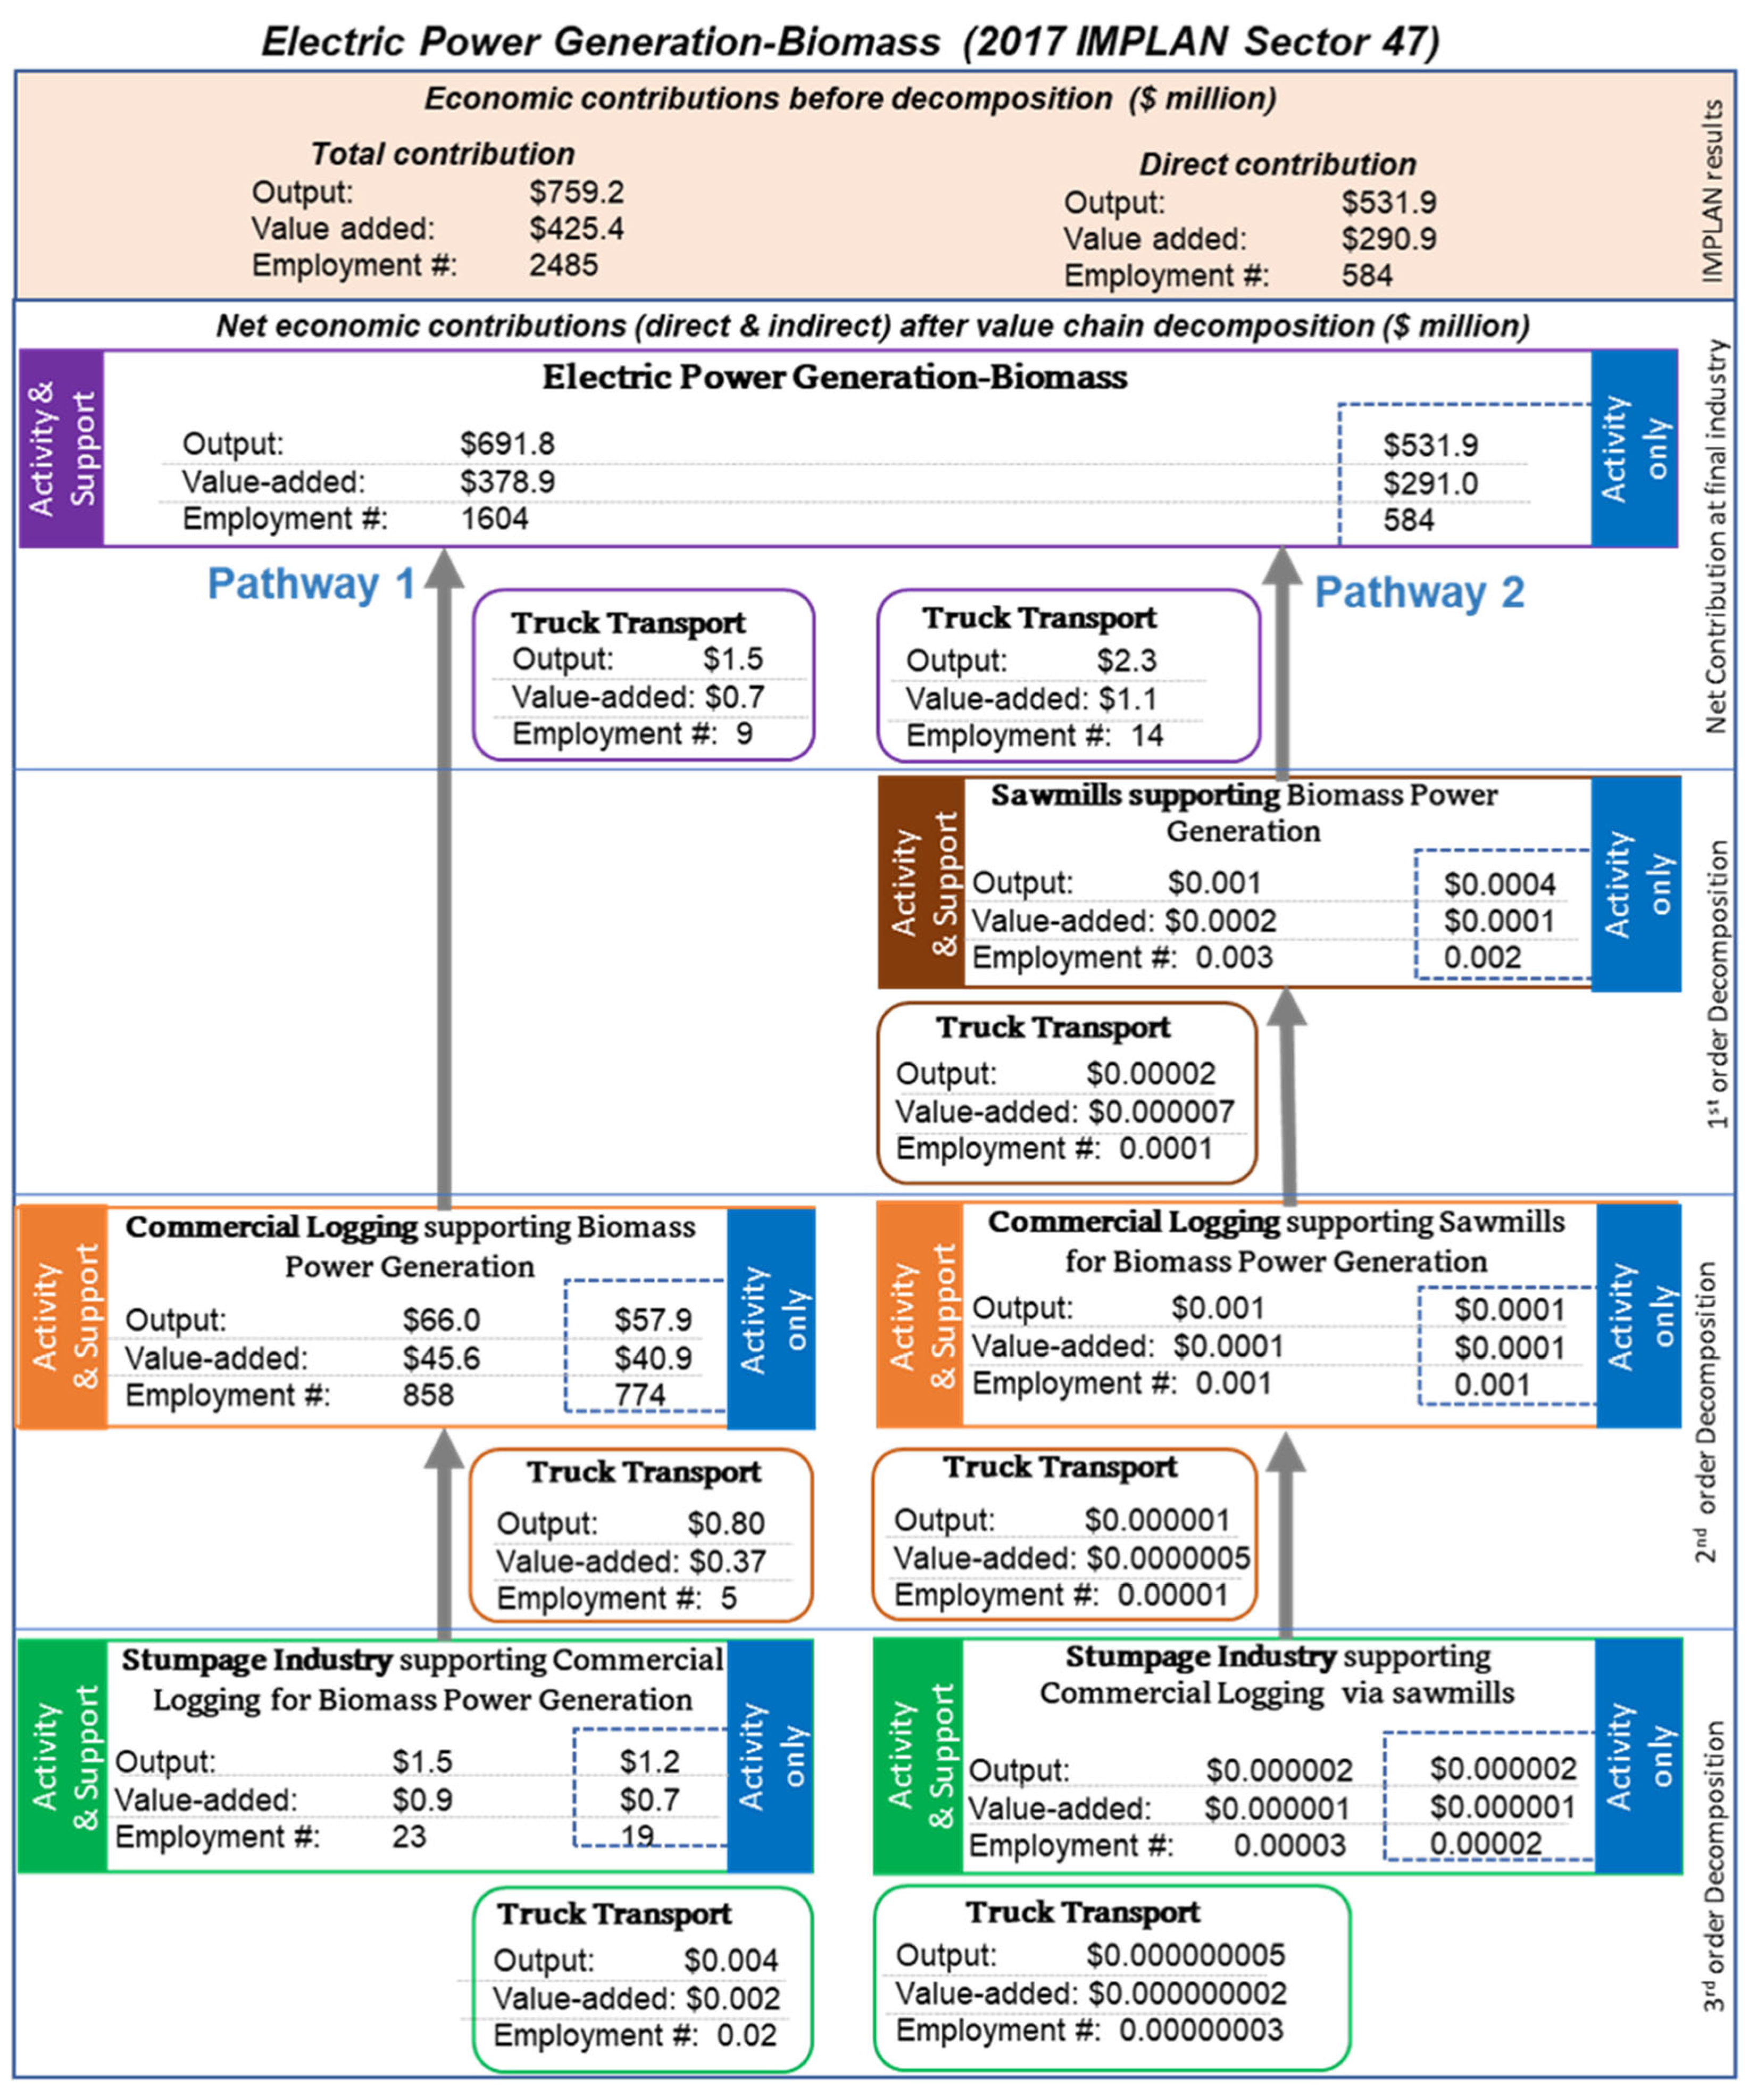
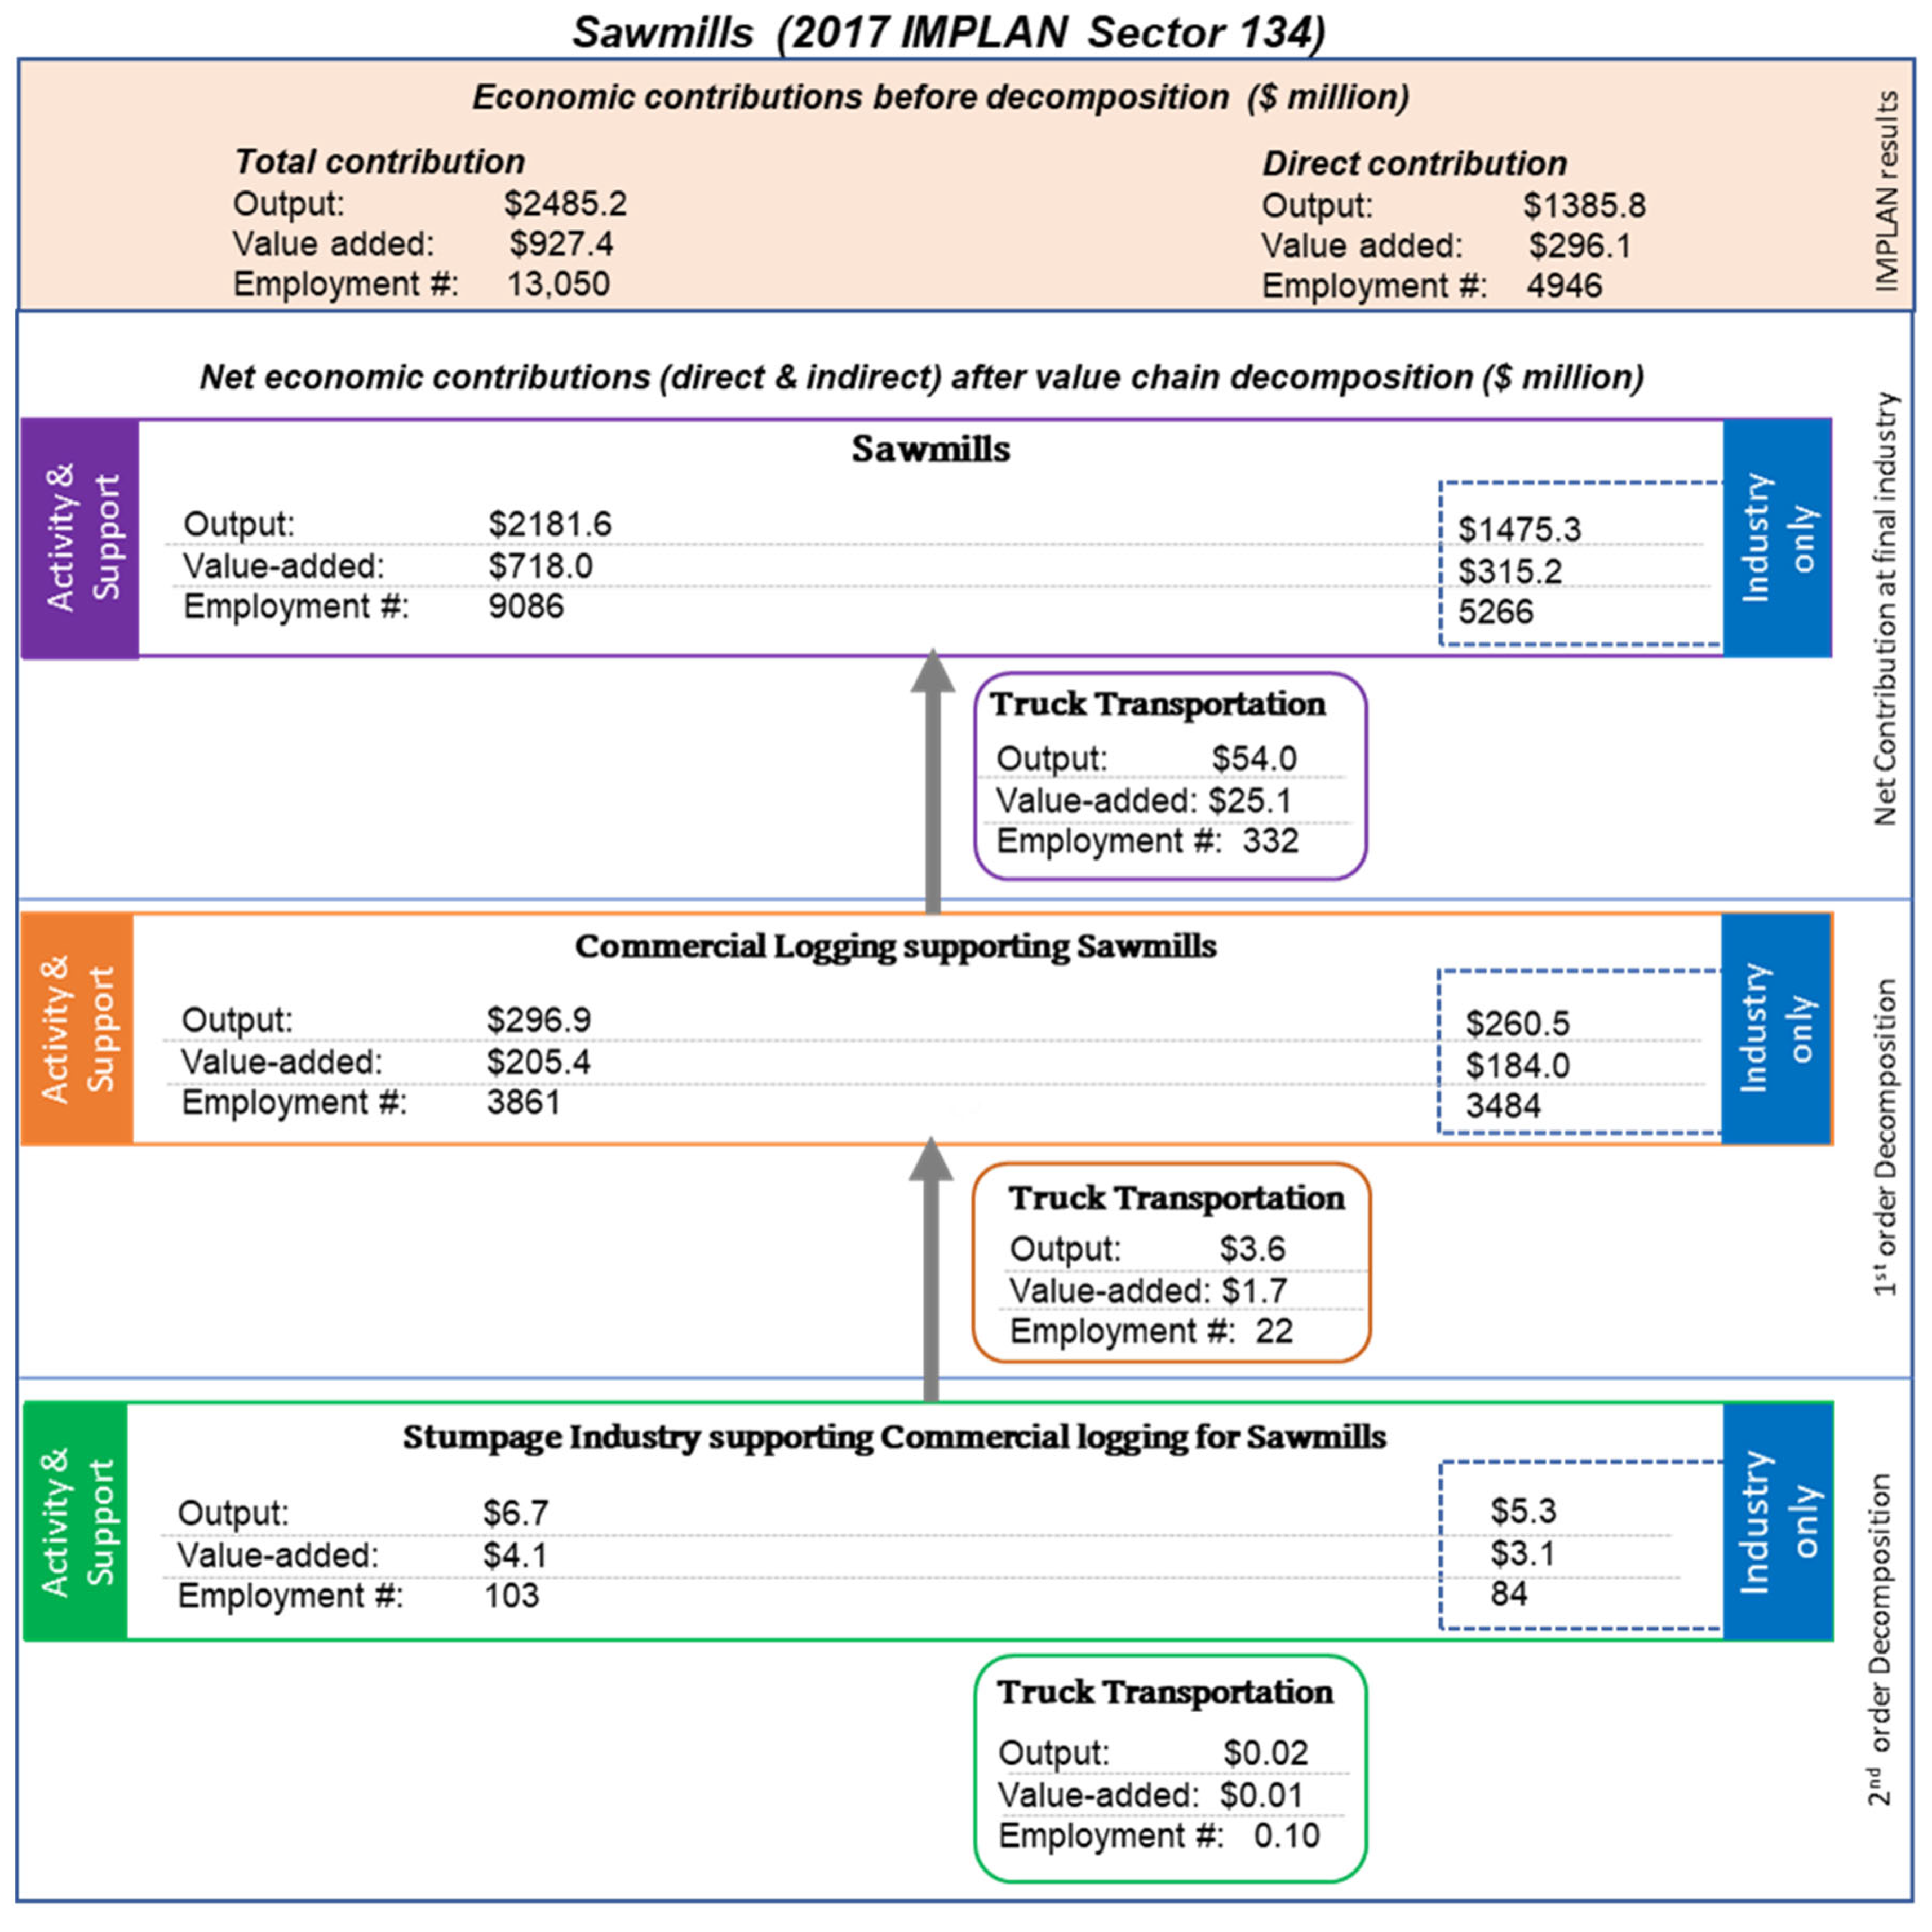
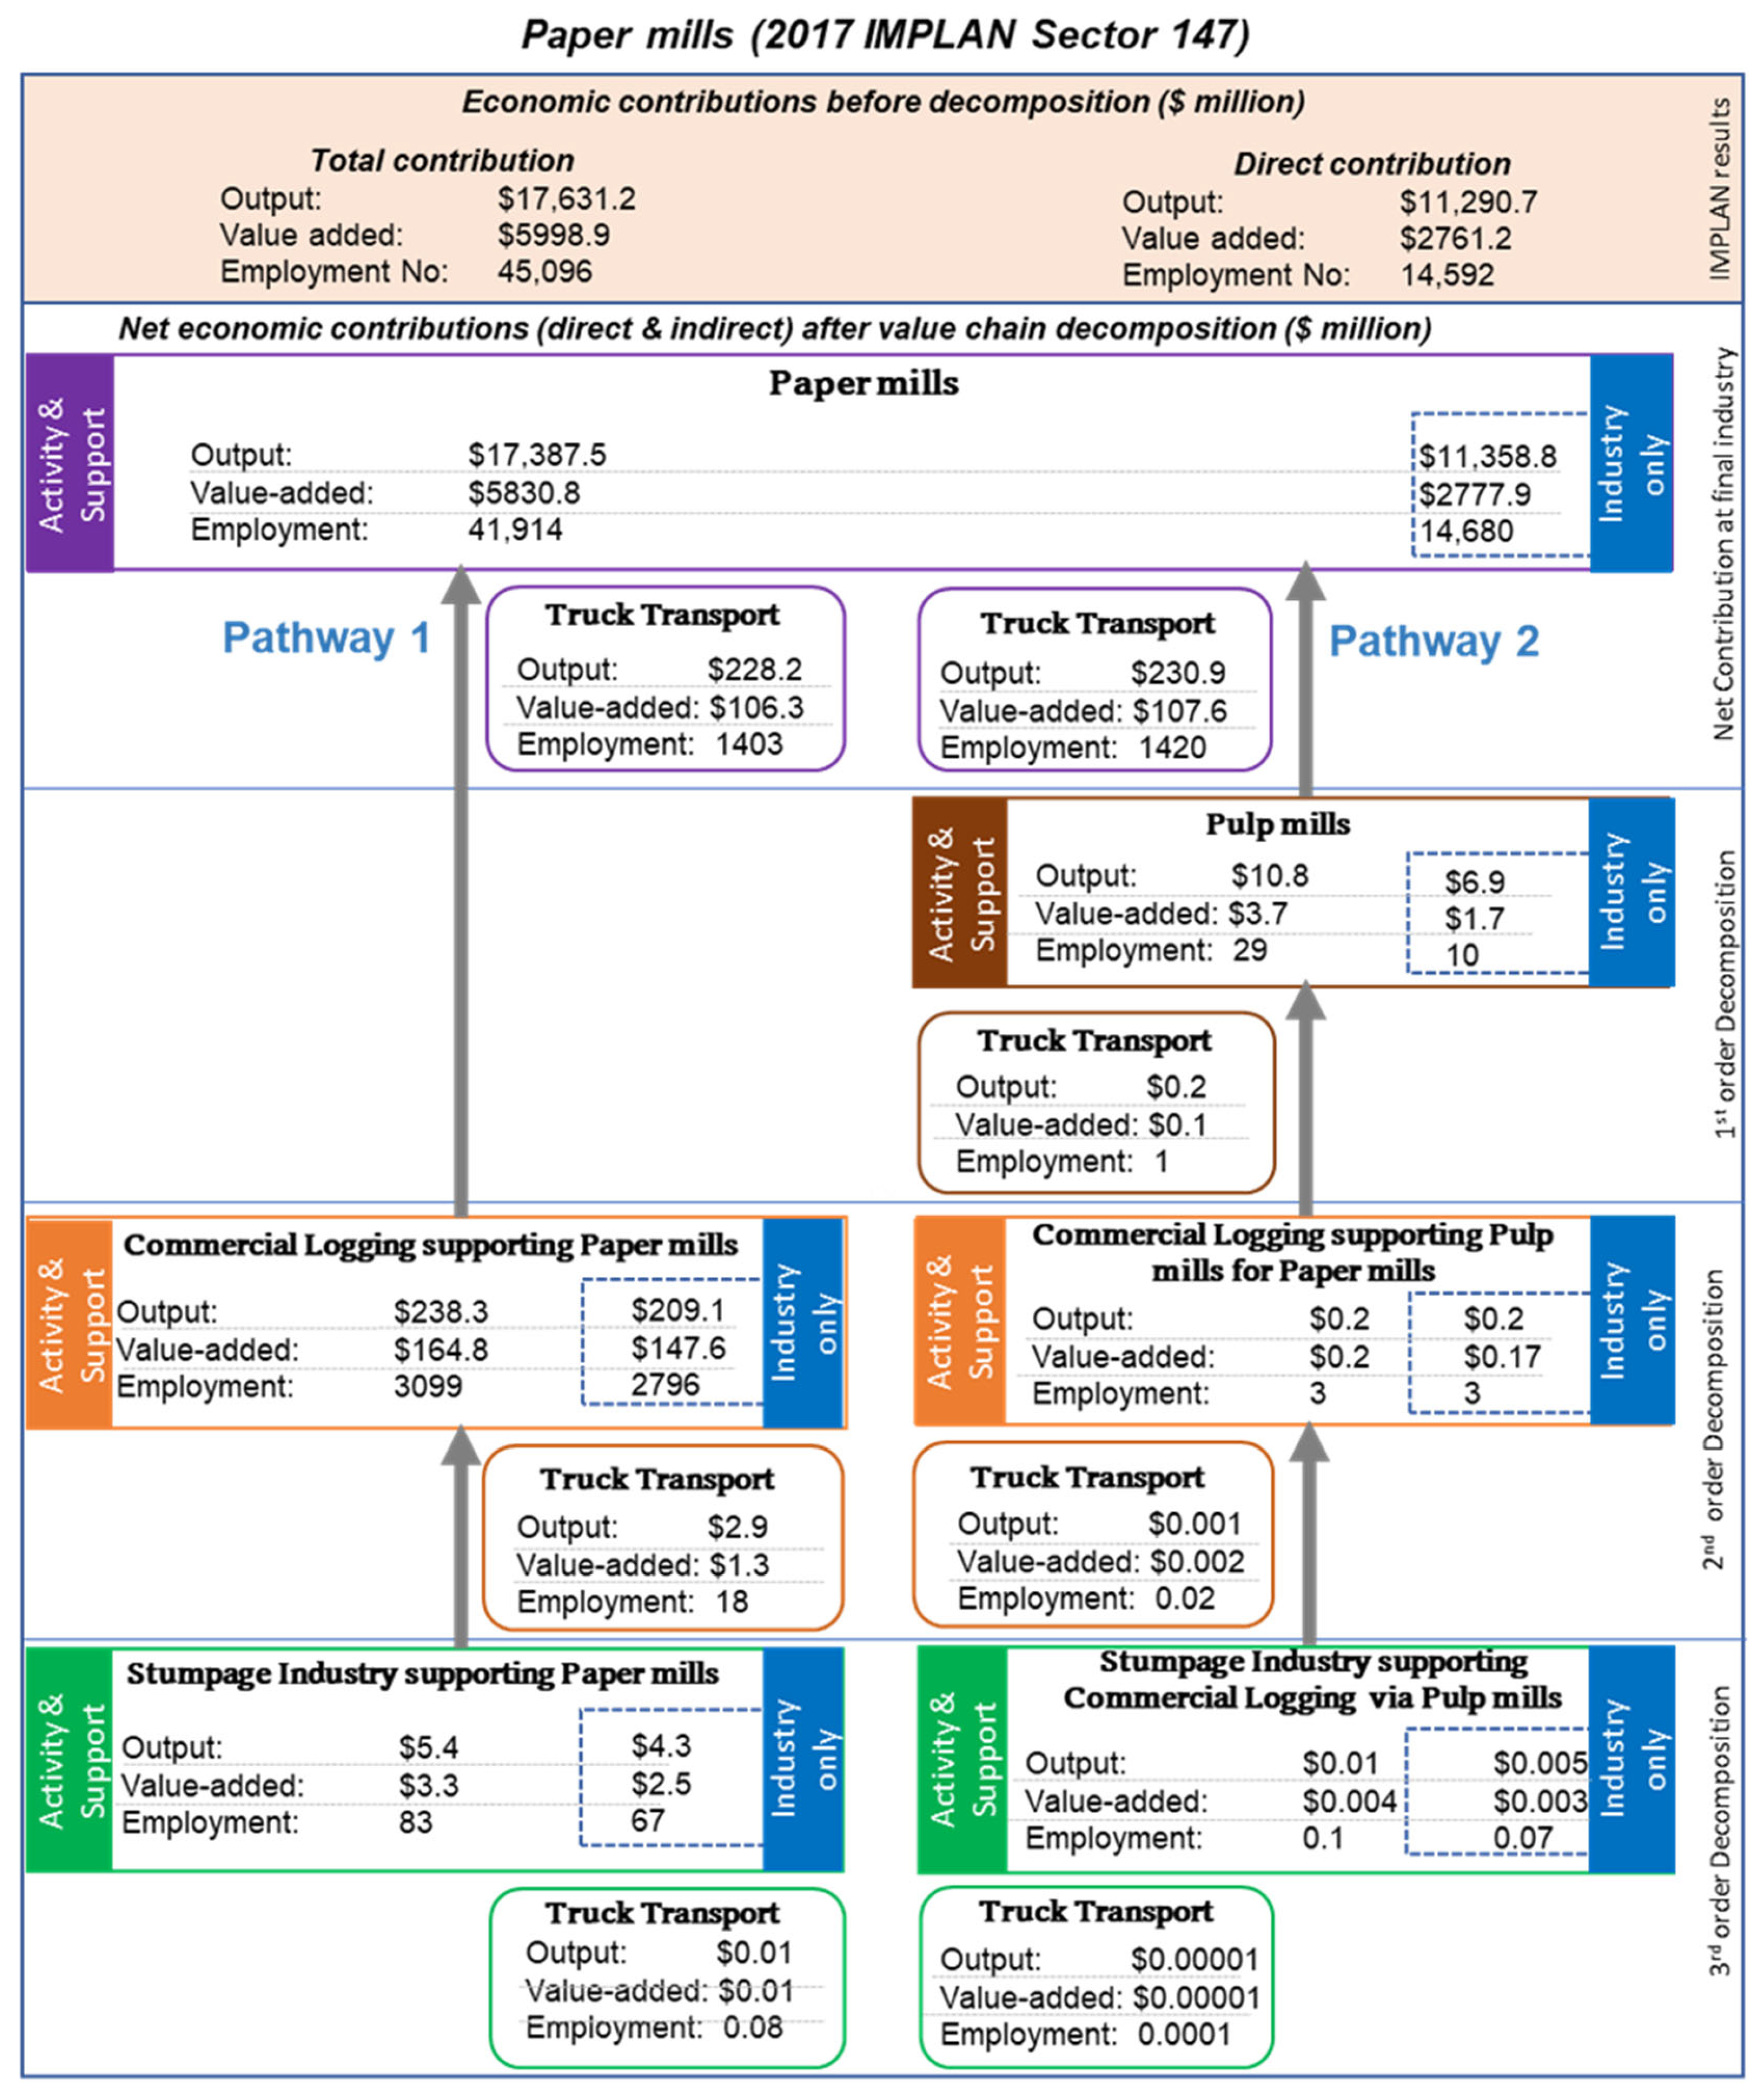
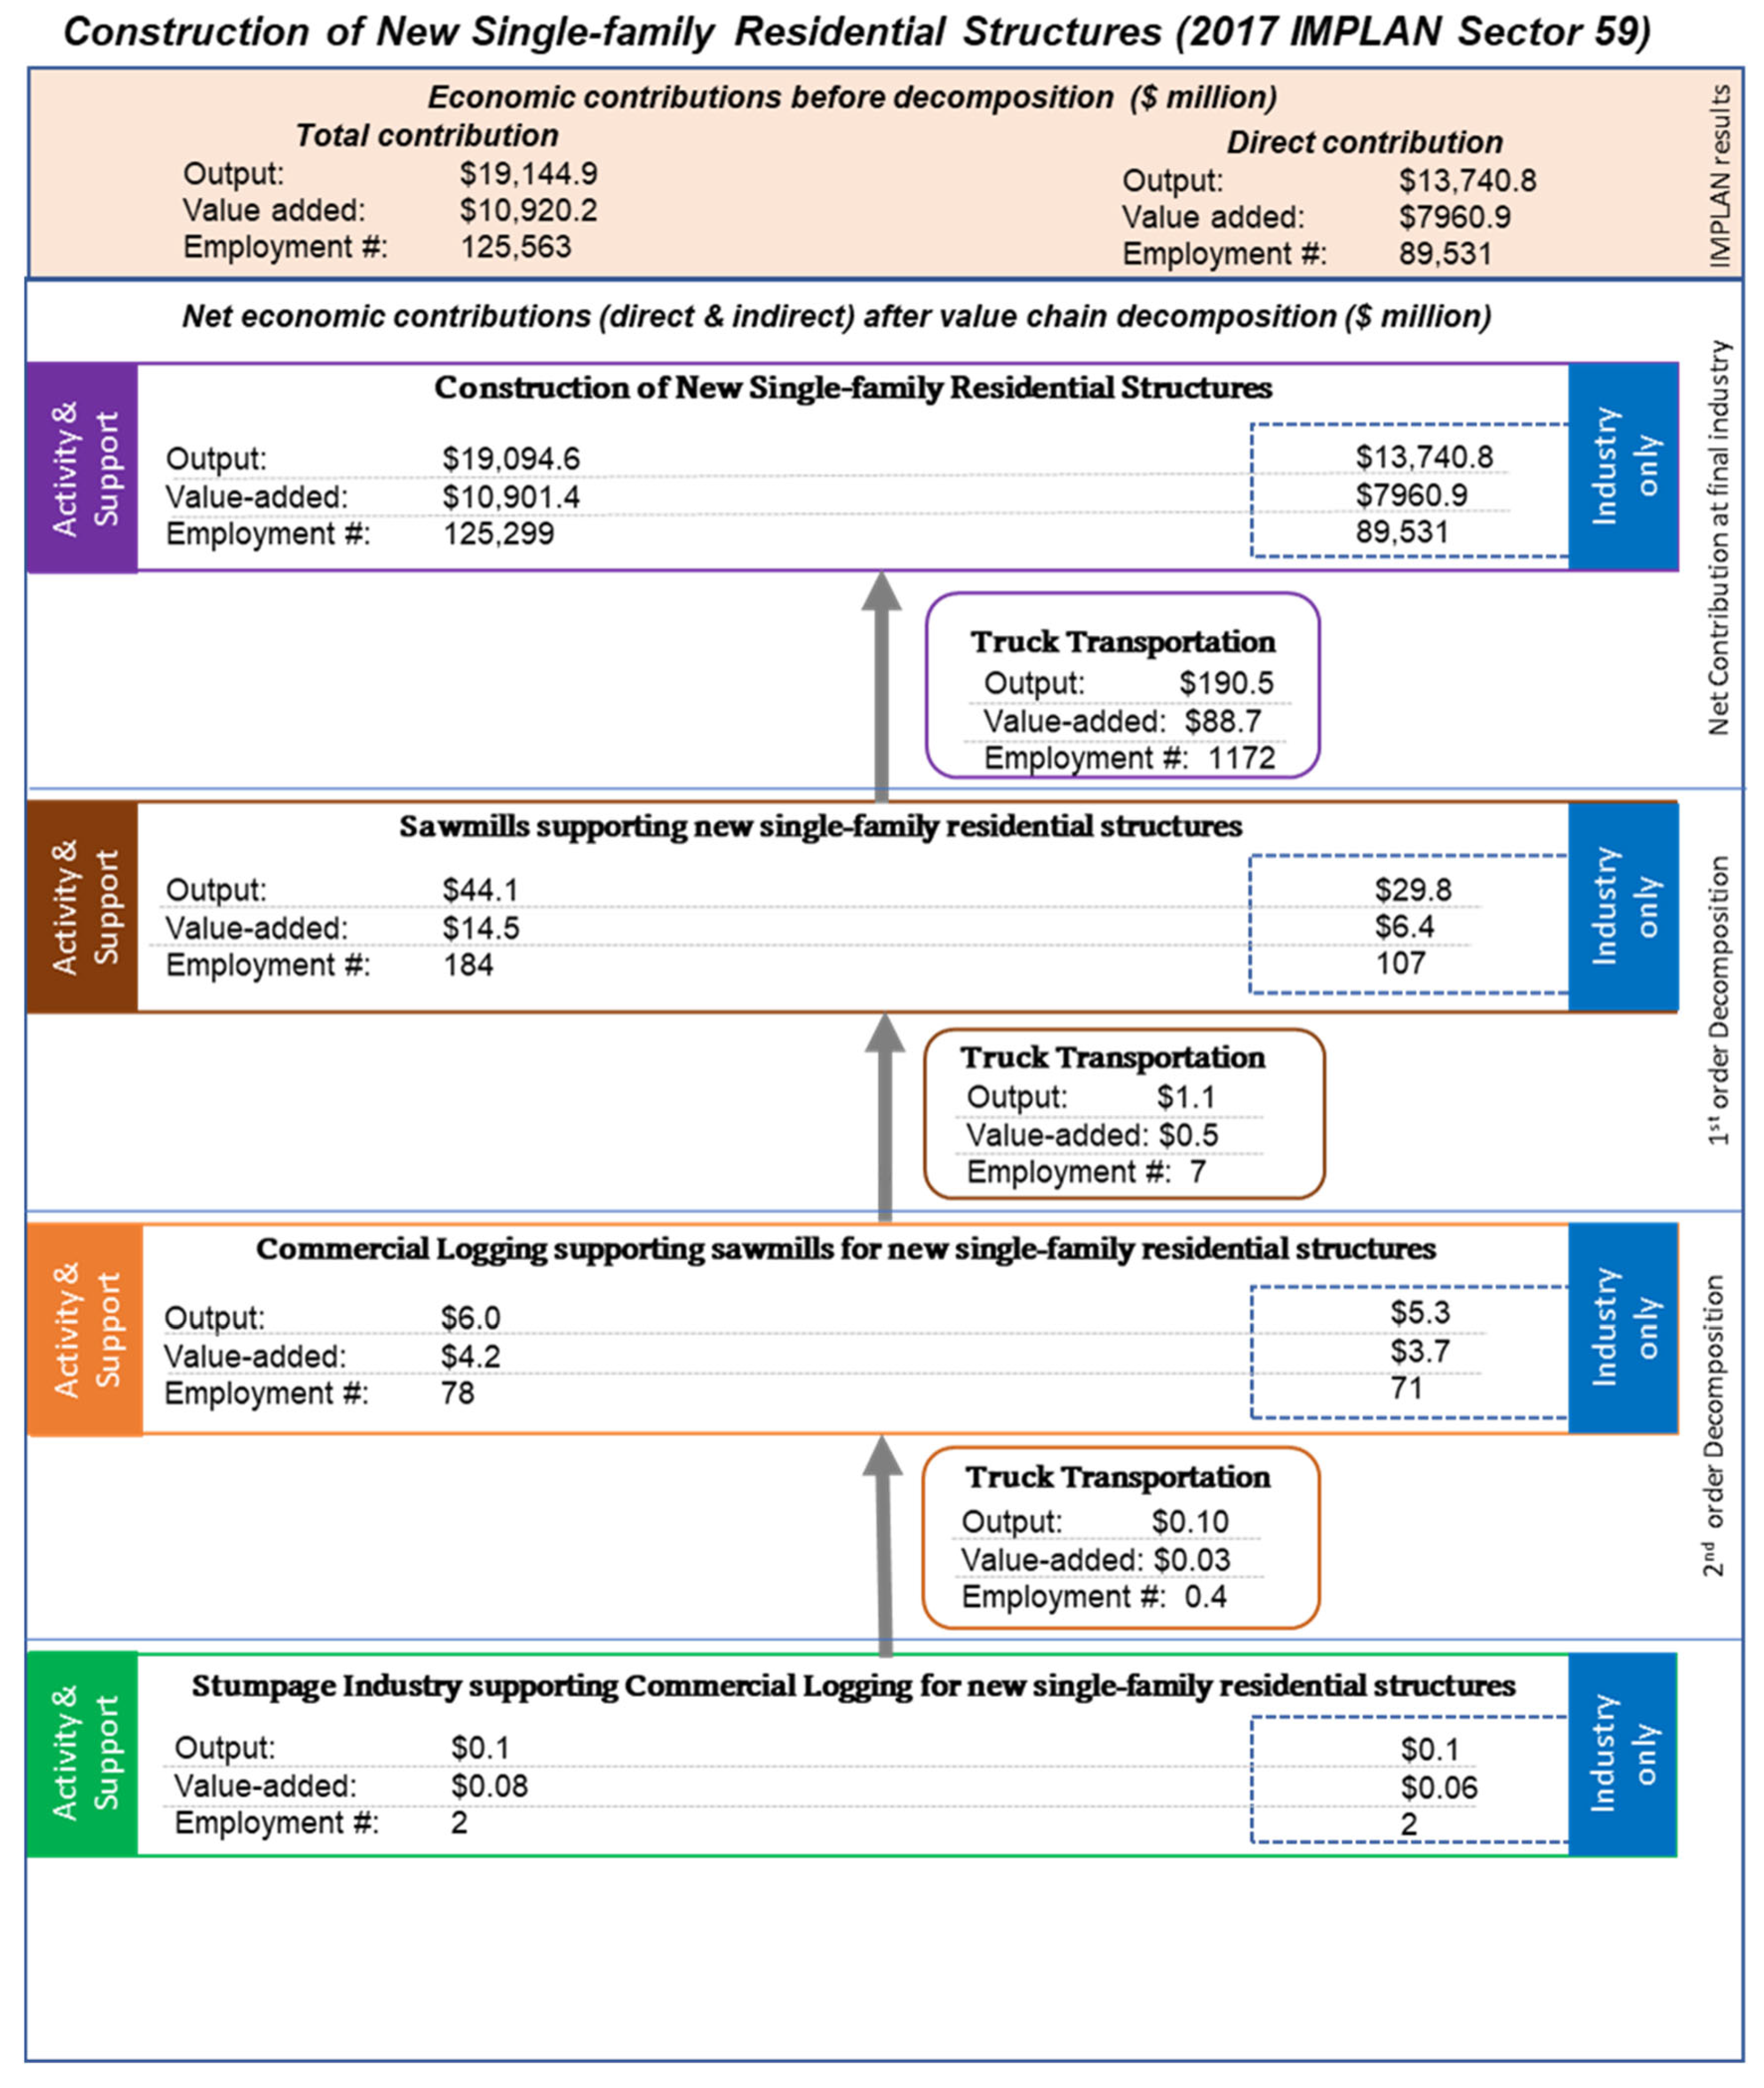
To estimate the economic contributions of selected forest resource industries and their associated value-chain activities in the Lake States region of Michigan, Minnesota, and Wisconsin, the I-O model for the three-state region was built using 2017 IMPLAN data as stated earlier. In the 2017 IMPLAN dataset, the biomass power generation industry is represented by sector 47. Likewise, sawmills are represented by IMPLAN sector 134, paper mills are represented by IMPLAN sector 147, and the construction of new single-family residential structures by IMPLAN sector 59. The value-chain industries associated with wood input to the selected industries were then identified. The two main value-chain industries considered for our analysis were industries responsible for harvesting woody biomass/timber, i.e., the commercial logging industry (represented by IMPLAN sector 16), and those responsible for growing woody biomass/timber, i.e., forestry, forest products, and timber tract production (IMPLAN sector 15). From here on, IMPLAN sector 15 will be referred to as the stumpage industry. Additionally, the contribution of the truck transportation sector (IMPLAN sector 411) was also noted along the value chain.
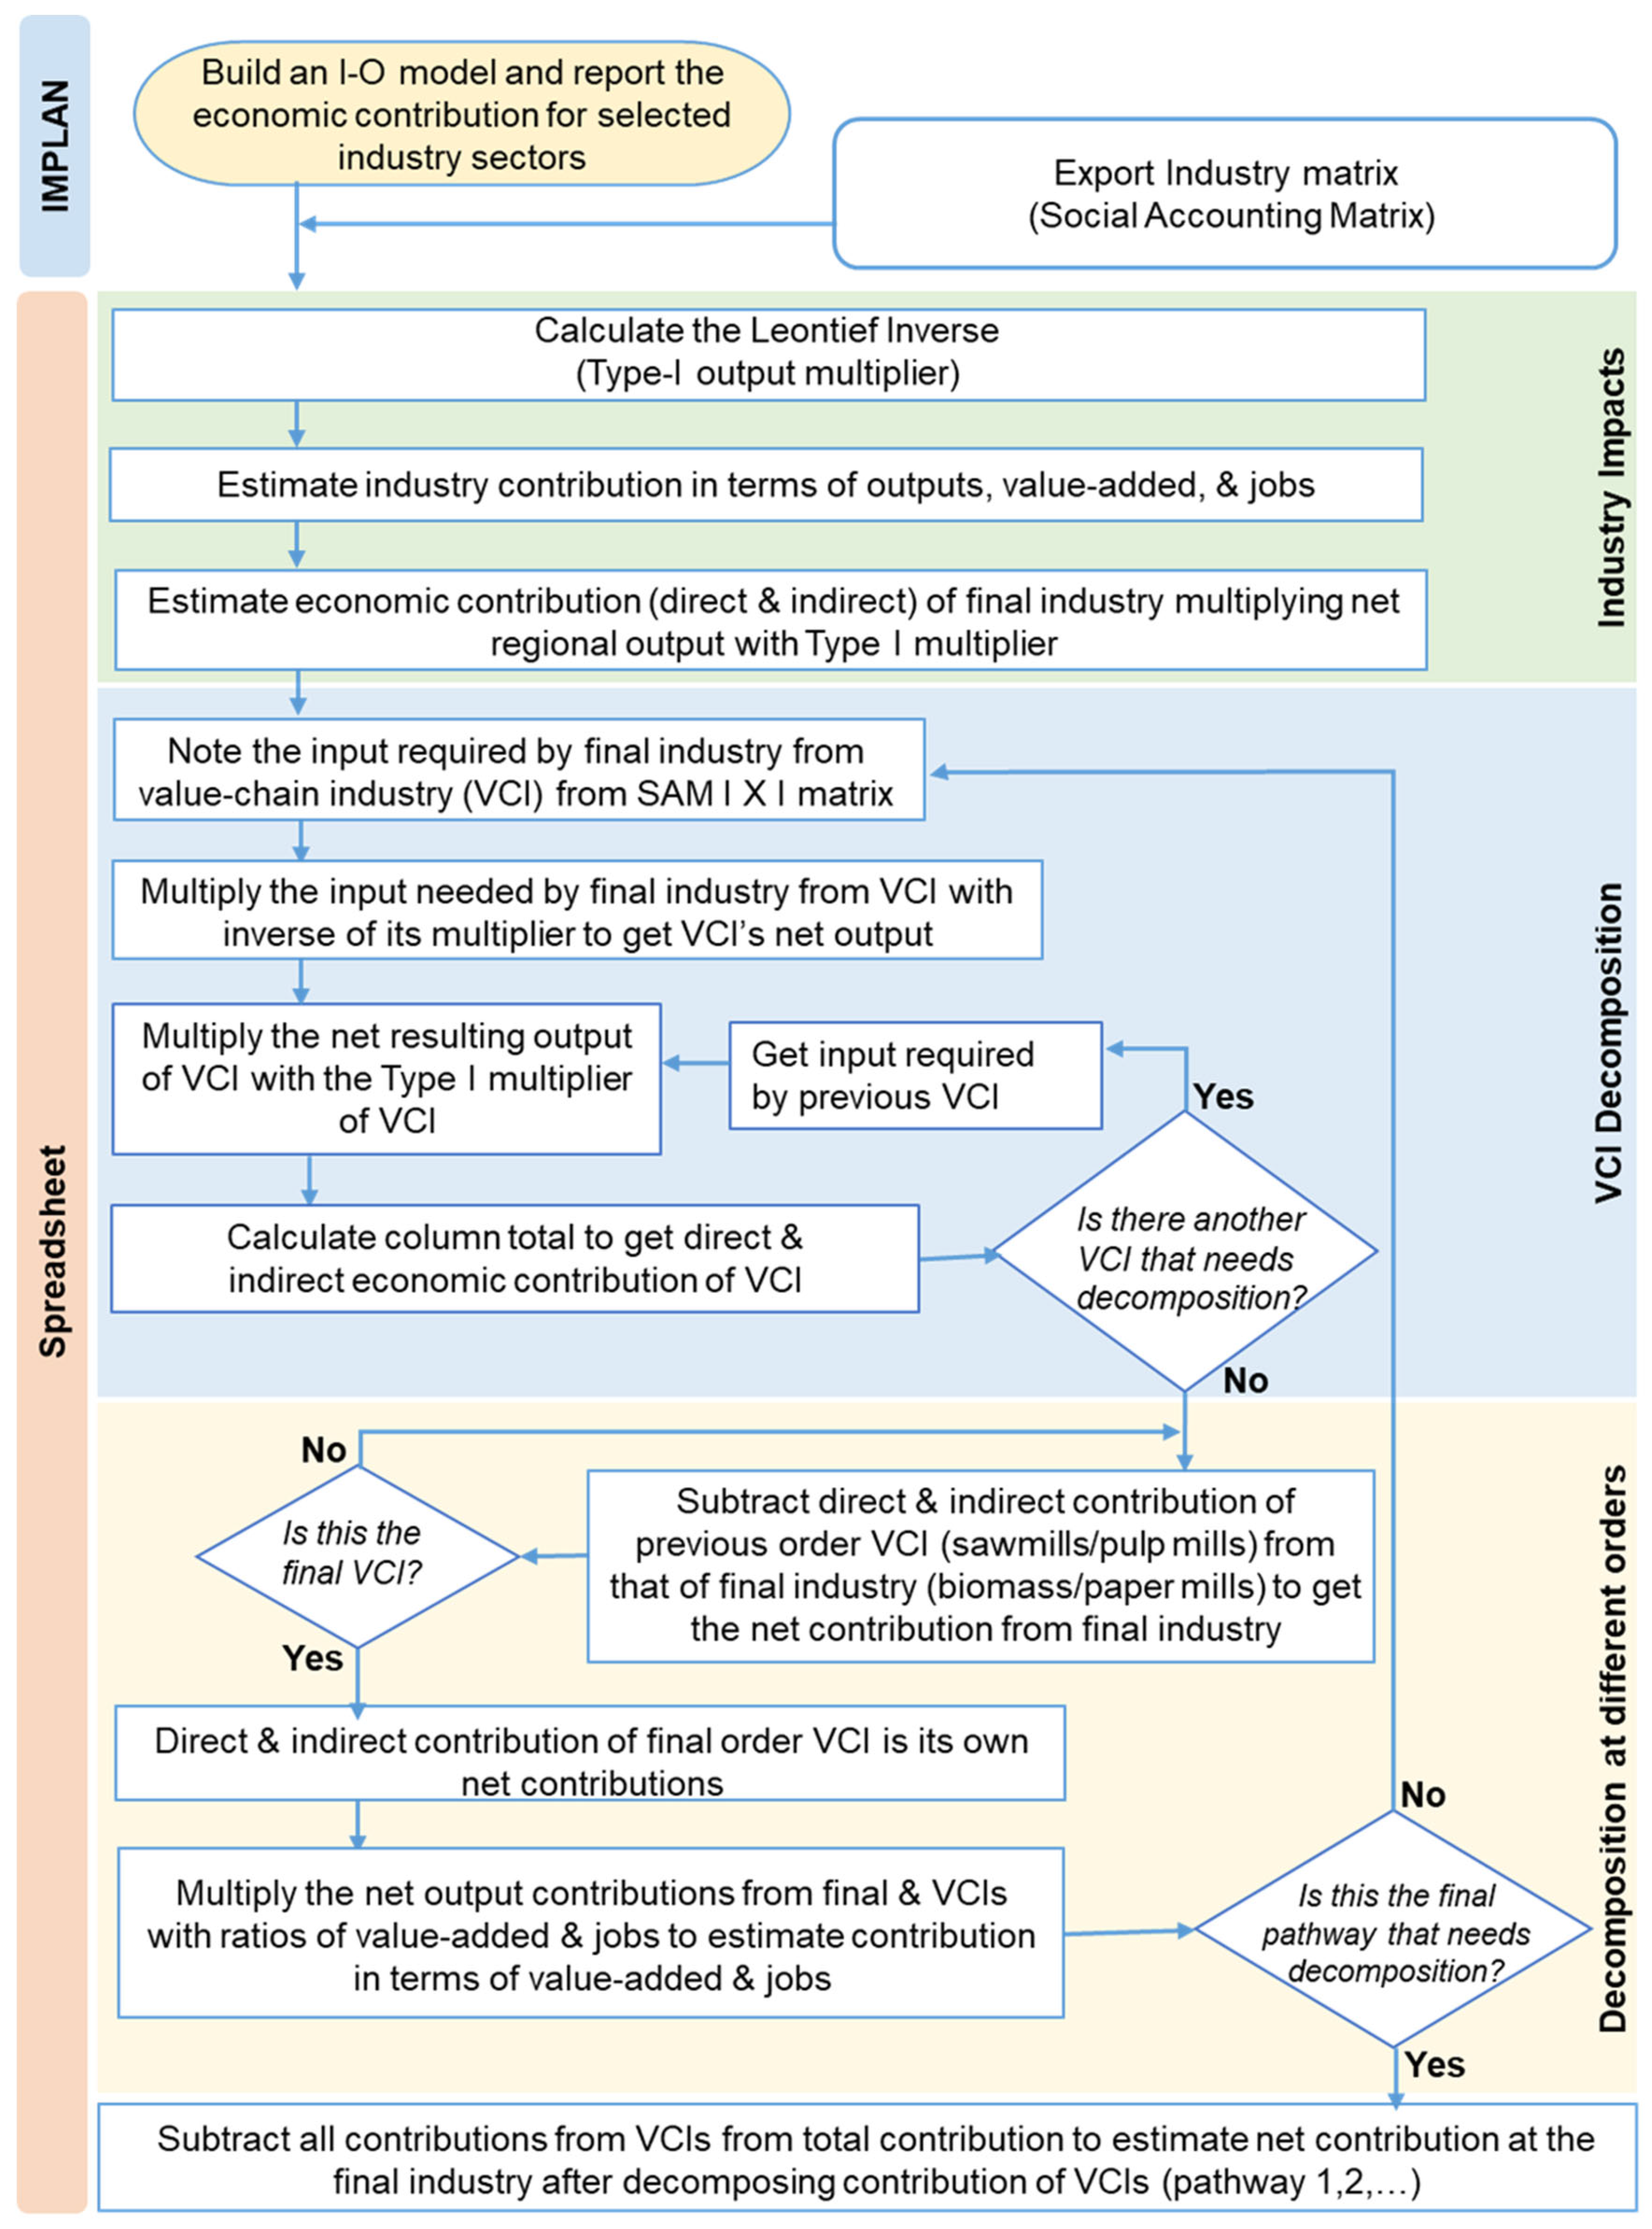
In the case of wood-using industries that may obtain their feedstock from different pathways, we decomposed the economic contribution for each pathway. For the biomass power generation industry, woody biomass can either come from sector 15 (stumpage industry) directly via the logging industry or it may come indirectly as residues from other wood-using industries such as sawmills. Additionally, biomass power generation can potentially use other feedstock such as black liquor from paper mills. However, these other sources were not considered for our analysis. For paper mills, two pathways of wood input were considered, directly from the stumpage industry via logging or indirectly from the pulp mills industry, which, in turn, obtains its input from the stumpage industry via logging. For the construction of new single-family residential structures, a single pathway of wood input was considered from the sawmill industry, which, in turn, obtained its input from the stumpage industry via logging. Likewise, for the sawmill industry, a single pathway of wood input was considered, which is from the stumpage industry via the commercial logging industry. It is important to note that the total economic contributions estimated in this study include direct and indirect contributions only and exclude induced contributions. Net economic contribution estimation obtained along the value-chain activities under a single pathway is additive, meaning that the sum of the total net economic contributions of the final industry of interest and value-chain industries gives rise to the total economic contribution of the final industry. The steps below list the sequence of analysis conducted in the spreadsheet to estimate the economic contributions of the selected industries of interest and their associated value-chain industries (
Figure 2).
- Step 1.
Build an I-O model for the region of interest in IMPLAN and export the Type-I output multiplier matrix and SAM matrix from IMPLAN into the Excel Spreadsheet. IMPLAN Pro (desktop version of IMPLAN) lets the user export the Type-I output multiplier into Excel. However, one could use the industry data to calculate the Leontief Inverse or the Type-I output multiplier in Excel. Type-II or SAM multipliers can be used based on the objective of the study. Here, we are only interested in direct and indirect contributions, so we are using the Type-I multiplier.
- Step 2.
Estimate the ratios of employee compensation, proprietor income, other property income, taxes on production and imports, value added, and jobs to total industry output in Excel. Here we are estimating the industry contribution only in terms of outputs, value-added, and jobs, but one can use any coefficients as per the requirements of the study.
- Step 3.
Estimate the economic contributions of the final industry (for example, biomass power generation industry in terms of output).
- -
If an industry (for example, the biomass power generation industry) is represented by sector
j where
j = 1 to
n and
n is the number of total industry sectors, then multiply the total regional output of the final industry (
) with the inverse of the multiplier for that industry
to obtain the net regional output (
). This is analogous to converting the “Output-to-final demand multiplier” into “Output-to-output multipliers” as described by Miller and Blair [
27] or the matrix inversion approach in Parajuli et al. [
28]. Here, we termed it the net regional output of the biomass power generation industry.
- -
Multiply the resulting net regional output (
) with the Type I multipliers vector for the biomass industry:
- -
Calculate the column total to obtain direct and indirect economic contributions (output) of the final industry.
- Step 4.
Note the input required by the final industry (biomass power generation) from the next value-chain industry (VCI) to produce its output by referring to the intersection of the column for the final industry and row for the value-chain industry in the SAM I X I matrix. Let us represent the input for sector j from the first-order VCI as .
- Step 5.
Estimate the economic contributions of the first-order VCI (logging sector) because it is supplying its output to the final industry for producing its output (say biomass power generation to produce electricity). Note that the total input required by the final industry from the value-chain industry is the output for the value-chain industry.
- -
Multiply the input required by the final industry from the VCI for producing its output (
) with the inverse of the multiplier for VCI to obtain net output (
for estimating the economic contributions of the value-chain industry, where
v,
w,
w1,
w2, … represents the first, second, and subsequent order value-chain industries.
where
is the inverse of the multiplier for the first-order value-chain industry.
- -
Multiply the resulting net output (
for the first-order VCI with the Type I multiplier for that industry:
- -
Calculate the column total to obtain direct and indirect economic contributions (in terms of output) associated with the value-chain industry because it supplies its output to the final industry.
- Step 6.
Repeat a similar process to estimate the economic contributions of other VCIs in the order. The input required by the first-order value-chain industry from the second-order value-chain industry to support the level of production of the final industry can be obtained by referring to the vector estimated by multiplying the net output of the first-order value-chain industry by that industry’s Type I multiplier. Suppose the stumpage industry is represented by sector w and the input required by the logging industry from the stumpage industry to support the biomass power generation industry is represented by * . The net output of the stumpage industry to estimate its economic contributions will then be
and the economic contributions can be estimated as before.
- Step 7.
Estimate the net contribution from the final industry.
- -
Subtract direct and indirect economic contributions of the value-chain industry from that of the final industry.
- Step 8.
Estimate the net contribution from the value-chain industry.
- -
Subtract direct and indirect economic contributions resulting from the order value-chain industry from the direct and indirect contributions resulting from the next order value-chain industry.
- Step 9.
Suppose represents the ratio of other economic components to the total output of industry’ j’, where k = Total Employment/Total Output, Total Value-Added/Total Output, Total Labor Income/Total Output, and so on and j = 1, 2, …., n). Multiply net output contribution values for final and value-chain industries by the ratios of value-added and employment to total industry output to obtain economic contribution estimates in terms of value-added and employment or with , and so on to obtain the total contribution in terms of other components along the value chain.
- Step 10.
Subtract the total contributions of all VCIs from the total contribution to estimate the net economic contribution for the final industry. The net contribution excludes allocation for only value-chain industries that were decomposed but includes contributions from other VCI that were not subjected to decomposition.
Figure 2.
Flowchart with the methodological framework for decomposing economic contributions of the industry of interest and its associated different order value-chain industries across multiple pathways.
Figure 2.
Flowchart with the methodological framework for decomposing economic contributions of the industry of interest and its associated different order value-chain industries across multiple pathways.
4. Discussion
Information on the economic contribution of single or aggregated forest products industries to state, regional, and national economies provides valuable information to forestry professionals and stakeholders. This information is crucial for effectively communicating the importance of the forestry sector to policymakers and aiding in the design of programs and policies that support forest product industries [
29,
30,
31]. However, to our knowledge, very few have made an effort so far to outline the decomposition of value-chain activities through structural paths in input–output multiplier models [
17,
18]. Our study is unique in that it establishes a unique structural path (value-chain) for selected industries using wood as an input resource to produce the final output in the Lake States and highlights the value-chain activities associated with the wood resource. We not only estimated the economic contribution resulting from the final wood-using industry of interest (biomass power generation, sawmills, paper mills, and construction of new single-family residential structures) in our study but also disaggregated the economic contributions associated with the value-chain activities dealing with wood from the general economic contribution. The novelty of this method is that it allows for quantifying and highlighting the economic importance of intermediate value-chain industries associated with the final wood-using industry, which may or may not be a forest product industry. It could be an industry such as the construction of a single-family residential structures industry, which is not a forest product industry per se but uses wood as one of the ingredients for producing its final output.
Past economic contribution analysis studies have not been consistent in their choice of industry sectors to include and aggregate to analyze the economic contribution of forest product industries nor the methods of studying economic contribution analysis [
2,
3,
25,
30,
31,
32]. This is most likely due to the variation in the relative importance of different forestry-related sectors across the country. In the United States South, Joshi et al. [
30] aggregated 33 IMPLAN (2013) sectors to evaluate the contribution of forest product industries. In the Northeast and the Midwest, Leefers et al. [
31] included 32 IMPLAN (2017) sectors, Jolley et al. [
2] aggregated 3 IMPLAN (2017) sectors in commercial logging and 8 in pulp and paper industries, and Pelkki and Sherman [
3] used 29 IMPLAN (2016) sectors. When industries are aggregated, there is a potential bias introduced due to the double counting of contributions across different sectors. Watson et al. [
7] and Henderson et al. [
29] proposed different methods to minimize these biases. Parsing out the contribution across value-chain industries provides an unbiased evaluation, as this process decomposes contributions into individual pathways.
The construction of new single-family residential structures is generally not included in these identified forest products industries. However, using the method proposed in this study, one could estimate the economic contributions of activities associated with the wood input into this industry or any other industry that uses wood as an input for production. Though we presented case studies of industries using wood as an input resource in our study, the method is applicable for tracking the economic contribution of value-chain activities associated with any natural resource input.
Among four wood-using industries, the total output is the highest for the construction of new single-family residential structures (
$19.1 billion) followed by the paper mills (
$17.6 billion), sawmills (
$2.5 billion), and the biomass power generation industry (
$759 million) in the Lake States. The construction industry most likely generates a larger economic footprint in terms of industry output, value added, and employment due to its vertical supply chains and horizontal linkages characterized by its diverse portfolio, high labor requirement, and interdependencies with multiple sectors [
33]. When disaggregating the economic contributions of the selected industries to assess the net economic contributions associated with timber-harvesting activities, the highest net total output from the commercial logging industry was noted in the case of sawmills (
$297 million) followed by paper mills (
$238 million), the biomass power generation industry (
$66 million), and the construction of new single-family residential structures industry (
$6 million), respectively. A similar trend in the net total contribution was seen in the stumpage industry. The net total contribution of the stumpage industry by supplying wood products needed to feed the sawmills was
$6.7 million, paper mills was
$5.4 million, the biomass power generation industry was found to be approximately
$1.5 million, and the construction of new single-family residential structures was found to be approximately
$0.1 million. Our findings also estimated the jobs, output, and value added associated with the truck transportation industry by the four industries using wood as input and identified how much of it was attributable to the commercial logging and stumpage industries. Such findings help bring much-needed attention to these value-chain industries, which are crucial for the smooth functioning of supply chains.
We looked at two potential pathways of wood input for the biomass power generation industry and paper mills. For the biomass power generation industry, one pathway flowed directly from the commercial logging industry while the second pathway was associated with the utilization of residues generated by the sawmill industries in the region. Our findings reveal that most of the wood input into the biomass power generation industry in the region comes directly from the commercial logging industry and only a small percentage comes in the form of residues from the sawmill industry. By virtue of supplying wood residue to the biomass power-generating industry in the region, the sawmill industry contributed a net total of
$650 in output,
$240 in value added, and 0.003 jobs. This is likely because mill residues, considered byproducts or waste with minimal economic value, are often directed to landfills (waste management) and biopower production facilities. Since IMPLAN tracks the expenditures to obtain the inputs, it is not surprising to observe fewer economic contributions allocated to sawmills for biopower production. This finding suggests that the use of mill residues for biopower production does not result in the same level of contribution as when utilizing forest biomass for energy production. Paper mills are located towards the downstream end of the forest product industries and can derive both raw and intermediate material inputs from the logging industry, pulp mills, and other wood-using industries such as sawmills. For paper mills, the findings revealed that paper mills in the region source most of their wood input directly from the commercial logging industry rather than sourcing it from pulp mills. Because of supplying inputs to the paper mills in the region, pulp mills contributed a net total of
$10.8 million in output,
$3.7 million in value added, and approximately 29 jobs. Court et al. [
32] concluded that the forest product industries manufacturing wood and paper have greater economic contributions compared to traditional harvesting activities.
Findings on the inter-industry economic contribution showed that the contribution of the commercial logging industry to the total output is greater for sawmills (12%), followed by the biomass power generation industry (9%) and paper mills (1.4%), while it is inconsequential for the new single-family residential structures industry (0.03%). The value-added contribution of commercial logging followed a similar trend with approximately 22% for sawmills, 11% for the biomass power generation industry, approximately 3% for paper mills, and 0.04% for the new single-family residential structures industry. Similarly, the contribution of commercial logging in the number of jobs supported was found to be higher for the biomass power generation industry (35%), followed by sawmills (30%), paper mills (7%), and the construction of new single-family residential structures industry (0.06%). This indicates that a large proportion of the economic contributions of the sawmill and biomass industries, whose primary input is wood, comes from the commercial logging sector compared to others, highlighting the economic impacts being spread out in the value chain. Despite the overwhelming use of wood-frame (over 90%) for producing different components for the construction of new single-family residential structures [
34], the contribution of commercial logging and stumpage industries is low, which could be attributed to construction activities being the most cost- and labor-intensive, as well as using many other inputs in addition to wood in the supply chain. Also, a significant volume of lumber comes from the South or Pacific Northwest, which hosts a larger land base of softwood sawtimber forests and a larger number of sawmills with high production capacity. However, our study estimated that the net contribution of commercial logging to the construction of new single-family residential structures accounts for approximately
$6 million in the Lake States region. The commercial logging industry directly supports other wood-using industries by supplying raw materials while supporting other retail and service industries through indirect effects.
Decomposing value-chain industries is not limited to identifying the contribution of value-chain industries in wood-based industries but also helps to identify bottlenecks in the economic growth of these downstream industries. Information on the economic contribution of value-chain industries to the final output industries will assist forest landowners, industry representatives, and policymakers in planning and strategizing further investments and innovations based on the importance of the intermediate value-chain industries to meet the increasing demand for forest products. Value-chain industries such as commercial logging and trucking are crucial for the smooth functioning of all forest product industries as these are the entities responsible for connecting forest resources to primary and secondary forest product industries. Past literature suggests that these value-chain industries are facing critical challenges to remain in business and operate profitably given the changing market conditions, increasing operating costs, and declining profit margins [
20,
21,
22,
35]. Additionally, the aging logging workforce and difficulty in retaining and recruiting young workforce members in both the logging and trucking industries have led some to view these sectors as the weakest link in the forest product industry supply chain [
22,
25,
36]. Given this, emphasizing the economic importance of such value-chain industries is useful for attracting much-needed attention to these industries and our decomposition of value-chain economic contribution analysis method aids in doing that. Further, understanding the role of forest-based industries in rural economies and the workforce challenges along the value-chain industries is important for policy interventions [
37]. Recent studies have analyzed the economic impacts of conservation easement [
14], forest legacy programs [
15], and ecological restoration [
13] where multiple sectors are aggregated, indicating expanding use of these modeling frameworks beyond the commercial use of wood. Our approach could help parse out value-chain industries and their relative importance in conservation and restoration activities.
A couple of limitations of our study are worth mentioning. First, while our study offers a methodological contribution to the field of I-O analysis, our spreadsheet-based approach may be impractical for widespread adoption by practitioners. In particular, the intricacies of formulas and mathematical derivations could pose challenges to practitioners who are not well-versed in economic theory. This could lead to misinterpretations or errors in calculations. Therefore, we suggest that IMPLAN incorporate a built-in decomposition option within its interface or develop an application, which could mirror the recently introduced contribution analysis in the cloud-based update. Second, due to the complexity of forest product flow, inherent inter-industry dynamics and related economic interdependencies, and the difficulty of accounting for exogenous sales, the decomposition of the economic contribution of wood-using industries obtaining feedstock from multiple pathways requires caution and further research to address the existing challenges. Finally, this methodological framework makes fine-grained distinctions between activities in the value chain; hence, it needs detailed empirical I-O to support these distinctions. Data and model improvements to support value-chain decomposition for practitioners would improve the applicability and accuracy of this procedure, which is beyond the scope of our paper to address.
Although the economic contribution and impact studies of wood-based industries have been widely used since the late 2000s, conceptual differences exist in terms of the contribution or impact analysis; thus, identifying standardized practices for these analyses is an area of active research [
7,
28,
32]. Though the spreadsheet-based decomposition of economic contribution analysis presented in this study focused on single industries, a similar method could be applicable when conducting economic contribution analysis of aggregated industry sectors given that industries are aggregated in IMPLAN before exporting Type I multipliers. However, there could be a concern with the associated aggregation bias. Finally, while the study was conducted in the Lake States region, the findings have broader methodological applications in other regions.


 ,
, 

