Article

Effect of Vegetation Restoration on Soil Humus and Aggregate Stability within the Karst Region of Southwest China

1
Guangxi Key Laboratory of Forest Ecology and Conservation, College of Forestry, Guangxi University, Nanning 530004, China
2
Huanjiang Observation and Research Station for Karst Ecosystems, Chinese Academy of Sciences, Hechi 547100, China
3
Guangxi Key Laboratory of Water Engineering Materials and Structures, Guangxi Institute of Water Resources Research, Nanning 530007, China
4
Guangxi Key Laboratory of Agro-Environment and Agro-Product Safety, College of Agriculture, Guangxi University, Nanning 530004, China
*
Author to whom correspondence should be addressed.
Forests 2024, 15(2), 292; https://doi.org/10.3390/f15020292
Submission received: 14 January 2024 / Revised: 27 January 2024 / Accepted: 29 January 2024 / Published: 3 February 2024

Abstract

:
This study aims to investigate the impact of vegetation restoration on soil humus and aggregate stability within the karst region of Southwest China. This study focused on soils at five vegetation succession stages (abandoned land, grassland, shrub rangeland, shrubland, and secondary forest) in the typical karst region, and the aggregate stability was determined using wet sieving and the Le Bissonnais method. Simultaneously, the Pallo method and separation extraction were used to determine the humus composition, aiming to analyze the distribution of humus content in the soil aggregates and its effect on aggregate stability. The results revealed the following: (1) The mean weight diameter of soil aggregates significantly increased with vegetation restoration stages. Soil water-stable aggregates at each vegetation stage mainly included particles over 2 mm in size. (2) The humic acid and fulvic acid contents consistently increased with vegetation restoration, and the precipitation quotient value of the humification degree showed an increasing trend. At each vegetation restoration stage, the percentage of each humus component was, from highest to lowest, as follows: insoluble HM, fulvic acid, humic acid, clay-bound HM, and iron-bound HM. (3) Through stepwise regression analysis, humic acid content in >2 mm aggregates, fulvic acid and clay-bound HM contents in 1–2 mm aggregates, and insoluble HM content in <0.25 mm aggregates were the dominant factors affecting soil aggregate stability in the karst region. These results aim to provide novel insights for a more in-depth comprehension of the restoration and rehabilitation of vegetation within the karst region of Southwest China, thereby laying a robust foundation for scientific theories and further investigations.

1. Introduction

Karst is a unique geomorphological landscape formed at the surface and underground binary space after soluble rocks are dissolved by water in the natural environment [1]. Owing to the continuous destruction of natural vegetation and large-scale irrational land use by human beings over a long period of time, soil erosion has been triggered, which is an active cause of the phenomenon of karst rocky desertification [2]. In addition, the ecosystems in karst regions are highly fragile, which easily generates soil erosion, resulting in ecological problems such as surface soil loss, droughts and floods, bedrock outcropping, and reduced biodiversity, and even leading to outstanding human–land conflicts [3]. In recent years, the world has begun to emphasize improvements in karst ecosystems [4], and revegetation is an effective measure to curb soil degradation and restore ecosystems. In the process of revegetation, the organic matter produced by litter, root decomposition products, and root exudates as well as the physical interpenetration and network consolidation of plant roots in soil can enhance the fertility and structure of degraded soils and reduce the risk of stone desertification. Extensive research has demonstrated that the increase in soil organic matter content after vegetation restoration is an active factor in soil fertility and quality improvement [5,6,7,8]. At present, relevant scholars have extensively researched soil organic matter [9,10] and have mostly focused on variations in the quantitative distribution of organic matter, but there are few relevant studies on the different components of organic matter. Soil organic matter mainly comprises decayed and decomposed macromolecular organic compounds, namely, humic substances (generally accounting for 60% to 80% of the total soil organic matter) whose decomposition and transformation processes are quite complex and mainly influenced by soil environment, soil decomposers, and climatic conditions [11,12]. According to soil humus theory, humus contains three basic components, namely, fulvic acid (FA), with a low molecular weight and active chemical properties; humic acid (HA), with a higher molecular weight characterized by a heterocyclic and highly condensed structure; and inert humin (HM). These components are structurally complex, numerous, and stable, ranging in molecular weight from hundreds to hundreds of thousands of Daltons and exhibiting a highly heterogeneous chemical structure [13].
Aggregates and organic matter are extremely important in determining soil quality [14], which is an essential part of soil structure and a key factor in soil resistance to breakage by external forces [15]. Soil aggregates play an influential role in regulating soil fertility, improving soil stability, and preventing soil degradation [16,17,18,19]. Aggregate stability significantly impacts soil physical properties and plant growth [20], and the number of aggregates also affects the soil water-holding capacity, porosity, permeability, and erosion resistance. Their composition and stability have received extensive attention among scholars worldwide [21,22,23,24]. The formation of soil aggregates generally depends on the cementation of organic and mineral particles and the cohesion of clay particles [25]. Different components of organic matter also influence aggregate formation and stability [26]. Aggregates provide sites where organic matter remains and play a physical role in protecting organic matter; aggregates and organic matter influence each other and are mutually reinforcing [27]. Numerous studies have reported that aggregates can form a physical isolation effect in space from soil microorganisms through physical protection, which can also reduce the oxygen content of aggregates, thereby reducing microbial mineralization and the decomposition of organic matter [28,29,30,31]. Soil organic matter can be combined with soil minerals for better cementation to form organic–inorganic complexes, constituting the chemical protection of minerals and promoting soil aggregate stability.
Soil humus is a cementitious substance formed by aggregates [21] is the main component of organic matter and notably influences aggregate stability. Related research has indicated that organic matter determines the formation of water-stable aggregates (WSAss) [32], and the properties of the different components of humic substances determine the effects of organic–inorganic complexes on aggregate formation [33], which, in turn, exerts different impacts on the aggregate stability. For instance, studies have shown that the total HA amount in soil organic matter plays an irreplaceable role in the formation of large aggregates [34]. The higher the molecular weight of soil HA is, the more stable the aggregates formed via cementation are [35]. Furthermore, the smaller the aggregates are, the greater their stability, which probably occurs because humic substances play a key role in the stabilization of microaggregates, and the action mechanism of humic substances in aggregates of different sizes may also vary [36]. However, in studies related to soil aggregate stability, little attention has been paid to the effects of changes in humus composition and its interactions with soil aggregates of different particle sizes.
Soil and vegetation as an organic whole have a complex relationship of interdependence and interaction [37]. According to research, different vegetation succession stages and restoration durations yield distinct effects on soil properties [7,38,39]. In the revegetation process, the organic matter produced by plant litter, root decay, and root exudates improves the physicochemical properties of soil to varying degrees and increases soil structural stability [40,41]. In addition, organic matter can improve the biological properties of the soil surface and deep soil layers and provide essential nutrients for vegetation growth [42]. At the initial vegetation recovery stages, soil factors impose a constraining effect on vegetation recovery, which determines not only the rate but also the direction of plant community succession [43]. With revegetation, soil humus composition and aggregate stability are accordingly affected [44]. The structure of karst soils is easily disrupted by anthropogenic disturbance; however, the mechanism of humus accumulation and aggregate formation is not clear. Assuming that humus formation is conducive to promoting karst soil aggregate stability, measures of vegetation restoration can be applied in rocky desertification regions. Nevertheless, there is a lack of relevant research in this area, and the quantity, cementation ability, and main influencing factors of each humus component remain unclear.
Thus, based on soils at different vegetation restoration stages (abandoned land: AL, grassland: GL, shrub rangeland: SR, shrubland: SL, and secondary forest: SF) in karst regions, the objectives of this study were to investigate (i) the effects of vegetation restoration on the soil physical and chemical properties in the karst region; (ii) the impacts of vegetation restoration on soil aggregate stability in the karst region; and (iii) the influence of vegetation restoration on soil humus components in the karst region and discover the changes in humus components at the different vegetation recovery stages and their response mechanisms to aggregate stability.

2. Materials and Methods
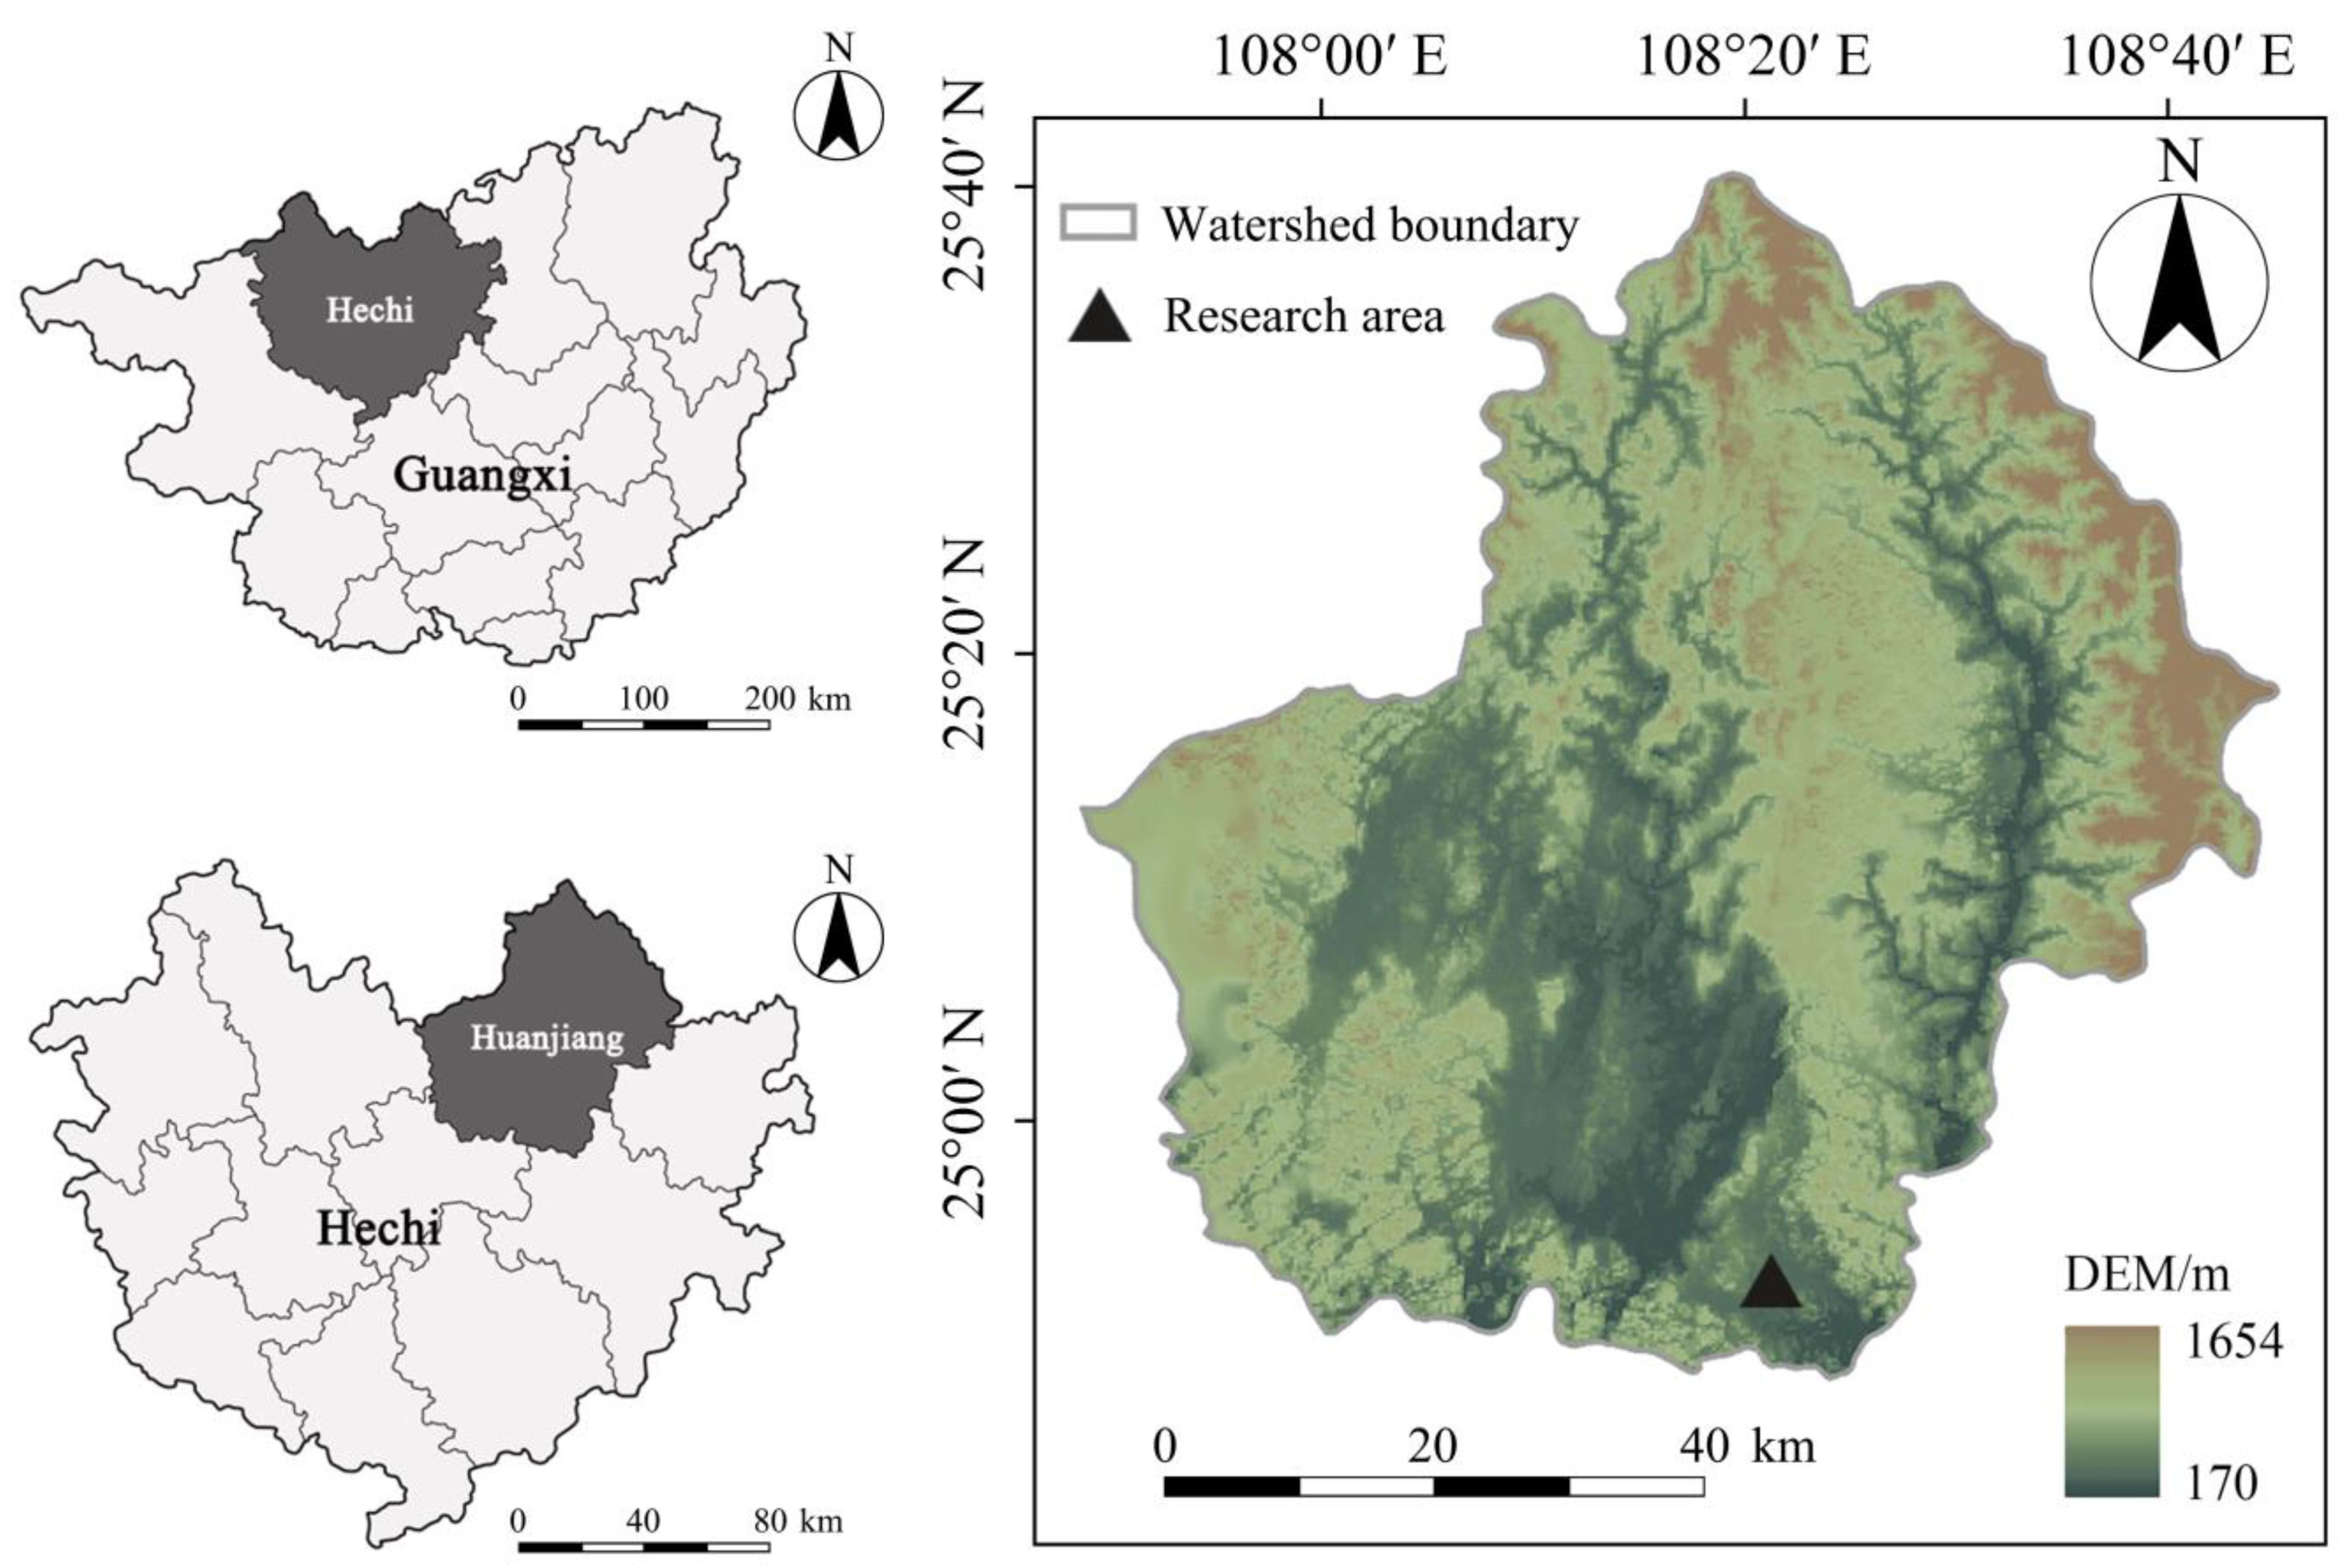
2.1. Research Area

The research area is located in a typical karst area in Huanjiang County, Guangxi Zhuang Autonomous Region (24°44′–25°33′ N, 107°51′–108°43′ E) (Figure 1), which has a southern subtropical monsoon climate, with rain and heat in the same season, and the average annual temperature varies between 16.5 °C and 20.5 °C. The annual number of sunshine hours is the highest in July and the annual sunshine rate is the highest in September. The average annual rainfall is 1389.1 mm and there is an average of 130–140 rainfall days annually. The rainy season is normally from April to September and the dry season is normally from October to March of the following year, which makes the area prone to seasonal drought and waterlogging. The terrain fluctuates greatly in the research area; the highest altitude is 816 m and the lowest altitude is 375 m. The soil-forming parent material in the research area is carbonate rock, and the developed soil is mainly calcareous lithosol (limestone soil), according to the FAO/UNESCO classification system. The interface between the soil and bedrock is clear, lacks a transition layer, and has poor cohesion and continuity; the soil layer is shallow and the bedrock is more exposed, with an average bare rock rate of 31.5%.

2.2. Sample Collection

Based on visual observations including size, height, morphology, and other structural characteristics of plants, GL, SR, SL, and SF were selected as the four successional vegetation restoration stages in this karst region, and AL was selected as the control (Table 1). The different vegetation restoration stages were preceded by a long history of cultivation, with AL being retired in 2012, GL in 1987, SR in 1973, SL in 1966, and SF around 1955, all of which were left undisturbed. To avoid the influence of different slope positions on the research results, three standard 20 m × 20 m quadrats were set up in each vegetation type plot (arranged according to upper, middle, and lower slopes) for a total of 15 quadrats. There were 3 sampling points in each quadrat. Soil quality degradation in the karstic desertification region of Guangxi is mainly manifested in the 10–40 cm soil layer. Due to the shallow soil in the research area, undisturbed soil samples and ring knife soil samples were collected from the surface layer (0–20 cm) and subsurface layer (20–40 cm) after surface litter removal at the sampling sites. The soil samples obtained at 3 points within the same soil layer were mixed, placed in a square aluminum box, and transported to a laboratory for natural drying. Soil samples of the same layer were taken from 3 sampling points in the same quadrats and mixed well and then the samples were divided into 2/4 ratios for soil physico-chemical analyses.

2.3. Sample Determination

2.3.1. Determination of Soil Physical and Chemical Properties

The basic physical and chemical properties were determined via conventional methods. The pH was measured via the electrode method. The soil mechanical composition was determined via the pipette method, dividing soil into three levels according to the American standard: sand (0.05–2 mm), silt (0.002–0.05 mm), and clay (<0.002 mm). The soil bulk density and porosity were determined via the ring knife method [45]. The soil organic matter content was determined via the potassium dichromate external heating method [46].
Soil aggregate stability was determined by the Le Bissonnais (LB) method [47]. We selected 3–5 mm aggregates by the dry sieving method and dried them in an oven at 40 °C to a constant weight. This unified the initial water content of the aggregate samples. Three treatments, fast wetting (FW), slow wetting (SW), and wetting stirring (WS) were used, respectively. The treated soil aggregates were passed through sieve sets that had been soaked in ethanol (with sieve holes of 2, 1, 0.5, 0.25, 0.1, and 0.05 mm, in descending order) and collected, dried, and weighed to determine the indicators relating to their stability.

2.3.2. Extraction and Determination of Humus Components

The Pallo method was used for grouping [48]. Humic acid and humins in the residue were firstly separated using H3PO4, Na4P2O7, and NaOH under oscillation and centrifugation treatments, and HM was then further divided into iron-bound HM (Hmi), clay-bound HM (HMc), and insoluble HM (HMr) components via treatments with acidic and alkaline solutions.

2.3.3. Data Processing and Analysis

(1) Mean weight diameter of aggregates (MWD, mm). The formula is shown in Equation (1) [49].
M W D = i = 1 n x i w i
where xi is the average diameter of the soil of any particle size range (mm) and wi is the percentage of aggregates at the ith particle size (%).
(2) Percentage of aggregate destruction (PAD, %). The calculation formula is shown in Equation (2) [50].
P A D = D R > 0.25 W R > 0.25 D R > 0.25 × 100 %
where DR>0.25 is the proportion of air-dried aggregates > 0.25 mm (%) and WR>0.25 is the proportion of water-stable aggregates > 0.25 mm (%).
(3) Relative slaking index (RSI, %) and relative mechanical breakdown index (RMI, %). The calculation formulas are shown in Equations (3) and (4) [51].
R S I = M W D S W M W D F W M W D S W × 100 %
R M I = M W D S W M W D W S M W D S W × 100 %
where MWDFW, MWDSW, and MWDWS are the mean weight diameters under the fast wetting, slow wetting, and wetting stirring treatments, respectively.
(4) PQ (%), used to characterize the humification degree of organic matter, with a larger value indicating a higher degree of humification. The calculation formula is shown in Equation (5) [52,53].
P Q = H A ( H A + F A ) × 100 %
Since the FA content is indirectly calculated from the total carbon content of HA and FA, this may lead to an increase in the variation of HA/FA that does not truly reflect the humification of organic matter. Therefore, PQ is used as an indicator of the humification of organic matter.
(5) HMi/HMc was defined as the I/C ratio and used to compare the characteristic differences in HMi and HMc contents; (HMi + HMc)/HM was defined as the soluble HM ratio and used to compare the differences between the contents of soluble and insoluble components in HM.

2.3.4. Statistical Analysis

Data were analyzed using Excel 2019 and SPSS 19.0. The significance of differences was analyzed using one-way ANOVA and the Duncan method. The Pearson method was applied in correlation analyses and graphing in the text was performed by Origin 2021.

3. Results and Analysis

3.1. Basic Soil Physical and Chemical Properties

As indicated in Table 2, the soil pH ranged from 6.09 to 6.91 at all vegetation restoration stages, indicating that the soil was slightly acidic or neutral. The pH tended to decrease with vegetation recovery. The pH in the 0–20 cm soil layer was lower than that in the 20–40 cm soil layer at all the vegetation restoration stages, and the pH in the SR was significantly higher than in the other stages. With positive vegetation succession, the proportion of the soil sand content showed an increasing–decreasing trend as follows: AL (24.80%) > SL (24.51%) > SF (17.45%) > SR (16.32%) > GL (14.88%). The powder content also showed an increasing–decreasing trend as follows: SR (59.99%) > GL (59.77%) > SF (50.38%) > AL (48.19%) > SL (41.76%). The mucilage content showed a decreasing–increasing trend as follows: SL (33.74%) > SF (32.18%) > AL (27.02%) > GL (25.36%) > SR (23.7%). At all vegetation restoration stages, the clay content in the 20–40 cm soil layer was clearly greater than that in the 0–20 cm soil layer. In subtropical regions, due to the large amount and high intensity of rainfall, the soil generally exhibited a high clay content in the lower profile due to the dynamic action of water. In the 0–20 cm soil layer, the soil bulk density at different vegetation restoration stages was ranked in the order of AL > GL > SR > SL > SF, and there were significant differences between the AL, GL, and SF. In the 20–40 cm soil layer, the soil bulk density was ranked in the order of GL > AL > SR > SL > SF, and the densities in the AL, GL, and SR were significantly higher than those in the SL and SF. The soil bulk density under different vegetation restoration showed an increasing trend with increasing soil depth, which indicated that the effect of vegetation on reducing the density of the top soil layer was more obvious. The highest soil bulk density was found in GL, whereas the soil bulk density in SF was the lowest, indicating that the soil in forestland was relatively loose, and vegetation restoration could reduce the soil bulk density.

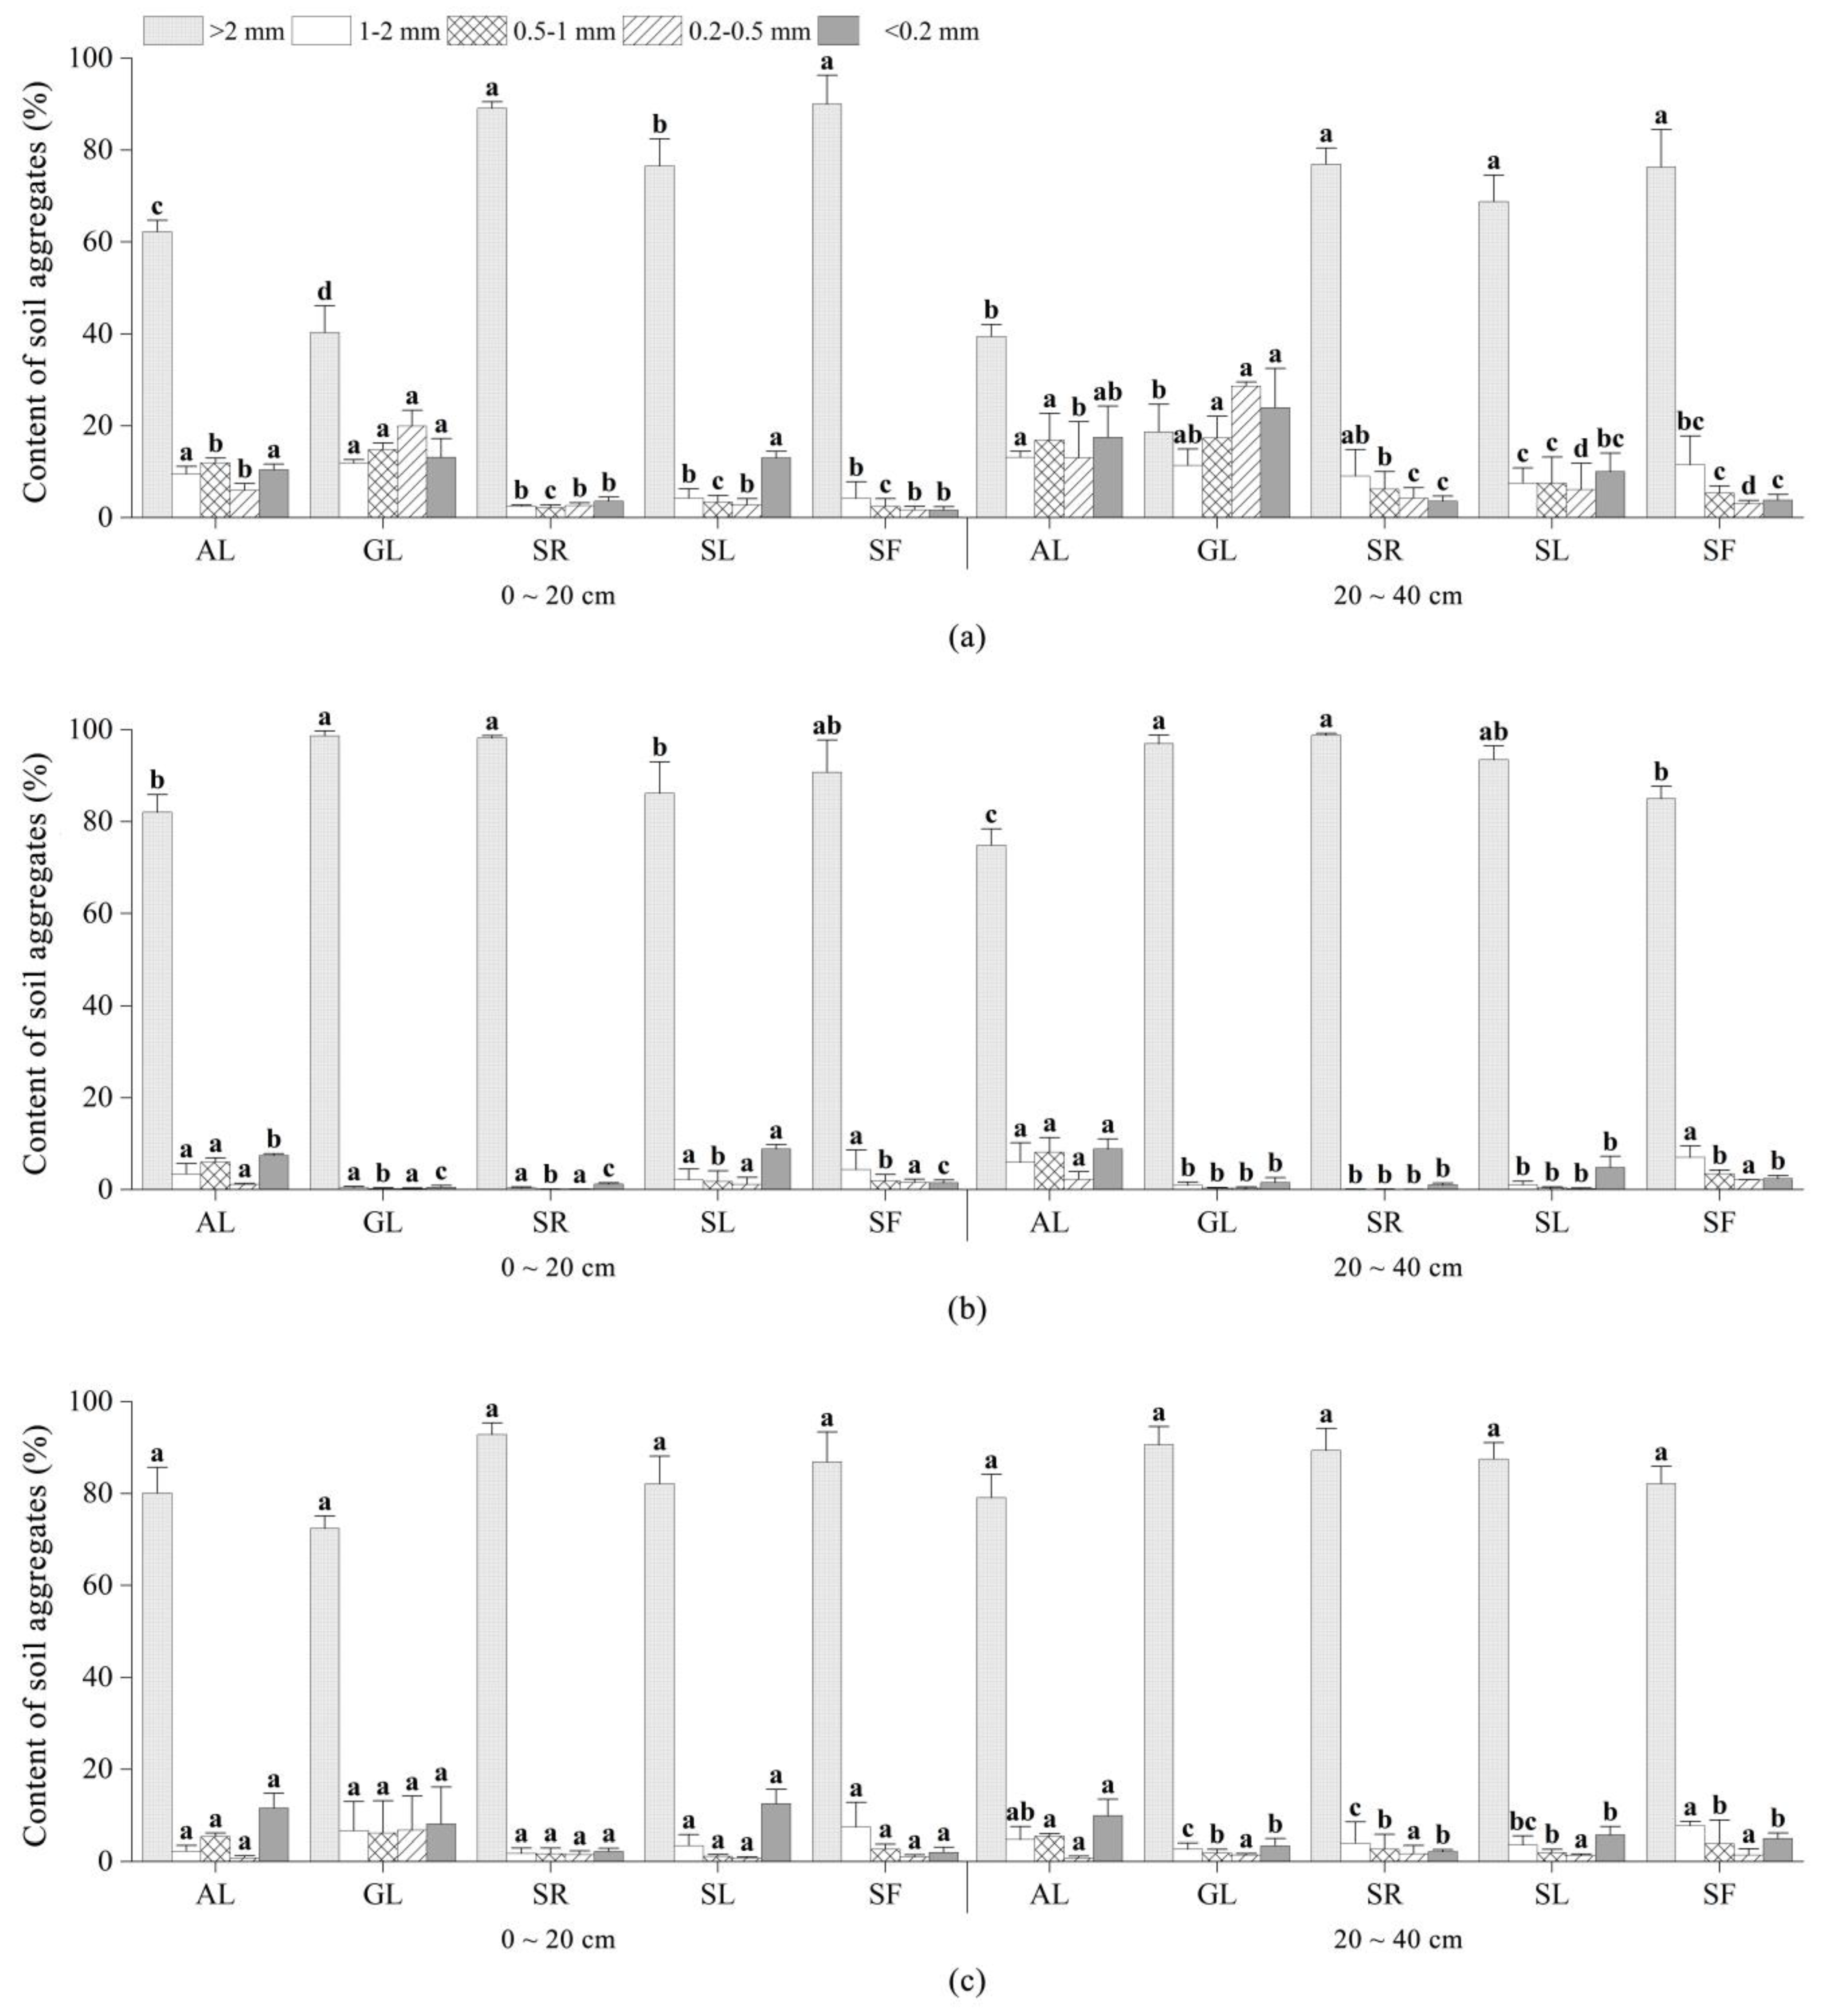
3.2. Distribution and Stability Characteristics of Soil Aggregates

Figure 2 indicates that the content of soil WSAss at the different vegetation restoration stages (except the AL) was mainly dominated by a >2 mm particle size. The composition of soil aggregates in each soil layer exhibited a relatively consistent trend. Notably, with decreasing aggregate particle size, the proportion of aggregates indicated a V-shaped change trend, firstly decreasing and then increasing.
Combining Figure 2 and Table 3, it can be determined that with vegetation recovery, the larger the MWD was, the more stable the soil aggregates were [52]. The lower the PAD was, the larger the WSAs were and the more stable the soil structure was. The MWD in the SF was the largest, followed by the SL, SR, and GL, and it was the smallest in the AL; in both soil layers, the MWD in the AL was significantly smaller than that under the other four vegetation types. The content of WSAs ranged from 70.89% to 90.45% at the different vegetation restoration stages, exhibiting a significantly higher trend. The PAD ranged from 7.19% to 22.58%, indicating a decreasing trend. Considering both soil layers, the content of WSAs was higher in the 0–20 cm layer than in the 20–40 cm layer, while the opposite was true for the PAD, indicating that the aggregate stability in the 0–20 cm soil layer was higher than that in the lower layer (20–40 cm). In general, aggregate stability gradually improved and stabilized.

3.3. Stability Characteristics of the Aggregates under Different Crushing Mechanisms

The LB method can more comprehensively reflect soil aggregate stability under different wetting conditions, and FW, SW, and WS correspond to three aggregate fragmentation mechanisms (heavy rain, light rain, and mechanical disturbance, respectively) (Figure 3). Considering all three mechanisms, soil aggregates were dominated by >2 mm aggregates at all recovery stages. After treatment, the content of >2 mm aggregates followed the order of SW > WS > FW, indicating that soil aggregates were the most sensitive to air pressure, followed by mechanical disturbance, and they were the least damaged by the uneven swelling of clay particles under heavy rainfall or flooding conditions at the different vegetation restoration stages.
As can be seen from Table 4, under the FW, SW, and WS treatments, soil aggregates were at a more stable or very stable level at all vegetation restoration stages, except for the GL soil aggregates, which were at a stable level from 20 to 40 cm [46]. Table 4 shows that under different soil layers, the changes in the soil MWD at different vegetation restoration stages were the same, showing that SW > WS > FW. With the deepening of the soil layer, the value of MWD tended to decrease. The results showed that among the three treatments, the soil aggregate stability and erosion resistance of the SW treatment were the strongest, the FW treatment was the weakest, and the WS treatment was between them, and the stability of surface soil was higher than that of subsoil.
The RSI values in grassland, abandoned land, shrub forest, irrigated grassland, and secondary forest were 0.58, 0.27, 0.15, 0.12, and 0.04, respectively. The RMI values demonstrated the order of grassland (0.14), irrigated grassland (0.06), shrubland (0.05), secondary forest (0.03), and abandoned land (0.01). This indicated that the grassland and abandoned land soil aggregates were more sensitive to dissipation and that the grassland and irrigated land soil aggregates were more sensitive to mechanical fragmentation.

3.4. Soil Humus Fraction Characteristics

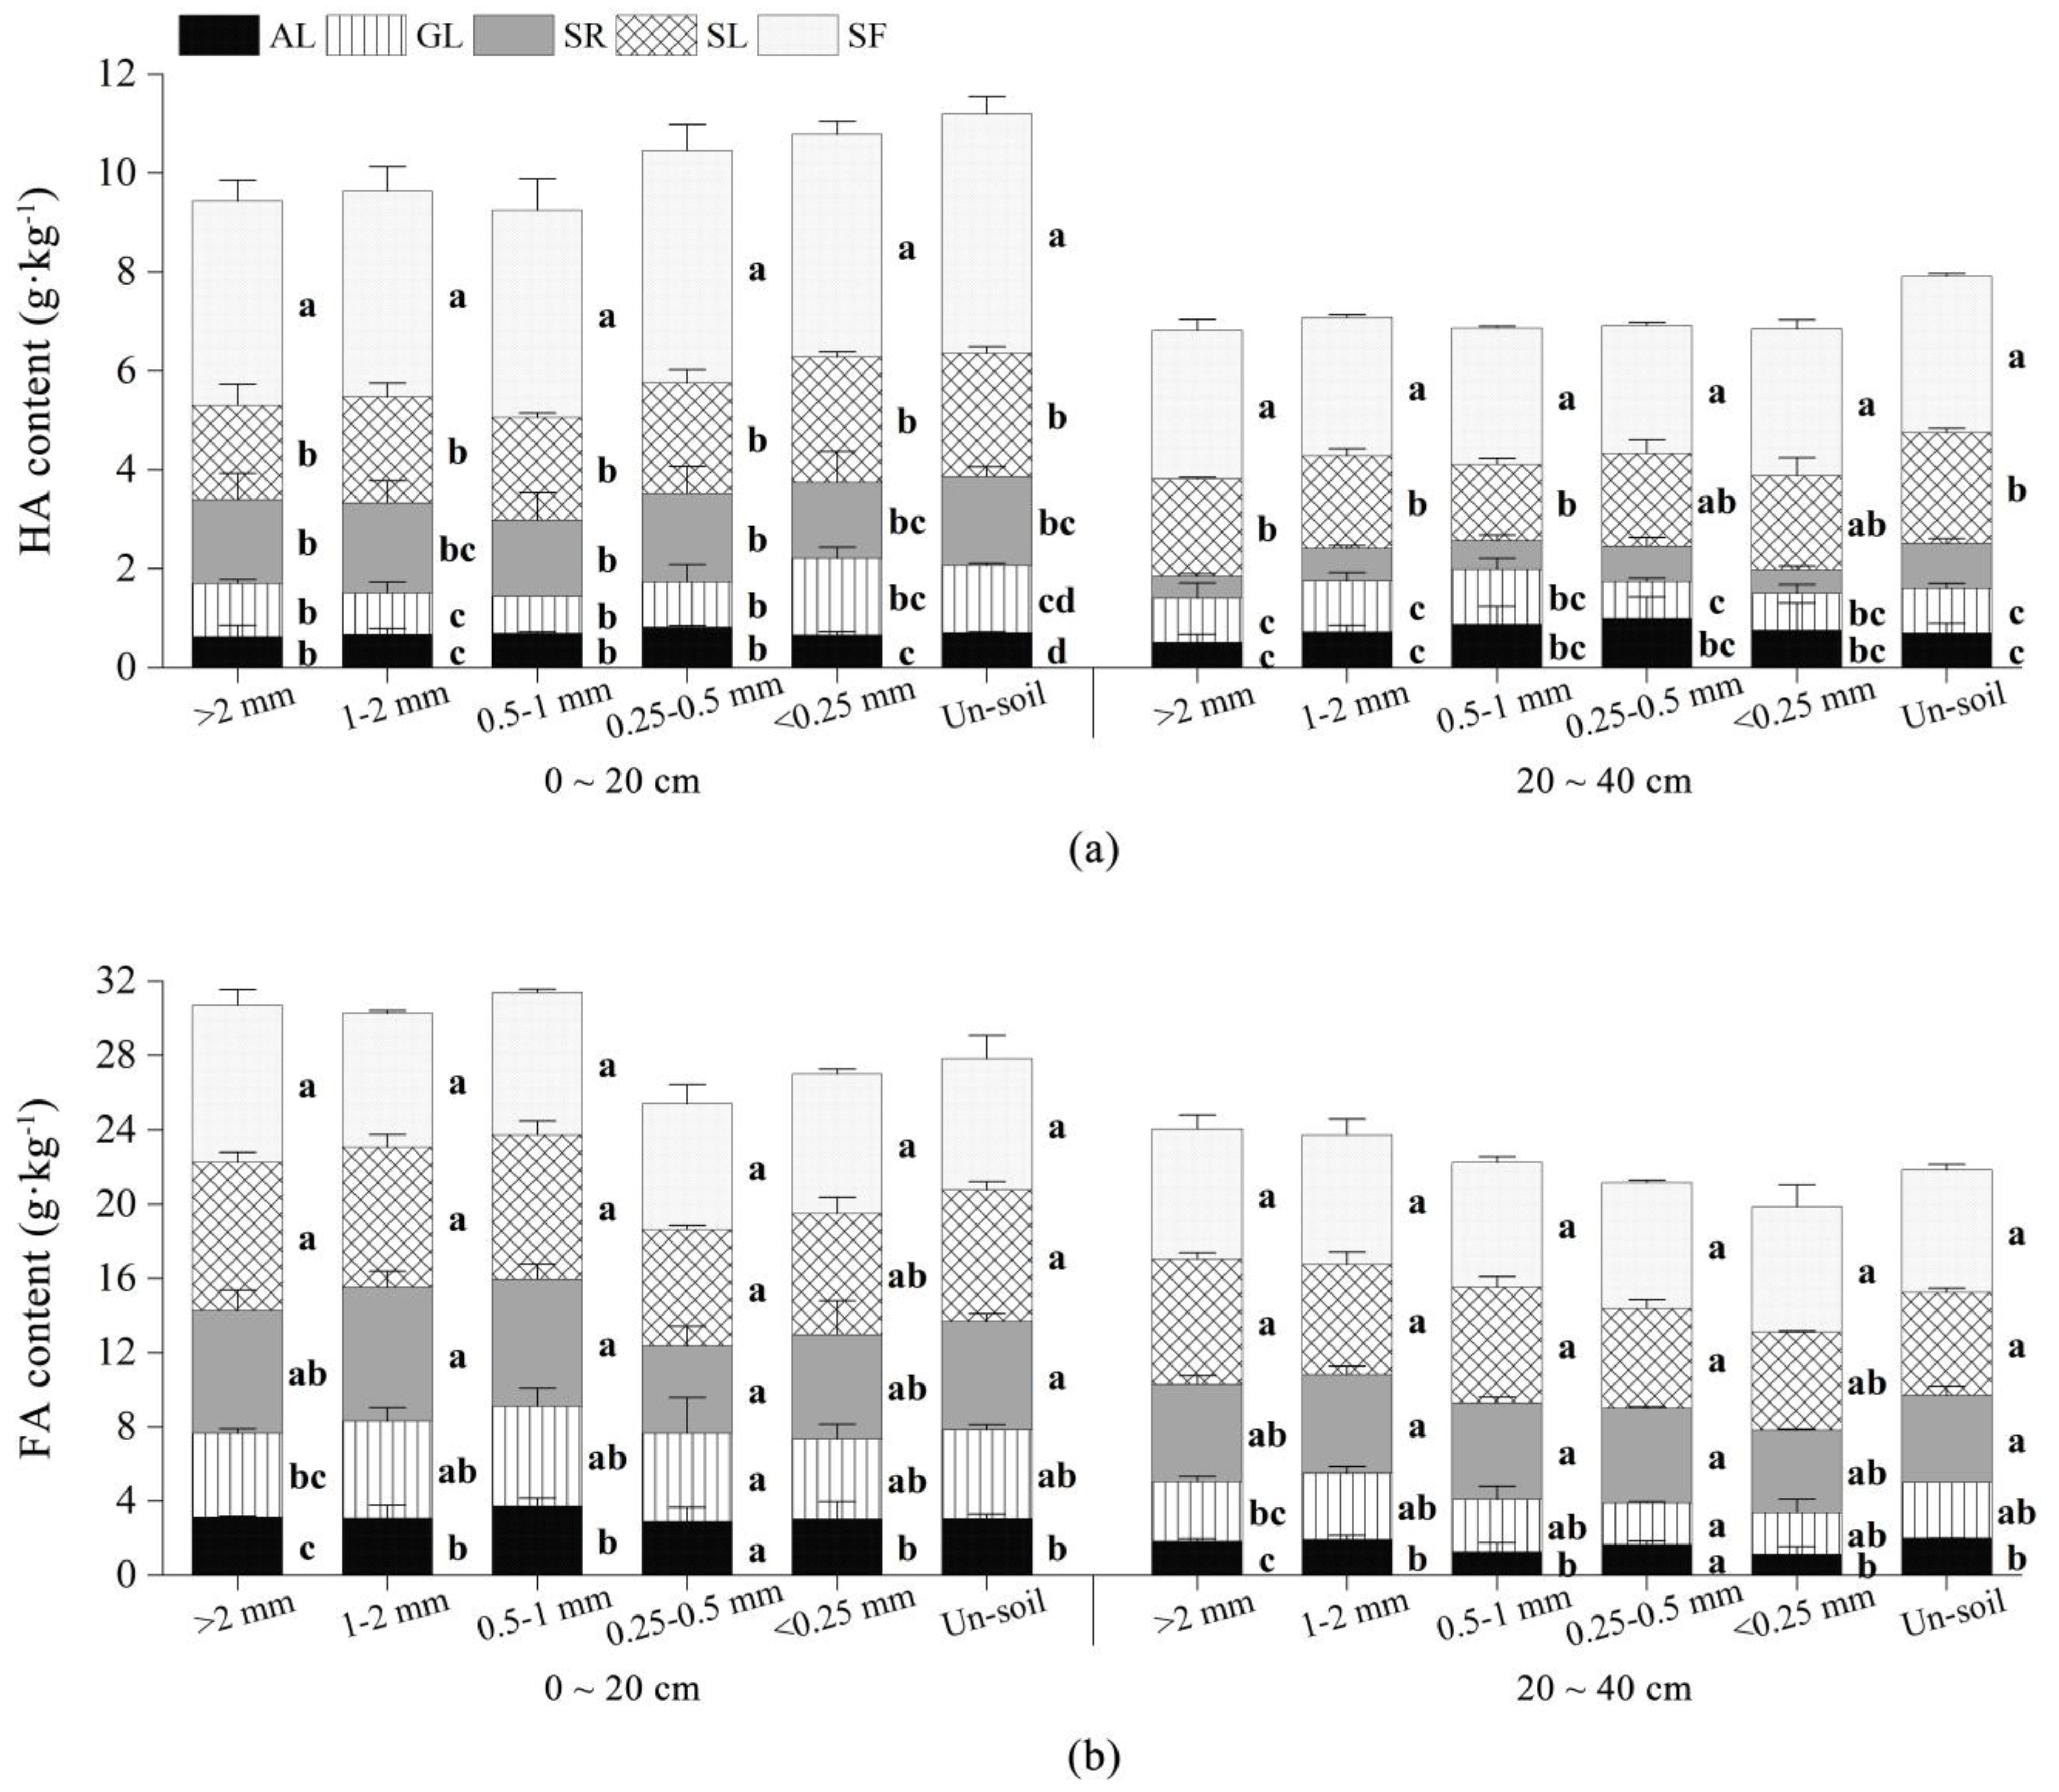
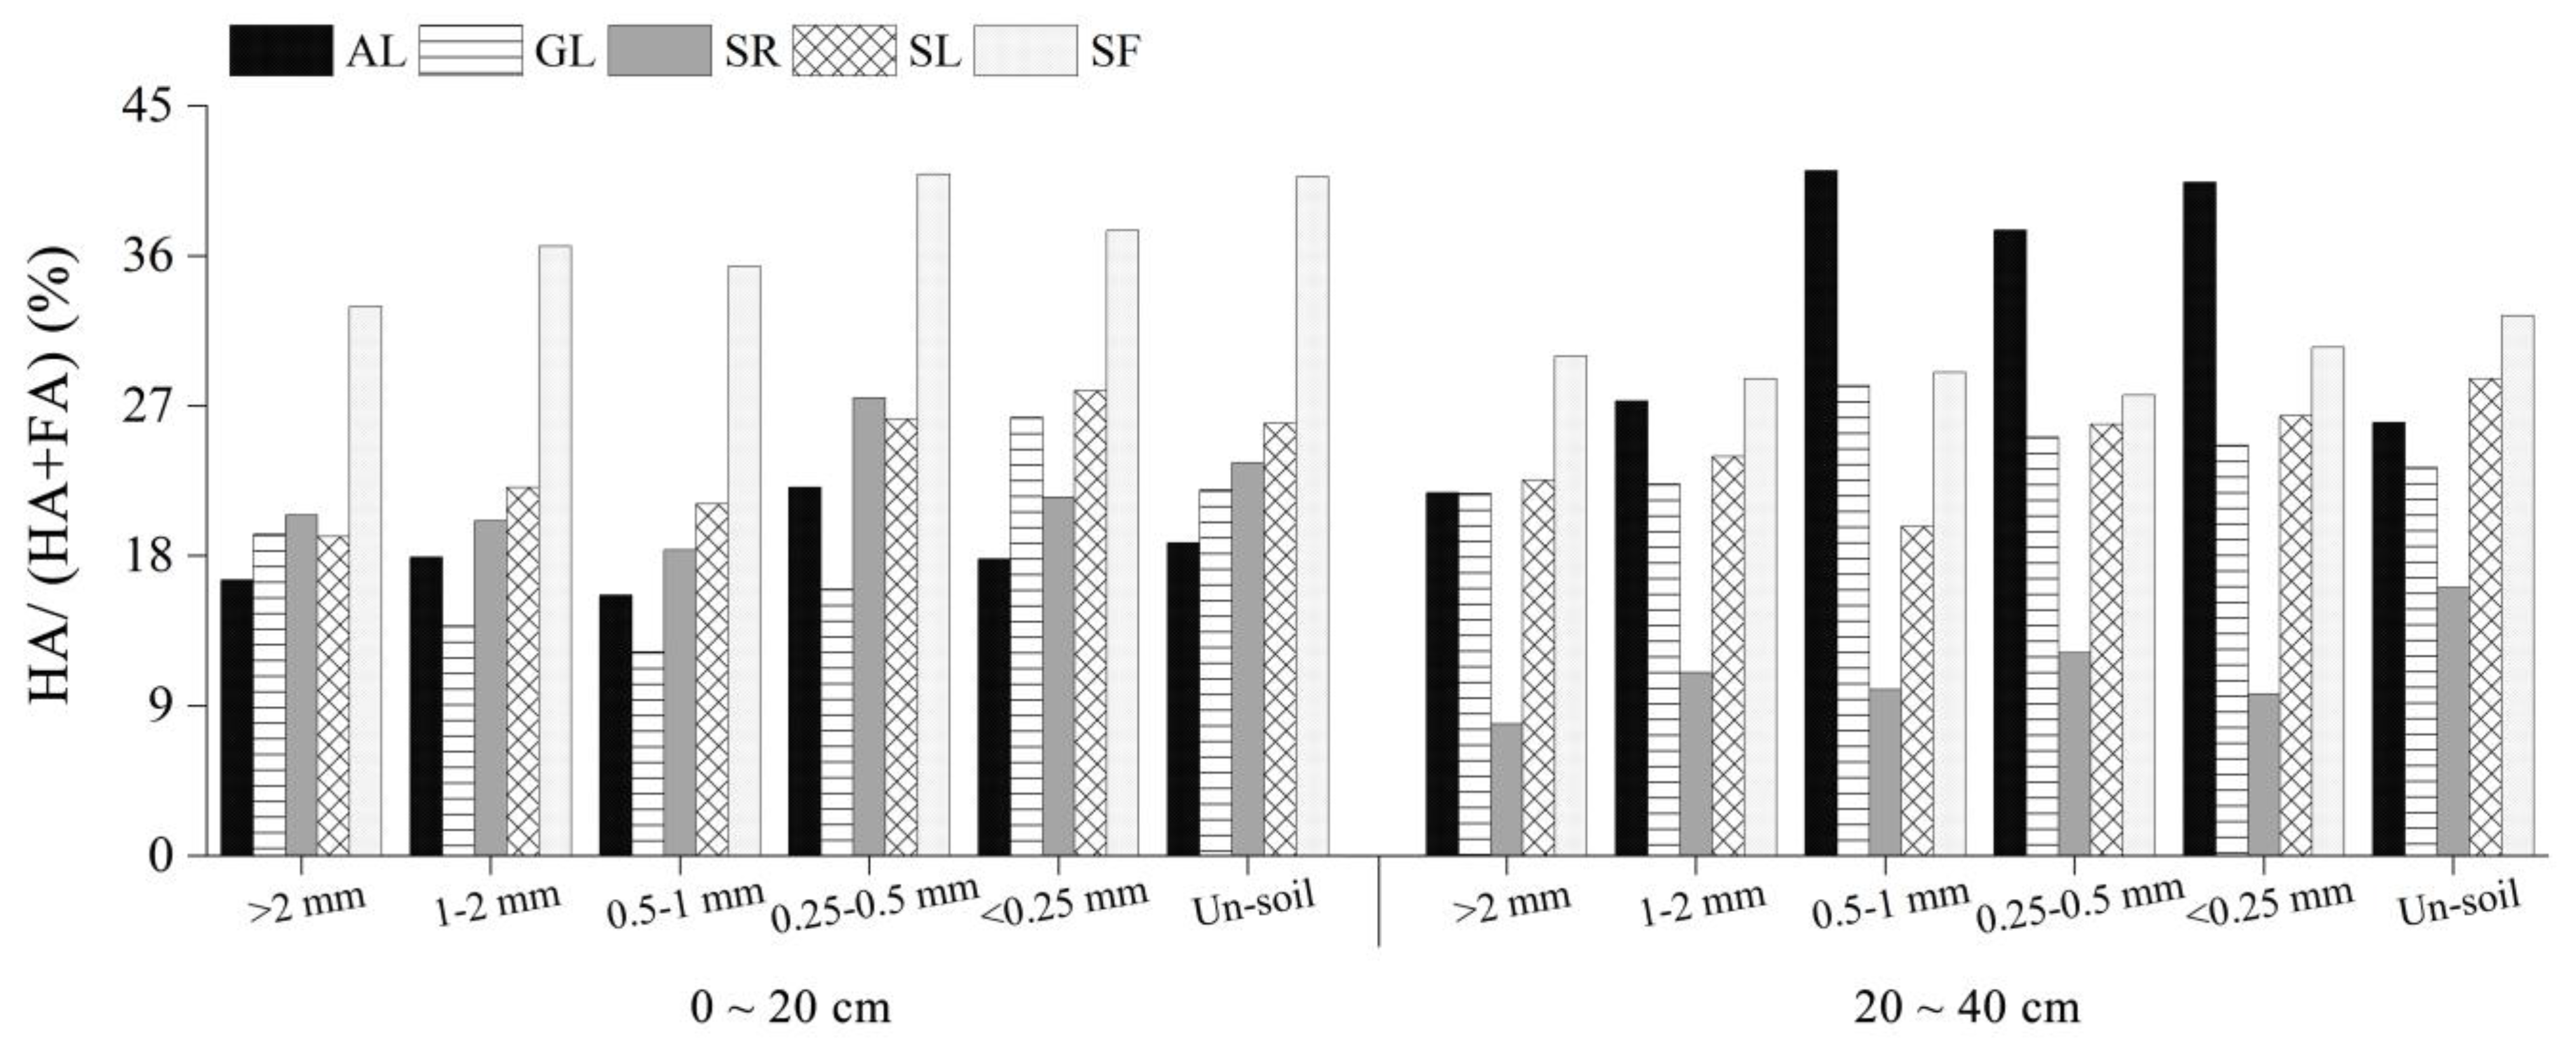
3.4.1. Humic Acid (HA) and Fulvic Acid (FA) Contents and Their Distribution Ratio

Among several humus components, the main ones that are known to have an effect on the structure of aggregates are HA and FA. Figure 4 shows that the HA and FA contents showed a gradual increase from the AL to the SF as the vegetation was restored. With increasing soil depth, the HA and FA contents roughly decreased, with higher proportions in the surface layer (0–20 cm) than in the deeper layer (20–40 cm). In the 20 cm soil layer, compared with the AL, the contents of HA and FA in the GL, SR, SL, and SF soil increased by 90.98%, 155.32%, 252.94%, and 587.78% and 57.27%, 91.44%, 133.09%, and 131.56%, respectively, and the HA content in the SF was significantly higher than that in the other stages. The FA content reached a maximum value at the SL and tended to be stable at the SF. In the 20–40 cm soil layer, with the restoration of vegetation, the HA content increased by 30.17%, 28.57%, 219.57%, and 351.66% and the FA content increased by 50.54%, 135.42%, 179.78%, and 230.88% in the GL, SR, SL, and SF soil, respectively.
There were differences in the distribution of the HA and FA contents in the aggregates of the various grain sizes among the different vegetation restoration stages. HA and FA exhibited no regularity, with a decreasing aggregate size in each soil layer. For example, the HA content in the 0–20 cm layer increased with positive vegetation succession, but there was little difference in particle size in the 20–40 cm layer. At the initial vegetation restoration stage, the FA content in each soil layer in the GL and SR first increased and then decreased, while the SL and SF exhibited a decreasing trend.
Figure 5 reveals that the FA/soil organic carbon (SOC) ratio was generally higher than the HA/SOC ratio in both soil layers, indicating that the soil in the research area is FA-rich soil. With vegetation restoration, the HA distribution ratio exhibited an increasing trend, while the FA distribution ratio exhibited the opposite trend. In the 0–20 cm soil layer, the HA distribution ratio of each particle size at the SF stage was significantly higher than that at the other vegetation restoration stages, while the FA distribution ratio was lower than that at the other restoration stages. In the 20–40 cm soil layer, with vegetation restoration, the HA distribution ratio of the different grain sizes first decreased and then increased. The FA distribution ratio exhibited a decreasing trend, and the range of change was smaller than that in the topsoil layer, which indicated that the FA accumulation rate in the total organic matter in the topsoil layer was higher.

3.4.2. Changes in the Precipitation Quotient (PQ) Value of Soil Aggregates

Figure 6 indicates that the PQ values of the undisturbed soil and aggregates of the different particle sizes increased from the AL to SF with vegetation restoration. The PQ value of the 0–20 cm soil layer ranged from 12.24% to 40.75% and the value of the 20–40 cm soil layer varied between 7.92% and 32.43%. The value at the SF stage was generally the highest (except for the undisturbed soil in the 0–20 cm soil layer, 0.5–1 mm aggregates, and 0.25–0.5 mm aggregates), indicating that positive vegetation succession is beneficial to soil humification.

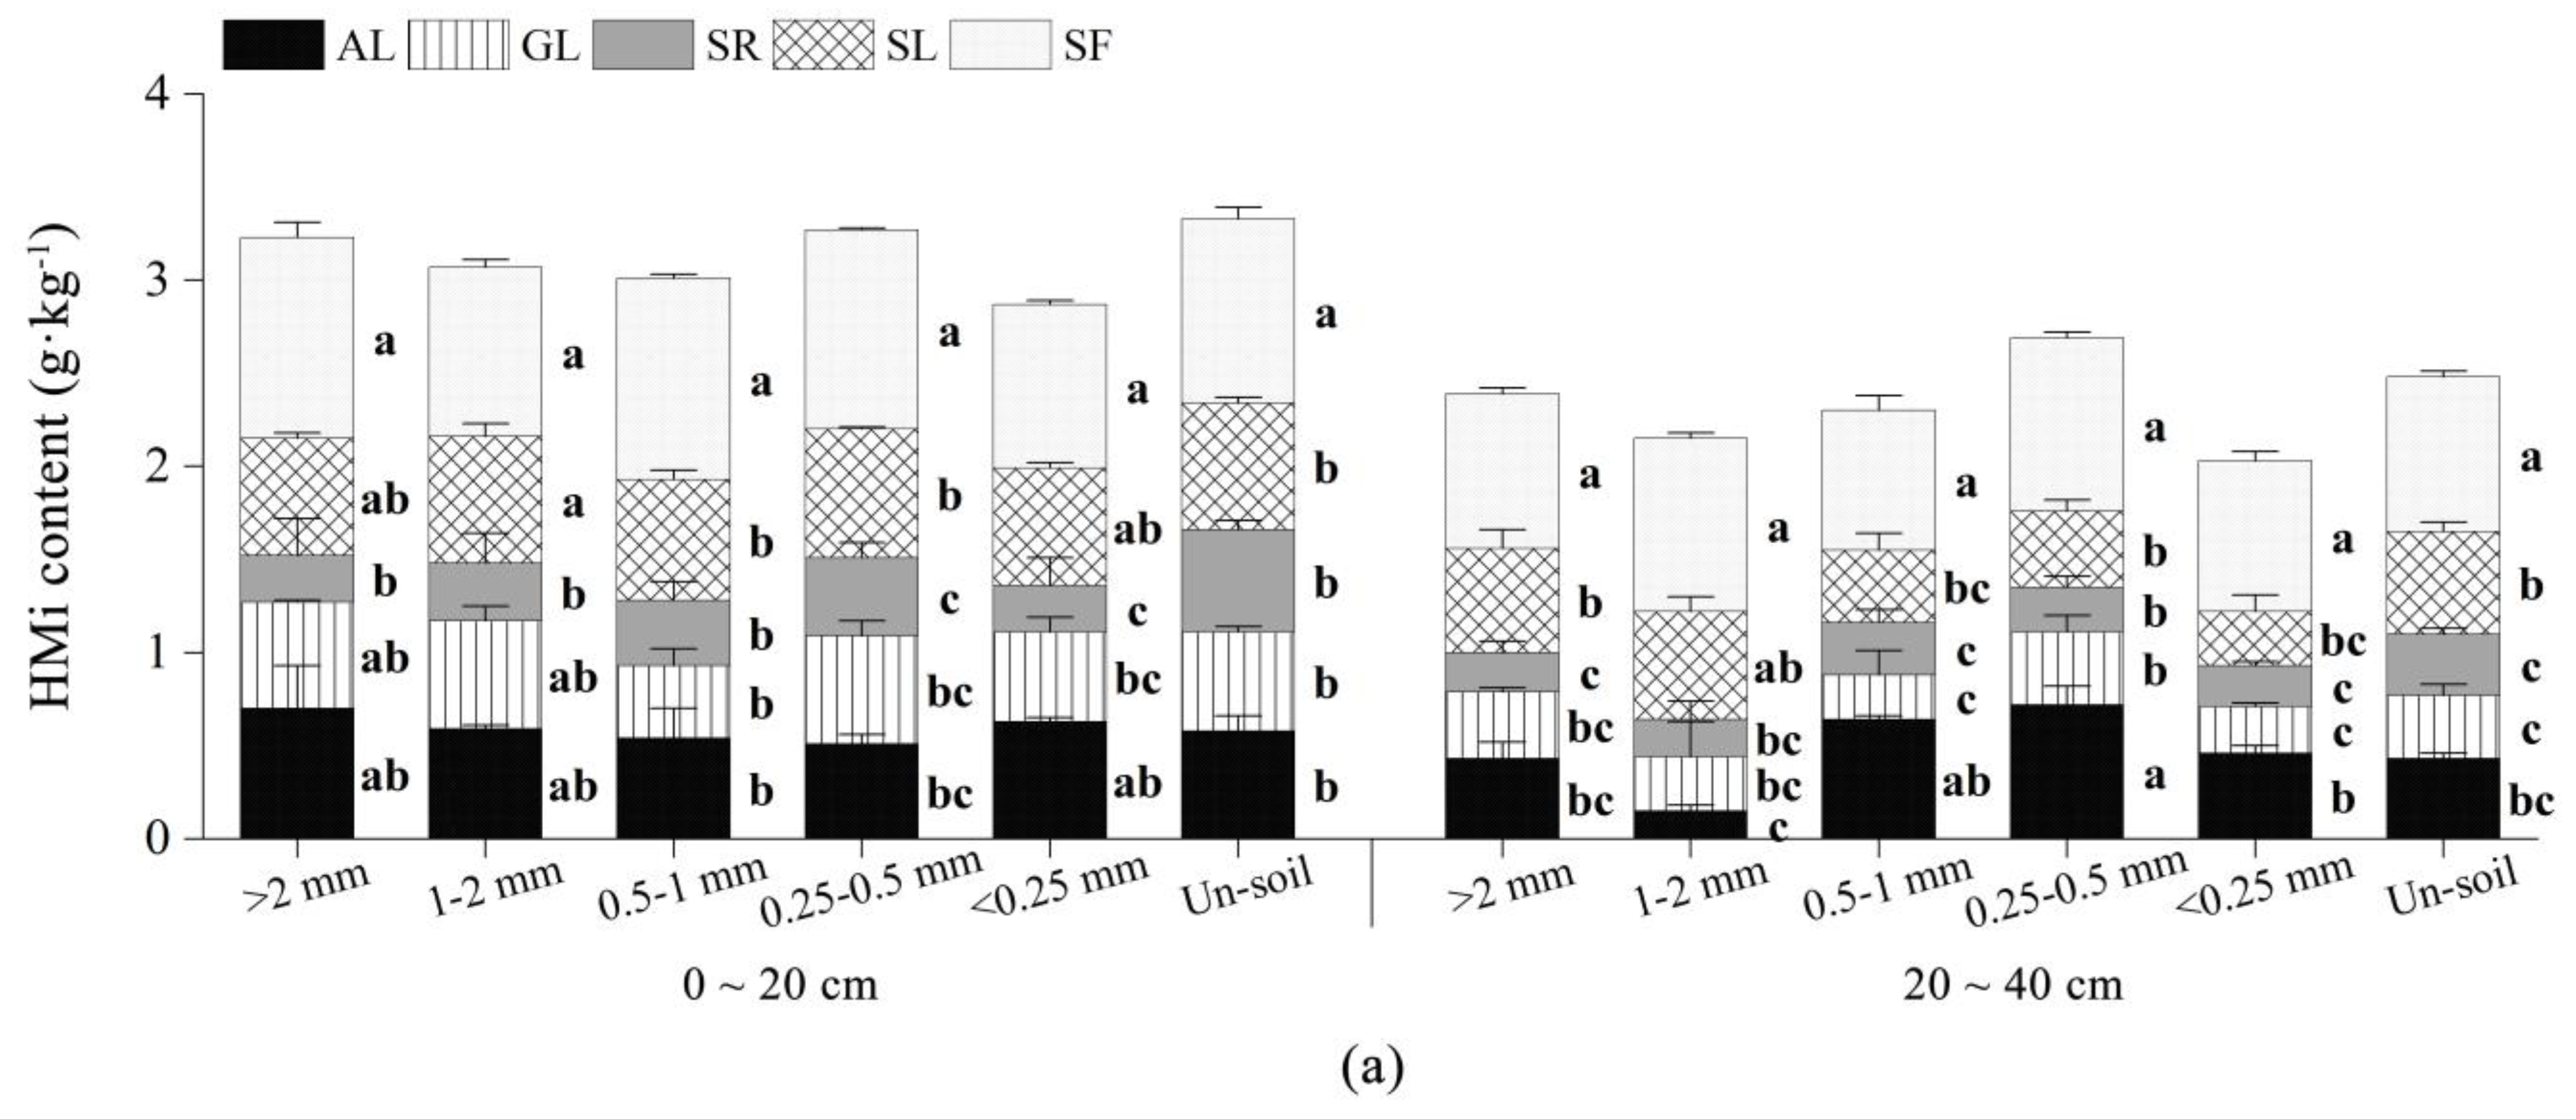
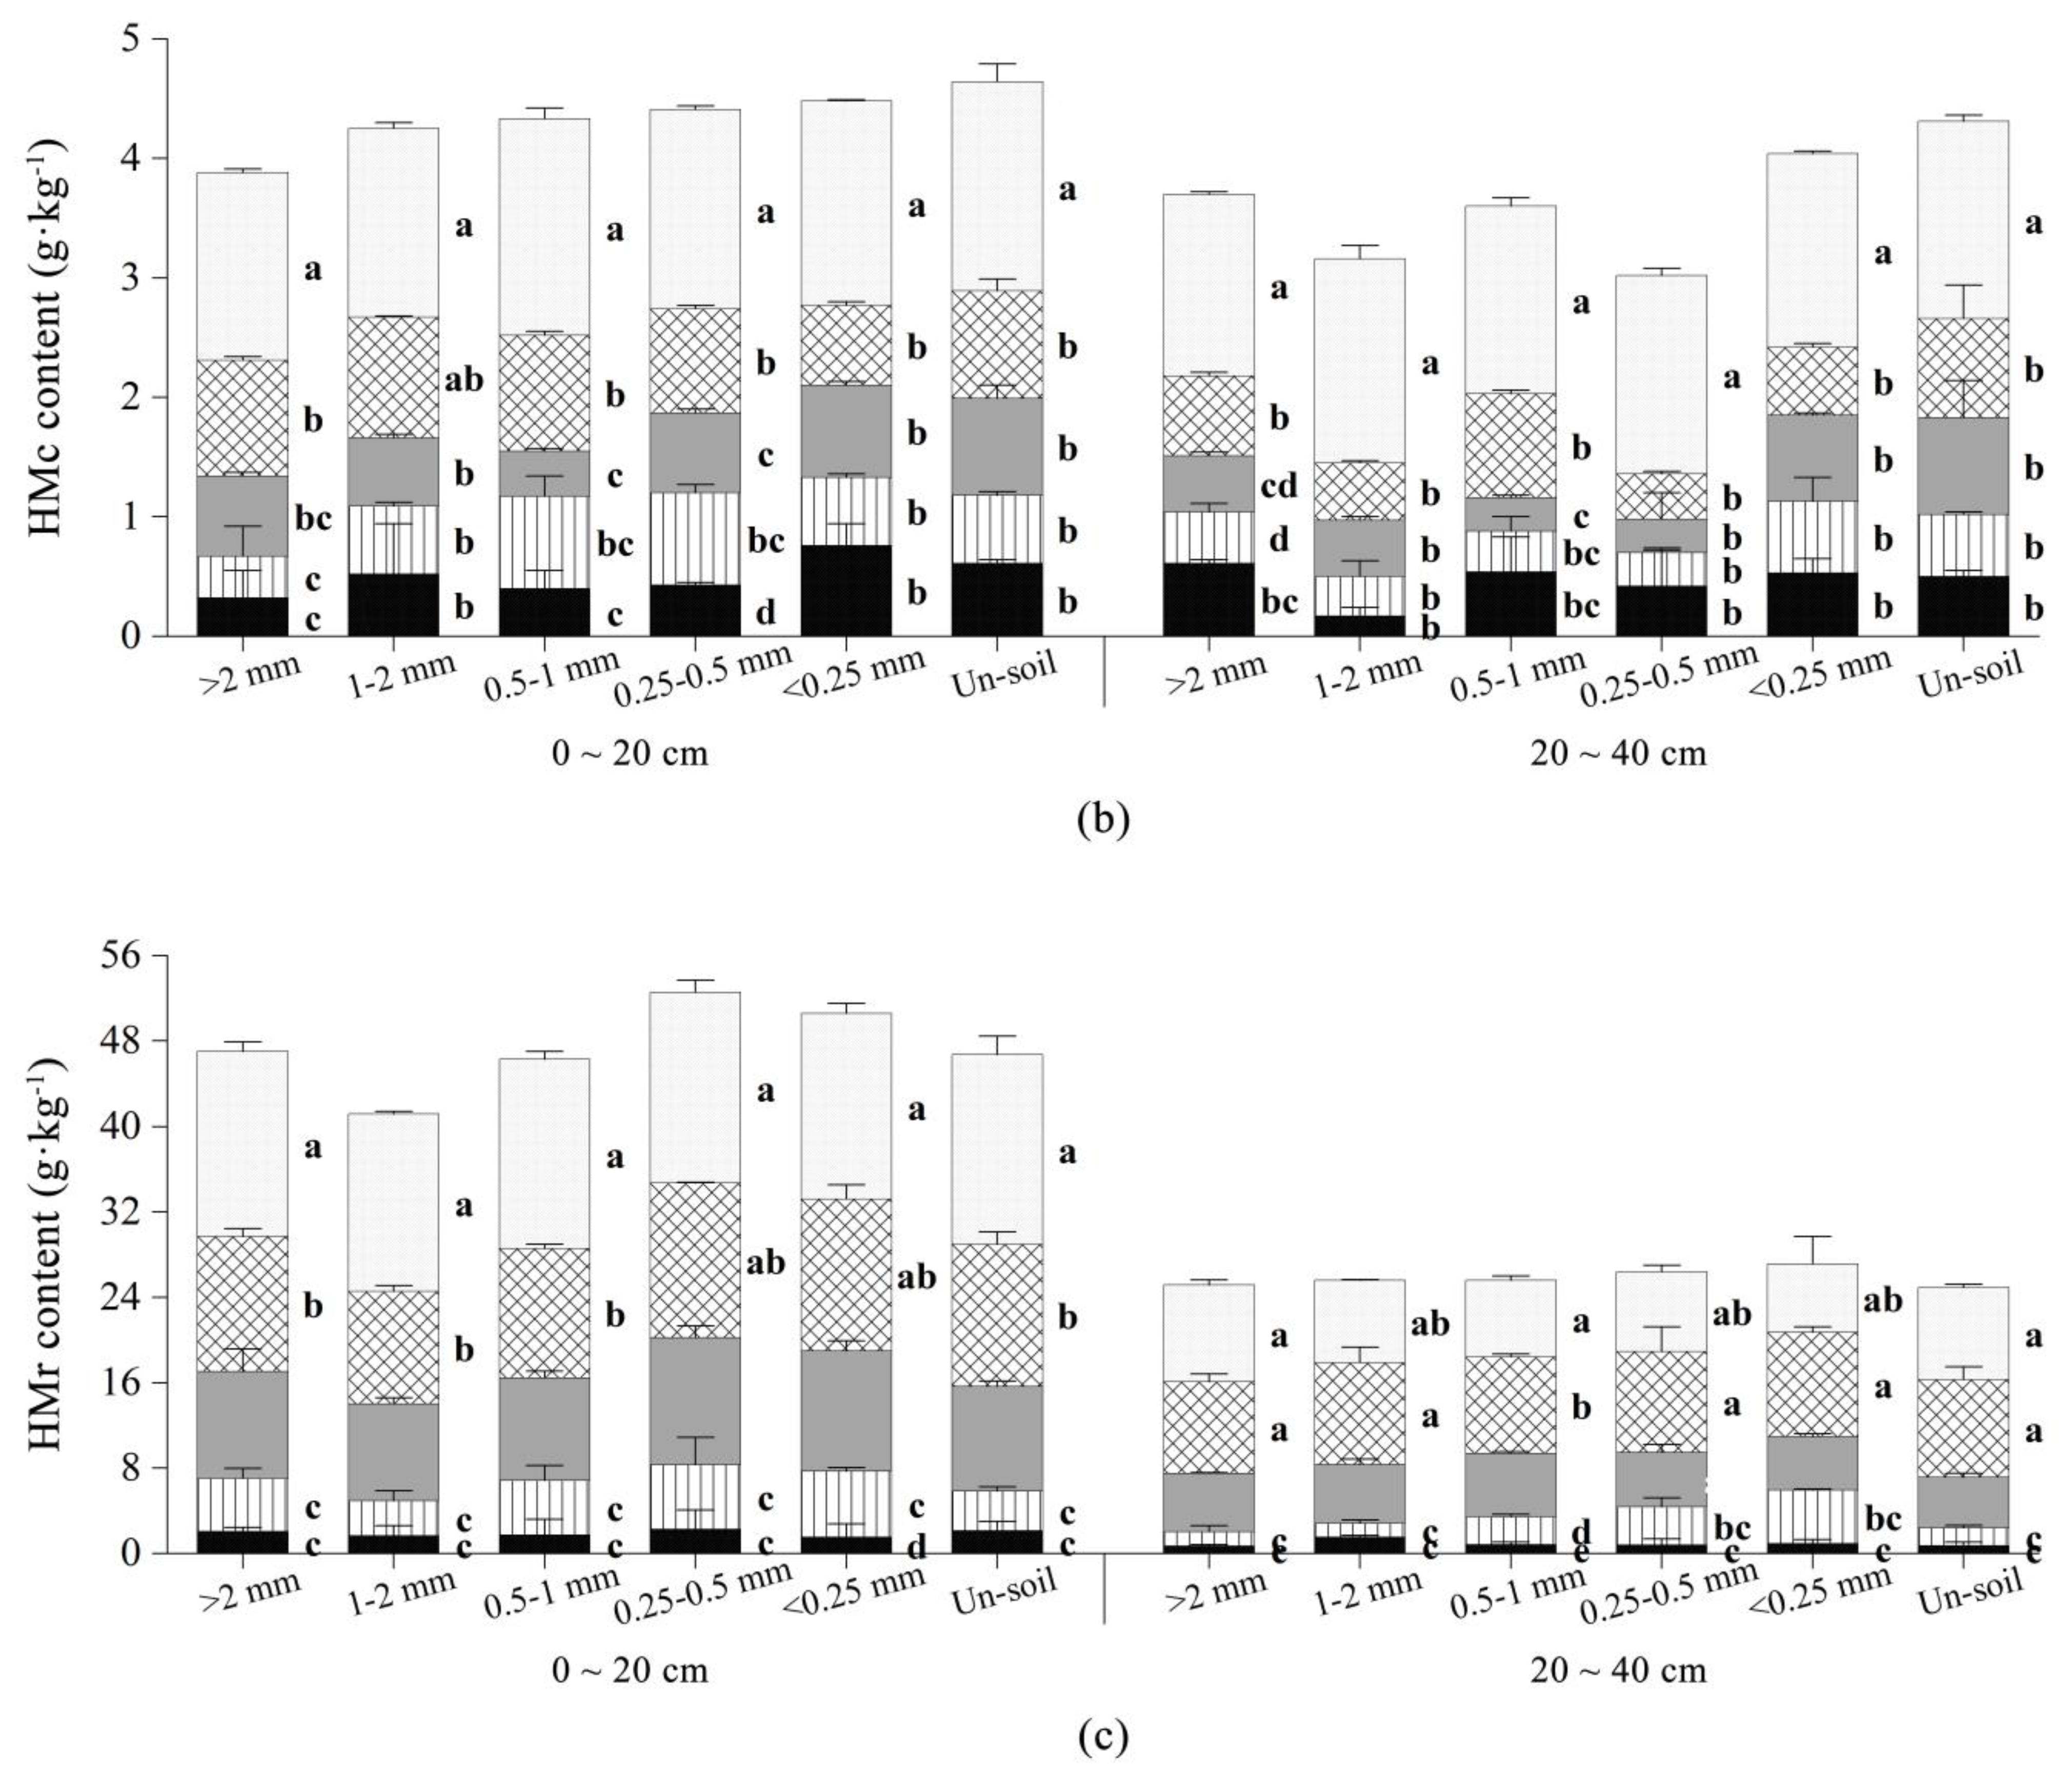
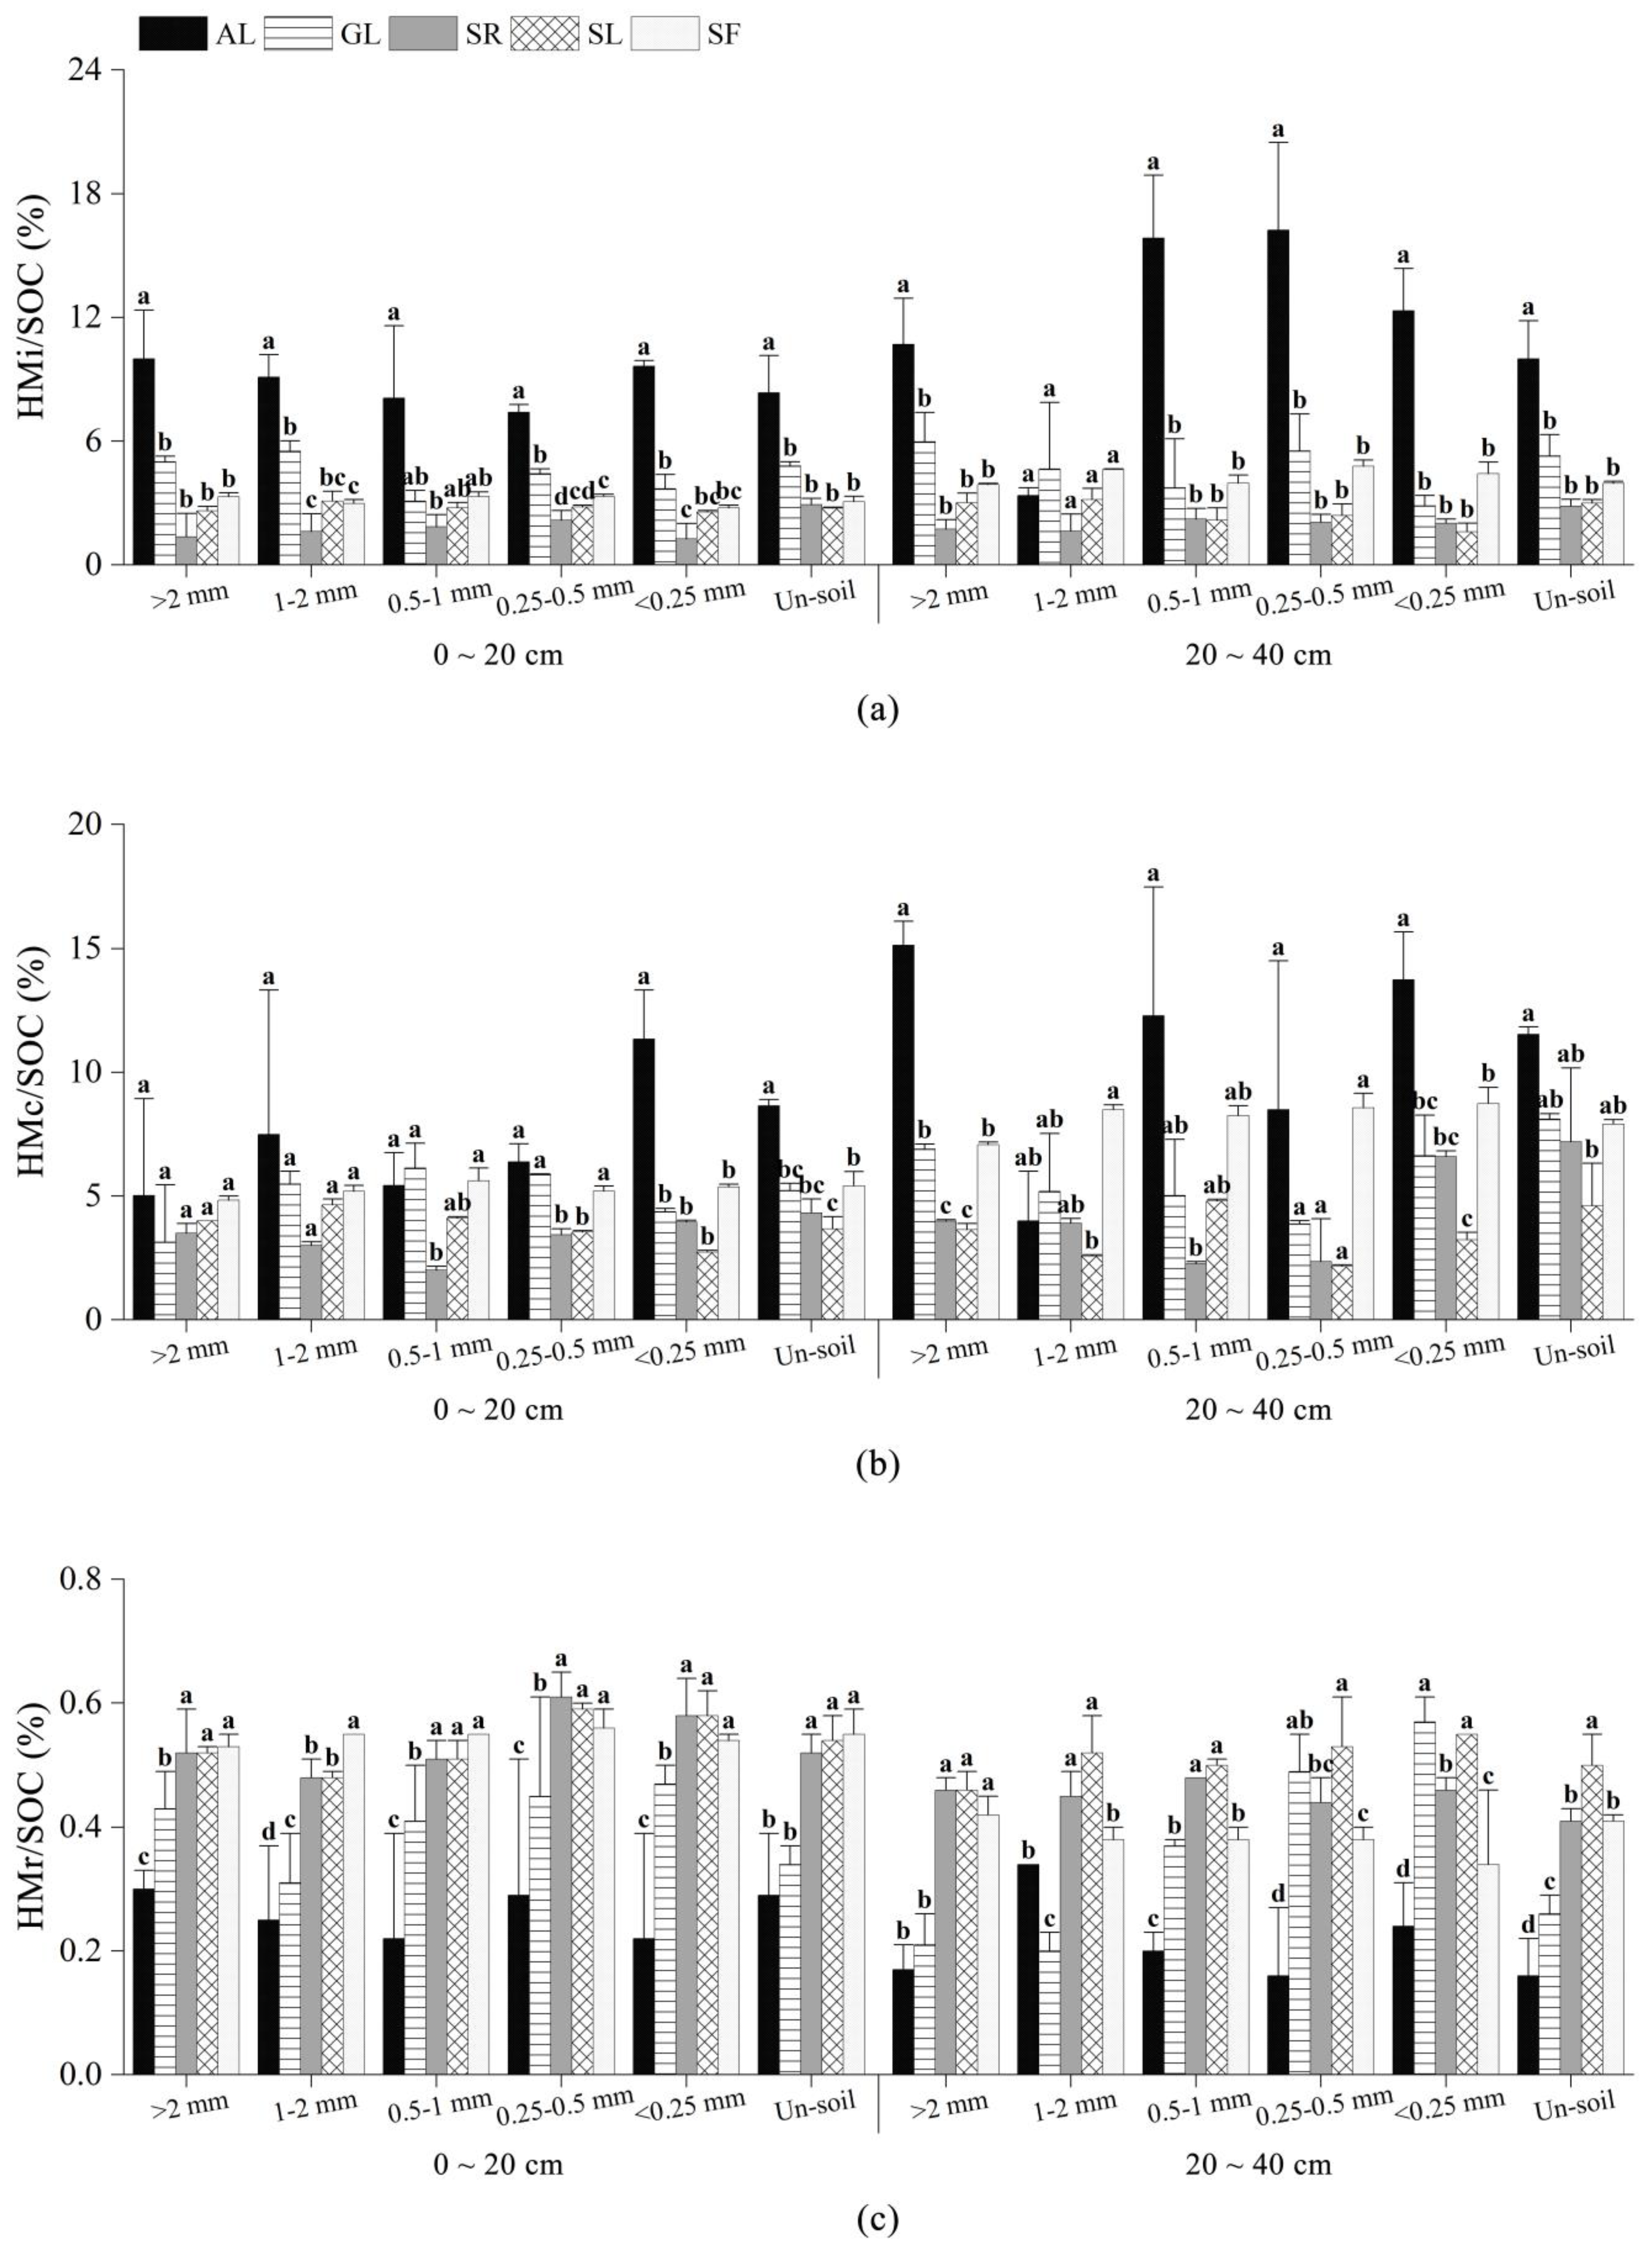
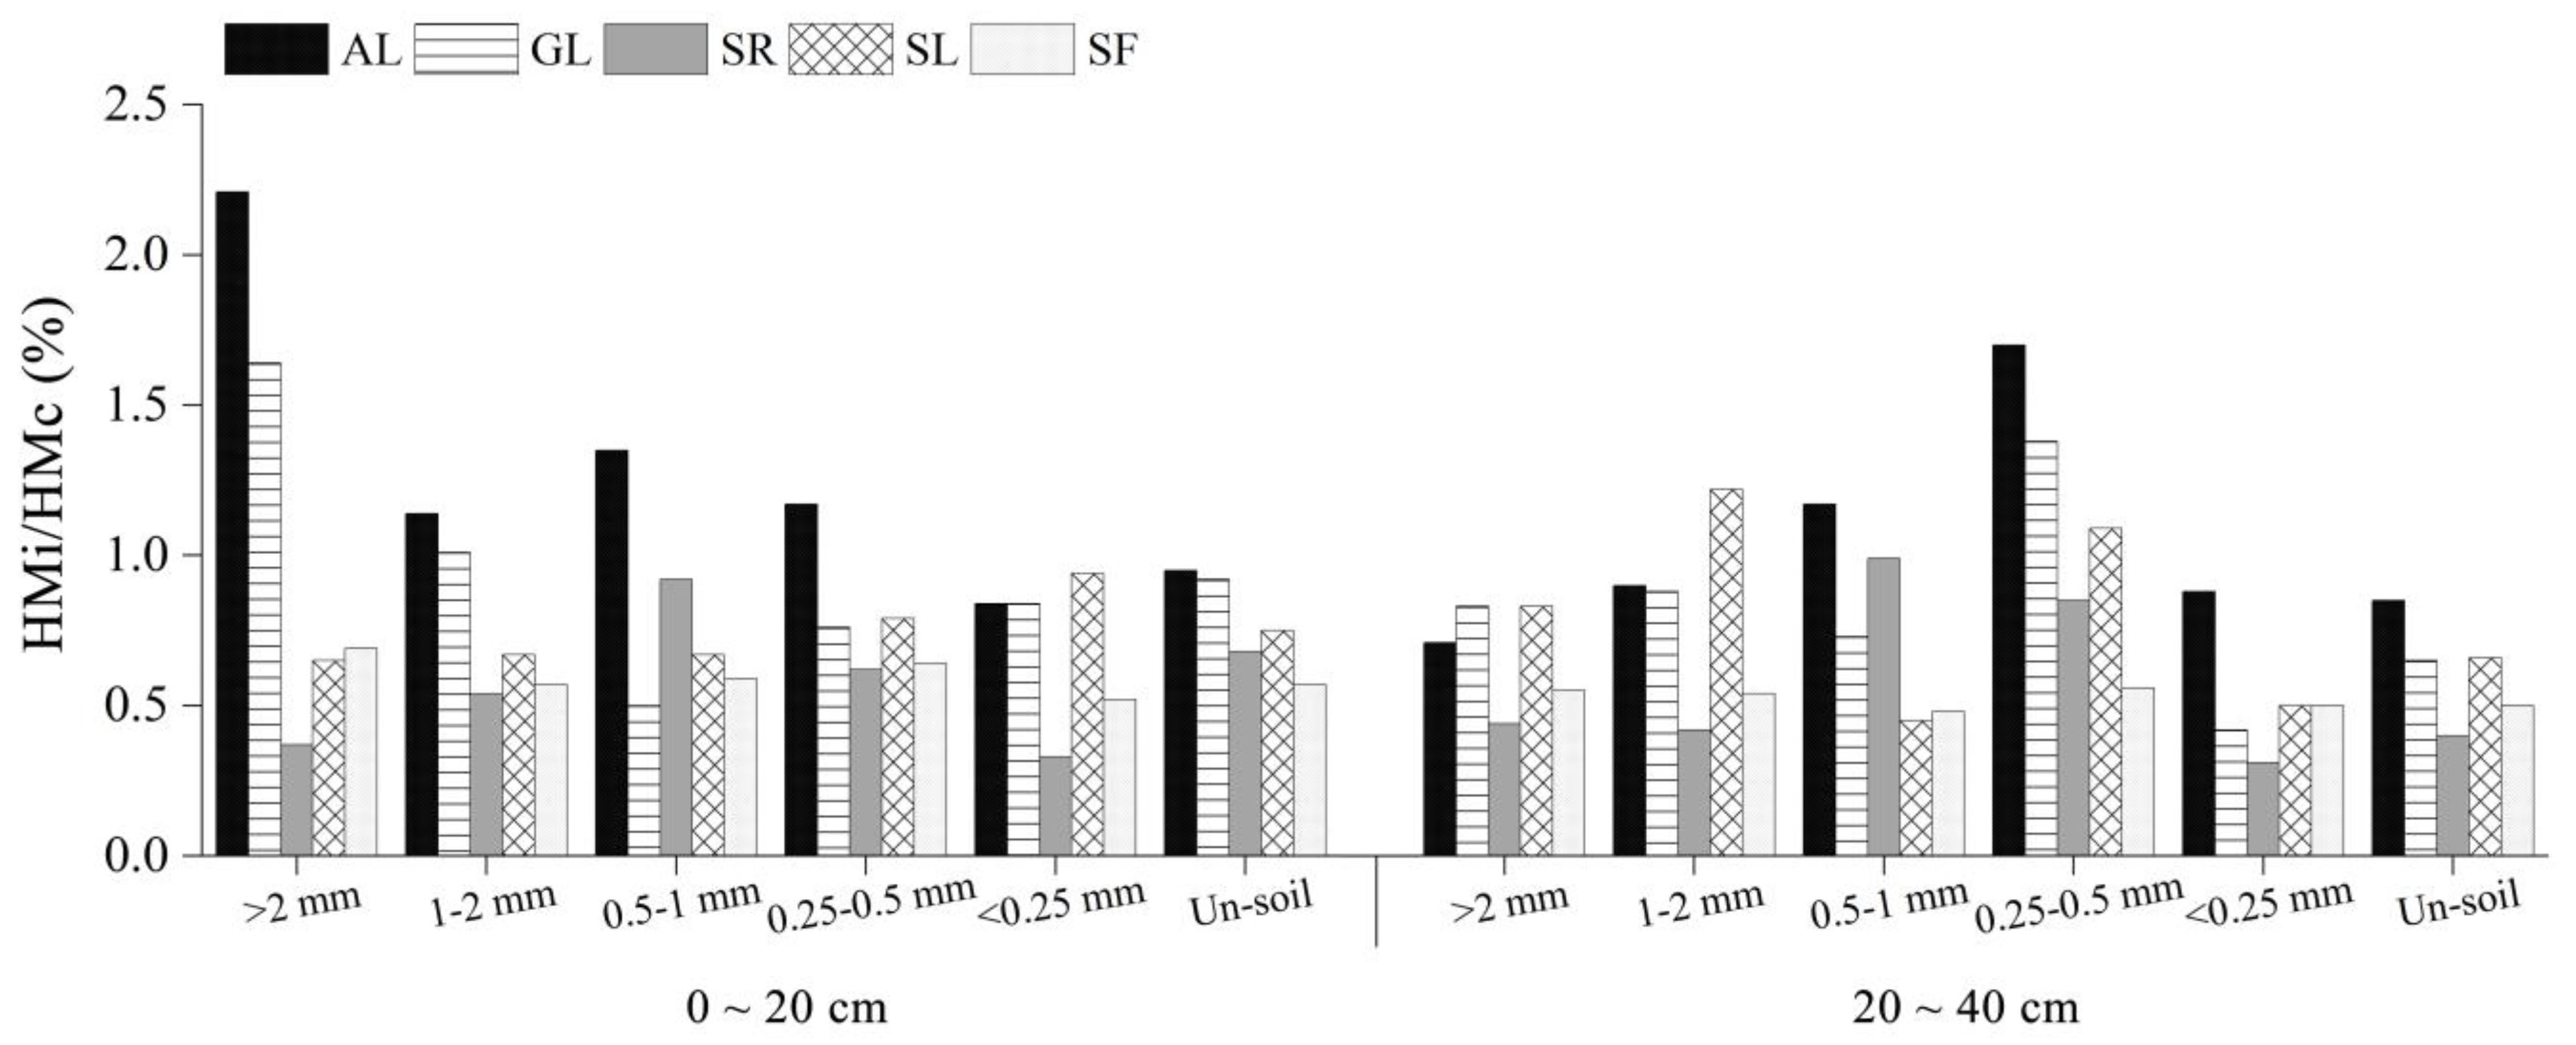
3.4.3. Humin (HM) Content and Its Distribution Ratio

Figure 7 shows how the return of farmland to vegetation encouraged HMi, HMc, and HMr accumulation. The data also revealed an increasing trend for all three components. The content of all three components was typically higher in the top layer (0–20 cm) than in the lower layer (20–40 cm) for both the undisturbed soil and the aggregates of each grain size. The HMi, HMc, and HMr levels under the SF and SL treatments in the top soil layer (0–20 cm) were significantly higher than those under the other treatments; the increases at the SF and SL stages were 70.69%, 16.38%, and 186.9% and 47.55%, 733.4%, and 527.72%, respectively. The increases at the SF and SL stages were 94.12%, 29.41%, and 230.13% and 66.99%, 1075.04%, and 1147.56%, respectively, in the 20–40 cm soil layer.
The distribution of the HMi, HMc, and HMr contents in the soil aggregates varied depending on the aggregate particle size, as shown in Figure 7. The HMi, HMc, and HMr contents under the various vegetation types did not exhibit evident regularity, with decreasing aggregate size. In the 20–40 cm soil layer, the HMi content at the GL stage was higher than that at the SR and SL stages. The content at the SF stage was the highest, followed by the AL and SL stages, but the HMr content was the highest at the SL stage, followed by the SF and SR stages.
The distribution ratio of HMi and HMc in the tested soil initially decreased after vegetation restoration, as indicated in Figure 8, but gradually increased. The results revealed that the HMr distribution ratio exhibited an overall increasing trend, whereas the HMi and HMc accumulation rates in the total organic matter initially decreased and then increased with vegetation restoration.
Except for 0.5–1 mm particle size, the HMi distribution proportion of each particle size was noticeably higher in the 0–20 cm soil layer in the AL stage than it was in the other vegetation restoration stages. The HMc content in the AL soil was significantly higher than that in the other vegetation restoration stages. The distribution ratio of the HMr in the SF was significantly higher than that in the AL and GL.
Except for the 1–2 mm aggregates under the AL treatment, there was no significant difference between the HMi distribution ratios under the other treatments for each of the particle sizes in the 20–40 cm soil layer. In contrast to the 0–20 cm soil layer, the HMc distribution ratio differed, and the value in SF was the highest within 1–2 mm and 0.25–0.5 mm ranges. The HMr distribution ratio increased with vegetation restoration and reached the highest value upon restoration to the SL stage, which was significantly higher than that at the other vegetation restoration stages and tended to remain stable at the SF stage. The distribution ratio of the three components did not exhibit an obvious change for the aggregates of each particle size.
Figure 9 shows that with the exception of a few AL and GL particle size aggregates, all the particle size aggregates in the other vegetation restoration stages had I/C values that were less than 1, indicating that HMi is typically present in lower concentrations than HMc. The I/C ratio of the undisturbed soil and each particle size aggregate in the 0–20 cm soil layer steadily dropped with each stage of vegetation restoration, and the ratio of SF microaggregates (0.25 mm) was lower than that of macroaggregates (>0.25 mm). With vegetation restoration, the patterns in the 20–40 cm soil layer were similar to those in the topsoil, and the values in the SL were higher. The minimum value in each soil layer occurred in the SR and the maximum value occurred in the AL.
Moreover, as indicated in Figure 10, the soluble HM ratio of the undisturbed soil and aggregates of each grain size was lower than 1 at each vegetation restoration stage, which shows that most insoluble HM components were more prevalent than the soluble ones. Among the constituent parts, the HMr concentration was the highest, followed by HMc and HMi. With vegetation regeneration, the I/C ratio of the undisturbed soil and aggregates of each particle size tended to gradually decline in the 0–20 cm soil layer. In contrast, the I/C ratio of >2 mm aggregates and microaggregates tended to be the highest, and the value of the intermediate aggregates was lower in the 20–40 cm soil layer. The minimal value in each soil layer was found in the SR while the maximum value was found in the AL.

3.5. Analysis of the Correlation and Regression between Aggregate Characteristics and Soil Humus Components

Table 5 shows that the HA content in the undisturbed soil, >2 mm aggregates, and 0.25 mm aggregates was significantly positively correlated with the content of WSAs and negatively but not significantly correlated with RSI and RMI. This suggests that HA accumulation in macroaggregates could significantly increase the proportion of >0.25 mm water-stable aggregates and aggregate water stability. Table 6 shows that the FA content in the undisturbed soil and aggregates of each particle size attained extremely significant positive correlations with the content of WSAs, with the highest FA correlation observed for 1–2 mm aggregates. This suggests that FA accumulation could significantly increase the amount of >0.25 mm water-stable aggregates and the soil microaggregation degree. The FA content of the undisturbed soil and each particle size aggregate had extremely significant positive correlations with AD and WSAs, with the 1–2 mm aggregate FA correlation being the highest. This suggests that FA accumulation could significantly increase the number of >0.25 mm water-stable aggregates and the degree of soil microaggregation. The strongest association with 1–2 mm aggregate FA and a very strong negative correlation with PAD suggest that increasing FA can lower the failure rate of large aggregates. Therefore, an increase in soil FA content can improve aggregate water stability and lessen the effect of rainwater dispersion.
Table 7, Table 8 and Table 9 indicate the relationships between the HM contents in the aggregates of the various particle sizes. There was no discernible association between the characteristics of the aggregates and HMi content. The HMc concentration in the soil aggregates exhibited a strong positive correlation with MWDFW but a negative correlation with the RSI, showing that HMc accumulation may considerably increase the ability of soil aggregates to withstand rainstorms and reduce the dissipation impact. The presence of HMr was positively correlated with WSAs and MWDFW in both the undisturbed soil and aggregates of the different particle sizes. As a result of HMr accumulation, the soil microaggregation degree, percentage of >0.25 mm water-stable aggregates, and water stability of soil aggregates were all greatly improved, according to the results. The HMr content in the aggregates of each particle size was strongly inversely linked with the PAD and RSI, which suggested that the increase in HMr could reduce the rate of destruction and dispersion of large aggregates.
The relationships between the humus content in the aggregates of the various particle sizes and the properties of water-stable aggregates under the different vegetation restoration conditions were closely studied, and the key variables influencing aggregate stability were identified. In this study, the humus components in the aggregates of each particle size were adopted as independent variables. Since the relationship between the MWD and humus components was very close, the MWD was defined as the dependent variable and stepwise regression was used to remove variables with no significant effect and multicollinearity. The analysis results are listed in Table 10, where the HA content in >2 mm aggregates, the FA and HMc contents in 1–2 mm aggregates, and the HMr content in <0.25 mm aggregates were significantly and positively correlated with the MWD of the WSAs (p < 0.05). The cluster stability could be explained by cluster stability degrees of 70.5%, 85.6%, 41.8%, 55.6%, and 70.5%.

4. Discussion

4.1. Effect of Vegetation Restoration on Soil Aggregates

In this study, the distribution of soil water-stable aggregates at each vegetation restoration stage was mainly dominated by the >2 mm size. This kind of aggregate structure can resist hydraulic dispersion, and its number and distribution reflect the stability and erosion resistance of the soil structure [54,55]. Under the same soil layer, with the restoration of vegetation, WSAs increased, MWD increased, and PAD decreased, indicating that aggregate stability was enhanced, the ability to resist fragmentation was greater, and the ability to resist erosion was more powerful. This conclusion is consistent with the research results of Wang et al. [56]. Due to the special geographical environment in the karst region, most of the bedrock is exposed, especially in the absence of vegetation protection, high temperatures, and rainy summers; thus, it is likely for soil erosion to take place. After vegetation recovery, higher canopy density and more litter can intercept rainfall, effectively reduce surface runoff, and prevent the direct splash erosion of rainwater on the soil surface, thus preserving the content of large aggregates and making the soil structure more stable [57]. Under different LB method treatments, the MWD of soil aggregates of different vegetation types was SW > WS > FW and decreased with the soil layer depth, demonstrating that under the three mechanism treatments, the stability and corrosion resistance of the soil aggregates of the SW treatment were the strongest and those of the FW treatment were the weakest, which further indicates that washing in heavy rainfall is the main driving force of soil loss in the karst region.

4.2. Effects of Vegetation Restoration on Soil Humus Components

Humus constitutes an important component of organic matter, and different components play different roles. Relevant studies have given more attention to the relationship between SOC and aggregates but have neglected the impact of humus components on aggregates. In this study, with positive vegetation succession, the complex vegetation composition was conducive to organic matter accumulation, and the HA and FA contents gradually increased. The HA and FA contents in the aggregates of each particle size in the topsoil layer were higher than those in the lower layer, demonstrating that the topsoil layer facilitated humus accumulation to a greater extent. This conclusion is consistent with the research results of Li et al. [58]. HA is the most active component in soil humus, which is slightly acidic but less acidic than FA, with a high cation exchange capacity. The cementation between HA and multivalent cations plays a vital role in the formation of large-scale aggregates from small particles and exerts a certain impact on soil aggregate stability [59]. FA is mainly concentrated in small aggregates, which may be due to the low molecular weight of FA, but its activity is relatively high. FA is an important component in HA formation and plays a key role in the maintenance and renewal of HA [59].
In this study, the FA content was roughly higher than that of HA, indicating that the soil in the research area is FA-rich soil. This may be attributable to the rapid decomposition of soil organic matter at the late vegetation restoration stage, which led to a large reduction in the amount of FA-like substances and newly transformed FA, while FA and other small-molecule organic substances were further decomposed to form HA. Li et al. [58] studied the organic matter components of different rocky desertification soils in the karst region and found that the content of the various organic matter components followed the order of HM > FA > HA, and the HA/FA ratio was lower than 40%, belonging to the category of FA-rich soil. The rocky desertification process significantly impacts the composition of organic matter in soil in the karst region. There are notable differences in the spatial distribution of soil organic matter components in the karst region. The HA, FA, and HM contents are higher in the surface layer than those in the lower layer. With positive vegetation succession, the gap between the HA and FA contents increased, resulting in the trend of the PQ values firstly decreasing and then increasing. Moreover, an overall decreasing trend was observed with increasing soil depth, showing that topsoil is more conducive to HA accumulation, and the humification degree was higher than that of the subsoil. This may have been due to the high solubility of FA, which was easily transferred to the lower layer with water during rainfall. In addition, this study found that the PQ value of the microaggregates (<0.25 mm) was higher than that of the large aggregates, indicating that HA was more easily preserved in the small aggregates, which is consistent with the conclusion of Six et al. [17]; this may occur because the turnover rate of microaggregates is lower than that of large aggregates.
HM is the humus component closely combined with minerals and an independent humus component. Compared with other humus components, the current research on HM is not comprehensive enough. HM can be tightly bound to inorganic components such as iron aluminum oxide and clay mineral particles. Therefore, in this study, the Pallo grouping method was used to divide HM into its small primary components such as HMi, HMc, and HMr. Herein, the HMr content was the highest, followed by HMc, and the HMi content was the lowest, which is consistent with the study results of Zhang et al. [60]. Vegetation restoration promoted HM accumulation in the soil, the HM contents at the SL and SF stages were significantly higher than those at other vegetation restoration stages, and the HM content in the surface soil layer was higher than that in the lower soil layer in all particle size aggregates. In this study, the I/C ratio of the aggregates of the different particle sizes at each vegetation restoration stage was lower than 1, indicating that vegetation restoration in the karst region increases the HMc content while the HMi content decreases. The proportion of soluble HM in each particle size aggregate at each vegetation restoration stage was less than 1, indicating that there were more insoluble components than soluble components in the HM composition.

4.3. Influence of the Humus Components on Aggregate Stability

In this study, after correlation analysis of the stability characteristic values of the aggregates of the different particle sizes and the various humus components, the results indicated that the soil HA content was significantly correlated with the aggregate stability. This suggests that an increase in HA content contributes to an improvement in aggregate stability and water-stable aggregates. An increase in the HA content in >2 mm and <0.25 mm aggregates could also increase the content in large aggregates, enhancing their stability. This conclusion is consistent with the research results of Jovanović et al. [35]. The HA content in the undisturbed soil and >2 mm and <0.25 mm aggregates was significantly positively correlated with the content of WSAs and negatively correlated with the RSI and RMI, but the correlation was not significant, indicating that HA accumulation in large aggregates could significantly improve the water stability of aggregates and reduce the sensitivity of aggregates to dissipation to a certain extent, which is consistent with the research results of Wang et al. [61]. An increase in the FA content could significantly improve the aggregation degree of soil microaggregates and the content of >0.25 mm water-stable aggregates, reduce the destruction rate of large aggregates, and inhibit the destruction of aggregates via rainwater dissipation. Chen et al. [62] also showed that FA was basically distributed in microaggregates, and its effect on the water stability of large aggregates was limited, which further supports the conclusions in this study.
HM accounts for the vast majority of humus and, due to its inertness and non-solubility, leads to the effective and long-term aggregation of soil particles [63,64,65]. In this study, the PAD attained a significant positive correlation with the HMr content in the aggregates of each particle size and attained the highest correlation with the HMr content in >2 mm aggregates, which indicates that the increase in HMr plays a vital role in microaggregate content enhancement. In this study, the MWD achieved a significant positive correlation with the HMr content in large aggregates and a very significant positive correlation with the HMc content in the aggregates of the various particle sizes, indicating that an increase in the contents of these two humus components could enhance the stability of large aggregates, especially the HMc content in large aggregates (>1 mm); moreover, an increase in the HMr content in microaggregates (<0.25 mm) could significantly promote the aggregation and stability of soil particles, which is consistent with the research conclusions of Wang et al. [61]. There was no significant correlation between the HMi content in the aggregates of the different particle sizes and stability indicators. It could be inferred that HMi slightly affects aggregate stability in the karst region, which may be related to the relatively simple molecular structure of HMi [27]. Further stepwise regression analysis revealed that the HA content in >2 mm aggregates, FA and HMc contents in 1–2 mm aggregates, and HMr content in <0.25 mm aggregates were the leading factors influencing the aggregate stability. This study complements and improves the knowledge of the stability characteristics of aggregates and humus components in the karst region and their response to vegetation restoration, and may provide a fundamental reference for improving soil structure stability and the restoration of degraded ecosystems in the karst region.

5. Conclusions

The soil structure tended to stabilize with vegetation restoration, with surface soils having a higher degree of aggregation than underlying soils. The soil water-stable aggregates at each vegetation restoration stage were mainly larger than 2 mm, and the MWD markedly increased with vegetation restoration. After the application of the LB method, the MWD of the soil particles at the different vegetation restoration stages indicated the order of SW > WS > FW, and the MWD value decreased with soil layer deepening. With vegetation restoration, the HA and FA contents exhibited a gradually increasing trend, and topsoil was more conducive to HA accumulation, while the smaller aggregates were more likely to store FA. The humification degree of the aggregates of the different particle sizes increased. In this study, the HMi content was generally lower than that of HMc. Moreover, among the different HM components, the HMr content was the highest, followed by HMc, and the HMr content was the lowest. Subsoil may be more favorable to the overall accumulation of HMi and HMc. The interactions between different components of organic matter and their effect on aggregate stability involve a relatively complex process as the vegetation restoration succession progresses. Furthermore, through stepwise regression analysis, it was found that HA, FA, and HMc in large aggregates and HMr in microaggregates are the leading factors influencing aggregate stability, which plays a prominent role in improving aggregate stability and soil structure in the karst region.

Author Contributions

Conceptualization, Y.Y., L.L. and H.W.; methodology, Y.Y. and L.L.; software, Y.Y. and H.W.; validation, Y.Y., L.L. and H.W.; formal analysis, Y.Y. and L.L.; investigation, Y.Y., H.W., L.L., Y.D. and X.D.; resources, Y.D. and X.D.; data curation, Y.Y., Y.D. and X.D.; writing—original draft preparation, Y.Y.; writing—review and editing, Y.Y., H.W., Y.D. and X.D.; visualization, Y.Y., L.L., Y.D. and X.D.; supervision, Y.D. and X.D.; project administration, Y.D. and X.D.; funding acquisition, Y.D. and X.D. All authors have read and agreed to the published version of the manuscript.

Funding

This work was supported by the Central Government Guides the Development of Local Science and Technology Project, China (guike. ZY21195016), National Key Research and Development Program of China (grant no. 2023YFD1902801), Open Research Fund of Guangxi Key Laboratory of Water Engineering Materials and Structures, Guangxi Institute of Water Resources Research (grant no. GXHRI-WEMS-2022-06), and the Open Foundation of Guangxi Key Laboratory of Forest Ecology and Conservation (grant no. 20221202).

Data Availability Statement

The data presented in this study are available upon request from the corresponding author. The data are not publicly available due to the consideration of data security.

Acknowledgments

We thank the teachers of Huanjiang Observation and Research Station for Karst Ecosystems for their help in instrument testing, and we are grateful to the reviewers and editors for their valuable time and suggestions for improving the quality of this paper.

Conflicts of Interest

The authors declare no conflicts of interest.

References

  1. Sheng, M.; Xiong, K.; Wang, L.; Li, X.; Li, R.; Tian, X. Response of soil physical and chemical properties to rocky desertification succession in South China Karst. Carbonates Evaporites 2018, 33, 15–28. [Google Scholar] [CrossRef]
  2. Wang, S.; Liu, Q.; Zhang, D. Karst rocky desertification in southwestern China: Geomorphology, landuse, impact and rehabilitation. Land Degrad. Dev. 2004, 15, 115–121. [Google Scholar] [CrossRef]
  3. Sun, Y.; Zhang, Y.; Li, S.; Zhang, N.; Wang, J. Research progress on soil and water loss and soil and water conservation in Karst areas. In Proceedings of the 2019 International Academic Exchange Conference on Science and Technology Innovation, Guangzhou, China, 20–22 December 2019; pp. 235–238. [Google Scholar]
  4. Walker, L.R.; Walker, J.; Hobbs, R.J. Linking Restoration and Ecological Succession; Springer: Berlin/Heidelberg, Germany, 2007. [Google Scholar]
  5. Gong, J.; Chen, L.; Fu, B.; Huang, Z.; Peng, H. Effect of land use on soil nutrients in the loess hilly area of the Loess Plateau. Land Degrad. Dev. 2006, 17, 453–465. [Google Scholar] [CrossRef]
  6. Chen, L.; Wang, J.; Wei, W.; Fu, B.; Wu, D. Effects of landscape restoration on soil water storage and water use in the Loess Plateau Region, China. Forest Ecol. Manag. 2010, 259, 1291–1298. [Google Scholar] [CrossRef]
  7. Wang, B.; Liu, G.; Xue, S.; Zhu, B. Changes in soil physico-chemical and microbiological properties during natural succession on abandoned farmland in the Loess Plateau. Environ. Earth Sci. 2011, 62, 915–925. [Google Scholar] [CrossRef]
  8. Yang, L.; Wei, W.; Chen, L.; Jia, F.; Mo, B. Spatial variation of shallow and deep soil moisture in the semi-arid loess hilly area. Hydrol. Earth Syst. Sci. Discuss. 2012, 9, 4553–4586. [Google Scholar]
  9. Stockmann, U.; Padarian, J.; Mcbratney, A.; Minasny, B.; Brogniez, D.; Montanarella, L.; Hong, S.Y.; Rawlins, B.G.; Field, D.J. Global soil organic carbon assessment. Global Food Secur. 2015, 6, 9–16. [Google Scholar] [CrossRef]
  10. Batjes, N.H. Harmonized soil property values for broad-scale modelling (WISE30sec) with estimates of global soil carbon stocks. Geoderma 2016, 269, 61–68. [Google Scholar] [CrossRef]
  11. Grinhut, T.; Hertkorn, N.; Schmitt-Kopplin, P.; Hadar, Y.; Chen, Y. Mechanisms of humic acids degradation by white rot fungi explored using 1H NMR spectroscopy and FTICR mass spectrometry. Environ. Sci. Tec. 2011, 45, 2748–2754. [Google Scholar] [CrossRef]
  12. Ponge, J.F.; Sartori, G.; Garlato, A.; Ungaro, F.; Zanella, A.; Jabiol, B.; Obber, S. The impact of parent material, climate, soil type and vegetation on Venetian forest humus forms: A direct gradient approach. Geoderma 2014, 226, 290–299. [Google Scholar] [CrossRef]
  13. Brady, N.C. The Nature and Properties of Soils, 8th ed.; MacMillan Publishing Co.: New York, NY, USA, 1984. [Google Scholar]
  14. Mikutta, R.; Kleber, M.; Torn, M.S.; Jahn, R. Stabilization of soil organic matter: Association with minerals or chemical recalcitrance? Biogeochemistry 2006, 77, 25–56. [Google Scholar] [CrossRef]
  15. Cheng, M.; Xiang, Y.; Xue, Z.; An, S.; Darboux, F. Soil aggregation and intra-aggregate carbon fractions in relation to vegetation succession on the Loess Plateau, China. Catena 2015, 124, 77–84. [Google Scholar] [CrossRef]
  16. Rattan, L. Physical management of soils of the tropics: Priorities for the 21st century. Soil Sci. 2000, 165, 191–207. [Google Scholar]
  17. Six, J.; Bossuyt, H.; Degryze, S.; Denef, K. A history of research on the link between (micro) aggregates, soil biota, and soil organic matter dynamics. Soil Till. Res. 2004, 79, 7–31. [Google Scholar] [CrossRef]
  18. Zhu, G.; Shangguan, Z.; Deng, L. Soil aggregate stability and aggregate-associated carbon and nitrogen innatural restoration grassland and Chinese red pine plantation on the Loess Plateau. Catena 2017, 149, 253–260. [Google Scholar] [CrossRef]
  19. Dou, Y.; Yang, Y.; An, S.; Zhu, Z. Effects of different vegetation restoration measures on soil aggregate stability and erodibility on the Loess Plateau, China. Catena 2020, 185, 104294. [Google Scholar] [CrossRef]
  20. Delgado, A.; Gómez, J.A. The soil. Physical, chemical and biological properties. In Principles of Agronomy for Sustainable Agriculture; Springer: Berlin/Heidelberg, Germany, 2017; pp. 15–26. [Google Scholar]
  21. Tisdal, J.M.; Oades, J.M. Organic matter and water-stable aggregates. Eur. J. Soil Sci. 1982, 33, 141–163. [Google Scholar] [CrossRef]
  22. Zhou, X.; Peng, X.; Peth, S.; Xiao, T.Q. Effects of vegetation restoration on soil aggregate microstructure quantified with synchrotron-based micro-computed tomography. Soil Till. Res. 2012, 124, 17–23. [Google Scholar] [CrossRef]
  23. Tang, Y.; Zhang, X.; Yang, P.; Wang, J.; Zhou, N. Fractal characteristics and stability of soil aggregates in karst rocky desertification areas. Nat. Hazards 2013, 65, 563–579. [Google Scholar] [CrossRef]
  24. Gelaw, A.M.; Singh, B.R.; Lal, R. Organic carbon and nitrogen associated with soil aggregates and particle sizes under different land uses in Tigray, Northern Ethiopia. Land Degrad. Dev. 2015, 26, 690–700. [Google Scholar] [CrossRef]
  25. Bronick, C.J.; Lal, R. Soil structure and management: A review. Geoderma 2005, 124, 3–22. [Google Scholar] [CrossRef]
  26. Six, J.; Paustian, K. Aggregate-associated soil organic matter as an ecosystem property and a measurement tool. Soil. Biol. Biochem. 2014, 68, A4–A9. [Google Scholar] [CrossRef]
  27. Dou, S.; Li, K.; Guang, S. A review on organic matter in soil aggregates. Acta Pedol. Sin. 2011, 48, 412–418. (In Chinese) [Google Scholar]
  28. Six, J.; Conant, R.T.; Paul, E.A.; Paustian, K. Stabilization mechanisms of soil organic matter: Implications for C-saturation of soils. Plant Soil 2002, 241, 155–176. [Google Scholar] [CrossRef]
  29. Lützow, M.V.; Knabner, I.K.; Ludwig, B.; Matzner, E.; Flessa, H.; Ekschmitt, K.; Guggenberger, G.; Marschner, B.; Kalbitz, K. Stabilization mechanisms of organic matter in four temperate soils: Development and application of a conceptual model. J. Plant Nutr. Soil Sci. 2008, 171, 111–124. [Google Scholar] [CrossRef]
  30. Li, G.; Fu, Y.; Li, B.; Zheng, T.; Wu, F.; Peng, G.; Xiao, T. Micro-characteristics of soil aggregate breakdown under raindrop action. Catena 2018, 162, 354–359. [Google Scholar] [CrossRef]
  31. Mao, X. Accumulation Characterisitcs and Stabilization Mechinisms of Organic Carbon in Soils Developed from Different parent Materials in Subtropical Regions; Zhejiang University: Hangzhou, China, 2020. (In Chinese) [Google Scholar]
  32. Sarker, T.C.; Incerti, G.; Spaccini, R.; Piccolo, A.; Mazzoleni, S.; Bonanomi, G. Linking organic matter chemistry with soil aggregate stability: Insight from 13C NMR spectroscopy. Soil Biol. Biochem. 2018, 117, 175–184. [Google Scholar] [CrossRef]
  33. Tan, W.; Xu, Y.; Shi, Z.; Cai, P.; Huang, Q. The formation process and stabilization mechanism of soil aggregates driven by binding materials. Acta Pedol. Sin. 2023, 60, 1297–1308. (In Chinese) [Google Scholar]
  34. Klučáková, M.; Kalina, M. Composition, particle size, charge, and colloidal stability of pH-fractionated humic acids. J. Soils Sediments 2015, 15, 1900–1908. [Google Scholar] [CrossRef]
  35. Jovanović, U.D.; Marković, M.M.; Cupać, S.B.; Tomić, Z.P. Soil humic acid aggregation by dynamic light scattering and laser Doppler electrophoresis. Eur. J. Soil Sci. 2013, 176, 674–679. [Google Scholar] [CrossRef]
  36. Cao, Z.; Wang, Y.; Li, J.; Zhang, J.; He, N. Soil organic carbon contents, aggregate stability, and humic acid composition in different alpine grasslands in Qinghai-Tibet Plateau. J. Mt. Sci-Engl. 2016, 13, 2015–2017. [Google Scholar] [CrossRef]
  37. Rodrigues, P.M.S.; Schaefer, C.E.G.R.; Silva, J.D.O.; Júnior, W.G.F.; Santos, R.M.D.; Neri, A.V. The influence of soil on vegetation structure and plant diversity in different tropical savannic and forest habitats. J. Plant Ecol. 2018, 11, 226–236. [Google Scholar] [CrossRef]
  38. Zhang, C.; Liu, G.; Xue, S.; Zhang, C. Rhizosphere soil microbial properties on abandoned croplands in the Loess Plateau, China during vegetation succession. Eur. J. Soil Biol. 2012, 50, 127–136. [Google Scholar] [CrossRef]
  39. Zhang, Y.; Shangguan, Z. The coupling interaction of soil water and organic carbon storage in the long vegetation restoration on the Loess Plateau. Ecol. Eng. 2016, 91, 574–581. [Google Scholar] [CrossRef]
  40. Mitter, B.; Brader, G.; Afzal, M.; Compant, S.; Naveed, M.; Trognitz, F.; Sessitsch, A. Advances in elucidating beneficial interactions between plants, soil and bacteria. Adv. Agron. 2013, 121, 381–445. [Google Scholar]
  41. Yu, Y.; Du, H.; Song, T.; Peng, W.; Zeng, F.; Wang, K.; Lu, S.; Fan, F.; Lu, C. Characteristics of soil fertility in different ecosystems in depressions between karst hills. Acta Ecol. Sin. 2013, 33, 7455–7466. [Google Scholar]
  42. Gallo, M.; Amonette, R.; Lauber, C.; Sinsabaugh, R.L.; Zak, D.R. Microbial community structure and oxidative enzyme activity in nitrogenamended north temperate forest soils. Microb. Ecol. 2004, 48, 218–229. [Google Scholar] [CrossRef]
  43. Zhao, D. Evolvement Characteristics and Quantification of Soil Aggregate Microstructure in the Process of Vegetation Restoration in Loess Hilly-Gully Region; Research Center of Soil and Water Conservation and Ecological Environment, Chinese Academy of Sciences and Ministry of Education: Beijing, China, 2017. (In Chinese) [Google Scholar]
  44. An, S.S.; Darboux, F.; Cheng, M. Revegetation as an efficient means of increasing soil aggregate stability on the Loess Plateau (China). Geoderma 2013, 209–210, 75–85. [Google Scholar] [CrossRef]
  45. Wu, G.; Liu, Z.; Zhang, L.; Chen, J.; Hu, T. Longterm fencing improved soil properties and soil organic carbon storage in an alpine swamp meadow of western China. Plant Soil 2010, 332, 331–337. [Google Scholar] [CrossRef]
  46. Lu, R. Methods of Soil and Agro-Chemistry Analysis; China Agricultural Science and Technology Press: Beijing, China, 2000. (In Chinese) [Google Scholar]
  47. Le Bissonnais, Y. Aggregate stability and assessment of soil crustability and erodibility: I. Theory and methodology. Eur. J. Soil Sci. 1996, 47, 425–437. [Google Scholar] [CrossRef]
  48. Li, C.; Cao, Z.; Chang, J.; Zhang, Y.; Zhu, G.; Zong, N.; He, Y.; Zhang, J.; He, N. Elevational gradient affect functional fractions of soil organic carbon and aggregates stability in a Tibetan alpine meadow. Catena 2017, 156, 139–148. [Google Scholar] [CrossRef]
  49. Zhang, B.; Horn, R. Mechanisms of aggregate stabilization in Ultisols from subtropical China. Geoderma 2001, 99, 123–145. [Google Scholar] [CrossRef]
  50. Le Bissonnais, Y.; Prieto, I.; Roumet, C.; Nespoulous, J.; Metayer, J.; Huon, S.; Villatoro, M.; Stokes, A. Soil aggregate stability in mediterranean and tropical agroecosystems: Effect of plant roots and soil characteristics. Plant Soil 2018, 424, 303–317. [Google Scholar] [CrossRef]
  51. Wang, B. Key Factors and Calculation of Soil Erodibility in the Typical Eroded Black Soil Area of Northeast China; Northwest A & F University: Xianyang, China, 2009. (In Chinese) [Google Scholar]
  52. Cavani, L.; Ciavatta, C.; Gessa, C. Identification of organic matter from peat, leonardite and lignite fertilisers using humification parameters and electrofocusing. Bioresour. Technol. 2003, 86, 45–52. [Google Scholar] [CrossRef]
  53. Aranda, V.; Oyonarte, C. Characteristics of organic matter in soil surface horizons derived from calcareous and metamorphic rocks and different vegetation types from the Mediterranean high-mountains in SE Spain. Eur. J. Soil Biol. 2006, 42, 247–258. [Google Scholar] [CrossRef]
  54. Su, Y.; Wang, F.; Zhang, Z.; Du, M. Soil properties and characteristics of soil aggregate in marginal farmlands of oasis in the middle of Hexi corridor region, Northwest China. Agr. Sci. China 2007, 6, 706–714. [Google Scholar] [CrossRef]
  55. Yoder, R.E. A direct method of aggregate analysis of soils and a study of the physical nature of erosion losses. J. Am. Soc. Agron. 1936, 17, 165. [Google Scholar] [CrossRef]
  56. Wang, J.; Liu, Z.; Bao, E.; Zhang, G.; Li, Y.; Sun, J. Effects of forest and grass restoration on soil aggregates and its organic carbon in karst rocky desertification areas. J. Soil Water Conserv. 2019, 33, 249–256. (In Chinese) [Google Scholar]
  57. Zheng, F. Effect of vegetation changes on soil erosion on the loess plateau. Pedosphere 2006, 16, 420–427. [Google Scholar] [CrossRef]
  58. Li, X.; Chen, X.; Zhou, L.; Jiao, C.; Cheng, S. Characteristics of soil iron and its pedogenetic significance in the process of karst rocky desertification, Southwestern China. Geol. Bull. China 2010, 29, 745–751. (In Chinese) [Google Scholar]
  59. Wang, J. Effects on Soil Anti-Erodibility and Soil Organic Matter Frations in Slope Farmlands with Different De-Farming Patterns in South Sichuan Province of China; Sichuan Agricultural University: Ya’an, China, 2011. (In Chinese) [Google Scholar]
  60. Zhang, Z.; Pan, G.; Zhang, J. Features on the humin composition in Xialaxiu profile. Res. Soil Water Conserv. 2013, 20, 295–298+304. (In Chinese) [Google Scholar]
  61. Wang, D. Several Zonal Soils Organic Matter Composition and Its Relationships with Structural Stability; Huazhong Agricultural University: Wuhan, China, 2017. (In Chinese) [Google Scholar]
  62. Chen, S. Stability of Soil Aggregates under Different Land Use Patterns and Its Relationships with Organic Matter and Iron-Aluminum Oxides; Huazhong Agricultural University: Wuhan, China, 2012. (In Chinese) [Google Scholar]
  63. Rice, J.A.; MacCarthy, P. Disaggregation and characterization of humin. Sci. Total Environ. 1992, 117–118, 83–88. [Google Scholar] [CrossRef]
  64. Haynes, R.J.; Beare, M.H. Influence of six crop species on aggregate stability and some labile organic matter fractions. Soil Biol. Biochem. 1997, 29, 1647–1653. [Google Scholar] [CrossRef]
  65. Hayes, M.H.B.; Mylotte, R.; Swift, R.S. Humin: Its composition and importance in soil organic matterses. Adv. Agron. 2017, 143, 47–138. [Google Scholar]
Figure 1. Location map of the research area.
Forests 15 00292 g001
Figure 2. Composition of soil water stability aggregates at different vegetation restoration stages. Different small letters indicate significant differences among the same grain size in the same soil layer at the 0.05 level at different vegetation restoration stages.
Forests 15 00292 g002
Figure 3. Distribution characteristics of LB method soil aggregates at different vegetation restoration stages. (ac) represent fast wetting (FW), slow wetting (SW), and wet stirring (WS), respectively. Different small letters indicate significant differences among the same grain size in the same soil layer at the 0.05 level at different vegetation restoration stages.
Forests 15 00292 g003
Figure 4. HA and FA contents of soil aggregates at different vegetation restoration stages. Un-soil represents undisturbed soil. (a,b) represent HA content at different aggregates, and FA content at different aggregates, respectively. Different small letters indicate significant differences among the same grain size in the same soil layer at the 0.05 level at different vegetation restoration stages.
Forests 15 00292 g004
Figure 5. HA and FA distribution ratio of soil aggregates at different vegetation restoration stages. Un-soil represents undisturbed soil. (a,b) represent HA distribution ratio at different aggregates, and FA distribution ratio at different aggregates, respectively. Different small letters indicate significant differences among the same grain size in the same soil layer at the 0.05 level at different vegetation restoration stages.
Forests 15 00292 g005
Figure 6. PQ values of soil aggregates at different vegetation restoration stages.
Forests 15 00292 g006
Figure 7. HM content of soil aggregates at different vegetation restoration stages. (ac) represent HMi content at different aggregates, HMc content at different aggregates, and HMr content at different aggregates, respectively. Different small letters indicate significant differences among the same grain size in the same soil layer at the 0.05 level at different vegetation restoration stages.
Forests 15 00292 g007aForests 15 00292 g007b
Figure 8. HM distribution ratio of soil aggregates at different vegetation restoration stages. (ac) represent HMi distribution ratio at different aggregates, HMc distribution ratio at different aggregates, and HMr distribution ratio at different aggregates, respectively. Different small letters indicate significant differences among the same grain size in the same soil layer at the 0.05 level at different vegetation restoration stages.
Forests 15 00292 g008
Figure 9. I/C ratio of soil aggregates under different vegetation restoration stages.
Forests 15 00292 g009
Figure 10. (HMi + HMc)/HM of soil aggregates under different vegetation restoration stages.
Forests 15 00292 g010
Table 1. Basic information on sample plots in different vegetation restoration stages.
Vegetation
Type
LatitudeLongitudeElevation (m)Slope (°)Main Predominate Trees
AL24°55′53″107°57′31″413~67933~39Apluda mutica, Hosta plantaginea
GL24°55′16″107°57′45″407~58738~42Miscanthus floridulus, Imperata cylindrica
SR24°56′40″107°58′52″389~50240~47Coriaria nepalensis, Neyraudia reynaudiana
SL24°56′04″107°59′19″393~51335~39Alchornea trewioides, Rhus chinensis
SF24°55′15″107°58′05″381~58335~43Radermachera sinica, Toona sinensis, Gleditsia sinensis
Table 2. Basic physical and chemical properties of soil at different vegetation restoration stages.
Soil Depth
(cm)
Vegetation
Type
pHBD
(g·cm−3)
Soil Particle Size Distribution (%)
SandSiltClay
(0.05–2 mm)(0.002–0.05 mm)(<0.002 mm)
0~20AL6.18 ± 0.07 b1.32 ± 0.01 a26.07 ± 0.37 a48.15 ± 0.15 c25.78 ± 0.22 b
GL6.22 ± 0.01 b1.30 ± 0.07 a15.26 ± 1.24 c60.26 ± 1.76 a24.48 ± 0.52 c
SR6.49 ± 0.03 a1.16 ± 0.12 ab18.90 ± 0.40 b61.46 ± 0.13 a19.64 ± 0.26 d
SL6.11 ± 0.09 b1.00 ± 0.15 bc15.22 ± 0.22 c53.00 ± 0.50 b31.78 ± 0.28 a
SF6.09 ± 0.03 b0.92 ± 0.06 c26.49 ± 0.10 a41.99 ± 0.08 d31.52 ± 0.02 a
20~40AL6.64 ± 0.06 b1.37 ± 0.06 a23.52 ± 0.38 a48.22 ± 0.83 b28.26 ± 0.44 c
GL6.44 ± 0.06 bc1.38 ± 0.02 a14.49 ± 0.19 c59.27 ± 0.43 a26.24 ± 0.24 d
SR6.91 ± 0.08 a1.35 ± 0.05 a13.73 ± 0.26 c58.51 ± 0.41 a27.76 ± 0.14 c
SL6.30 ± 0.05 c1.06 ± 0.08 b19.67 ± 0.32 b47.76 ± 1.06 b32.57 ± 0.73 b
SF6.25 ± 0.01 c1.04 ± 0.03 b22.53 ± 0.47 a41.52 ± 0.72 c35.95 ± 0.25 a
AL, GL, SR, SL, and SF represent abandoned land, grassland, Shrub grassland, shrubbery, and secondary forest, respectively. Different small letters indicate significant differences among different stand types in the same soil layer at the 0.05 level.
Table 3. Stability characteristics of soil water stability aggregates at different vegetation restoration stages. Different small letters indicate significant differences among different stand types in the same soil layer at the 0.05 level.
Soil Depth
(cm)
Vegetation
Type
MWD (mm)WSAs (%)PAD (%)
0~20AL1.48 ± 0.03 c74.02 ± 2.97 b19.65 ± 1.67 a
GL4.00 ± 0.13 b87.76 ± 0.10 a7.19 ± 0.95 a
SR4.38 ± 0.05 ab87.14 ± 1.12 a10.47 ± 1.27 a
SL4.55 ± 0.05 ab89.25 ± 1.22 a9.85 ± 3.10 a
SF4.96 ± 0.54 a90.45 ± 8.02 a8.31 ± 1.72 a
20~40AL1.53 ± 0.06 c70.89 ± 3.28 c22.58 ± 2.31 a
GL3.93 ± 0.02 b82.45 ± 0.63 b13.22 ± 0.93 b
SR4.08 ± 0.22 b86.19 ± 1.03 ab11.57 ± 1.01 b
SL4.51 ± 0.21 a90.16 ± 0.99 a8.29 ± 1.38 b
SF4.57 ± 0.21 a89.08 ± 1.53 a10.21 ± 1.08 b
Table 4. Stability characteristics of LB method soil aggregates at different vegetation restoration stages. Different small letters indicate significant differences among different stand types in the same soil layer at the 0.05 level.
Soil Depth
(cm)
Vegetation
Type
Average Weight Diameter MWD (mm)RSI (%)RMI (%)
FWSWWS
0~20AL2.44 ± 0.07 c2.97 ± 0.08 c2.88 ± 0.14 a0.18 ± 0.04 b0.03 ± 0.02 a
GL1.78 ± 0.15 d3.46 ± 0.02 a2.71 ± 0.77 a0.48 ± 0.04 a0.22 ± 0.22 a
SR3.18 ± 0.04 a3.44 ± 0.01 a3.29 ± 0.05 a0.08 ± 0.01 cd0.04 ± 0.02 a
SL2.78 ± 0.13 b3.07 ± 0.15 bc2.94 ± 0.14 a0.09 ± 0.04 c0.04 ± 0.02 a
SF3.24 ± 0.12 a3.26 ± 0.14 ab3.18 ± 0.12 a0.01 ± 0.01 d0.03 ± 0.01 a
20~40AL1.76 ± 0.49 b2.78 ± 0.23 c2.89 ± 0.12 b0.36 ± 0.20 b0.04 ± 0.07 b
GL1.08 ± 0.15 b3.41 ± 0.05 a3.23 ± 0.09 a0.68 ± 0.05 a0.05 ± 0.03 ab
SR2.89 ± 0.26 a3.46 ± 0.01 a3.22 ± 0.20 a0.16 ± 0.07 bc0.07 ± 0.06 a
SL2.61 ± 0.41 a3.29 ± 0.08 ab3.14 ± 0.08 ab0.21 ± 0.12 bc0.05 ± 0.00 ab
SF2.90 ± 0.15 a3.11 ± 0.04 b3.03 ± 0.09 ab0.07 ± 0.04 c0.03 ± 0.02 ab
Table 5. The correlation between the stability characteristics of soil aggregates and the content of HA.
IndexAggregates of Different Particle Sizes
>2 mm1–2 mm0.5–1 mm0.25–0.5 mm<0.25 mmUn-Soil
WSAs0.646 *0.6190.5420.5460.633 *0.666 *
PAD−0.565−0.520−0.443−0.455−0.563−0.583
MWDFW0.5840.6090.5490.6240.5570.615
MWDSW0.0540.023−0.047−0.039−0.0050.056
MWDWS0.2530.3160.2760.2550.1030.234
RSI−0.573−0.603−0.563−0.631−0.564−0.604
RMI−0.109−0.199−0.240−0.214−0.045−0.090
* indicates p < 0.05. WSAs, PAD, MWDFW, MWDSW, MWDWS, RSI, and RMI represent the proportion of >0.25 mm water-stable aggregates, rate of aggregate structural disruption, mean weight diameter under fast wetting, mean weight diameter under slow wetting, mean weight diameter under slow stirring, relative slaking index, and relative mechanical breakdown index, respectively. The same below.
Table 6. The correlation between the stability characteristics of soil aggregates and the content of FA. * indicates p < 0.05 and ** indicates p < 0.01.
IndexAggregates of Different Particle Sizes
>2 mm1–2 mm0.5–1 mm0.25–0.5 mm<0.25 mmUn-Soil
WSAs0.877 **0.906 **0.881 **0.872 **0.857 **0.886 **
PAD−0.782 **−0.832 **−0.818 **−0.795 **−0.775 **−0.805 **
MWDFW0.777 **0.740 *0.779 **0.759 *0.798 **0.750 *
MWDSW0.2950.4140.3650.2860.2820.295
MWDWS0.3450.3310.2380.1670.2530.235
RSI−0.709 *−0.645 *−0.698 *−0.699 *−0.736 *−0.686 *
RMI0.0640.1920.2280.2120.1340.157
Table 7. The correlation between the stability characteristics of soil aggregates and the content of HMi. * indicates p < 0.05.
IndexAggregates of Different Particle Sizes
>2 mm1–2 mm0.5–1 mm0.25–0.5 mm<0.25 mmUn-Soil
WSAs0.2400.5310.1060.1400.1090.446
PAD−0.207−0.49−0.019−0.081−0.052−0.374
MWDFW0.3120.4480.4430.2730.3440.605
MWDSW−0.327−0.096−0.495−0.448−0.475−0.197
MWDWS−0.266−0.187−0.155−0.252−0.366−0.049
RSI−0.407−0.492−0.564−0.388−0.476−0.660 *
RMI−0.0620.123−0.354−0.226−0.143−0.114
Table 8. The correlation between the stability characteristics of soil aggregates and the content of HMc. * indicates p < 0.05.
IndexAggregates of Different Particle Sizes
>2 mm1–2 mm0.5–1 mm0.25–0.5 mm<0.25 mmUn-Soil
WSAs0.4960.5750.5250.4890.3920.571
PAD−0.364−0.480−0.457−0.424−0.299−0.457
MWDFW0.5790.5950.4480.5130.5610.673 *
MWDSW−0.170−0.042−0.144−0.087−0.0470.003
MWDWS0.2130.070−0.053−0.0310.2220.273
RSI−0.622−0.619−0.493−0.543−0.575−0.674 *
RMI−0.318−0.051−0.054−0.022−0.192−0.178
Table 9. The correlation between the stability characteristics of soil aggregates and the content of HMr. * indicates p < 0.05 and ** indicates p < 0.01.
IndexAggregates of Different Particle Sizes
>2 mm1–2 mm0.5–1 mm0.25–0.5 mm<0.25 mmUn-Soil
WSAs0.766 **0.728 *0.767 **0.765 **0.774 **0.733 *
PAD−0.679 *−0.631−0.692 *−0.697 *−0.716 *−0.637 *
MWDFW0.773 **0.777 **0.717 *0.683 *0.6030.752 *
MWDSW0.1940.1740.2590.2620.3100.144
MWDWS0.3070.3930.3600.3330.3620.329
RSI−0.726 *−0.729 *−0.653 *−0.620−0.529−0.717 *
RMI−0.015−0.1100.0060.0270.049−0.087
Table 10. Regression equation of soil aggregate humus fraction content (X) and water-stable aggregate MWD (Y).
ComponentEquationR2Fp
HA-CY = 0.586X1 + 1.2520.55610.0210.013
FA-CY = 0.442X2 − 0.1840.85647.5460.000
HMc-CY = 1.163X2 + 1.3430.4185.7410.043
HMr-CY = 0.148X3 + 1.0520.70519.1330.002
X1, X2, and X3 respectively represent >2, 1–2, and <0.25 mm particle size aggregate humus component content.
Disclaimer/Publisher’s Note: The statements, opinions and data contained in all publications are solely those of the individual author(s) and contributor(s) and not of MDPI and/or the editor(s). MDPI and/or the editor(s) disclaim responsibility for any injury to people or property resulting from any ideas, methods, instructions or products referred to in the content.

