Article

Applicability of Thermal Dissipation Method in Sap Flow Measurement of Karst Shrub Community

1
Guangxi Key Laboratory of Plant Conservation and Restoration Ecology in Karst Terrain, Guangxi Institute of Botany, Chinese Academy of Sciences, Guilin 541006, China
2
Guangxi Guilin Urban Ecosystem National Observation and Research Station, National Forestry and Grassland Administration, Guilin 541006, China
3
International Research Centre on Karst under the Auspices of UNESCO, National Center for International Research on Karst Dynamic System and Global Change, Guilin 541004, China
*
Author to whom correspondence should be addressed.
Forests 2024, 15(2), 259; https://doi.org/10.3390/f15020259
Submission received: 26 December 2023 / Revised: 23 January 2024 / Accepted: 26 January 2024 / Published: 29 January 2024
(This article belongs to the Section Forest Hydrology)

Abstract

:
Although the thermal dissipation probe (TDP) method is prominent in forest transpiration studies, the accurate estimation of sap flow density in particular trees with different wood structures remains highly variable. To verify the applicability of the TDP method in the measurement of the transpirational water consumption of shrub communities in degraded karst areas in southern China, Granier’s original formula was validated and corrected using the isolated stem segment method with Celtis sinensis, Xylosma congesta, Triadica sebifera, Paliurus ramosissimus, Pyracantha fortuneana, Sageretia thea, and Phanera championii. Finally, the correction coefficients were analyzed in relation to wood structural parameters. Our study reveals that the sap flow density estimated using Granier’s original formula exhibited varying degrees of overestimation or underestimation compared to the measured sap flow density. The differences ranged from −78.9% to 114.2%, highlighting the need for formula correction. Consequently, we adjusted the coefficients α and β of the original formula (n = 3–5), resulting in a revised range of 0.0047–0.0509 g cm−2 s−1 and 0.5882–1.9821 (R2 = 0.81–0.97), respectively. The conduit diameter was significantly correlated with the correction coefficient α. It is currently unknown whether the results obtained for a particular species can be applied to different growth environments and more prominent individuals of the same species. In conclusion, it is necessary to verify the applicability of Granier’s original formula when estimating water consumption through transpiration in trees.

1. Introduction

Vegetation transpiration accounts for 60%–80% of terrestrial evapotranspiration [1], which plays a vital role in the water cycle of the soil–vegetation–atmosphere system [2]. As the organ that connects to the water absorption site (root) and the transpiration site (blades), the trunk is the only pathway for water transport in trees [3]. The trunk sap flow is a good indicator of the comprehensive regulation of the effect of plant structure characteristics and the external environment on water utilization [4]. Various methodologies are available for assessing trunk sap flow, such as heat pulse, heat balance, heat-field deformation, and thermal dissipation [5]. Among them, the thermal dissipation probe (TDP) method is widely used in the research of forest transpiration [6] because it is simple to use and has small destructive and continuous monitoring.
Measurement accuracy of forest transpiration is the basis for evaluating forest water balance and eco-hydrological functions [7]. The TDP method calculates a tree’s transpiration as the product of sapwood area and sap flow density. Sap flow density is usually estimated through the empirical equation developed by Granier using calibration data from three species of Pseudotsuga menziesii, European nigra, and Quercus pedunculata [8]. The Granier empirical equation is thought to be independent of tree species and wood characteristics and suitable for all tree species [8,9]. The Granier empirical equation has been confirmed in some studies. Still, more and more studies have shown that the empirical equation will cause significant deviations in the estimation of sap flow density for some tree species and wood characteristics [10,11]. At present, the TDP method has been widely used in the fields of agriculture, forestry, and ecology. Still, the calibration of the empirical equation for sap flow density estimation is rare [1,5]. To reduce the measurement uncertainty of forest transpiration, it is necessary to verify the applicability of Grainer’s original formula in various tree species, especially when the studied species obviously differ in wood structure and growth environment from the tree species used to establish Granier’s original formula. Otherwise, it may induce unignorable errors in estimating forest transpiration and even conclude opposite water use strategies in some species.
There are three main correction methods of Grainer’s original formula: the whole-tree container method [2,12,13,14,15], the broken-root container method [5,16,17], and the isolated stem segment method [18,19,20,21]. Among them, the whole-tree container method retains all the complete organs of the tree, closest to the natural growth state, and is the ideal calibration method for the sap flow density formula [22]. The broken-root container method retains the crown of trees and the wood duct system of the wooden department, which is close to the natural state, and it is a classic method to measure plant water consumption [10]. Although there are many advantages to the whole-tree and broken-root container methods, they are complex and costly to implement due to the complexity of the techniques involved, their low operability, and the fact that they are influenced by environmental factors, mainly when applied to a large number of trees under natural conditions [11]. The isolated stem segment method is more widely used in trunk sap flow calibration methods due to controlled conditions, easy operation, accurate measurement, and the wide range of experimental material sizes. This method has been used for the equation calibration of sap flow density in many tree species, such as Elaeis guineensis [23], Robinia pseudoacacia [24], Quercus variabilis [25], Tectona grandis [26], Cryptomeria japonica [6], Pinus sylvestris var. mongolica [27], and so on.
Water availability serves as the primary constraint on vegetation recovery within the karst-degraded area [28] and plays a pivotal role in sustaining the growth and development of plants. Although the karst region in southern China has good climatic water and heat conditions, the rainfall is mainly concentrated in the rainy season. In addition, vegetation in karst areas is often affected by water stress due to the shallow and discontinuous soil layer, which has poor water-holding capacity [29]. Therefore, the accurate measurement of plant transpirational water consumption in karst areas can help to understand plant water use strategies and is of great importance for further analysis of the role of plants in the water cycle of karst ecosystems [30].
Currently, there exists limited research on the suitability of Granier’s original formula for karst plants. Notably, Zeng et al. [11,31] exclusively investigated common tree species in secondary forests and orchards, with no available studies focusing on shrub communities within degraded karst areas. Hence, this study addresses this research gap by examining the primary tree species within shrub communities in degraded karst areas. This investigation employs a specially designed 10 mm-long TDP using the isolated stem segment method. The primary objectives of this study are as follows: (1) to validate the applicability of Granier’s original formula, (2) to refine the coefficients of Granier’s original formula, and (3) to investigate the effect of wood structure on the correction coefficients.

2. Materials and Methods

2.1. Study Area

The research site is located in the Huixian Karst Bush Ecosystem Positioning Observation and Research Station (110°13′ E, 25°06′ N) and similar habitats in the surrounding area in Guilin. The region belongs to the Middle Asian tropical monsoon climate, and the soils are mainly red loam developed from sand shale. The annual average temperature is 19.2 °C, with an extreme maximum temperature of 40 °C and an extreme minimum temperature of −6 °C. The annual average rainfall is 1865.7 mm and is mainly concentrated in April–August. The frost-free period is more than 320 d, and the annual sunshine time is more than 1699 h. The main species include Triadica sebifera, Xylosma congesta, Celtis sinensis, Pyracantha fortuneana, Paliurus ramosissimus, Sageretia thea, Phanera championii, Zanthoxylum bungeanum, and Sinoadina racemosa.

2.2. Calibration Experiment

In the summer of 2020, four to six sample trees with healthy growth, straight trunks, and complete crowns were selected for each species (Table 1). One stem section approximately 1 m long was intercepted from each sample tree on a rainy day or a cloudy morning. During the interception process, the cutting area was sprayed with purified water. After cutting, the morphological lower end of the stem section was immersed in water to reduce the vessel embolism at the incision and its dispersal in the stem section, and then it was transported back to the laboratory as soon as possible. The stem was cut into a segment of about 30 cm, and the two ends were shaved underwater with razor blades. A section of bark about 2 cm long was removed from the lower end of the stem, and the debarked area was wrapped with sealing film or raw material tape. The lower end of the processing stem section was put into a tube (about 2 m long) with a small amount of purified water, while the attachment was tightened with a tie to prevent water from escaping. The stem segment and silicone tube were fixed to the pre-prepared iron stand.
A couple of 10 mm-long TDP sensors were installed in the middle of the stem segment, with the heating probe at the upper end of the morphology and the reference probe at the lower end of the morphology. The spacing distance between the two probes was about 15 cm. The heating probe provided a constant current of 120 mA with a power of about 0.1 watts (W). The data were collected using a datalogger (CR1000, Campbell Scientific, Logan, UT, USA) with a scanning interval of 30 s, and data were recorded every 5 min.
The water column height of the existing sap flow calibration experiment was limited to a fixed height (15, 30, 50, 70, and 90 cm) [11,32]. To expand the range of sap flow density values and increase the number of test points, we utilized a water column height twice the conventional measurement and an adjustable water column height to capture sap flow data within the range of 1.8–0.1 m. The initial height of the water head in the rubber pipe above the stem segment was about 1.8 m. The water column was positioned in the lower section of the segment to align with the direction of the induced water flow, corresponding to the sap flow from the roots to the crown. A container was placed under the stem section to capture the actual sap flow, which was weighed every 5 min (consistent with CR1000 recording frequency) using an electronic balance with an accuracy of 0.01 g. Subsequently, the height of the water column diminished over time due to the gravitational effects. When the height of the water column dropped to about 10 cm, water was added to 1.8 m. This was repeated over3 times, and the measurement time was over5 h. Acidic magenta dye was added to stain the sapwood at the end of calibration to determine the sapwood area (As, cm2) [5]. At the end of each measurement, the maximum temperature difference (∆Tm) between the heated probe and the reference probe was recorded at zero water pressure.
The relationship between sap flow rate (SF, G·s−1) and temperature difference, combined with tree sapwood area (As, cm2), was used to correct the formula for calculating the sap flow density for each species based on Granier’s original formula.
FC = SF/As
FG = αKβ
where FC was the measured sap flow density (g·cm−2·s−1), K = (∆Tm − ∆T)/∆T, ∆Tm was the maximum temperature difference (°C) when no sap flow was in the stem, and ∆T was the measured temperature difference (°C). FG was the value (g·cm−2·s−1) calculated through the uncalibrated Granier original empirical formula with α of 0.0119 and β of 1.231.

2.3. Wood Structure

At the end of the calibration experiment, the segment between the heating probe and the reference probe was intercepted and used to determine parameters such as its sapwood area (As, cm2) and wood density. Using the freehand sectioning method, cross-sectional sections of stems were obtained from the remaining segments, and parameters such as conduit density and conduit diameter were observed using light microscopy.

2.4. Data Extraction and Statistics

The measured dataset of three to five stem samples was selected randomly to calibrate Granier’s formula for each species, and that of the remaining one stem sample was used to validate the calibrated Granier formula. To test the relationship between wood structures and the calibration parameters of the Granier formula on a broader scale, both measured data in this study and published data were used. The published calibration and wood structure data were directly retrieved from tables or the TRY database [2,6,8,10,11,15,16,18,19,20,21,22,23,24,26,27,32,33,34,35,36,37,38,39,40,41,42,43,44,45,46,47,48]. To enlarge the data range, the published calibrated species that found only one or two structure parameters were also included in this analysis.
The error (CV, %) between the sap flow density calculated by the uncalibrated Granier original formula and the actual measured sap flow density is calculated as follows:
CV = (FGFC)/FC × 100

3. Results

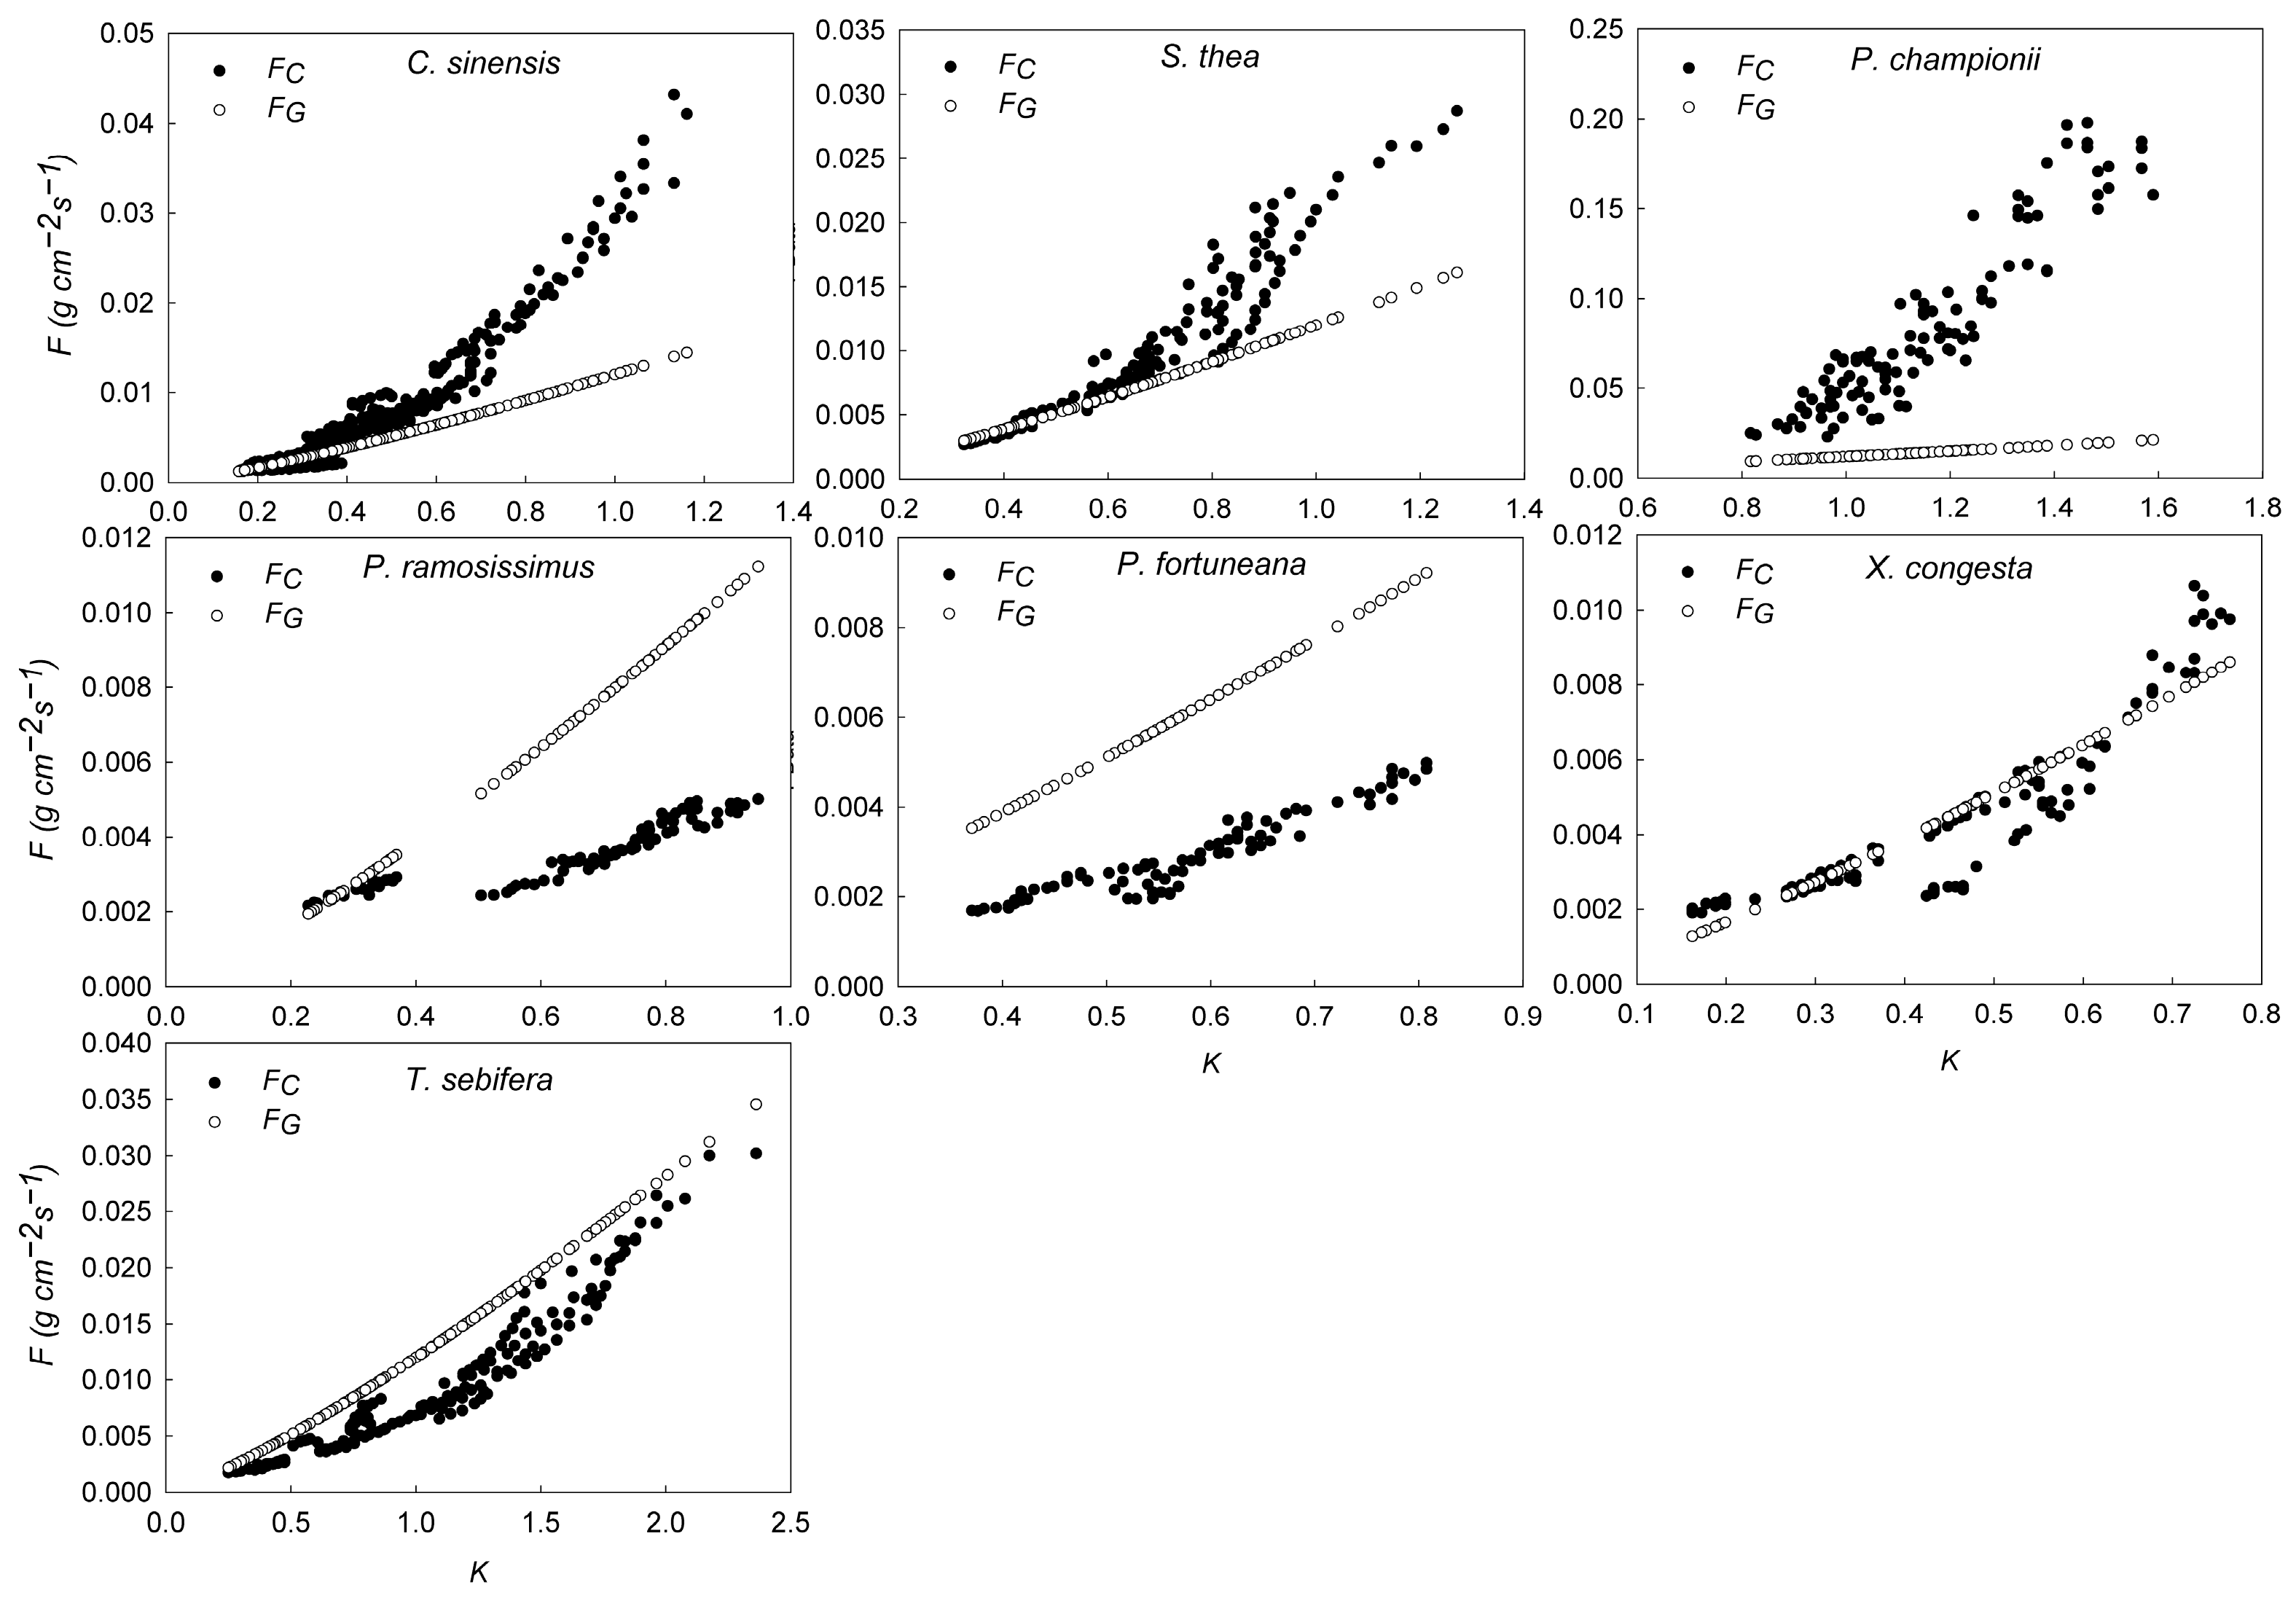
3.1. Comparison between the Actual Measured Sap Flow Density and That Calculated through Granier’s Original Formula

The sap flow density calculated through Granier’s original empirical formula (FG) was not always equal to the measured sap flow density (FC), and the differences between them in all measured species varied continuously with the K value (Figure 1). For species of C. sinensis (ring-porous), S. thea (diffuse-porous), and P. championii (vine), the value of FC was higher than FG, and the differences between them intensified with the increase in the K value. Contrarily, for species of P. ramosissimus (semi-ring-porous) and P. fortuneana (semi-ring-porous), FG was higher than FC for most of the K range, and the difference between them increased with the increase in the K value. X. congesta (semi-ring-porous) and T. sebifera (semi-ring-porous) showed similar patterns between FC and FG, with the most significant difference between FC and FG occurring at around the middle K value. The error of FG compared with FC (CV) ranged from −78.9% to 114.2% across all measured species (Figure 2).
A discrepancy exists between the CV values and the change in K values among different species (Figure 2). When the K values are small, the CV values for C. sinensis, S. thea, and P. ramosissimus hover around zero. However, as the K values increase, the underestimations for C. sinensis, S. thea, and P. championii gradually rise, while the overestimations for P. ramosissimus increase concomitantly. For X. congesta, T. sebifera, and P. fortuneana, their CV values initially increase and then decrease. Notably, the CV value for X. congesta fluctuates around zero, and the CV value for T. sebifera transitions from being overestimated to underestimated, while the CV value for P. fortuneana persistently remains at a high overestimation level.

3.2. Calibration of Parameters in Granier’s Formula

The parameters of α and β in Granier’s formula were calibrated by fitting FC and synchronous K values for each species (Table 2). The fitted formulae for all species showed high accuracy (R2 ≥ 0.8), but there was a large variation in the corrected coefficients, with coefficients α and β varying from 0.0047 to 0.0509 g·cm−2·s−1 and from 0.5882 to 3.0391, respectively.
The corrected formula coefficients α and β of P. championii (vine) were the largest among all species, which were 4.2 and 2.5 times Granier’s original α and β, respectively. In contrast, the corrected α and β of P. ramosissimus (semi-ring-porous) were the lowest among all species, equal to or less than half of Granier’s original coefficients. The determination coefficients (R2s) from validation were higher than 0.9 for the species of C. sinensis, T. sebifera, P. fortuneana, and S. thea (Table 2).

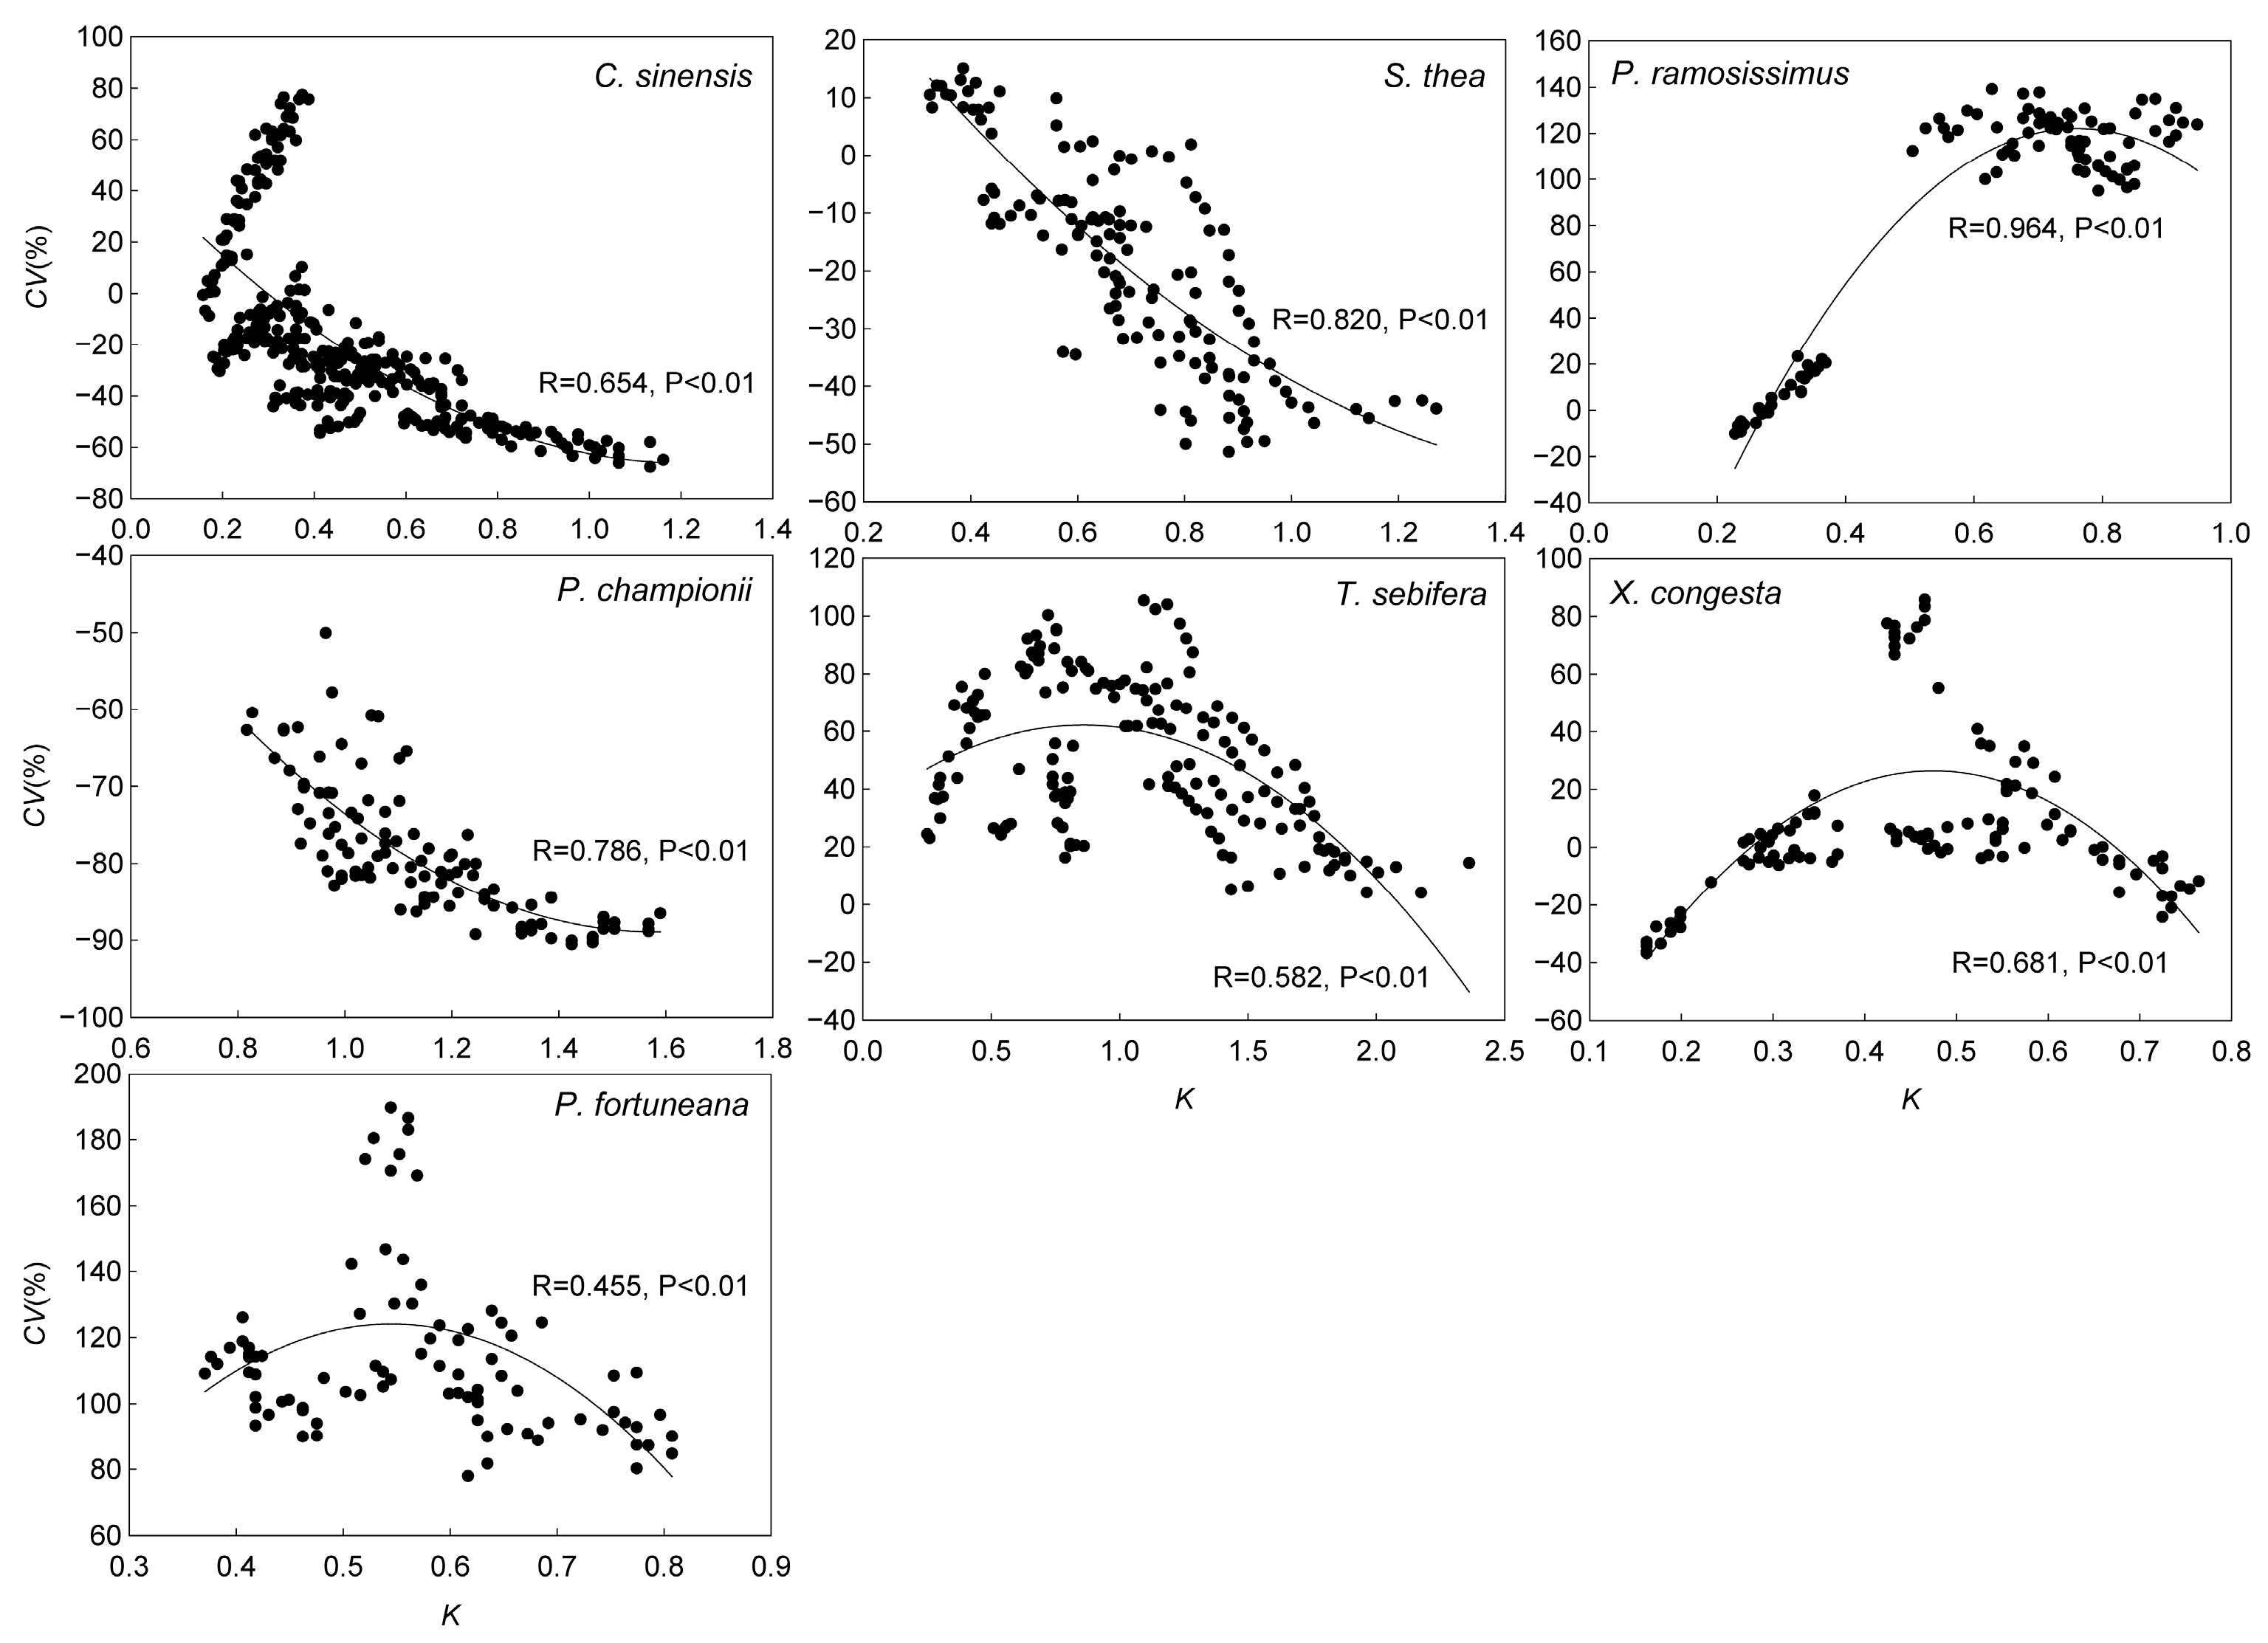
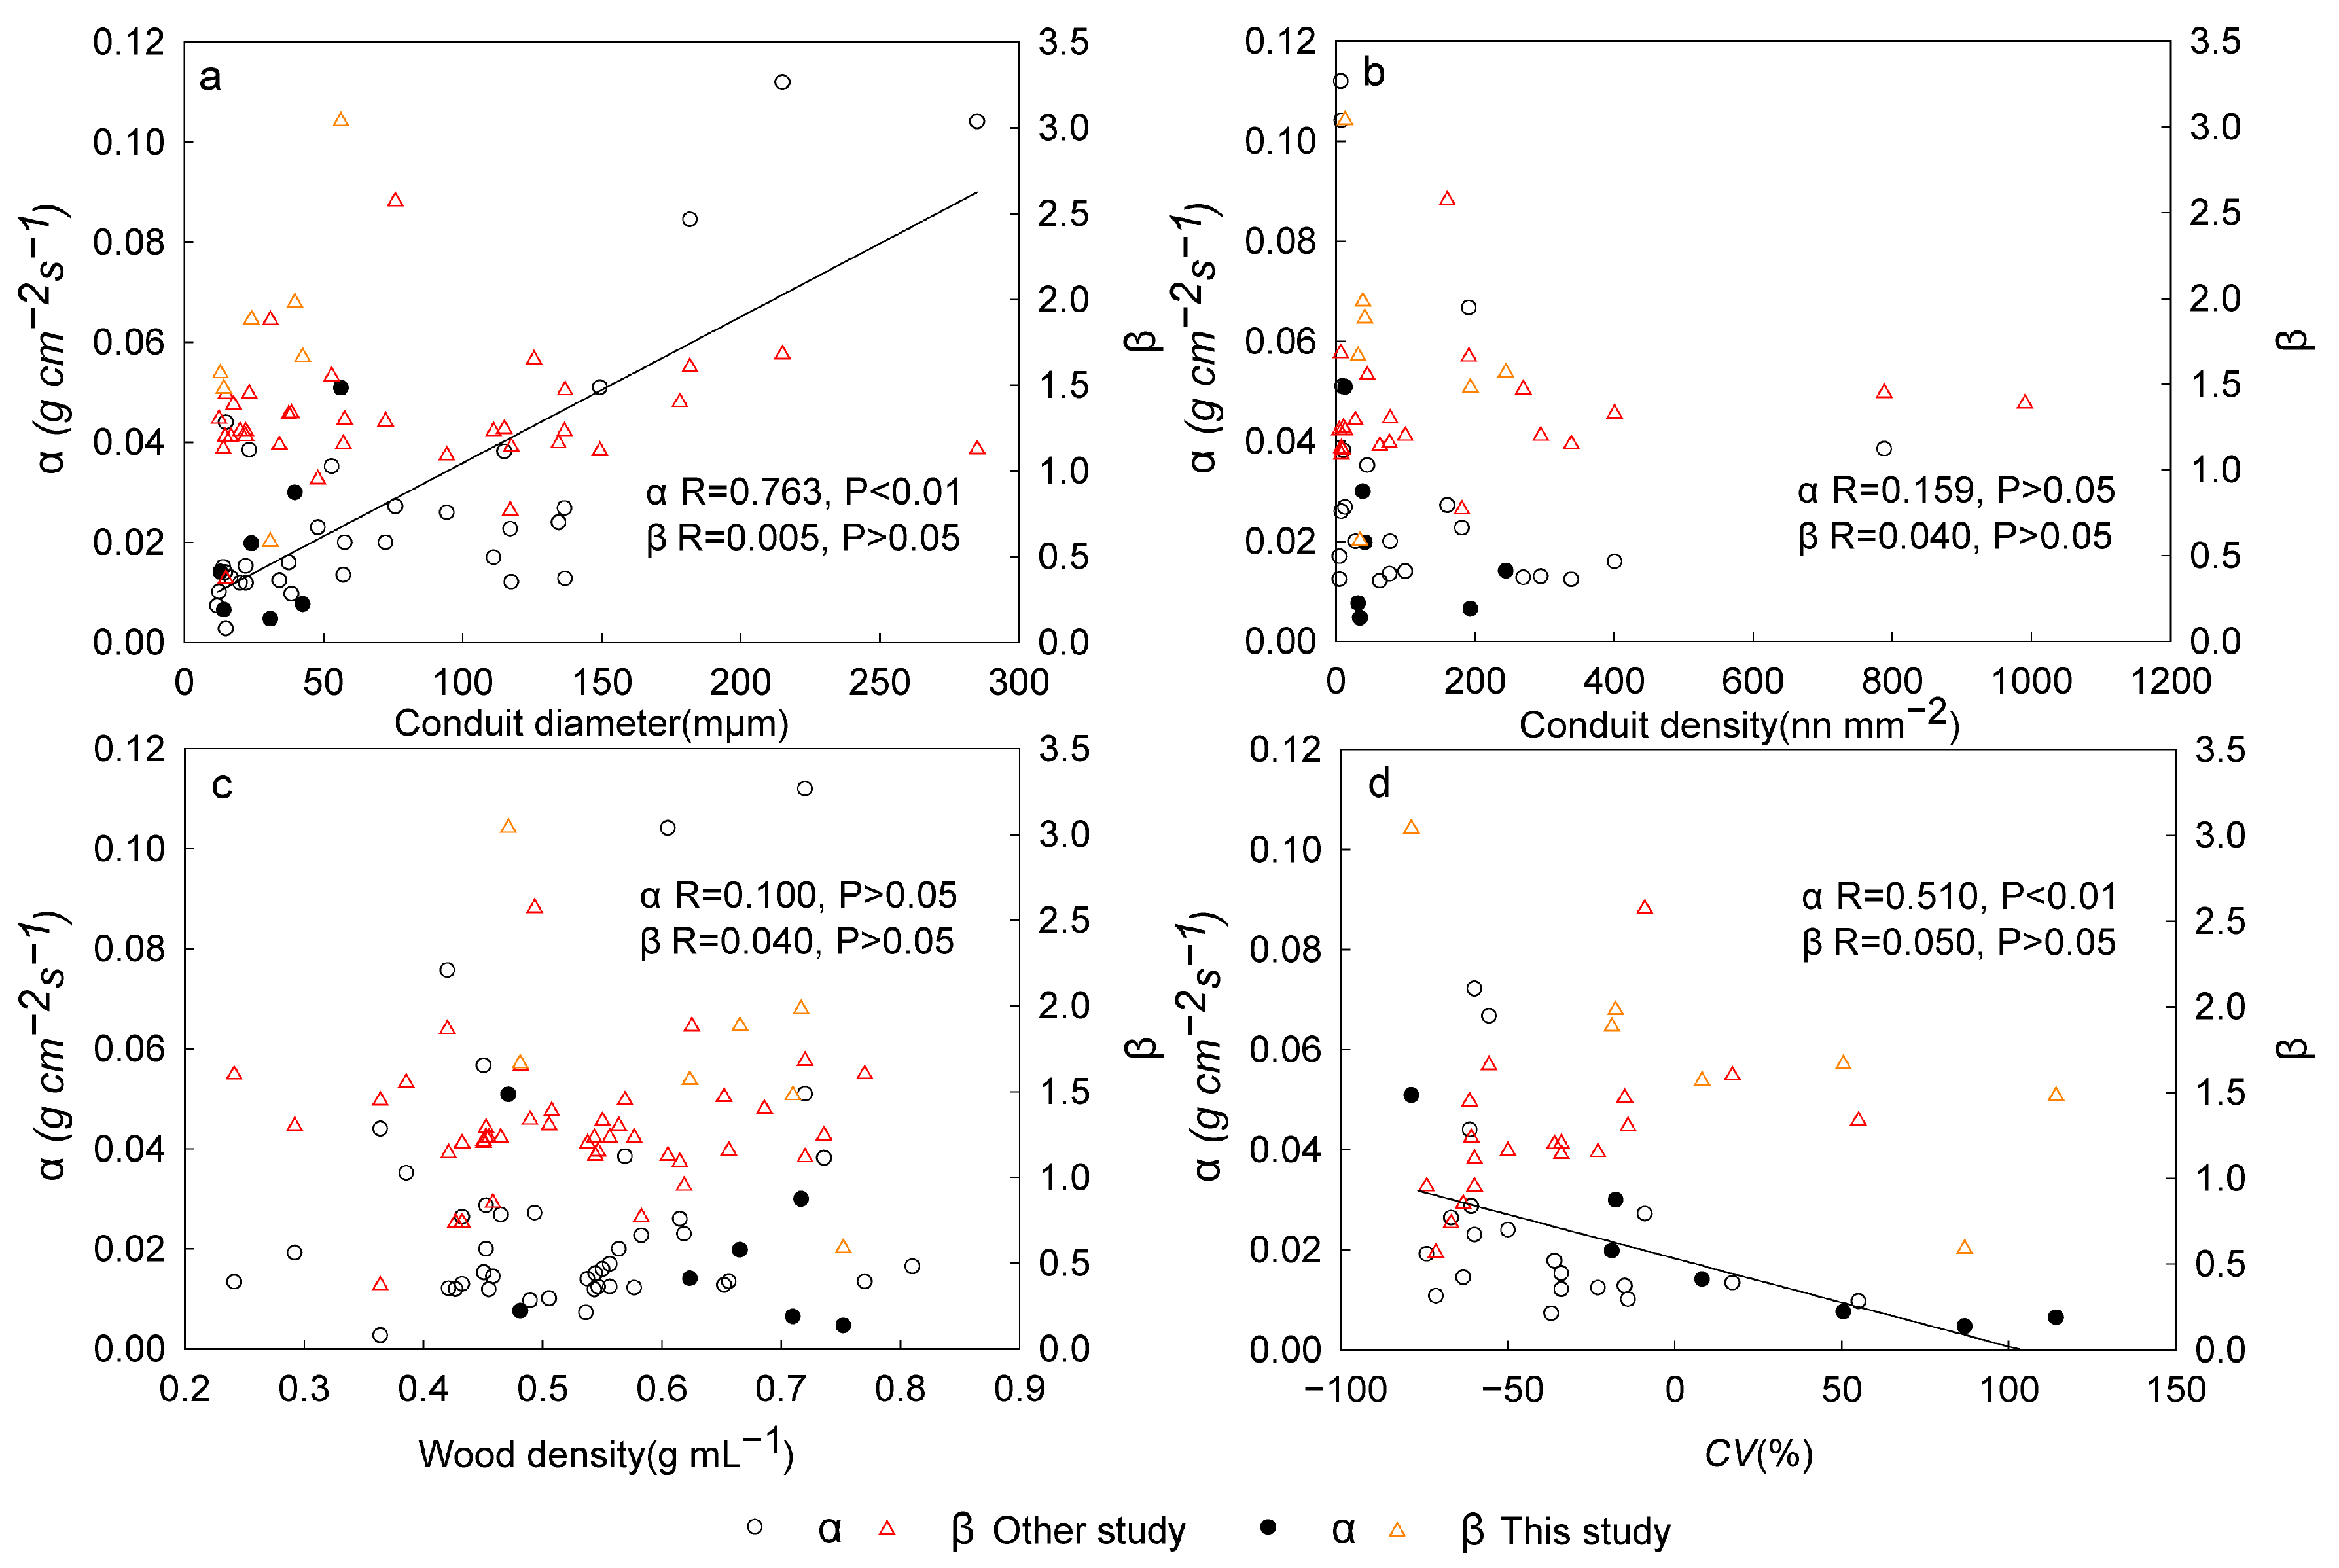
3.3. Correlation between Wood Structure, CV, and Calibrated Coefficient in Grainer’s Formula

Based on the data measured in this study and collected from published papers (Figure 3), the calibrated coefficients (α and β) in Grainer’s formula showed no significant correlation with the wood structure parameters (p > 0.05) except the correlation between conduit diameter and α, where the calibrated α increased linearly with the conduit diameter (p < 0.01). In addition, there is a significant correlation between CV and calibrated α (p < 0.01).

4. Discussion

4.1. The Impact of Non-Calibration on the Estimation of Sap Flow Density

The widespread application of the TDP method for measuring sap flow density in trees has revealed limitations in the suitability of the original empirical formula for different tree species. Consequently, underestimations or overestimations of actual sap flow density have been observed in various studies. For example, when comparing three thermal techniques, including Granier’s formula, Steppe et al. [34] observed a 60% underestimation in sap flow density in Fagus grandifolia. Similarly, Zhang et al. [32] noted an approximate 36% underestimation in Bambusa chungii when using Granier’s original formula to calculate sap flow density. Sun et al. [16] found a 34% underestimation in Populus dehoides and a 55% overestimation in Pinus taeda when applying Granier’s original formula to the thermal dissipation technique. In a study by Fuchs et al. [35] involving Fagus sylvatica, Tilia cordata, and Acer pseudoplatanus, the calculated sap flow densities using Granier’s original formula were found to underestimate accurate sap flow densities by 23% to 45%, with the error increasing as the sap flow density increased. Validating these findings in a degraded karst region with the main tree species of shrub communities, FG exhibited significant errors ranging from −78.9% to 114.2% compared to FC. Hence, validating Granier’s original formula for each tree species is imperative to ensure measurement accuracy [49]. Although not all sap flow applications necessitate absolute water use estimates, calibration can also yield benefits. One of the hypotheses in comparing relative sap flow among trees is that the error is constant in simple trees. However, the sap flow error varies with the sap flow rate, as found in this study (Figure 1). Considering the natural variation in sap flow under fluctuating environmental drivers, the calibration of Granier’s formula can alter the pattern of relative sap flow and lead to different results when comparing water use among trees, even if they belong to the same species and are of a similar age, size, and growing environment.

4.2. Differences before and after Calibration of the Sap Flow Formula

The calibration coefficients for sap flow estimation vary considerably among different tree species. For instance, in the case of diffuse-porous species like Populus tomentosa and Salix babylonica, the correction equations were Fd = 0.0287 K1.236 and Fd = 0.0145 K0.852, respectively [15]. In the case of ring-porous species such as R. pseudoacacia, α values of 0.270 and 0.389 were observed, along with β values closer to 1.231 [7]. Conifers like C. japonica and Chamaecyparis obtusa exhibited α values of 0.01197, which were relatively similar to the original coefficients, while the β value of 0.737 was smaller than the original coefficient [47]. For vine species, such as Anodendron affine, Lonicera affinis, and Trachelospermum asiaticum, the calibration equation parameters were α = 0.0457 and β = 1.83 [17]. In this study (Table 1 and Table 2), the calibration coefficients showed that for ring-porous species, they were larger than the original equation. In contrast, for semi-ring-porous species like X. congesta, the calibration coefficients were closer to the original equation. In the case of diffuse-porous species, the calibration coefficients were less different from the original equation. These variations in calibration coefficients suggest differences in wood characteristics, such as the distribution uniformity of microstructures in the sapwood cross-section, duct size, and efficiency of duct moisture transfer [7,15,17,47].
The bias observed in Granier’s original formula for sap flow estimation varies with the sap flow density, but the specific trend is inconsistent across different tree species. Various studies have reported different patterns of bias as the sap flow density increases. Some studies have observed an increasing bias, while others have found a decreasing bias, a decreasing bias followed by an increasing bias, or little change in the degree of bias [13,14,25,33,35]. The pattern of change in the difference between the estimates of sap flow density using Granier’s original formula and the calibrated formula was inconsistent across species. For T. sebifera, the deviation in sap flow estimation initially increased and then decreased as the sap flow density increased. On the other hand, for X. congesta, the deviation in sap flow density estimation showed only slight changes. The deviation in sap flow estimation for the remaining species gradually increased with increasing sap flow density. These findings highlight the importance of considering the specific characteristics of each tree species and their corresponding sap flow densities when using Granier’s original formula. Calibration or adjustment of the formula might be necessary to improve accuracy in sap flow estimation.

4.3. Correlation between Wood Structure, CV, and Calibrated Coefficient in Grainer’s Formula

The wood structural characteristics of trees play a significant role in determining the potential for trunk sap flow [13,50]. The heat dissipation pattern of TDP sensors is also strongly influenced by wood structural characteristics [51]. The coefficients α and β are the fit coefficients of the regression equation between the measured values of FC and the temperature difference coefficient K. Different species or different individuals of the same species can affect the diffusion of probe heat due to differences in wood properties (conduit diameter, conduit density, and conduit distribution) [25], which, in turn, can cause changes in ΔT dynamics and, ultimately, lead to different calibration results. In this study, the calibration coefficient was positively correlated with the conduit diameter but significantly correlated with the coefficient α and not with the coefficient β. This may be due to the small specificity of coefficient β. There also showed an extensive range of variation in coefficient α and a slight variation in coefficient β [7,21,22,24]. Furthermore, it has been observed that the CV exhibits a significantly negative correlation with coefficient α, whereas its correlation with β remains insignificant. This suggests that appropriate adjustments to α can effectively enhance the formula’s estimation accuracy. The calibration coefficients were negatively correlated with conduit density, but the correlations were insignificant. This suggests that there is no clear correlation between wood characteristics such as wood density and correction coefficients [46], and that this result may be due to the limited number of samples from different wood types or the low specificity of the parameters between other tree species.
According to the Hagen–Poiseuille law, conduit size is an important factor affecting sap flux density [50]. Yi and Xu’s [33] study found that the calibration coefficient of the Granier equation changes with the vessel area. This study has similar results. Shinohara et al. [47] demonstrated variations in the estimation parameters of C. japonica and C. obtusa across different sizes and regions. Therefore, applying the sap flow density correction factor of a smaller tree species to an individual of the same size in a larger tree species or a different region may also cause uncertain errors. This study focused on a limited number of samples and small-diameter karst shrub communities, with a probe length of only 10 mm, and the applicability of the results for the same species to other growth environments and more prominent individuals is not yet known. Furthermore, distinct research methods revealed varying error trends for different wood species [16,18]. There are some fundamental differences in calibration approaches, including water movement through the xylem (i.e., negative vs. positive pressure) and calibration material (i.e., intact trees, stems with foliage, and stem segments). Still, there is not enough data to determine fully how these differences may affect coefficients and subsequent water use estimates [35,52]. Subsequent studies can be conducted on the same species in different growth environments and individuals of different sizes to investigate the effects of probe length, conduit size, conduit density, and radial variation in sapwood on the sap flow correction formulae to obtain more systematic correction results.

5. Conclusions

Our findings indicate that the values of FG showed varying degrees of overestimation or underestimation compared to the measured values of FC. The errors ranged from −78.9% to 114.2%, highlighting the unavailability of Granier’s original formula in the transpiration estimation of the karst shrub community and the necessity of calibration before accurate estimation. To address this, the coefficients α and β in Granier’s formula were corrected in seven typical species of karst shrub communities in southern China. The corrected values for α ranged from 0.0047 to 0.0509 g·cm−2·s−1, while the corrected values for β ranged from 0.5882 to 1.9821. These corrected Granier’s formulas showed good performance and led to an obvious improvement in the accuracy of sap flow estimation, highlighting the applicability of the TDP method in measuring the transpiration of the shrub community following calibration. Furthermore, a significant correlation between the wood conduit diameter and the calibration coefficient α was found in this study, suggesting the diameter of wood conduits plays a substantial role in determining the sensitive coefficient of Granier’s formula. As a result, it is essential to verify the applicability of Granier’s original equation when estimating transpirational water consumption in woody plants, especially when the wood structure (such as the conduit diameter) of the studied species varies considerably from that of the species in which Granier’s original equation established. Whether the calibrated Granier formula and the relationship between the wood conduit diameter and coefficient α found in this study are suitable for other environments needs more study in the future. The results found in this study broadened the applicability of the TDP method in transpiration measurement in shrub communities. Considering water shortage is the main factor limiting plant growth and community succession in degraded karst and other drought ecosystems, this study is also helpful for comprehending the water use strategies of plants in such environments and further analyzing the role of shrubs in the water cycle of drought-prone ecosystems.

Supplementary Materials

The following supporting information can be downloaded at: https://www.mdpi.com/article/10.3390/f15020259/s1, Table S1: The material information of Figure 3 [53,54].

Author Contributions

Conceptualization, D.G.; methodology, D.G. and J.Q.; validation, Y.T. and S.L.; formal analysis and investigation, J.Q. and L.N.; resources, Q.H.; writing—original draft preparation, J.Q.; writing—review and editing, D.G. and K.Y. All authors have read and agreed to the published version of the manuscript.

Funding

This study is supported by the National Nature Science Foundation of China (32060243, 41830648, 31870382); the Fund of Guangxi Key Laboratory of Plant Conservation and Restoration Ecology in Karst Terrain (KZ2023-6, 19-A-04-03, 20-065-7); the Guangxi Academy of Sciences Gui Scientist Launch Project (CQZ-E-1918); and the Guangxi Scientific and Technological Project (AD20159086).

Data Availability Statement

The datasets generated during and/or analyzed during the current study are available from the corresponding author on reasonable request.

Conflicts of Interest

The authors declare no conflicts of interest. The funders had no role in the design of the study; in the collection, analyses, or interpretation of data; in the writing of the manuscript; or in the decision to publish the results.

References

  1. Dix, M.J.; Aubrey, D.P. Recalibrating best practices, challenges, and limitations of estimating tree transpiration via sap flow. Curr. For. Rep. 2021, 7, 31–37. [Google Scholar] [CrossRef]
  2. Hu, M.; Ma, C.; Zhang, J.; Ma, Y.; Li, C.; Xiong, W. Calibration of Thermal Dissipation Probes for Xylem Sap Flow in the Wood of a Diffuse-Porous and a Conifer Species under Cyclic Heating. Forests 2022, 13, 1964. [Google Scholar] [CrossRef]
  3. Chapin, F.S.; Matson, P.A.; Vitousek, P. Principles of Terrestrial Ecosystem Ecology; Springer: New York, NY, USA, 2011. [Google Scholar]
  4. Link, R.M.; Fuchs, S.; Aguilar, D.A.; Leuschne, C.; Ugalde, M.C.; Otarola, J.C.V.; Schuldt, B. Tree height predicts the shape of radial sap flow profiles of Costa-Rican tropical dry forest tree species. Agric. Forest Meteorol. 2020, 287, 107913. [Google Scholar] [CrossRef]
  5. Dix, M.J.; Aubrey, D.P. Calibration approach and range of observed sap flow influences transpiration estimates from thermal dissipation sensors. Agric. Forest Meteorol. 2021, 307, 108534. [Google Scholar] [CrossRef]
  6. Fujime, N.; Kumagai, T.; Egusa, T.; Momiyama, H.; Uchiyama, Y. Importance of calibration in determining forest stand transpiration using the thermal dissipation method. Agric. Forest Meteorol. 2021, 301, 108356. [Google Scholar] [CrossRef]
  7. Schwärzel, K.; Zhang, L.; Strecker, A.; Podlasly, C. Improved Water Consumption Estimates of Black Locust Plantations in China’s Loess Plateau. Forests 2018, 9, 201. [Google Scholar] [CrossRef]
  8. Granier, A. Une nouvelle méthode pour la mesure du flux de sève brute dans le tronc des arbres. Ann. Des Sci. For. 1985, 42, 193–200. [Google Scholar] [CrossRef]
  9. Granier, A. Sap flow measurements in Douglas-fir tree trunks by means of a new thermal method. Ann. Des Sci. For. 1987, 44, 1–14. [Google Scholar] [CrossRef]
  10. Pasqualotto, G.; Carraro, V.; Menardi, R.; Anfodillo, T. Calibration of Granier-Type (TDP) Sap Flow Probes by a High Precision Electronic Potometer. Sensors 2019, 19, 2419. [Google Scholar] [CrossRef]
  11. Zeng, X.; Xu, X.; Zhong, F.; Xu, T.; Luo, W.; Yi, R.; Li, X. Use of gravimetric measurements to calibrate thermal dissipation probes with stem segments. Hydrol. Process. 2022, 36, e14478. [Google Scholar] [CrossRef]
  12. Ma, Y.; Wu, P.; Wang, X.; Wu, P.; Wang, X.; Zhang, J.; Yin, C.; Ma, C. Adaptability of Granier empirical formula in sap flow measurement of Populus tomentosa based on whole tree weighing method. Chin. J. Appl. Ecol. 2020, 31, 1518–1524. [Google Scholar]
  13. Ma, Y.; Li, C.; Wu, P.; Yin, C.; Ma, C. Correction of Granier’s original formula coefficient for calculating sap flow based on the measured transpiration rate of Ulmus pumila. Sci. Silvae Sin. 2020, 56, 179–185. [Google Scholar]
  14. Ma, C.; Zhang, H.; Han, Y.; Meng, Q.; Zhang, J.; Ma, Y. Error and correction formula of granier’ s original formula to calculate the stem sap flux density of clone 107 poplar. Sci. Silvae Sin. 2021, 57, 161–169. [Google Scholar]
  15. Liu, Y.; Zhang, H.; Ma, C.; Liu, B.; Ding, C. Verification of sap flow characteristics and measurement errors of Populus tomentosa Carr. and Salix babylonica L. based on the sap level equilibrium method. Front. Plant Sci. 2022, 13, 946804. [Google Scholar] [CrossRef]
  16. Sun, H.; Aubrey, D.P.; Teskey, R.O. A simple calibration improved the accuracy of the thermal dissipation technique for sap flow measurements in juvenile trees of six species. Trees 2012, 26, 631–640. [Google Scholar] [CrossRef]
  17. Ichihashi, R.; Chiu, C.W.; Komatsu, H.; Kume, T.; Shinohara, Y.; Tateishi, M.; Tsuruta, K.; Otsuki, K. Contribution of lianas to community-level canopy transpiration in a warm-temperate forest. Funct. Ecol. 2017, 31, 1690–1699. [Google Scholar] [CrossRef]
  18. Bush, S.E.; Hultine, K.R.; Sperry, J.S.; Ehleringer, J.R. Calibration of thermal dissipation sap flow probes for ring-and diffuse-porous trees. Tree Physiol. 2010, 30, 1545–1554. [Google Scholar] [CrossRef]
  19. Hultine, K.R.; Nagler, P.L.; Morino, K.; Bus, S.E.; Burtch, K.G.; Dennison, P.E.; Glenn, E.P.; Ehleringe, J.R. Sap flux-scaled transpiration by tamarisk (Tamarix spp.) before, during and after episodic defoliation by the saltcedar leaf beetle (Diorhabda carinulata). Agric. Forest Meteorol. 2010, 150, 1467–1475. [Google Scholar] [CrossRef]
  20. Peters, R.L.; Fonti, P.; Frank, D.; Poyatos, R.; Pappas, C.; Kahmen, A.; Carraro, V.; Prendin, A.L.; Schneider, L.; Baltzer, J.L.; et al. Quantification of uncertainties in conifer sap flow measured with the thermal dissipation method. New Phytol. 2018, 219, 1283–1299. [Google Scholar] [CrossRef]
  21. Alla, F.; Jdaini, K.; M’hamdi, H.; Mechchate, H.; AlZain, M.N.; Alzamel, N.M.; Noman, O.; Mimouni, J.; Elhoumaizi, M.A. Calibration of Thermal Dissipation Probes for Date Palm (Phoenix dactylifera L.). Horticulturae 2022, 8, 107. [Google Scholar] [CrossRef]
  22. Iida, S.; Takeuchi, S.; Shinozaki, K.; Araki, M. Calibration of sap flow techniques using the root-ball weighing method in Japanese cedar trees. Trees 2022, 36, 1747–1759. [Google Scholar] [CrossRef]
  23. Niu, F.; Röll, A.; Hardanto, A.; Meijide, A.; Köhler, M.; Hendrayanto; Hölscher, D. Oil palm water use: Calibration of a sap flux method and a field measurement scheme. Tree Physiol. 2015, 35, 563–573. [Google Scholar] [CrossRef]
  24. Ma, C.; Luo, Y.; Shao, M.; Sun, L.; Jia, X. Environmental controls on sap flow in black locust forest in Loess Plateau, China. Sci. Rep. 2017, 7, 13160. [Google Scholar] [CrossRef] [PubMed]
  25. Xie, J.; Wan, X. The accuracy of the thermal dissipation technique for estimating sap flow is affected by the radial distribution of conduit diameter and density. Acta Physiol. Plant. 2018, 40, 88. [Google Scholar] [CrossRef]
  26. Siddiq, Z.; Tomlinson, K.W.; Zhu, S.D.; Cao, K.F. Does fluctuation of meteorological conditions across years influence stand transpiration of Tectona grandis plantation? Ecohydrology 2019, 12, e2116. [Google Scholar] [CrossRef]
  27. Song, L.; Zhu, J.; Zheng, X.; Wan, K.; Zhang, J.; Hao, G.; Wang, G.; Liu, J. Comparison of canopy transpiration between Pinus sylvestris var. mongolica and Pinus tabuliformis plantations in a semiarid sandy region of Northeast China. Agric. Forest Meteorol. 2022, 314, 108784. [Google Scholar] [CrossRef]
  28. Liu, J.; Shen, L.; Wang, Z.; Duan, S.; Wu, W.; Peng, X.; Wu, C.; Jiang, Y. Response of plants water uptake patterns to tunnels excavation based on stable isotopes in a karst trough valley. J. Hydrol. 2019, 571, 485–493. [Google Scholar] [CrossRef]
  29. Liu, M.; Xu, X.; Wang, D.; Sun, A.Y.; Wang, K. Karst catchments exhibited higher degradation stress from climate change than the non-karst catchments in southwest China: An ecohydrological perspective. J. Hydrol. 2016, 535, 173–180. [Google Scholar] [CrossRef]
  30. Lu, T.; Jiang, Y.; Wu, Z.; Mao, Y.; Qiu, J.; Wu, C. Transpiration characteristies of typical evergreen and deciduous tree species in subtropical karst areas and their responses to environmental factors. Acta Ecol. Sin. 2022, 42, 1047–1058. [Google Scholar]
  31. Zeng, X.; Xu, X.; Yi, R.; Zhong, F.; Zhang, Y. Sap flow and plant water sources for typical vegetation in a subtropical humid karst area of southwest China. Hydrol. Process. 2021, 35, e14090. [Google Scholar] [CrossRef]
  32. Zhang, Z.; Zhou, J.; Zhao, P.; Zhao, X.; Zhu, L.; Ouyang, L.; Ni, G. Validation and in situ application of a modified thermal dissipation probe for evaluating standing water use of a clumped bamboo: Bambusa chungii. Agric. Forest Meteorol. 2017, 239, 15–23. [Google Scholar] [CrossRef]
  33. Yi, R.; Xu, X. Species with larger vessel area have higher bias for the original Granier equation in calculating sap flux density. J. Hydrol. 2023, 622, 129762. [Google Scholar] [CrossRef]
  34. Steppe, K.; De Pauw, D.J.; Doody, T.M.; Teskey, R.O. A comparison of sap flux density using thermal dissipation, heat pulse velocity and heat field deformation methods. Agric. For. Meteorol. 2010, 150, 1046–1056. [Google Scholar] [CrossRef]
  35. Fuchs, S.; Leuschner, C.; Link, R.; Coners, H.; Schuldt, B. Calibration and comparison of thermal dissipation, heat ratio and heat field deformation sap flow probes for diffuse-porous trees. Agric. Forest Meteorol. 2017, 244, 151–161. [Google Scholar] [CrossRef]
  36. Cabibel, B.; Do, F.; Horoyan, J. Mesures thermiques des flux de sève dans les troncs et les racines et fonctionnement hydrique des arbres. I. Analyse théorique des erreurs sur la mesure des flux et validation des mesures en présence de gradients thermiques extérieurs. Agronomie 1991, 11, 669–678. [Google Scholar] [CrossRef]
  37. Gutiérrez, M.V.; Santiago, L.S. A comparison of sap flow measurements and potometry in two tropical lowland tree species with contrasting wood properties. Rev. De Biol. Trop. 2006, 54, 73–81. [Google Scholar] [CrossRef]
  38. Herbst, M.; Roberts, J.M.; Rosier, P.T.W.; Gowing, D.J. Seasonal and interannual variability of canopy transpiration of a hedgerow in southern England. Tree Physiol. 2007, 27, 321–333. [Google Scholar] [CrossRef]
  39. Hubbard, R.M.; Stape, J.; Ryan, M.G.; Almeida, A.C.; Rojas, J. Effects of irrigation on water use and water use efficiency in two fast growing Eucalyptus plantations. For. Ecol. Manag. 2010, 259, 1714–1721. [Google Scholar] [CrossRef]
  40. Kattge, J.; Díaz, S.; Lavorel, S.; Prentice, I.C.; Leadley, P.; Bönisch, G.; Garnier, E.; Westoby, M.; Reich, P.B.; Wright, I.J.; et al. TRY-a global database of plant traits. Glob. Chang. Biol. 2011, 17, 2905–2935. [Google Scholar] [CrossRef]
  41. Lu, P. Whole-plant water use of some tropical and subtropical tree crops and its application in irrigation management. Acta Hortic. 2002, 575, 781–789. [Google Scholar] [CrossRef]
  42. Paudel, I.; Kanety, T.; Cohen, S. Inactive xylem can explain differences in calibration factors for thermal dissipation probe sap flow measurements. Tree Physiol. 2013, 33, 986–1001. [Google Scholar] [CrossRef] [PubMed]
  43. Renninger, H.J.; Phillips, N.; Salvucci, G.D. Wet-vs. dry-season transpiration in an Amazonian rain forest palm Iriartea deltoidea. Biotropica 2010, 42, 470–478. [Google Scholar] [CrossRef]
  44. Rubilar, R.A.; Hubbard, R.M.; Yañez, M.A.; Medina, A.M.; Valenzuela, H.E. Quantifying differences in thermal dissipation probe calibrations for Eucalyptus globulus species and E. nitens × globulus hybrid. Trees 2017, 31, 1263–1270. [Google Scholar] [CrossRef]
  45. Schmidt-Walter, P.; Richter, F.; Herbst, M.; Schuldt, B.; Lamersdorf, N.P. Transpiration and water use strategies of a young and a full-grown short rotation coppice differing in canopy cover and leaf area. Agric. For. Meteorol. 2014, 195, 165–178. [Google Scholar] [CrossRef]
  46. Sérvulo, A.C.O.; Vellame, L.M.; Casaroli, D.; Júnior, J.A.; Souza, P.H. African Mahogany transpiration with Granier method and water table lysimeter. Rev. Bras. De Eng. Agrícola E Ambient. 2017, 21, 322–326. [Google Scholar] [CrossRef]
  47. Shinohara, Y.; Iida, S.; Oda, T.; Katayama, A.; Tsuruta, K.; Sato, T.; Tanaka, N.; Su, M.P.; Laplace, S.; Kijidani, Y.; et al. Are calibrations of sap flow measurements based on thermal dissipation needed for each sample in Japanese cedar and cypress trees? Trees 2022, 36, 1219–1229. [Google Scholar] [CrossRef]
  48. Vellame, L.M.; Coelho Filho, M.A.; Paz, V.P.S. Transpiração em mangueira pelo método Granier. Rev. Bras. Eng. Agrícola Ambient. 2009, 13, 516–523. [Google Scholar] [CrossRef]
  49. Smith, D.M.; Allen, S.J. Measurement of sap flow in plant stems. J. Exp. Bot. 1996, 47, 1833–1844. [Google Scholar] [CrossRef]
  50. Tyree, M.T.; Zimmermann, M.H. Xylem Structure and the Ascent of Sap; Springer Science and Business Media: Berlin/Heidelberg, Germany, 2013. [Google Scholar]
  51. Wullschleger, S.D.; Childs, K.W.; King, A.W.; Hanson, P.J. A model of heat transfer in sapwood and implications for sap flux density measurements using thermal dissipation probes. Tree Physiol. 2011, 31, 669–679. [Google Scholar] [CrossRef]
  52. Flo, V.; Martinez-Vilalta, J.; Steppe, K.; Schuldt, B.; Poyatos, R. A synthesis of bias and uncertainty in sap flow methods. Agric. Forest Meteorol. 2019, 271, 362–374. [Google Scholar] [CrossRef]
  53. Hadiwijaya, B.; Pepin, S.; Isabelle, P.E.; Nadeau, D.F. The dynamics of transpiration to evapotranspiration ratio under wet and dry canopy conditions in a humid boreal forest. Forests 2020, 11, 237. [Google Scholar] [CrossRef]
  54. Ouyang, S.; Xiao, K.; Zhao, Z.; Xiang, W.; Xu, C.; Lei, P.; Deng, X.; Li, J. Stand transpiration estimates from recalibrated parameters for the granier equation in a Chinese Fir (Cunninghamia lanceolata) plantation in southern China. Forests 2018, 9, 162. [Google Scholar] [CrossRef]
Figure 1. Comparison between sap flow density of measured (FC) and calculated through Granier’s original empirical formula (FG).
Forests 15 00259 g001
Figure 2. The CV varied with the K value.
Forests 15 00259 g002
Figure 3. The relationships between calibrated coefficients (α and β) and wood structure parameters (Conduit diameter, Conduit density and Wood density, (ac) or CV (d). Note: Correlation is calculated based on the data measured in this study and collected from published papers. (see: Supplementary Table S1)
Forests 15 00259 g003
Table 1. Plant sample information.
SpeciesWood TypeSample SizePeeling Diameter (mm)DBH (mm)Tree Height (m)
C. sinensisring-porous622.1 ± 0.918.3 ± 1.52.46 ± 0.18
X. congestasemi-ring-porous419.5 ± 1.920.4 ± 1.62.78 ± 0.23
T. sebiferasemi-ring-porous420.6 ± 1.824.4 ± 2.12.44 ± 0.17
P. ramosissimussemi-ring-porous420.2 ± 1.620.1 ± 2.72.79 ± 0.67
P. fortuneanasemi-ring-porous422.1 ± 2.219.2 ± 4.72.50 ± 0.38
S. theadiffuse-porous522.4 ± 1.620.4 ± 2.02.13 ± 0.36
P. championiivine421.2 ± 1.322.7 ± 3.73.39 ± 0.92
Table 2. Formulae calibration and validation for different species.
SpeciesFd = αKβ (g·cm−2·s−1)Validation
αβR2nR2RMSEn
Granier’s Original Coefficient0.011991.231
C. sinensis0.03001.98210.9750.900.0041
X. congesta0.01411.56970.8630.640.0011
T. sebifera0.00761.66540.9530.950.0021
P. ramosissimus0.00470.58820.8130.620.0011
P. fortuneana0.00651.48020.9030.940.0001
S. thea0.01981.88440.9140.980.0021
P. championii0.05093.03910.8730.690.0371
Disclaimer/Publisher’s Note: The statements, opinions and data contained in all publications are solely those of the individual author(s) and contributor(s) and not of MDPI and/or the editor(s). MDPI and/or the editor(s) disclaim responsibility for any injury to people or property resulting from any ideas, methods, instructions or products referred to in the content.

