Article

Optimizing Pinus tabuliformis Forest Spatial Structure and Function in Beijing, China

1
School of Soil and Water Conservation, Beijing Forestry University, Beijing 100083, China
2
Beijing Municipal Forestry and Parks Bureau, Beijing 100013, China
3
General Forestry Station of Beijing Municipality, Beijing 100029, China
*
Author to whom correspondence should be addressed.
Forests 2024, 15(11), 1963; https://doi.org/10.3390/f15111963
Submission received: 27 September 2024 / Revised: 28 October 2024 / Accepted: 2 November 2024 / Published: 7 November 2024
(This article belongs to the Section Forest Ecology and Management)

Abstract

:
Enhancing forest ecological functioning by optimizing stand structure is essential in high-quality, sustainable forests. We examined this in 38 plots (20 m × 20 m) of Pinus tabuliformis forests in the mountainous area of Beijing. We investigated and analyzed the spatial structure and functional characteristics of these plots. Structural equation modeling and response surface methodology were used to identify spatial structural stand factors affecting soil nutrient levels and understory biodiversity. We examined the pathways and strengths of the coupling relationships between structure and function and the ranges and thresholds of changes in these structural factors. Mingling degree, openness degree, competition index, and forest layer index substantially affected the understory herbaceous species diversity and soil nutrient levels. Mingling degree significantly impacted understory biodiversity and soil nutrient levels (direct path coefficient (DPC), 0.48 and 0.70, respectively). Openness degree significantly affected understory species diversity (DPC, 0.37). The competition index and forest layer index exerted less significant direct impacts on these functions; competition influenced herbaceous diversity primarily indirectly. The optimal features were as follows: mingling degree, 0.8; openness degree, 1.1; competition index, 0.3; and forest layer index, 0.5. Average understory herbaceous species diversity and soil nutrient levels are projected to increase by ca. 47.74% and 52.29%, respectively, post optimization. These findings provide a reference for precise regulated stand structures and establish multifunction management optimization objectives in Beijing’s mountainous Pinus tabuliformis forests.

1. Introduction

Forest stand structure, and its complexity, are considered key drivers of various ecological processes. Stand structure directly affects a forest’s growth conditions, successional stage, and functional activity [1,2,3]. Therefore, the effective functioning of a forest is determined by its structural attributes. Forest stand structure can be categorized into spatial and non-spatial aspects. Non-spatial structure is primarily related to species composition, stand age, diameter at breast height (DBH), tree height, and stand density, reflecting the average characteristics of the stand. Spatial structure refers to the distribution and spatial arrangement of tree attributes within a forest, and is the most directly modifiable factor in target-tree management [4,5]. Zhang et al. [6] suggested that optimization of forest spatial structure and practicing multifunctional management are central to high-quality forest development. Optimizing forest structure fundamentally involves ensuring the optimal management of its spatial configuration. To achieve precise structural optimization requires thorough examination of the relationships and interactions between stand spatial structure and forest functions.
Research on forest stand spatial structure has focused primarily on two aspects, the first being the relationship between stand spatial structure and ecological functions, including its impacts on understory diversity, soil nutrients, and water conservation. Studies of structural parameters such as mingling degree and uniform angle index have revealed that variation in stand spatial structure influences understory species diversity [7] and soil nutrient levels [8,9]. Mingling degree significantly affects understory plant diversity [10] and soil nutrients [11]. The uniform angle index and mingling degree significant affect available soil nitrogen content; together with the size ratio, mingling degree notably affects the herbaceous layer’s Shannon–Wiener index [12]. Based on flux analysis, Yu et al. [13] concluded that soil nutrient levels were most strongly directly influenced by the canopy layer index and mingling degree. Nonetheless, further research is warranted to elucidate the relationship between stand spatial structure and forest ecological functioning.
The second focal point in research on forest stand spatial structure is the evaluation and optimization of the stand structure. Regarding the “Stand structure optimization objectives or evaluation criteria”, there are two directions in ecology and forestry at present: (1) One is the general standard of “different age, multiple layers, mixed” advocated by near-nature forestry. (2) Ecological function-oriented optimization of stand structure [14]. Tang et al. [15] and Hu et al. [16] pioneered the concept of structural optimization by focusing on forest spatial structures, proposing that stand structure determines forest functionality and that the natural stand structure of the target trees can be utilized directly as the optimal stand structure. They established optimization goals for stand structure based on multiplicative and divisional principles, with the general consensus being that higher mingling and openness degrees are preferable, as are lower size ratios and competition indices, and that the uniform angle index should approach 0.5. However, owing to the practical difficulty of locating ideal natural stands and variability in site conditions, climatic factors, and the ecological characteristics of the different dominant tree species across regions, the corresponding optimal stand structures also vary. Therefore, to improve forest management, it is essential to establish stand structure optimization targets guided by ecological function and tailored to site conditions and tree species.
Optimizing forest stand structure to synergistically enhance multidimensional ecological functions essentially depends on achieving a solution that is guided by ecosystem multifunctionality. To fully realize the multifunctional benefits of forests, it is essential to maintain their primary functions. Among their various ecological services, the supply of soil nutrients and maintenance of biodiversity are fundamental for the healthy and stable functioning of the entire forest ecosystem. Notably, understory herbaceous-layer biodiversity accounts for >90% of the richness within forest ecosystems and is central in seedling-regeneration in the tree layer [7] thus preventing soil erosion and promoting the cycling of soil nutrients (N, P, and K). Soil nutrients participate vitally in material and energy exchange in forest ecosystems [17]. Therefore, herbaceous diversity and soil nutrient levels are interrelated, and their synergy critically affects multifunctional forest management.
Pinus tabuliformis, a key afforestation species in northern China, has been extensively planted in the mountainous areas of Beijing since the 1960s. Owing to the initially excessive planting densities and delayed implementation of silvicultural practices, these stands commonly exhibit weak growth, simplified structure, and diminished ecological functions. In particular, the degradation of herbaceous diversity and the lack of soil nutrients are prominent problems. To address these gaps, we take the Pinus tabulaeformis plantation in the mountainous area of Beijing as our research object and examine the intrinsic relationships and mechanisms between stand spatial structure and herbaceous diversity and soil nutrients. The structural equation model is used to verify and screen out the spatial structure indicators that have the greatest impact on the two ecological functions, and the “corresponding optimal stand space” is explored by response surface analysis based on the maximum of the two ecological functions. We aimed to optimize stand spatial structure to enhance herbaceous plant biodiversity and soil nutrient levels. These findings provide theoretical reference for establishing a management target system of Pinus tabulaeformis in Beijing’s mountainous area and provide guidance to achieve more precise and multifunctional management of Pinus tabuliformis forests in the future.

2. Materials and Methods

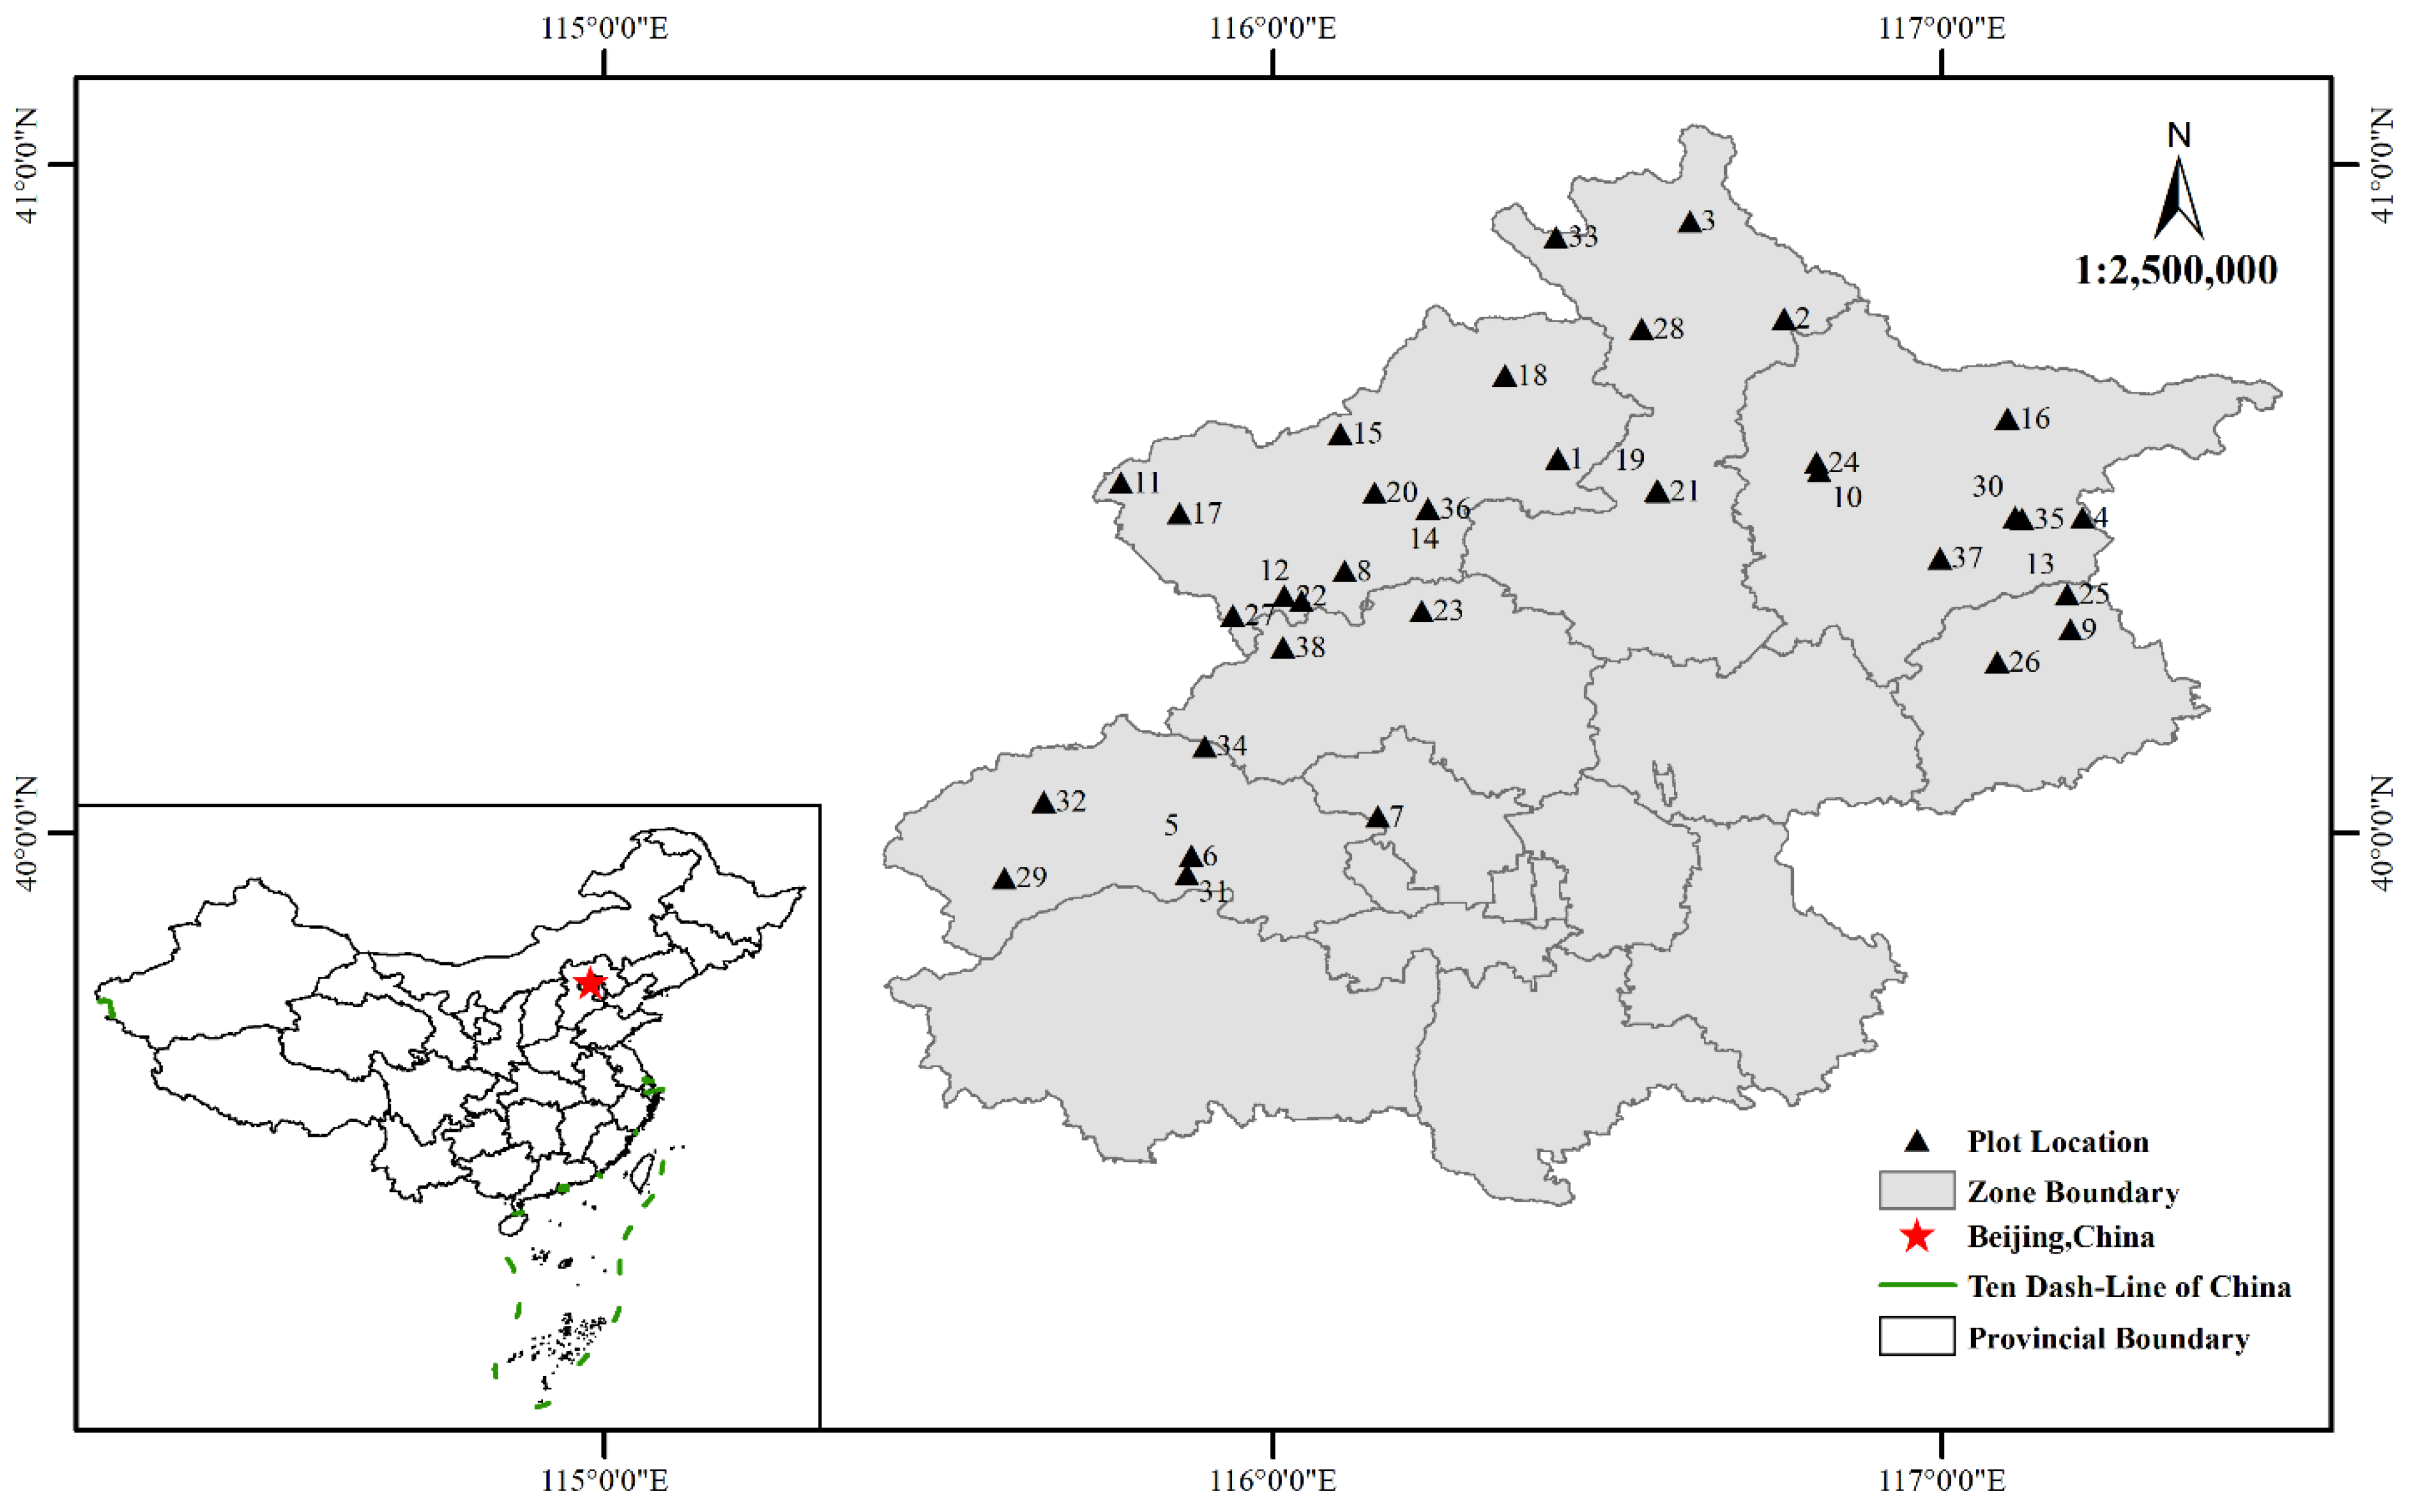
2.1. Study Area Overview

The study area is located in the mountainous areas of Beijing (Figure 1), at 39°28′–41°05′ N and 115°25′–117°30′ E. The climate is classified as warm temperate, semi-humid, and semi-arid monsoon, with distinct seasons. The annual average temperature ranges from 13 to 14 °C, with a frost-free period of 180–200 day in the lowland areas. Annual precipitation is 470–655 mm. The soil types include mountain brown soil, meadow soil, mountain-leached brown soil, and mountain common brown soil, in descending order of elevation. The predominant vegetation types are coniferous and deciduous broadleaf forests, with Pinus tabuliformis and Platycladus orientalis being the dominant species in the coniferous forests. The Pinus tabuliformis forest is an artificial forest with mountain brown soil. The main tree species include Armeniaca sibirica, Quercus mongolica, and Robinia pseudoacacia. The understory herbaceous plants primarily include Artemisia stechmanniana, Cleistogenes caespitosa, Chrysanthemum chanetii, Carex rigescens, Potentilla chinensis, and Selaginella sinensis.

2.2. Sample Plot Settings

Based on second-level forest inventory data for Beijing and considering the representativeness and uniformity of the Pinus tabuliformis distribution in mountainous regions, 38 standard 20 m × 20 m plots were selected within the study area. The plots were chosen because of their uniform site conditions (with similar stand density, at 700–1300 stems per hectare) and minimal human disturbance. In this study, the age stage of the trees in the 38 plots mainly concentrated in the middle age and near-mature forests, and a small number of young forests and mature forest (less than 20%). We recorded data on the terrain in each plot, including elevation, slope, and aspect. Trees within each plot were individually measured and factors including species composition, diameter at breast height (DBH), tree height, and tree coordinates were recorded. Within each plot, five 1 m × 1 m plots of the herbaceous understory were established at the corners and center of the larger plot to record species diversity. Soil samples were collected from three locations in each plot. The basic data for the sampling plots are summarized in Table 1.

2.3. Research Methods

2.3.1. Stand Structure Parameters

Stand spatial structural parameters were calculated from the coordinates and DBH of the trees in the sample plots, using the Winklemass 1.0 package and Excel 2016 (Microsoft, Redmond, WA, USA) [18]. The parameters are described and calculated as follows:
1.
The uniform angle index reflects the horizontal spatial distribution of the trees [19], as follows:
W i = 1 n j = 1 n Z i j
where Wi is the uniform angle of the target tree i and n is the number of adjacent trees. When the angle of the adjacent trees is less than the standard angle (360°/[n + 1]), Zij = 1; otherwise, Zij = 0.
2.
The neighborhood comparison index reflects the degree of differentiation of a target tree (in terms of factors such as DBH, tree height, and crown width) [20], as follows:
U i = 1 n j = 1 n K i j
where Ui is the neighborhood comparison index of target tree i and n is the number of adjacent trees. When the DBH of target tree i is smaller than that of the adjacent tree j, Kij = 0; otherwise, Kij = 1.
3.
The mingling degree reflects the degree of isolation among the trees [21], as follows:
M i = 1 n j = 1 n V i j
where Mi is the mingling degree of target tree i and n is the number of adjacent trees. When the target tree i is not of the same species as the adjacent tree j, Vij = 1; otherwise, Vij = 0.
4.
The openness degree reflects the light-transmission conditions in the forest [22], as follows:
K i = 1 n j = 1 n D i j H i j
where Ki is the openness degree of the target tree i, and n is the number of adjacent trees. Dij is the horizontal distance between object tree i and adjacent tree j, and Hij is the height of adjacent tree j.
5.
The competition index, which reflects the relationship between individual tree growth and spatial occupation, utilizes Hegyi’s diameter–distance competition index [23], as follows:
C I i = n = 1 n i d j d i × L i j
where C I i is the competition index of the target tree, di represents the DBH of the target tree, dj is the DBH of its immediate neighbors, d i × L i j is the distance between i and j, and ni is the number of trees adjacent to the target tree i.
6.
The forest layer index represents the structural vertical complexity of a stand [24], as follows:
S i = c i 3 · 1 n j = 1 n S i j
where S i is the forest layer index of the target tree, c i is the number of forest layers of target tree i, and S i j is the value of the forest layer. When target tree i and the adjacent tree j do not belong to the same layer, S i j = 1; otherwise, S i j = 0.

2.3.2. Understory Herbaceous Plant Diversity Indices

The Gleason, Simpson, Shannon–Wiener, Margalef richness, and Pielou evenness indices were selected to reflect the species diversity of the understory herbaceous plants [25]. These are calculated as follows:
  • Gleason index:
    D = S l n A
  • Margalef richness index:
    R = S 1 ln N
  • Simpson index:
    D = 1 i = 1 s P i 2
  • Shannon–Wiener index:
    H = i = 1 s P i ln P i
  • Pielou evenness index:
    J s w = i = 1 s P i ln P i ln S
    where A is the total area surveyed, S is the total number of species, N is the number of individuals of all species, H is the species richness of various species in the habitat, Pi is the proportion of species in the total community, and Ni is the number of individuals of the species.

2.3.3. Quantification of Soil Nutrients

Three representative soil-sampling points were randomly selected in each standard plot. Soil samples were collected from three depth layers (0–10, 10–20, and 20–30 cm) using a 100 cm3 standard soil-core sampler, with three replicates per layer. The collected soil samples were brought to the laboratory for analysis of organic matter, total nitrogen, total phosphorus, total potassium, available nitrogen, available phosphorus, available potassium, and pH, following described methods [26].

2.3.4. Data Processing

Data organization, analysis, and processing were conducted using Excel 2018, Winklemass, and SPSS 25.0 (IBM, Armonk, NY, USA). Pearson correlation coefficients were used to analyze the correlations between stand structural indicators and understory herbaceous diversity as well as soil nutrient levels. Structural equation modeling (SEM) was performed using AMOS 24.0. Response surface methodology (RSM) was applied in Minitab (Minitab, State College, PA, USA) to construct three-dimensional surface equations and contour plots depicting the relationships between the dominant stand spatial structural features, understory herbaceous diversity, and soil nutrient levels [27,28].

3. Results

3.1. Spatial Structure and Function Feature Analysis

The spatial structural parameters of the plots were examined (Table 1). The forest layer index, openness degree, mingling degree, and competition index exhibited ranges of 0–0.62, 0.21–1.35, 0–1, and 0.30–1.45, respectively (coefficients of variation (CV), 59.88%, 55.15%, 57.36%, and 42.95, respectively). The uniform angle index and size ratio had relatively low CVs, at 15.09% and 19.03%, respectively.
Species diversity and soil nutrient levels were examined (Table 2). The Gleason, Shannon–Wiener, Simpson, Margalef, and Pielou indices exhibited ranges of 0.33–1.11, 0.66–1.70, 0.41–0.86, 0.29–1.92, and 0.58–0.99, respectively (CV, 25.74%, 21.81%, 15.16%, 30.16%, and 10.76%, respectively). Soil organic carbon, total nitrogen, total phosphorus, total potassium, available nitrogen, available phosphorus, available potassium, and pH exhibited ranges of 12.84–78.96, 0.73–5.29, 0.22–9.10, 1.73–39.51, 31.70–404.68, 0.30–11.13, 8.50–356.56, and 5.73–8.76, respectively (CV, 48.99%, 55.11%, 50.27%, 35.59%, 52.40%, 85.90%, 54.26%, and 10.47%, respectively) (Table 3).

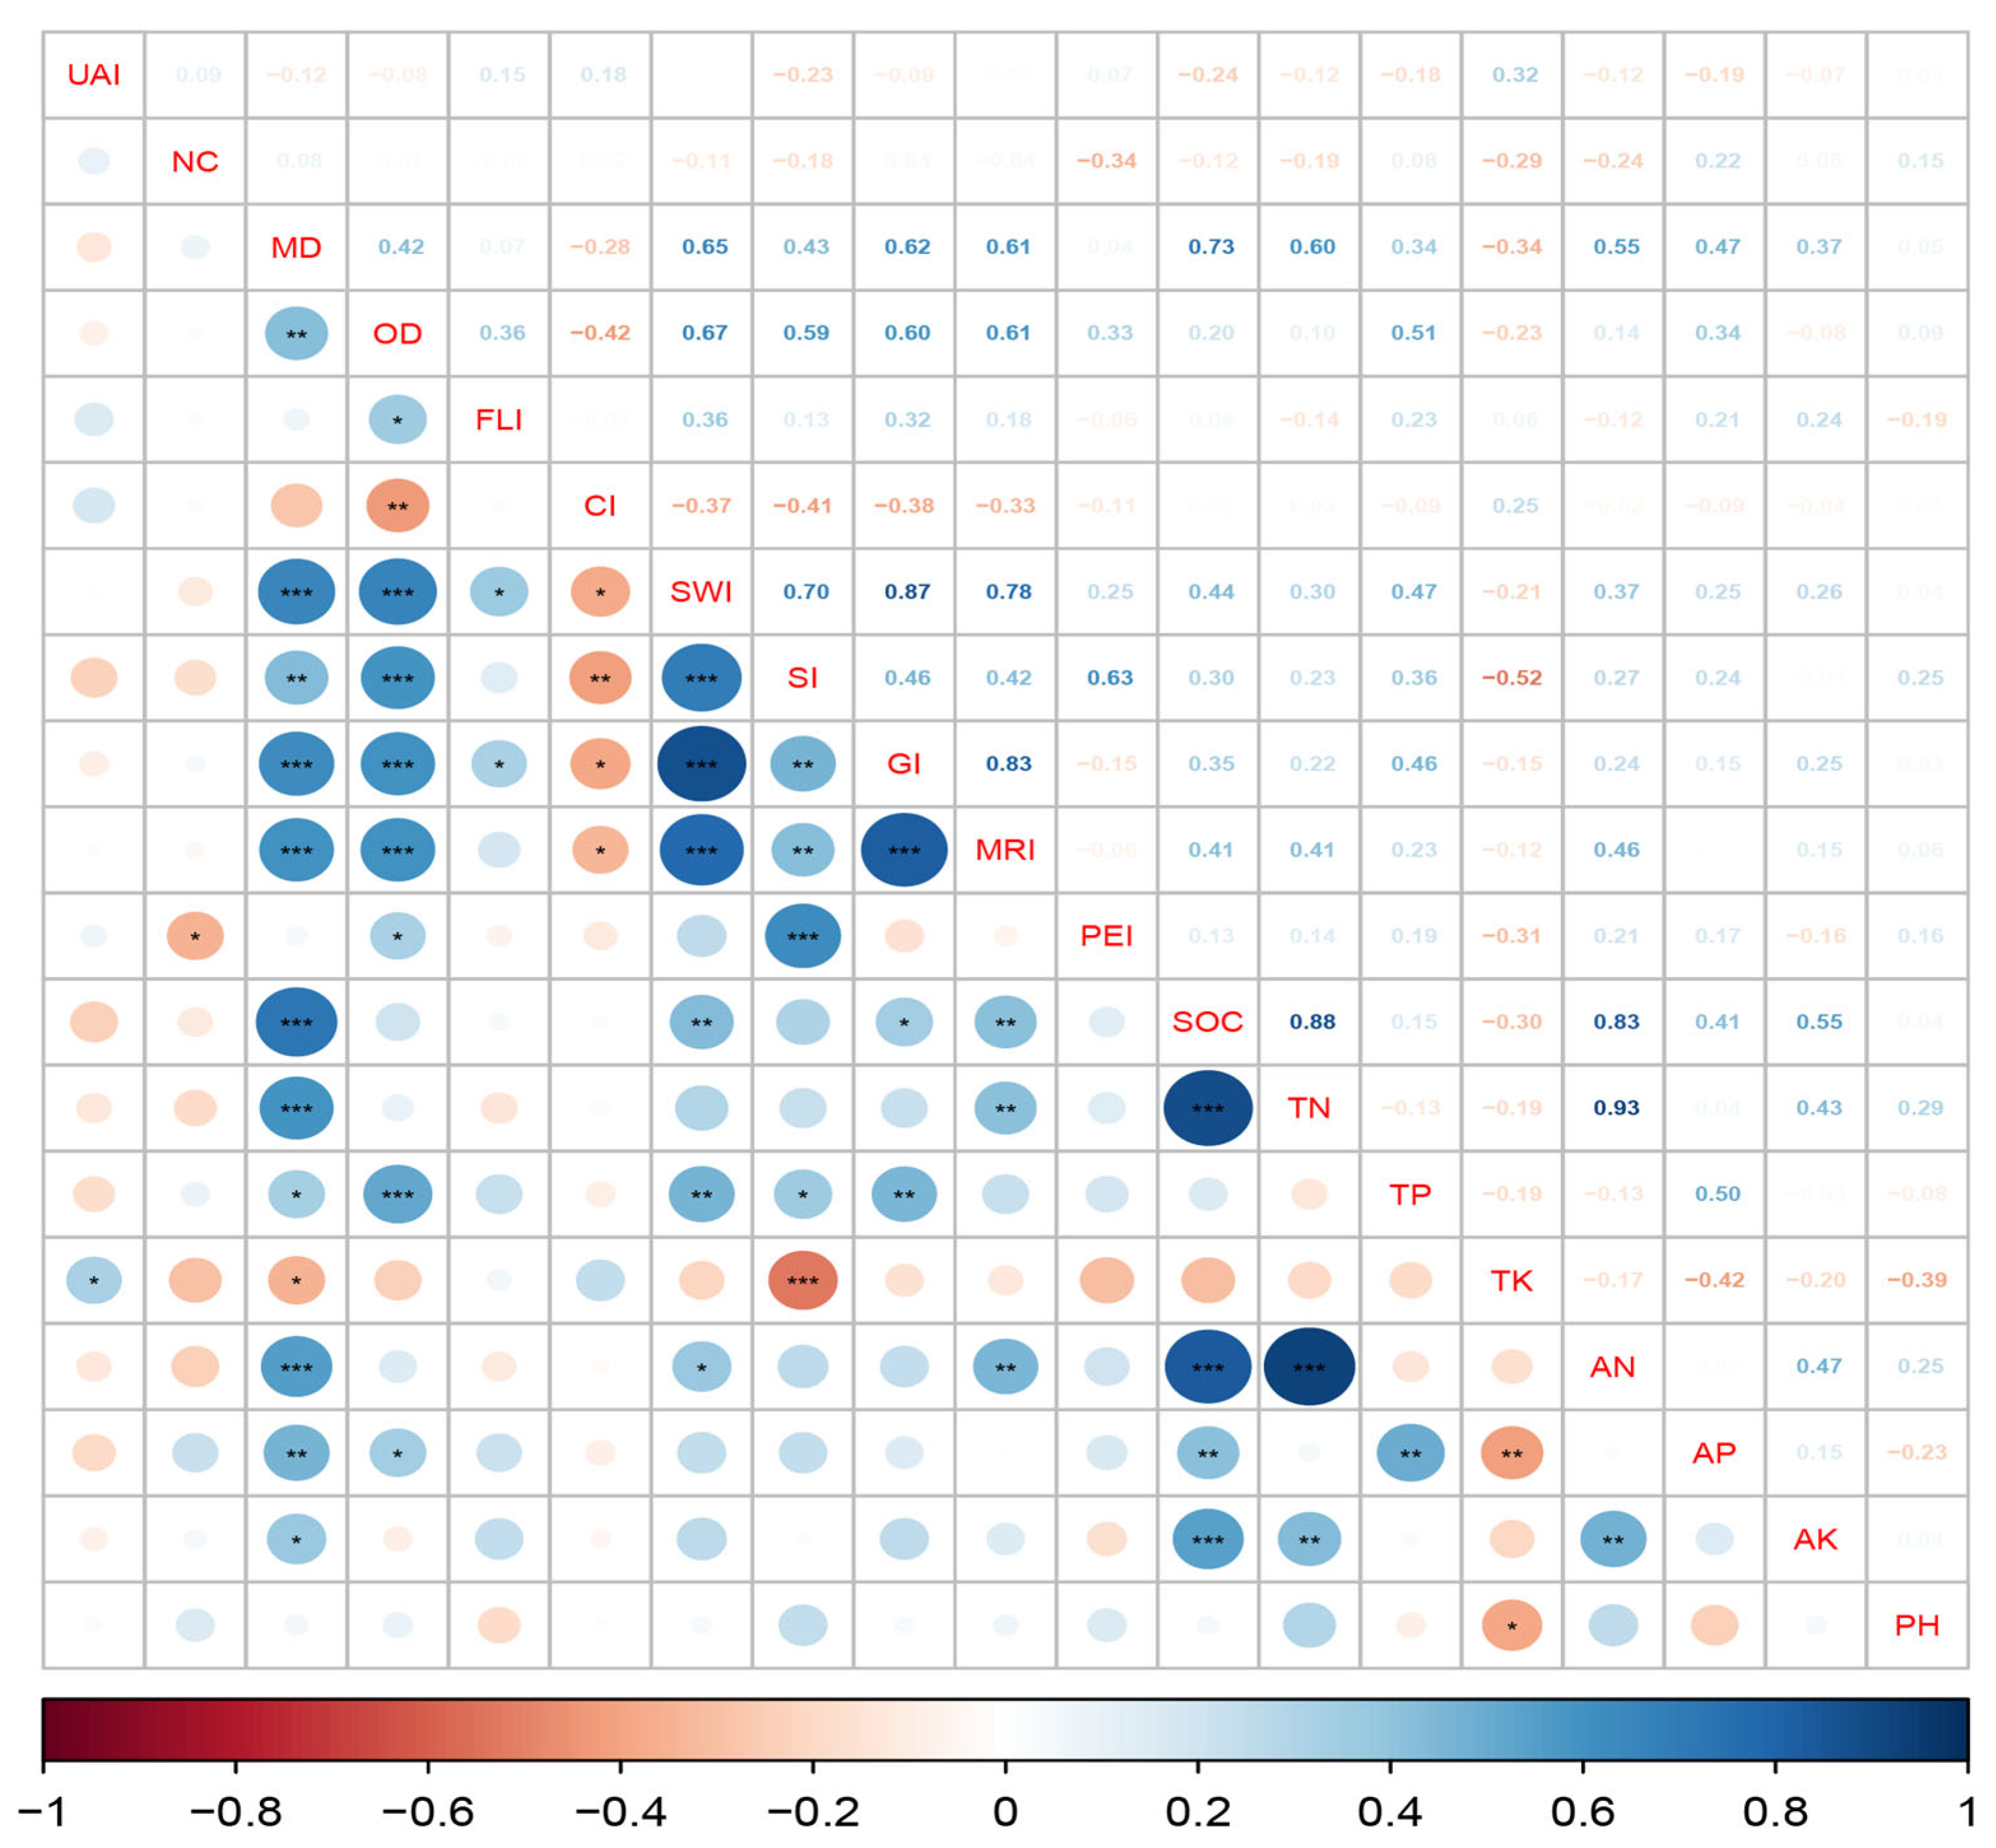
3.2. Correlations Between Spatial Structure and Understory Diversity and Soil Nutrient Levels

The correlations between mingling degree, openness degree, and the Shannon–Wiener, Simpson, Gleason, and Margalef indices were highly significant (p < 0.01; Figure 2). Mingling degree significantly affected soil nutrient levels, including levels of organic matter, total nitrogen, available nitrogen, and phosphorus (p < 0.01). Openness degree was significantly correlated with total phosphorus (p < 0.01), and the competition index was highly significantly correlated with the Simpson index (p < 0.01).
Mingling degree significantly influenced total phosphorus, total potassium, and available potassium (p < 0.05). Openness degree significantly affected the Pielou index and available phosphorus (p < 0.05). The forest layer and competition indices significantly affected the Shannon–Wiener index, Simpson, Gleason, and Margalef indices (p < 0.05). The uniform angle and neighborhood comparison indices did not significantly affect the diversity indices of soil nutrient levels (p > 0.05).

3.3. SEM of Effects of Stand Spatial Structure on Understory Plant Diversity and Soil Nutrient Levels

Correlation analysis revealed that the mingling degree, openness degree, the competition index, and the forest layer index exerted relatively large effects on herbaceous species diversity and soil nutrient levels. Therefore, these variables were used to construct an SEM to evaluate the direct and indirect effects of spatial structural indices on herbaceous species diversity and soil nutrient levels. This revealed various causal relationships among the latent variables representing stand spatial structure, soil nutrient levels, and herbaceous diversity. The path diagram of the optimal SEM was constructed (Figure 3). The mingling degree exerted a highly significant effect on species diversity (p < 0.01; direct path coefficient (DPC), 0.48) and on soil nutrient levels (p < 0.001; DPC, 0.70). The mingling degree indirectly affected soil nutrient levels and species diversity by influencing the openness degree and competition index (DPC, 0.31 and −0.28, respectively). The openness degree exerted a highly significant and direct effect on species diversity (p < 0.01; DPC, 0.37), but a nonsignificant impact on soil nutrient levels (DPC, −0.05). The competition index did not significantly directly affect species diversity or soil nutrient levels (DPC, 0.20 and −0.11, respectively), but significantly and indirectly affected species diversity by affecting the openness degree (DPC, −0.34). The forest layer index did not significantly affect species diversity or soil nutrient levels (DPC, 0.18 and −0.13, respectively). Soil nutrient levels did not significantly affect species diversity (DPC, −0.03). In summary, the mingling degree exerted a highly significant impact on both soil nutrient levels and plant species diversity, primarily via direct effects. Openness degree exerted a highly significant direct effect on plant species diversity, while the competition index affected plant species diversity mostly indirectly (Table 4).

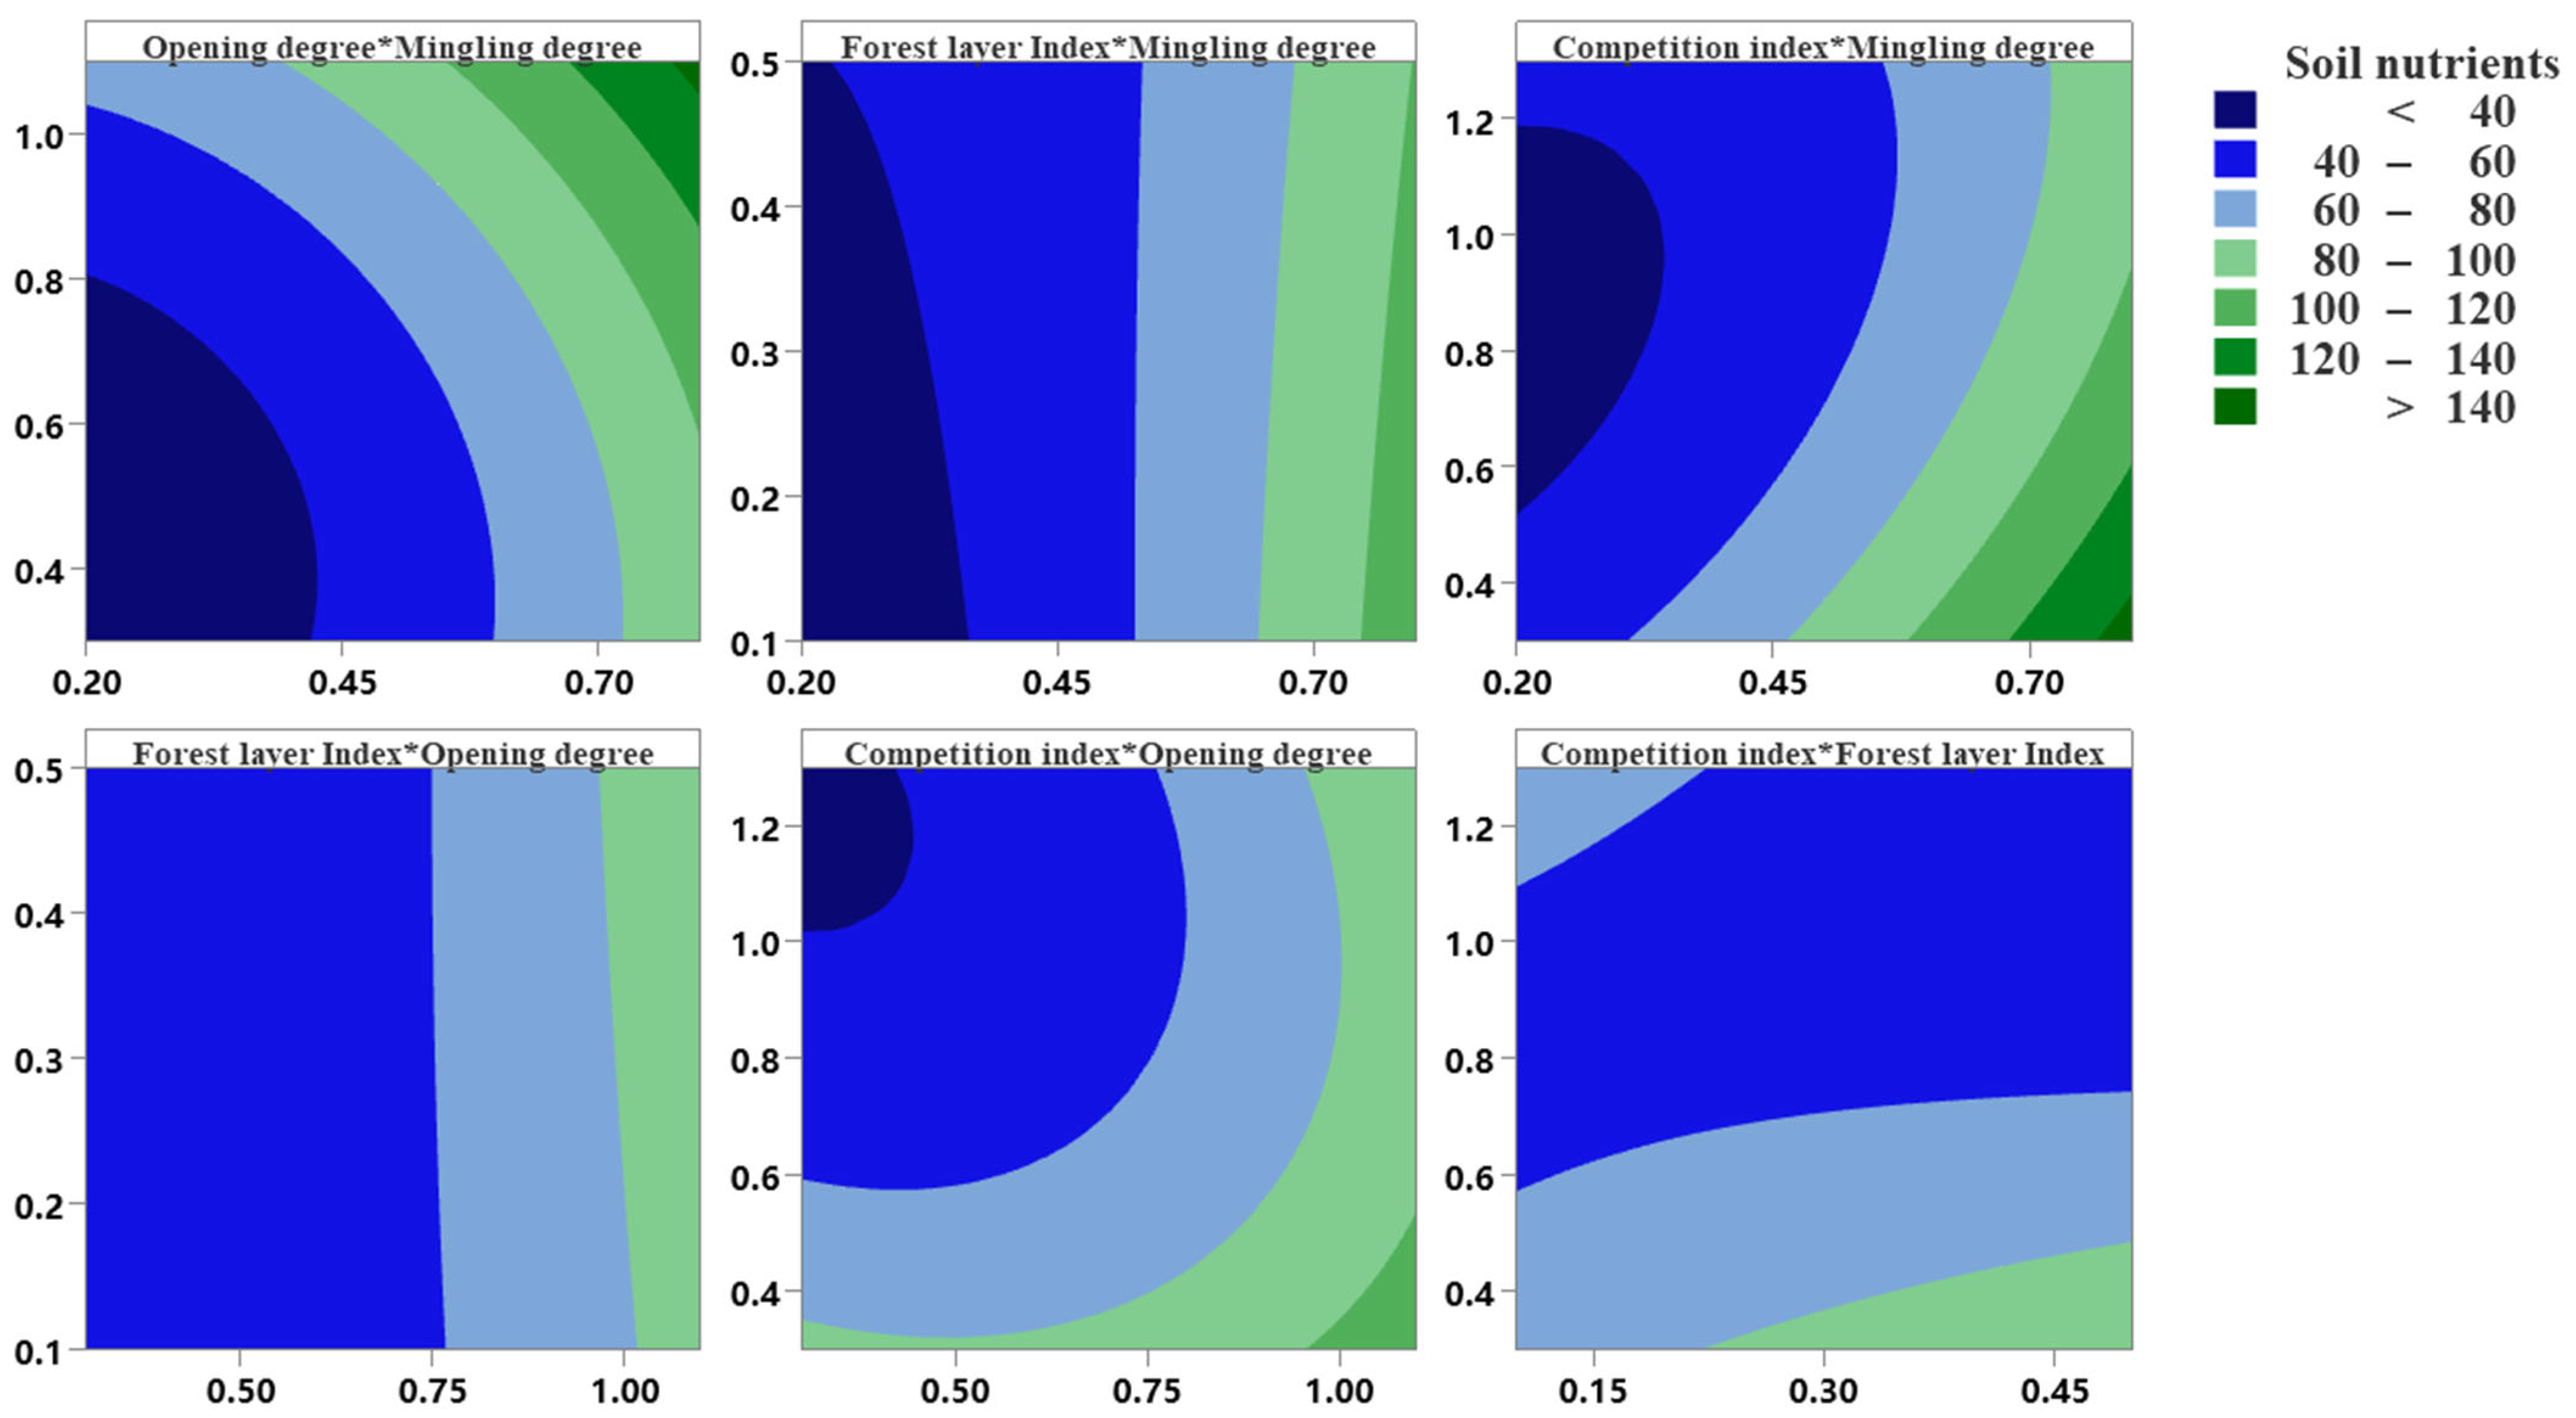
3.4. Stand Structural Optimization and Adjustment

Mingling degree, openness degree, the forest layer index, and the competition index were identified as the dominant factors influencing herbaceous species diversity and soil nutrient content. RSM, a response optimizer methodology, was used to optimize these key stand spatial structure factors to maximize herbaceous understory species diversity and soil nutrient levels. The RSM results, including the contour plots (Figure 4 and Figure 5) and the regression curve equation (for y1, y2; R2, 0.85), indicate that RSM was reliable for stand structure optimization. The optimal configuration of the stand spatial structure was adjusted to exhibit a mingling degree of 0.8, openness degree of 1.1, competition index of 0.3, and forest layer index of 0.5. Post optimization, the average levels of herbaceous species diversity and soil nutrient levels are expected to increase by ca. 47.74% and 52.29%, respectively.
y 1 = 0.806 + 0.781 M D 0.201 O D 0.04 F L I 0.228 C I + 0.764 M D 2          + 0.219 O D 2 + 0.84 F L I 2 + 0.170 C I 2 0.292 M D × O D         0.792 M D × F L I 0.500 M D × C I + 0.4060 D × F L I + 0.263 O D × C I 0.525 S × C I    
R 2 = 0.85
y 2 = 58.3 + 44 M D 124.7 O D + 129 F L I 65.5 C I + 152.8 M D 2 + 85.2 O D 2      6 F L I 2 + 54.5 C 2 + 29.2 M D × O D 96 M D × F L I      83.3 M D × C I + 4460 D × F L I + 42.5 O D × C I 135.0 F L I × C I            
R 2 = 0.9
where y1 refers to herbaceous species diversity, y2 refers to soil nutrient, MD refers to mingling degree, FLI to forest layer index, CI to competition, and OD to openness degree.

4. Discussion

4.1. Correlations Between Stand Spatial Structure and Herbaceous Understory Diversity

The understory herbaceous layer is the basic functional layer of the artificial forest ecosystem, which has a small ecological niche but is sensitive to environmental changes [29]. Pearson correlation analysis revealed a strong correlation between horizontal structural parameters, such as mingling degree and openness degree, and herbaceous layer species diversity (especially the Shannon–Wiener, Simpson, Gleason, and Margalef richness indices). Similar studies have found that mingling degree is the most critical structural factor affecting understory species diversity [30,31]. The influence of mingling degree and openness on the herbaceous diversity index was more significant [32,33]. In addition, the competition index may have an important effect on herbaceous species diversity [34]. Trees compete for light, soil, and water resources, primarily with neighboring trees. High competition among trees results in competitive exclusion, exacerbating the already disadvantageous conditions, in terms of limited light and nutrients, experienced by the herbaceous understory, thereby leading to reduced species diversity [35].
Vertical forest structure is an important indicator of forest ecosystem stability and naturalness [36]. Here, the forest layer index was correlated with the Simpson-Wiener and Gleason indices (p < 0.05). The forest layer is the component of the forest ecosystem that interacts most directly with the external environment, affecting the ability of the understory to capture solar energy and intercept precipitation, thereby affecting understory community composition and structure [37]. The neighborhood comparison index exerted a relatively weak impact on herbaceous vegetation diversity and soil nutrient levels, exhibiting only a negative correlation with the Pielou index (p < 0.05). Huang et al. [12] suggested that the Simpson-Wiener index of the herbaceous layer is significantly influenced by neighborhood comparisons. Higher neighborhood comparison indices, indicating weaker dominance of tree units and stronger competition, often result in lower overall stand stability, affecting the evenness of the herbaceous plant distribution and the Shannon–Wiener index [38]. Here, the uniform angle index was not significantly correlated with herbaceous understory diversity, contrary to the findings of Xiang et al. [39] indicating that the spatial structural factors most affecting ecological function vary with species and region.

4.2. Correlations Between Stand Spatial Structure and Soil Nutrient Levels

The mingling degree was the spatial structural factor most closely correlated with soil nutrient levels, followed by openness degree. Among the indices, only the uniform angle index was correlated with total potassium (p < 0.05). The mingling degree was significantly correlated with all of the soil nutrient indicators and particularly with organic matter, total nitrogen, available nitrogen, and available phosphorus (p < 0.01). In forest environments, spatial mixing affects soil moisture, temperature, and pH, primarily because mixed forests improve the spatial conditions for light, heat, and water capture, alter the soil microbial communities, increase soil enzyme activity, and promote nutrient release [40]. Mixed forests exhibit higher soil nutrient levels and microbial activity than pure forests, with significant positive correlations between mingling degree and soil organic matter and total nitrogen [41,42]. Here, the openness degree was a dominant factor affecting soil phosphorus, with significant correlations with total phosphorus (p < 0.01) and available phosphorus (p < 0.05), suggesting that greater openness in Pinus tabuliformis forests may result in more abundant light resources and higher soil phosphorus content. Soil phosphorus and total nitrogen are key factors driving other soil characteristics, with available phosphorus being the most important factor among the available nutrients [42]. Increased total phosphorus content in the surface layer may improve herbaceous plant diversity indices [17]; this explains how openness significantly affected herbaceous diversity, via its correlation with soil phosphorus. Here, the uniform angle index and soil total potassium were significantly correlated (p < 0.05). Similar research has revealed a positive correlation between this index and soil nutrient levels, with available potassium increasing with the uniform angle [43]. Lv et al. [44] suggested that an increased uniform angle positively affects the distributions of tree canopies and canopy gaps, improving soil temperature, moisture, and nutrient cycling [45]. Here, the uniform angle index and neighborhood comparison were not significantly correlated with herbaceous understory diversity or soil nutrient levels, possibly owing to the similar planting spacing in the Pinus tabuliformis artificial forest plots, and, therefore, the similar sizes of the trees and the consistent distribution patterns.

4.3. Coupling Between Stand Spatial Structure and Ecological Function

Based on SEM, the mingling degree and openness degree exerted direct effects on herbaceous species diversity and soil nutrient levels (p < 0.01), with particularly high DPCs (0.48 and 0.70) for the effects of mingling degree on herbaceous species diversity and soil nutrient levels, respectively. This indicates that mixing is the primary factor influencing these ecological functions. There are three possible reasons for this. First, mixed forest canopies are dense and overlapping, directly influencing the microenvironment for understory plant growth. Compared with pure forests, this structure can more effectively intercept and reduce wind, providing a more suitable growing environment for understory herbaceous plants [30,46]. Second, mixed forests have abundant litter and complex root systems that enhance soil nutrient return and cycling, thereby improving soil nutrient levels. In Pinus tabuliformis forests, a higher mingling degree typically indicates the introduction of more broadleaf species. Herbaceous plant species richness and coverage increase with the proportion of broadleaf species [47]. The mingling degree affects soil microbial communities [48] and soil moisture distribution [48,49], thereby influencing soil nutrient formation and cycling. Resource heterogeneity is a significant driver of herbaceous plant richness, with mixed forests exhibiting greater light heterogeneity (measured as spatial variation in OPPFD%) than single-species stands [47].
The mingling degree also indirectly affected herbaceous species diversity and soil nutrient levels by affecting the competition index (DPC, −0.28) and openness degree (DPC, 0.31), potentially because mixed stands exhibit greater interspecific competition (which is, however, less intense than intraspecific competition). Thus, mixed forests reduce competition among trees, releasing more nutritional space for understory herbaceous growth, and conserving soil nutrients [50]. Consequently, the mingling degree indirectly affected understory herbaceous diversity and soil nutrient levels by reducing the competition. Regarding the competition index, lower competition increases the available space within the stand, increasing stand openness and favoring the establishment and growth of new herbaceous species, thus explaining the influence of the competition index on the openness degree [51,52]. Moreover, the mingling degree indirectly affected herbaceous diversity by affecting the openness degree. Essentially, greater mixing leads to a more complex canopy structure and complementary ecological niches, resulting in increased and more uniform understory light, thus enhancing light-use efficiency in the understory and promoting herbaceous richness [53]. This further demonstrates the indirect effects of the mingling degree on herbaceous species diversity via openness degree.
Openness, as an indicator of vertical structure, affects various environmental factors, such as light, heat, moisture, and wind speed, which all influence herbaceous growth [54]. In particular, sufficient light resources determine the survival rates of shade-tolerant, light-demanding, and common herbaceous plants, thereby affecting understory species richness [55]. However, the extent of openness often determines the intensity of transpiration. Greater openness enhances transpiration, resulting in more abundant litterfall and increasing soil organic matter content and fertility, thereby benefiting understory herbaceous growth [56,57]. Although the forest layer index was somewhat correlated with the Simpson-Wiener and Gleason indices, the SEM results indicate that the forest layer index did not directly or indirectly affect soil nutrient levels or herbaceous plant diversity. In summary, differences in stand spatial structure imply differences in species isolation distribution patterns and competition in the canopy layer, leading to differences in the understory microenvironment in terms of light, heat, water, and nutrient levels. Stand structure also affects soil nutrient levels, soil texture, litter, and other aspects of the forest ecosystem.

4.4. Stand Spatial Structure Optimization Strategy

The forest stand optimization aims to achieve the stand structure that maximizes multifunctionality. This study, aiming to maximize herbaceous species diversity and soil nutrient levels, revealed an optimal stand spatial configuration with a mingling degree of 0.8, openness degree of 1.1, competition index of 0.3, and forest layer index of 0.5. For a Pinus massoniana forest in southern Jiangxi, Li et al. [32] established a multi-objective planning model using Lingo, obtaining an ideal spatial structure with a size ratio of 0.44, mingling degree of 0.66, uniform angle of 0.48, openness degree of 0.29, and spatial density of 0.51. For Cunninghamia lanceolata mixed forests, Hu [58] obtained an optimal spatial structure pattern for overall functionality, with a full mingling degree of 0.34, size ratio of 0.59, openness degree of 0.78, forest layer index of 0.08, and uniform angle of 0.574. For a Platycladus orientalis forest in Beijing, Zhang et al. [59] performed optimization for herbaceous diversity, obtaining an optimal stand structural configuration with a canopy closure of 0.58 and a mingling degree of 0.6.
At present, relevant studies mainly focus on the research paradigm of “standard stand spatial structure”, and there are relatively few studies on the optimization of function-oriented stand spatial structure. It can be seen that the optimal stand spatial structure is different from the study area, ecological function, and tree species in this study. As mentioned above, due to the differences in the dominant spatial structure factors of ecological functions, site conditions, and climate factors in different regions, and the different ecological characteristics of different dominant tree species, the corresponding optimal stand structure is also different. Therefore, it is an important direction to achieve fine forest management to set up the management objective (optimal or optimal stand structure) according to local conditions and suitable for land and trees. This study was limited to the establishment of the optimization objectives based on herbaceous diversity and soil nutrient function in the mountainous area of Beijing, and the establishment of the optimization objectives for the stand structure of the dominant tree species in each region remains to be further explored.

4.5. Research Limitations and Future Trends

There are many limitations in this study. ① The size of the sample plot in this study will affect the results of the study, and future studies will try to ensure that the area of the sample plot is 500–2500 m2. ② The scientific starting point of this study is more to serve the function improvement of existing forest through the regulation of spatial structure, rather than new afforestation. Therefore, there is no systematic analysis of non-spatial structure (tree height and diameter structure, age of stand, stand density, canopy density and other factors), and future studies still need to systematically analyze the characteristics of non-spatial structure. ③ Due to the great influence of site conditions, and non-spatial structures such as age of stand and stand density on ecological functions, this study tried to control site conditions to be relatively consistent with stand density and stand age within a certain range. However, overall, the basic situation of the sample plot was not the best. Strictly speaking, the results of this study are more explanatory to the optimization of stand spatial structure when the stand density is 700–1300 and the stand age is in the middle or near-mature forest. As for future research, we should try to establish the optimization target of different stand densities and different stand age stages.

5. Conclusions

This study examined the optimization of herbaceous understory diversity and soil nutrient levels in Pinus tabuliformis forests in the mountainous areas of Beijing. The mingling degree, openness degree, competition index, and forest layer index significantly affected both understory species diversity and soil nutrient levels. The mingling degree significantly impacted understory biodiversity and soil nutrient levels (DPC, 0.48 and 0.70, respectively). The openness degree significantly affected understory species diversity (DPC, 0.37). The competition index and forest layer index had less significant direct impacts on these primary functions; however, the competition index influenced herbaceous species diversity, mostly indirectly. Aiming to maximize understory species diversity and soil nutrient levels, we optimized the stand structures using a response optimizer. The optimal spatial configuration was a mingling degree of 0.8, openness degree of 1.1, competition index of 0.3, and canopy layer index of 0.5. Post optimization, the average understory species diversity and soil nutrient levels are projected to increase by ca. 47.74% and 52.29%, respectively. This study offers a strategy for optimizing the spatial structure of Pinus tabuliformis stands and provides a scientific reference for the precise management of stand structures in Beijing’s mountainous Pinus tabuliformis forests.
The results of this study are not only to verify the mechanism of action between the spatial structure and function of stand but also to establish a function-oriented optimization goal of the stand structure. Because the essence of solving the optimization objective is a “nonlinear multi-objective optimization problem”, it is necessary to use the results of this study to further guide the practice, and it is necessary to use the computer programming algorithm to further practice. First, the objective functions and constraints are established according to our optimization objectives (similar to the results of this paper). Secondly, the iterative decision-making path of the model is determined, and then a large number of sample site information data are trained by the algorithm to ensure the stability and accuracy of the model. At present, the common algorithms to solve the nonlinear multi-objective optimization problem include the Genetic Algorithm, Particle Swarm Optimization, Differential Evolution, Simulated Annealing, and so on [60]. To sum up, there is still a long way to go to realize the digital and fine management of forestry, and a lot of basic and cross-border research is still needed in this field

Author Contributions

Conceptualization, S.Q.; methodology, Y.Z.; software, Y.Z.; validation, Y.Z.; formal analysis, Y.Z.; investigation, Y.Z., L.Z., Y.G., D.Z., S.L., L.M., J.H., J.L. and X.W.; resources, Y.Z., L.Z., Y.G., D.Z., S.L., L.M., J.H., J.L. and X.W.; data curation, Y.Z., L.Z., Y.G., D.Z., S.L., L.M., J.H., J.L. and X.W. writing—original draft preparation, Y.Z.; writing—review and editing, S.Q.; visualization, Y.Z.; supervision, S.Q.; project administration, S.Q.; funding acquisition, S.Q. All authors have read and agreed to the published version of the manuscript.

Funding

This research was funded by the sandification combating program for areas in the vicinity of Beijing and Tianjin, grant number 2020-SYZ-01-17JC05.

Data Availability Statement

Data sharing is not applicable because the data need to be subsequently analyzed with other data.

Acknowledgments

The authors are thankful to the Beijing Municipal Forestry and Parks Bureau for providing forestry engineering design data.

Conflicts of Interest

The authors declare no conflicts of interest.

References

  1. Spies, T.A. Forest Structure: A Key to the Ecosystem. Northwest Sci. 1998, 7, 34–39. [Google Scholar]
  2. McElhinny, C.; Gibbons, P.; Brack, C.; Bauhus, J. Forest and woodland stand structural complexity: Its definition and measurement. For. Ecol. Manag. 2005, 218, 1–24. [Google Scholar] [CrossRef]
  3. Stanturf, J.A.; Palik, B.J.; Dumroese, R.K. Contemporary forest restoration: A review emphasizing function. For. Ecol. Manag. 2014, 331, 292–323. [Google Scholar] [CrossRef]
  4. Ali, A. Forest stand structure and functioning: Current knowledge and future challenges. Ecol. Indic. 2019, 98, 665–677. [Google Scholar] [CrossRef]
  5. Wang, Y.; Li, J.; Cao, X.; Liu, Z.; Lv, Y. The Multivariate Distribution of Stand Spatial Structure and Tree Size Indices Using Neighborhood-Based Variables in Coniferous and Broad Mixed Forest. Forests 2023, 14, 2228. [Google Scholar] [CrossRef]
  6. Zhang, H.; Lei, X.; Zhang, C.; Zhao, X.; Hu, X. Research on theory and technology of forest quality evaluation and precision improvement. J. Beijing For. Univ. 2019, 41, 1–18. [Google Scholar] [CrossRef]
  7. Zhu, G.; Xu, Q.; Lu, Y. Effects of stand spatial structure on species diversity of shrubs in Quercus spp. natural secondary forests in Hunan Province. Acta Ecol. Sin. 2018, 38, 5404–5412. [Google Scholar]
  8. Fan, B. A Study on the Stand Spatial Structure and Soil Physicochemical Properties of Natural Secondary Broad-Leaved Forest. Master’s Thesis, Anhui Agricultural University, Hefei, China, 2012. [Google Scholar]
  9. Cao, X.; Li, J.; Wei, X. Effects of Spatial Structure on Soil Nutrient Content in Typical Forests in the Contral-Subtropics of China. Sci. Silvae Sin. 2020, 56, 20–28. [Google Scholar] [CrossRef]
  10. Zhu, J.; Zhan, B.; Chen, X.; Guan, Q. Analysis of spatial structure and species diversity of coniferous and broadleaved mixed forest in Zijin mountain. J. Cent. South Univ. For. Technol. 2018, 38, 75–80+93. [Google Scholar] [CrossRef]
  11. Pang, Y. Soil Fertility Analysis and Comprehensive Evaluation of Four Typical Stands in Fushou Forest Farm. Master’s Thesis, Central South University of Forestry and Technology, Changsha, China, 2022. [Google Scholar]
  12. Huang, X. Research on the spatial structure and multifunctionality of Pinus massoniana plantations in Jindong Forest Farm. Master’s Thesis, Central South University of Forestry and Technology, Changsha, China, 2017. [Google Scholar]
  13. Sun, Y.; Li, J.; Cao, X.; Yan, J. Research on the relationship between spatial structure and soil nutrients of Cunninghamia lanceolata forest based on path analysis method. J. Cent. South Univ. For. Technol. 2020, 40, 41–47. [Google Scholar] [CrossRef]
  14. Fang, X.; Tan, W.; Gao, X.; Chai, Z. Close-to-nature management positively improves the spatial structure of Masson pine forest stands. Web Ecol. 2021, .21, 45–54. [Google Scholar] [CrossRef]
  15. Tang, M.; Tang, S.; Lei, X.; Li, X. Study on Spatial Structure Optimizing Model of Stand Selection Cutting. Sci. Silvae Sin. 2004, 40, 25–31. [Google Scholar]
  16. Hu, Y.; Hui, G. A Discussion on Forest Management Method Optimizing Forest Spatial Structure. For. Res. 2006, 19, 1–8. [Google Scholar]
  17. Liang, W.; Wei, X. Relationships between ecosystems above and below ground including forest structure, herb diversity and soil properties in the mountainous area of Northern China. Glob. Ecol. Conserv. 2020, 24, e01228. [Google Scholar] [CrossRef]
  18. Hui, G.; Zhang, G.; Zhao, Z.; Yang, A. Methods of Forest Structure Research: A Review. Curr. For. Rep. 2019, 5, 142–154. [Google Scholar] [CrossRef]
  19. Hui, G.; Gadow, K.V.; Albert, M. The Neighbourhood Pattern—A New Structure Parameter for Describing Distribution of Forest Tree Position. Sci. Silvae Sin. 1999, 35, 39–44. [Google Scholar]
  20. Hui, G.; Gadow, K.V.; Albert, M.T. A New Parameter for Stand Spatial Structure Neighbourhood Comparison. For. Res. 1999, 12, 1–6. [Google Scholar]
  21. Tang, M.; Tang, S.; Lei, X.; Zhou, G.; Xie, Z. Comparison Analysis on Two Minglings. For. Grassl. Resour. Res. 2004, 25–27. [Google Scholar] [CrossRef]
  22. Wang, P.; Jia, L.; Wei, S.; Wang, Q. Analysis of stand spatial structure of Platycladus orientalis recreational forest based on Voronoi diagram method. J. Beijing For. Univ. 2013, 35, 39–44. [Google Scholar] [CrossRef]
  23. Hui, G.; Hu, Y.; Zhao, Z.; Yuan, S.; Liu, W. A Forest Competition Index Based on Intersection Angle. Sci. Silvae Sin. 2013, 49, 68–73. [Google Scholar] [CrossRef]
  24. Lu, Y.; Zang, H.; Wan, X.; Deng, Z.; Li, J. Storey Structure Study of Cyclobalanopsis myrsinaefolia Mixed Stand Based on Storey Index. For. Grassl. Resour. Res. 2012, 81–84. [Google Scholar] [CrossRef]
  25. Peng, Y.; Fan, M.; Song, J.; Cui, T.; Li, R. Assessment of plant species diversity based on hyperspectral indices at a fine scale. Sci. Rep. 2018, 8, 4776. [Google Scholar] [CrossRef] [PubMed]
  26. Jin, J.; Bai, Y.; Yang, L. Efficient Soil Nutrient Testing Technologies and Equipment; China Agricultural Press: Beijing, China, 2006. [Google Scholar]
  27. Henseler, J.; Ringle, C.M.; Sarstedt, M. A new criterion for assessing discriminant validity in variance-based structural equation modeling. J. Acad. Mark. Sci. 2014, 43, 115–135. [Google Scholar] [CrossRef]
  28. Hou, G. Optimizition of Stand Structures for Low-efficiency Robinia pseudoacacia Forest in the Loess Plateau in Western Shanxi, China. Doctoral Thesis, Beijing Forestry University, Beijing, China, 2020. [Google Scholar]
  29. Yang, Y.; Shi, Y.; Li, Z.; Kang, H.; Fan, Y.; Zheng, C.; Wen, Z. Community characteristics of understory herb layer and its relationships with stand structure and soil nutrient availability in the Three-North shelterbelt of Shaanxi, China. Acta Ecol. Sin. 2020, 40, 6542–6551. [Google Scholar]
  30. Zhang, Y.-H.; Dian, Y.-Y.; Huang, G.; Liu, X.; Han, Z.; Jian, Y.; Li, Y.; Wang, X. Effects of spatial structure on species diversity in Pinus massoniana plantation of different succession stages. Chin. J. Ecol. 2021, 40, 2357–2365. [Google Scholar]
  31. Cao, X.; Li, J.; Wei, X. Analysis of the difference and correlation between the spatial structure and understory herbaceous species diversity of typical subtropical forests. Pratacultural Sci. 2019, 36, 2466–2475. [Google Scholar] [CrossRef]
  32. Li, F.; Pan, P.; Ning, J.; Lai, G.; Ouyang, X.; Xu, H.; Guo, L.; Wu, Z.; Yi, Z. Effects of Stand Spatial Structure on Understory Vegetation Diversity of Aerial Seeding Pinus massoniana Plantations. J. Northeast For. Univ. 2016, 44, 31–35+40. [Google Scholar] [CrossRef]
  33. Xie, Z. Study on the Influence of the Spatial Structure of Chinese Fir Public Welfare Forest on the Species Diversity of Shrub and Herbaceous. Master’s Thesis, Central South University of Forestry and Technology, Changsha, China, 2023. [Google Scholar]
  34. Mao, Y.; Lin, H.; Sun, L.; Xie, J.; Jiang, T.; Wang, Y. Effects of Stand Spatial Structure on Understory Species Diversity of Cupressus funebris Plantation. Guangxi For. Sci. 2021, 50, 639–645. [Google Scholar] [CrossRef]
  35. Grime, J.P. Competitive Exclusion in Herbaceous Vegetation. Nature 1973, 242, 344–347. [Google Scholar] [CrossRef]
  36. Hui, G.; Hu, Y.; Zhao, Z. Research Progress of Structure-based Forest Management. For. Res. 2018, 31, 85–93. [Google Scholar]
  37. Wang, N.; Bi, H.; Peng, R.; Zhao, D.; Yun, H.; Liu, Z.; Lan, D.; Jin, C. The Strategy for Optimizing the Stand Structure of Pinus tabuliformis Carr. Forests to Enhance the Ecological Function on the Loess Plateau, China. Forests 2022, 13, 1217. [Google Scholar] [CrossRef]
  38. Liu, Y.; Yu, X.; Yue, Y.; Gan, J.; Wang, X.; Li, J. Spatial structure of Robinia pseudoacacia plantation in Miyun Reservoir Watershed of Beijing. J. Beijing For. Univ. 2009, 31, 25–28. [Google Scholar]
  39. Xiang, Q.; Guuo, Q.; Ai, X.; Yao, L.; Zhu, J.; Xue, W.; Zuou, Y.; Zhao, H.; Wu, J. Variations on Stand Spatial Structure and Species Diversity in Different Spatial Scales. For. Res. 2022, 35, 151–160. [Google Scholar] [CrossRef]
  40. Huo, Y.; Guan, J.; Liu, X.; Zhao, W.; Li, S.; Deng, L. Interaction between fine roots of Picea crassifolia and soil microorganisms under different mingling degree stands. J. For. Environ. 2023, 43, 588–595. [Google Scholar]
  41. Jing, Y.; Wang, Q. Mixed Cunninghamia lanceolataMichelia macclurei plantation decreased soil bacterial residue accumulation in topsoils. Chin. J. Ecol. 2024, 43, 2650–2657. [Google Scholar] [CrossRef]
  42. Zhao, W. Study on the Effect of Spatial Structure of Chinese Fir Public Welfare Forest on Soil Nutrients-Take Fushou Forest Farm as an Example. Master’s Thesis, Central South University of Forestry and Technology, Changsha, China, 2023. [Google Scholar]
  43. Zhang, M.; Yin, Y.; Wang, K.; Wang, S. Effects of spatial structure characteristics of Fraxinus mandshurica plantation on soil nutrient content. J. Beijing For. Univ. 2023, 45, 73–82. [Google Scholar] [CrossRef]
  44. Lv, K.; Zhang, E.; Li, S.; Jin, S.; Zhou, M.; Yan, D. Effects of stand spatial structure on understory plant diversity in Pinus taiwanensis plantation. J. Zhejiang AF Univ. 2022, 39, 1257–1266. [Google Scholar] [CrossRef]
  45. Prescott, C.E. The influence of the forest canopy on nutrient cycling. Tree Physiol. 2002, 22, 1193–1200. [Google Scholar] [CrossRef]
  46. Yang, Y.; Zhou, Z.; Shen, L.; Zhao, Y.; Tang, Y.; Tian, J. Effects of Stand Structure of Artificial Shelter Forest on Understory Herb Diversity in Desert-Oasis Ecotone. Diversity 2023, 15, 1083. [Google Scholar] [CrossRef]
  47. Fiifibartels, S. Influence of Overstory Composition on Understory Vegetation and Resource Environment in the Boreal Forests of Canada. Master’s Thesis, Lakehead University, Ottawa, Canada, 2010. [Google Scholar]
  48. Peng, T. Differences in Spatial Structure, Understory Vegetation and Soil Characteristics of fir Large-Diameter Timber Plantations Under Different Methods. Master’s Thesis, Fujian Agriculture and Forestry University, Fuzhou, China, 2023. [Google Scholar]
  49. Liu, Y.; Wang, X.; He, L.; Liu, Z.; Zeng, X.; Sha, H.; He, B.; JIin, Y.; Li, J.; Chen, J.; et al. Effects of spatial structure on understory vegetation and soil properties in Pinus tabuliformis plantation of different succession types in Beijing. Acta Ecol. Sin. 2023, 43, 1959–1970. [Google Scholar]
  50. Lei, X.; Tang, S.; Li, D.; Chen, B.; Zelu, Z. Stand variables affecting understorey plant species diversity in natural forests. Chin. J. Ecol. 2003, 22, 18–22. [Google Scholar]
  51. Xingyun, L.; Youjun, H.; Pu, Z.; Jiantao, R.; Lin, Q.; Zhiyong, L. Effects of Different Forest Management Regimes on Plant Community Structure and Biodiversity of Natural Secondary Forests in Danqinghe Forestry Farm. Sci. Silvae Sin. 2013, 49, 93–102. [Google Scholar]
  52. Hu, W.; Wang, X.; Cui, H.; Pang, H.; Fu, T.; Pan, L.; Tang, W.; Meng, Y. Effects of stand structure and tree species composition on density of regeneration seedling of Pinus massoniana forest in Jiulingtou of Yichang City. J. Plant Resour. Environ. 2020, 29, 52–60. [Google Scholar]
  53. Fahey, R.T.; Fotis, A.T.; Woods, K.D. Quantifying canopy complexity and effects on productivity and resilience in late-successional hemlock-hardwood forests. Ecol. Appl. 2015, 25, 834–847. [Google Scholar] [CrossRef]
  54. Ediriweera, S.; Singhakumara, B.M.P.; Ashton, M.S. Variation in canopy structure, light and soil nutrition across elevation of a Sri Lankan tropical rain forest. For. Ecol. Manag. 2008, 256, 1339–1349. [Google Scholar] [CrossRef]
  55. Alem, S.; Pavlis, J.; Urban, J.; Kucera, J. Pure and Mixed Plantations of Eucalyptus camaldulensis and Cupressus lusitanica: Their Growth Interactions and Effect on Diversity and Density of Undergrowth Woody Plants in Relation to Light. Open J. For. 2015, 5, 375–386. [Google Scholar] [CrossRef]
  56. Huang, R.; Jia, X.; Liu, T.; Wu, Z.; Xu, M.; Su, Z.-y. Canopy Structure and Understory Radiation Dynamics of Subtropical Ecological Public Welfare Forest. J. Northwest For. Univ. 2020, 35, 28–36. [Google Scholar]
  57. Kathke, S.; Bruelheide, H. Gap dynamics in a near-natural spruce forest at Mt. Brocken, Germany. For. Ecol. Manag. 2010, 259, 624–632. [Google Scholar] [CrossRef]
  58. Hu, Z. Study On Spatial Structure Optimization Of Chinese Fir-Phoebe bournei Mixed Forest On Multifunctional Management. Master’s Thesis, Central South University of Forestry and Technology, Changsha, China, 2019. [Google Scholar]
  59. Zhang, L.; Zhou, P.; Qi, S.; Zhang, D.; Wu, B.; Cui, R. Difference influence of spatial structure of Platycladus orientalis plantations on diversity of understory herbaceous and its correlation degree. Ecol. Environ. Sci. 2022, 31, 1794–1801. [Google Scholar] [CrossRef]
  60. Li, X.; Zhang, G.; Li, J. Spatial structure evaluation of natural secondary forest around Dongting Lake based on entropy weight-cloud model. J. Coast. Res. 2020, 103, 484–489. [Google Scholar] [CrossRef]
Figure 1. Overview of the study area.
Forests 15 01963 g001
Figure 2. Correlation coefficients between stand spatial structural parameters and herbaceous plant species diversity and soil nutrient levels. *, p < 0.05; **, p < 0.01; ***, p < 0.001. UAI: uniform angle index; NC: neighborhood comparison; MD: mingling degree; OD: openness degree; FLI: forest layer index; CI: competition index; SWI: Shannon–Wiener index; SI: Simpson index; GI: Gleason index: MRI: Margalef richness index; PEI: Pielou evenness index. SOC: soil organic carbon; TN: total nitrogen; TP: total phosphorus; TK: total potassium; AN: available nitrogen; AP: available phosphorus; AK: available potassium PH: power of hydrogen.
Forests 15 01963 g002
Figure 3. Modified structural equation model of forest spatial structure, herbaceous understory diversity, and soil nutrient levels. * p < 0.05, ** p < 0.01.
Forests 15 01963 g003
Figure 4. Contour map of the effect of stand spatial structure on herbaceous understory diversity.
Forests 15 01963 g004
Figure 5. Contour map of the effects of stand spatial structure on soil nutrient levels.
Forests 15 01963 g005
Table 1. Basic characteristics of the sample plot.
Plot
No.
ASL
(m)
Slope
(°)
AspectSoil Depth
(cm)
Tree
Density
(Stem·ha−1)
Tree Height
(m)
Age
Stage
DBH
(cm)
Plot
No.
ASL
(m)
Slope
(°)
AspectSoil Depth
(cm)
Tree
Density
(Stem·ha−1)
Tree Height
(m)
Age
Stage
DBH
(cm)
176435semi–SS497256.51N13.332071420SS459255.3Mi10.05
270328semi–SS477255.54Mi10.892176928SS4085014.72N18.76
381525semi–SS398509.07N15.732293028SS3887511.81Ma20.04
495027semi–SS499253.75Y6.572390530SS4372512.41Ma21.85
5833.812semi–SS417507.72Mi11.442494033SS448254.1Mi11.9
690222semi–SS429006.57Mi15.272587012SS4313007.51N12.58
7102324semi–SS4012755.4N12.3326127129SS4212758.13Mi14.26
899232semi–SS407256.94N15.28827129326SS448506.1Mi14.05
9102432semi–SS4513007.41Mi10.9728130829SS4210507.28N17.06
1089220semi–SS417257.91N15.8129127426SS427508.03Ma24.4
1184725semi–SS407757.72Mi13.4930116520SS4212006.4N12.26
12112326semi–SS4113252.01Y4.0231135833SS427755.81N16.74
1384024semi–SS447256.78Mi11.132135928SS4212507.54N14.58
14914.424semi–SS417757N12.433869.617SS429504.72N12.02
15877.735semi–SS4372510.46Ma21.13489728SS4287511.81Ma21.04
16973.215semi–SS4111757.94Mi11.273579834SS42110011.8Mi13.68
17841.525semi–SS427252.29Y5.6936105324SS369255.3Mi10.05
1897019semi–SS4012507.14N12.383785539SS4910505.47Mi9.14
1979025semi–SS357257.14Mi9.6638108315SS4192512.28N16.69
ASL: elevation; SS: shady slopes; semi-SS: semi−shady slopes; Y: young growth forest < 20 years, Mi: middle age forest: 21–31 years, N: near-mature forest: 31–40 years, Ma: mature forest: 41–60 years, OM: overmature forest > 60 year. (Criteria for dividing the age stage of a planted forest).
Table 2. Summary of stand spatial structural parameters.
Stand Spatial StructureMean ± Standard DeviationMaximumMinimumCoefficient of Variation (%)
Uniform angle0.52 ± 0.080.750.3315.09
Neighborhood comparison0.52 ± 0.10.750.2519.03
Mingling degree0.51 ± 0.291057.36
Opening degree0.6 ± 0.331.350.2155.15
Forest layer index0.29 ± 0.170.62059.88
Competition index0.68 ± 0.291.450.342.95
Table 3. Summary of stand understory herbaceous plant diversity and soil nutrients.
Ecological
Functions
IndexMean ± Standard DeviationMaximumMinimumCoefficient of Variation (%)
Herb species diversityGleason0.66 ± 0.171.110.3325.74
Shannon–Wiener1.16 ± 0.251.70.6621.81
Simpson0.64 ± 0.10.860.4115.16
Margalef0.66 ± 0.171.920.2930.16
Pielou0.95 ± 0.290.990.5810.76
Soil nutrientSoil organic carbon
(g/kg)
41.56 ± 20.3678.9612.8448.99
Total nitrogen
(g/kg)
2.36 ± 1.35.290.7355.11
Total phosphorus
(g/kg)
1.24 ± 0.679.10.2250.27
Total potassium
(g/kg)
20.09 ± 7.1539.511.7335.59
Available
nitrogen
(mg/kg)
185.71 ± 97.31404.6831.752.4
Available
phosphorus
(mg/kg)
2.62 ± 2.2511.130.385.9
Available
potassium
(g/kg)
146.57 ± 79.52356.568.554.26
PH7.19 ± 0.758.765.7310.47
Table 4. Effects of stand spatial structural factors on understory species diversity and soil nutrient levels.
Impact FactorFunctionDirect EffectIndirect EffectTotal Effect
Mingling degreeSpecies diversity0.4800.2030.683
Soil nutrition0.697−0.0760.621
Opening degreeSpecies diversity0.370−0.0010.369
Soil nutrition−0.049/−0.049
Competition
index
Species diversity−0.114−0.122−0.236
Soil nutrition0.2010.0190.220
Forest layer IndexSpecies diversity0.178−0.0040.174
Soil nutrition−0.128/−0.128
Disclaimer/Publisher’s Note: The statements, opinions and data contained in all publications are solely those of the individual author(s) and contributor(s) and not of MDPI and/or the editor(s). MDPI and/or the editor(s) disclaim responsibility for any injury to people or property resulting from any ideas, methods, instructions or products referred to in the content.

