1. Introduction
Forests represent the most expansive terrestrial ecosystem on our planet, boasting an unparalleled distribution and a wealth of material resources. The multifaceted benefits of forests, encompassing economic, social, and environmental dimensions, are indispensable, serving as a vital source of income, employment, sustenance, timber, and medicinal resources. They are instrumental in soil preservation, carbon sequestration, and habitat conservation, while also enhancing the atmospheric environment. Forests have a profound impact on human livelihoods and are crucial in sustaining the delicate balance of our ecosystems [
1,
2]. In order to more effectively conduct forest resource surveys, disaster monitoring, and pest and disease control, there is an urgent need for broader field-of-view imagery. This demand has led to the widespread adoption of image registration technology in the forestry sector.
The advancement of drone photography, digital image processing technology, geostatistics, and artificial intelligence has provided precise methods for surveying and monitoring forest resources. Furthermore, by leveraging geostatistics and image texture information, we can clearly reveal forest environments and their changes [
3,
4,
5]. Zhou and colleagues employed the divide-and-conquer approach (DAC) and the local maximum technique (LM) to extract seedling heights, integrating these methods with UAV remote-sensing imagery to conduct research on the monitoring of fir sapling growth [
6]. Sun and team integrated a drone system architecture composed of multiple Industrial Internet of Things (IIoT) components with drone imagery, utilizing a learning-based collaborative particle swarm optimization algorithm (LCPSO) and a Markov random field (MRF)-based decomposition strategy to facilitate rapid response in forest fire monitoring [
7]. Li and co-researchers utilized UAV hyperspectral imagery in conjunction with an enhanced Mask R-CNN instance segmentation method to achieve high-precision monitoring of pine wilt disease in trees [
8].
Image stitching is a vital computer vision technique that merges partial images from a single perspective into a comprehensive image [
9]. Tareen et al. assessed the robustness and performance of various feature detectors, including SIFT, SURF, and KAZE, across diverse image scenes with significant geometric and illumination changes [
10]. SIFT stands out for its repeatability and robustness in most scenarios, although its computational efficiency can be slow due to the stability of its feature points. As a classic image-stitching algorithm, SIFT offers scale and rotation invariance, robustness [
11], and large-scale feature processing, making it suitable for high-resolution and complex image scenes [
12]. However, algorithms, such as SIFT and SURF, are time-consuming due to their strategies for locating feature points across different scales within the image pyramid and generating high-dimensional feature descriptors. Additionally, these methods struggle with handling large datasets and can be sensitive to variations in viewpoint and cluttered backgrounds, which can lead to decreased accuracy in feature matching. To address SIFT’s high descriptor vector dimension and low efficiency, researchers have developed variants like AB-SIFT, which uses an adaptive binning strategy for improved descriptor discriminability and robustness in remote-sensing image matching [
13]. PSO-SIFT enhances feature matching by introducing a new gradient definition and combining it with keypoint location, scale, and orientation [
14]. Liu et al. optimized SIFT for the rapid stitching of high-resolution aerial images by reducing descriptor dimensionality and using a progressive sample consistency algorithm to remove mismatched points [
15]. Wu et al. achieved rapid mosaic stitching of forest images with different ground cover types for Pinus taeda captured by UAV aerial photography by improving the SIFT-OCT algorithm [
16], laying the foundation for further research on image registration tasks for forest characteristics.
The aforementioned research offers reasonable solutions to existing challenges. However, a more in-depth analysis of the unique characteristics of forest images would aid in resolving the forest image registration problem. On the one hand, in order to more clearly depict the details and topography of the forest, the images must possess the attribute of high resolution. However, for SIFT features, the higher the resolution, the greater the computational time cost. The speed of real-time processing in forest image registration tasks determines the progress of subsequent research in other areas of forest imagery in the region such as pest detection, forest canopy detection, and other studies. On the other hand, the tone and texture of forest orthophotos exhibit considerable similarity within specific ranges [
17]. Although SIFT can meet the requirements for processing forest image features, its feature-detection strategy not only results in computational redundancy but also affects the accuracy of feature matching. A large number of ineffective feature points may compromise the quality of the registration, leading to issues such as misalignment and ghosting artifacts. Moreover, changes in the visual angle of the images also impact the feature matching of forest images. Under a certain degree of distortion, the ability to accurately identify the correct features and ensure registration quality is also a factor that needs to be investigated. Moreover, accelerating the processing speed while ensuring accuracy is also a challenge.
To address the aforementioned issues, this paper combines the characteristics of forest images with an in-depth analysis of each layer of the algorithm that can be optimized and applies it to a scenario of forest image registration tasks. When studying the forest image feature pyramid, it was found that the number of ineffective feature points introduced by the first layer is inversely proportional to the actual effective feature points, resulting in a large amount of computational redundancy. By integrating the concept of SIFT-OCT and choosing to skip the first layer of scale space [
18], the computational burden can be lightened, and ineffective feature points can be eliminated. To reduce the impact on matching accuracy when there are few feature points, and by considering the local similarities within the forest image study area as well as the potential influence of different image viewing angles on subsequent feature matching, a more comprehensive descriptor than the SIFT descriptor—the gradient location and orientation histogram (GLOH) descriptor [
19], which incorporates gradient position and orientation, is used to describe image features with higher precision. In the feature-matching phase, a simple computation method using the Manhattan distance is employed for feature matching to obtain the initial matching point pairs, which offers better computational efficiency compared to Euclidean distance. Finally, the fast sample consistency (FSC) algorithm is used to estimate the homography matrix [
20], reducing the disadvantage of a high number of iterations compared to the RANASC algorithm, eliminating incorrect matches, and obtaining the final transformation model for registration.
Furthermore, this study investigates how forest vegetation coverage and variations in flight parallax angles of unmanned aerial vehicles (UAVs) influence image-stitching algorithms, thereby validating our method. The experimental results demonstrate that our proposed approach satisfies precision and speed requirements for feature matching and registration across diverse datasets, showcasing superior stitching performance for UAV-acquired forest orthophotos.
2. Materials and Methods
2.1. Data Collection and Preprocessing
The data images in this article were obtained from China’s National Key Forest Breed Base, located in the beach forest area of Shouchang Forest Farm, Jiande City, Hangzhou City, Zhejiang Province (29°20′51.01″ N, 119°12′38.96″ E), as shown in
Figure 1. The tree species used in the forest area construction include, as follows: 16.81 acres of Quercus glauca Thunb (Quercus myrsinifolia Blume and Quercus gilva Blume); 16.31 acres of Phoebe (Phoebe chekiangensis, Phoebe purpurea, Phoebe formosana, etc.); and 3.62 acres of Cinnamomum camphora, etc. A DJI Phantom 4 Pro V1.6 drone was used to capture aerial images of the study area. The relevant parameters of the drone for shooting data are set as follows: the flight height is 30m, and the route overlap rate and side overlap rate are both 90%.
2.2. Dataset Partitioning
The dataset in this study was captured in April and May of 2021, 2022, and 2023, with an image resolution of 5472 × 3078. The dataset introduced in this paper is categorized into two primary groups, each reflecting distinct aspects of natural forests and the visual perspective of computer images, as follows: the proportion of forest vegetation; and the image overlap rate. Within the forest proportion dataset, there are two subcategories, as follows: dense forest orthophotos; and non-dense forest orthophotos. From a computational vision perspective, the datasets are further categorized into three groups based on image overlap, considering the following variations in parallax and angle: 60% to 90%; 30% to 60%; and a less than 30% overlap. This comprehensive classification is intended to evaluate the impact on forest orthomosaic stitching and to validate the efficiency and robustness of the algorithm presented in this paper.
2.2.1. Natural Forest Datasets with Different Density Proportions
In forest orthophotos, a large number of green points with extremely high similarity are usually contained within the vegetation in the image, which can be affected by the number of feature points, the efficiency of stitching, and the results. Since the images in this dataset were captured in April and May of 2021, 2022, and 2023, the majority of the forest vegetation appears green. To quantify the vegetation coverage, the images are first converted to the HSV color space. Then, the histogram of the green channel is computed. Finally, the ratio of the number of green pixels to the total number of pixels is used to calculate the proportion of the vegetation area. To classify the dataset, a threshold is applied as follows: if the vegetation ratio is 80% or higher, the data are classified as a dense forest orthophoto dataset; and if the vegetation ratio is below 80%, the data are categorized as a non-dense orthophoto dataset. As shown in
Figure 2, there is a set of dense forest test images, and a set of non-dense forest test images.
2.2.2. Natural Forest Datasets with Different Overlap Rates
As mentioned earlier, the drone’s flight parameters are set to achieve a 90% overlap for both the route and the side imagery. This means that when capturing the dataset, the images collected consecutively have a 90% overlap. From the perspective of computer vision, the collected orthophotos will also exhibit parallax and angle variations. To test the robustness of the algorithm against parallax and angle variations, the dataset is segmented based on varying overlap rates, which are achieved by capturing different numbers of images at a consistent straight-line distance and at slight rotational angles. The images are categorized into groups with overlap rates ranging from 60% to 90%, 30% to 60%, and less than 30%. As shown in
Figure 3, the red markings indicate the manually annotated overlapping areas, which may contain discrepancies; the registered image represents the true effect.
2.3. Optimized SIFT Algorithm Based on FSC Feature Screening
The main idea is as follows: As depicted in
Figure 4, during the phase of generating feature point descriptors, the first layer of the scale space is skipped for feature detection and the local information is described using the GLOH (gradient location and orientation histogram) descriptor. For feature point matching, a combination of nearest neighbor and next-nearest neighbor matching is used along with the Manhattan distance (MD). Finally, through the fast sampling consistency feature screening, false matches are filtered out and the transformation matrix parameters are estimated for image registration and fusion.
Due to the large number of feature points generated by the SIFT algorithm after constructing the difference in scale space, its efficiency in extracting features from natural forest images is low. Consequently, the approach of the SIFT-OCT algorithm is adopted. The first layer of the scale space, typically the original or slightly smoothed image, contains dense feature points that offer little benefit to the sampling of the entire scale space and may even lead to an excessive number of erroneous feature points. By skipping the first layer, the generation of feature points is reduced. Considering the complexity of natural forest scenes, GLOH descriptors are used instead of the original SIFT descriptors during the feature point descriptor generation, as GLOH descriptors offer greater rotation invariance, localization ability, and robustness compared to SIFT descriptors.
In the feature point matching phase, the Manhattan distance is used in place of the Euclidean distance to reduce time complexity and improve matching efficiency. In the feature screening phase, the RANSAC (random sample consensus) algorithm randomly selects samples from a consensus set in each iteration to find the largest consensus set for calculating the final model parameters [
21]. However, the number of iterations for parameter calculation is unlimited; setting an upper limit could lead to suboptimal or even incorrect results [
22]. Given the abundance of feature points in natural forest images, RANSAC may face excessive computational demands, resulting in unstable model parameters and reduced matching efficiency. To address this issue, the fast sampling consensus (FSC) algorithm can be employed. FSC reduces computational complexity by using rapid sampling to select subsets of samples for consistency checks and identifies the most consistent set to calculate the final model parameters. Unlike RANSAC, FSC enhances stability by limiting the number of calculations [
23].
2.3.1. Scale Space Detection Strategy Optimization
In the SIFT algorithm, the first step is to construct a scale-space pyramid for the image, using a Gaussian convolution kernel to perform Gaussian blurring on images of different scales. The Gaussian convolution kernel and the resulting Gaussian-blurred images are shown in formulas (1) and (2), respectively. Then, a difference of Gaussian (DoG) pyramid is obtained by subtracting each consecutive pair of layers, as shown in formula (3). After constructing the Gaussian difference pyramid, the next step is to detect scale-space extrema within it. At each scale, the grayscale value of a pixel with its 26 neighboring pixels (including up, down, left, right, and adjacent scales) is compared; if the grayscale value of the pixel is the maximum or minimum, it is marked as a candidate feature point, as shown in
Figure 5.
The Gaussian convolution kernel [
24] is as follows:
The image after Gaussian blur is as follows:
The image after Gaussian difference is as follows:
In this context, ⨂ denotes convolution, I(x,y) represents the image, σ is the image scale parameter, indicating the standard deviation of the Gaussian function, with a default value of 1.6. The scaling factor k is used to indicate changes in the scale of the Gaussian kernel, with a default value of 1.4. L(x,y,σ) is the blurred image at a smaller scale, while L(x,y,kσ) is the blurred image at a larger scale.
During the analysis of image feature extraction, it was observed that while the largest bottom layer of the image pyramid generates the highest number of feature points, its contribution of effective feature points is relatively low. Although feature points in the bottom layer account for over 52% of the total, the fewer feature points from other layers demonstrate an increasing trend in effective contribution. This suggests that the bottom layer contains a significant number of ineffective feature points. After implementing the SIFT-OCT algorithm, the number of keypoints remained unchanged, but efficiency is improved by more than 50%, without compromising stitching quality.
Table 1 and
Table 2 provide an analysis of the proportion of bottom-layer feature points and their effective contributions across different datasets.
2.3.2. Feature Descriptor Optimization
Considering the complex scene stitching of natural forests, when extracting local features from images, in order to obtain more gradient direction and position information about feature points and improve the discriminability and robustness of the descriptor, the more robust and discriminative GLOH (gradient location and orientation histogram) descriptor is chosen. GLOH replaces the 4 × 4 neighborhood sub-blocks in the standard SIFT with log-polar coordinate concentric circles with affine shapes [
22], with the radius of the concentric circles set to 6, 11, and 15. The angles are divided into 8 equal parts, each part being π/4, resulting in a total of 17 image sub-blocks. In each sub-block, the gradient direction histogram is calculated, with the gradient direction divided into 16 directional intervals, allowing for the generation of a 17 × 16 = 272-dimensional feature vector. Using the idea of PCA-SIFT, a typical image’s covariance matrix is established, and the projection matrix is obtained. Then, each feature point undergoes PCA dimensionality reduction, ultimately resulting in a 128-dimensional feature vector that is consistent with the standard SIFT [
25]. The GLOH descriptor is shown in
Figure 6.
2.3.3. Feature-Matching Optimization
The ratio of nearest neighbor distances can describe the similarity of feature descriptors between the nearest and the second-nearest neighbor. By matching descriptors, the initial matching point pairs between the reference image and the image to be registered can be obtained, which support the fitting of the final registration transformation model. Considering that the descriptor is a high-dimensional vector of 128 dimensions, the computation of which can impose a significant time cost on the entire matching phase, this paper uses Manhattan distance instead of Euclidean distance to calculate the similarity of descriptors. Euclidean distance involves summing squares and square root operations, which are computationally complex, as shown in Equation (4). In contrast, the Manhattan distance only requires absolute value and summation operations, making it faster to compute, as shown in Equation (5) as follows:
In Formulas (4) and (5), ed represents the Euclidean distance, and md represents the Manhattan distance. , denotes the set of feature descriptors for the reference image. , is the set of feature descriptors for the nearest neighbor candidate. , is the set of feature descriptors for the second-nearest neighbor candidate. In feature point matching, a threshold R is set for the NNDR (nearest neighbor distance ratio). If the value of the NNDR is less than the threshold R, it indicates that the match pair might be reliable, and the matching point pair is retained, and the default value is 0.7. Otherwise, the matching point pair is discarded, and the initial set of matching point pairs is obtained.
2.3.4. Feature Point Filtering and Optimization
As shown in
Figure 7, given a set C that contains all the points. The RANASC algorithm employs a completely random sampling strategy, randomly drawing samples from the dataset C in each iteration to fit the model. This paper introduces a more optimized sampling strategy—FSC—aimed at reducing the number of iterations. The FSC algorithm uses a relatively smaller value of the ratio Dh between the nearest and the second-nearest neighbor to find the correct correspondences in subset Ch, as assumed in the figure where the red points represent the correct correspondences, forming subset Ch. Meanwhile, the correspondences in set C are matched by a larger value Dl of the nearest and the second-nearest neighbor, assumed to be the blue points in the figure. By iteratively checking the points with a distance ratio less than the threshold in the subset, the algorithm determines whether the outliers conform to the correct correspondences, thereby determining the best model. Compared to the RANASC algorithm, which is completely random, RANSAC may draw invalid samples multiple times in the presence of high noise or a large number of outliers, leading to the greater number of iterations needed to find the best model. The FSC algorithm optimizes the sampling process, reducing the number of iterations, which can accelerate the convergence speed of the model.
2.4. Evaluation Criteria
This paper uses matching pair accuracy and stitching time as important evaluation metrics for natural forest image stitching to analyze the performance of the algorithms studied in this paper.
(1) Matching Pair Accuracy: The accuracy of matched pairs refers to the ratio of the correctly matched point pairs selected by the FSC algorithm during the feature point matching stage to the total number of point pairs involved in the matching process. This ratio reflects the similarity calculation between feature descriptors based on the distance formula after generating feature point descriptions. A correctly matched pair is determined by comparing the nearest neighbor distance to the second-nearest neighbor distance of two image feature points. If the ratio is less than a given threshold, the match is considered valid, forming an initial set of matches. The FSC algorithm selects a subset of point pairs from the initial set to estimate the homography matrix transformation model. Using the estimated homography model, the feature points of both images are mapped to their corresponding positions. Points that fall within a predefined threshold of the estimated transformation are considered inliers, while those outside the threshold are considered outliers. Through an iterative process of resampling and model estimation, the optimal set of inliers is obtained, representing the final set of correctly matched pairs. The formula is as follows:
(2) Stitching Time: The image-stitching time is an important parameter for evaluating the performance of image-stitching algorithms. It reflects the time consumed by the algorithm in processing the image-stitching task. In this paper, the algorithm is executed 30 times, and the average runtime is taken as the final stitching time.
3. Results
To validate the registration performance of the optimized SIFT algorithm with fast sampling consistency feature screening, five datasets were tested and compared with SIFT, SIFT-OCT, PSO-SIFT, and KAZE algorithms. Among these, PSO-SIFT is another improved algorithm based on SIFT that increases the number of correct correspondences by combining the position, scale, and direction of each feature. Due to its high feature-matching accuracy, it is widely used in the registration of remote-sensing images. The KAZE algorithm is characterized by its construction of a non-linear spatial structure, which, compared to the scale-space scaling and Gaussian smoothing method of the SIFT algorithm, produces more feature points. The comparison of algorithms was used to validate the robustness and efficiency of the method. The red line segments in all the data images in the results represent the connections between feature point matches in the two images. The entire process was carried out using MATLAB R2022a software for the algorithm compilation, execution, and testing. The specific experimental hardware and software configurations are shown in
Table 3.
3.1. Orthophoto Registration Effect of Dense Forests
Performing registration experiments on dense forest images, the matching pairs and registration effect of the reference image and the image to be registered were used as references. The registration results after the experiment are shown in
Figure 8. The registration performance comparison mainly refers to the accuracy and registration time, as shown in
Table 4; the red lines represent the correct matching point pairs between the two images.
On dense forest images, the correct rate of the method proposed in this paper is 19.91%, which is increased by 1.75%, 3.72%, 4.21%, and 5.47%, respectively, compared to other algorithms. The stitching time of the proposed method is 48.46 s, significantly shortening the stitching time, which is reduced by 116.28 s, 32.02 s, 208.707 s, and 107.221 s, respectively, compared to other methods. Moreover, the abundance of vegetation in dense forest images affects the number of matching point pairs, leading to a large base for calculating correct matches, which in turn affects the correct matching rate. This indicates that dense forest images can have a negative impact on the accuracy of registration.
3.2. Orthophoto Registration Effect of Non-Dense Forests
Registration experiments were conducted on non-dense forest images, using the matching pairs and registration effects of the reference image and the image to be registered as references. The resulting image after the experiment is shown in
Figure 9. The registration performance comparison primarily refers to the accuracy and registration time, as shown in
Table 5.
For non-dense forest images, the method proposed in this paper has a correct rate of 32.03%, which is increased by 1.43%, 3.18%, 13.32%, and 1.03%, respectively, compared to the other algorithms. The stitching time of the proposed method is 48.46 s, significantly shortening the stitching time, which is reduced by 113.956 s, 33.576 s, 206.936 s, and 112.796 s, respectively, compared to the other methods. Compared to the dense vegetation in the dense forest images, the number of matching point pairs in the sparse images shows a decreasing trend, which is inversely proportional to the increasing trend of correct matching point pairs, resulting in an improvement in matching accuracy.
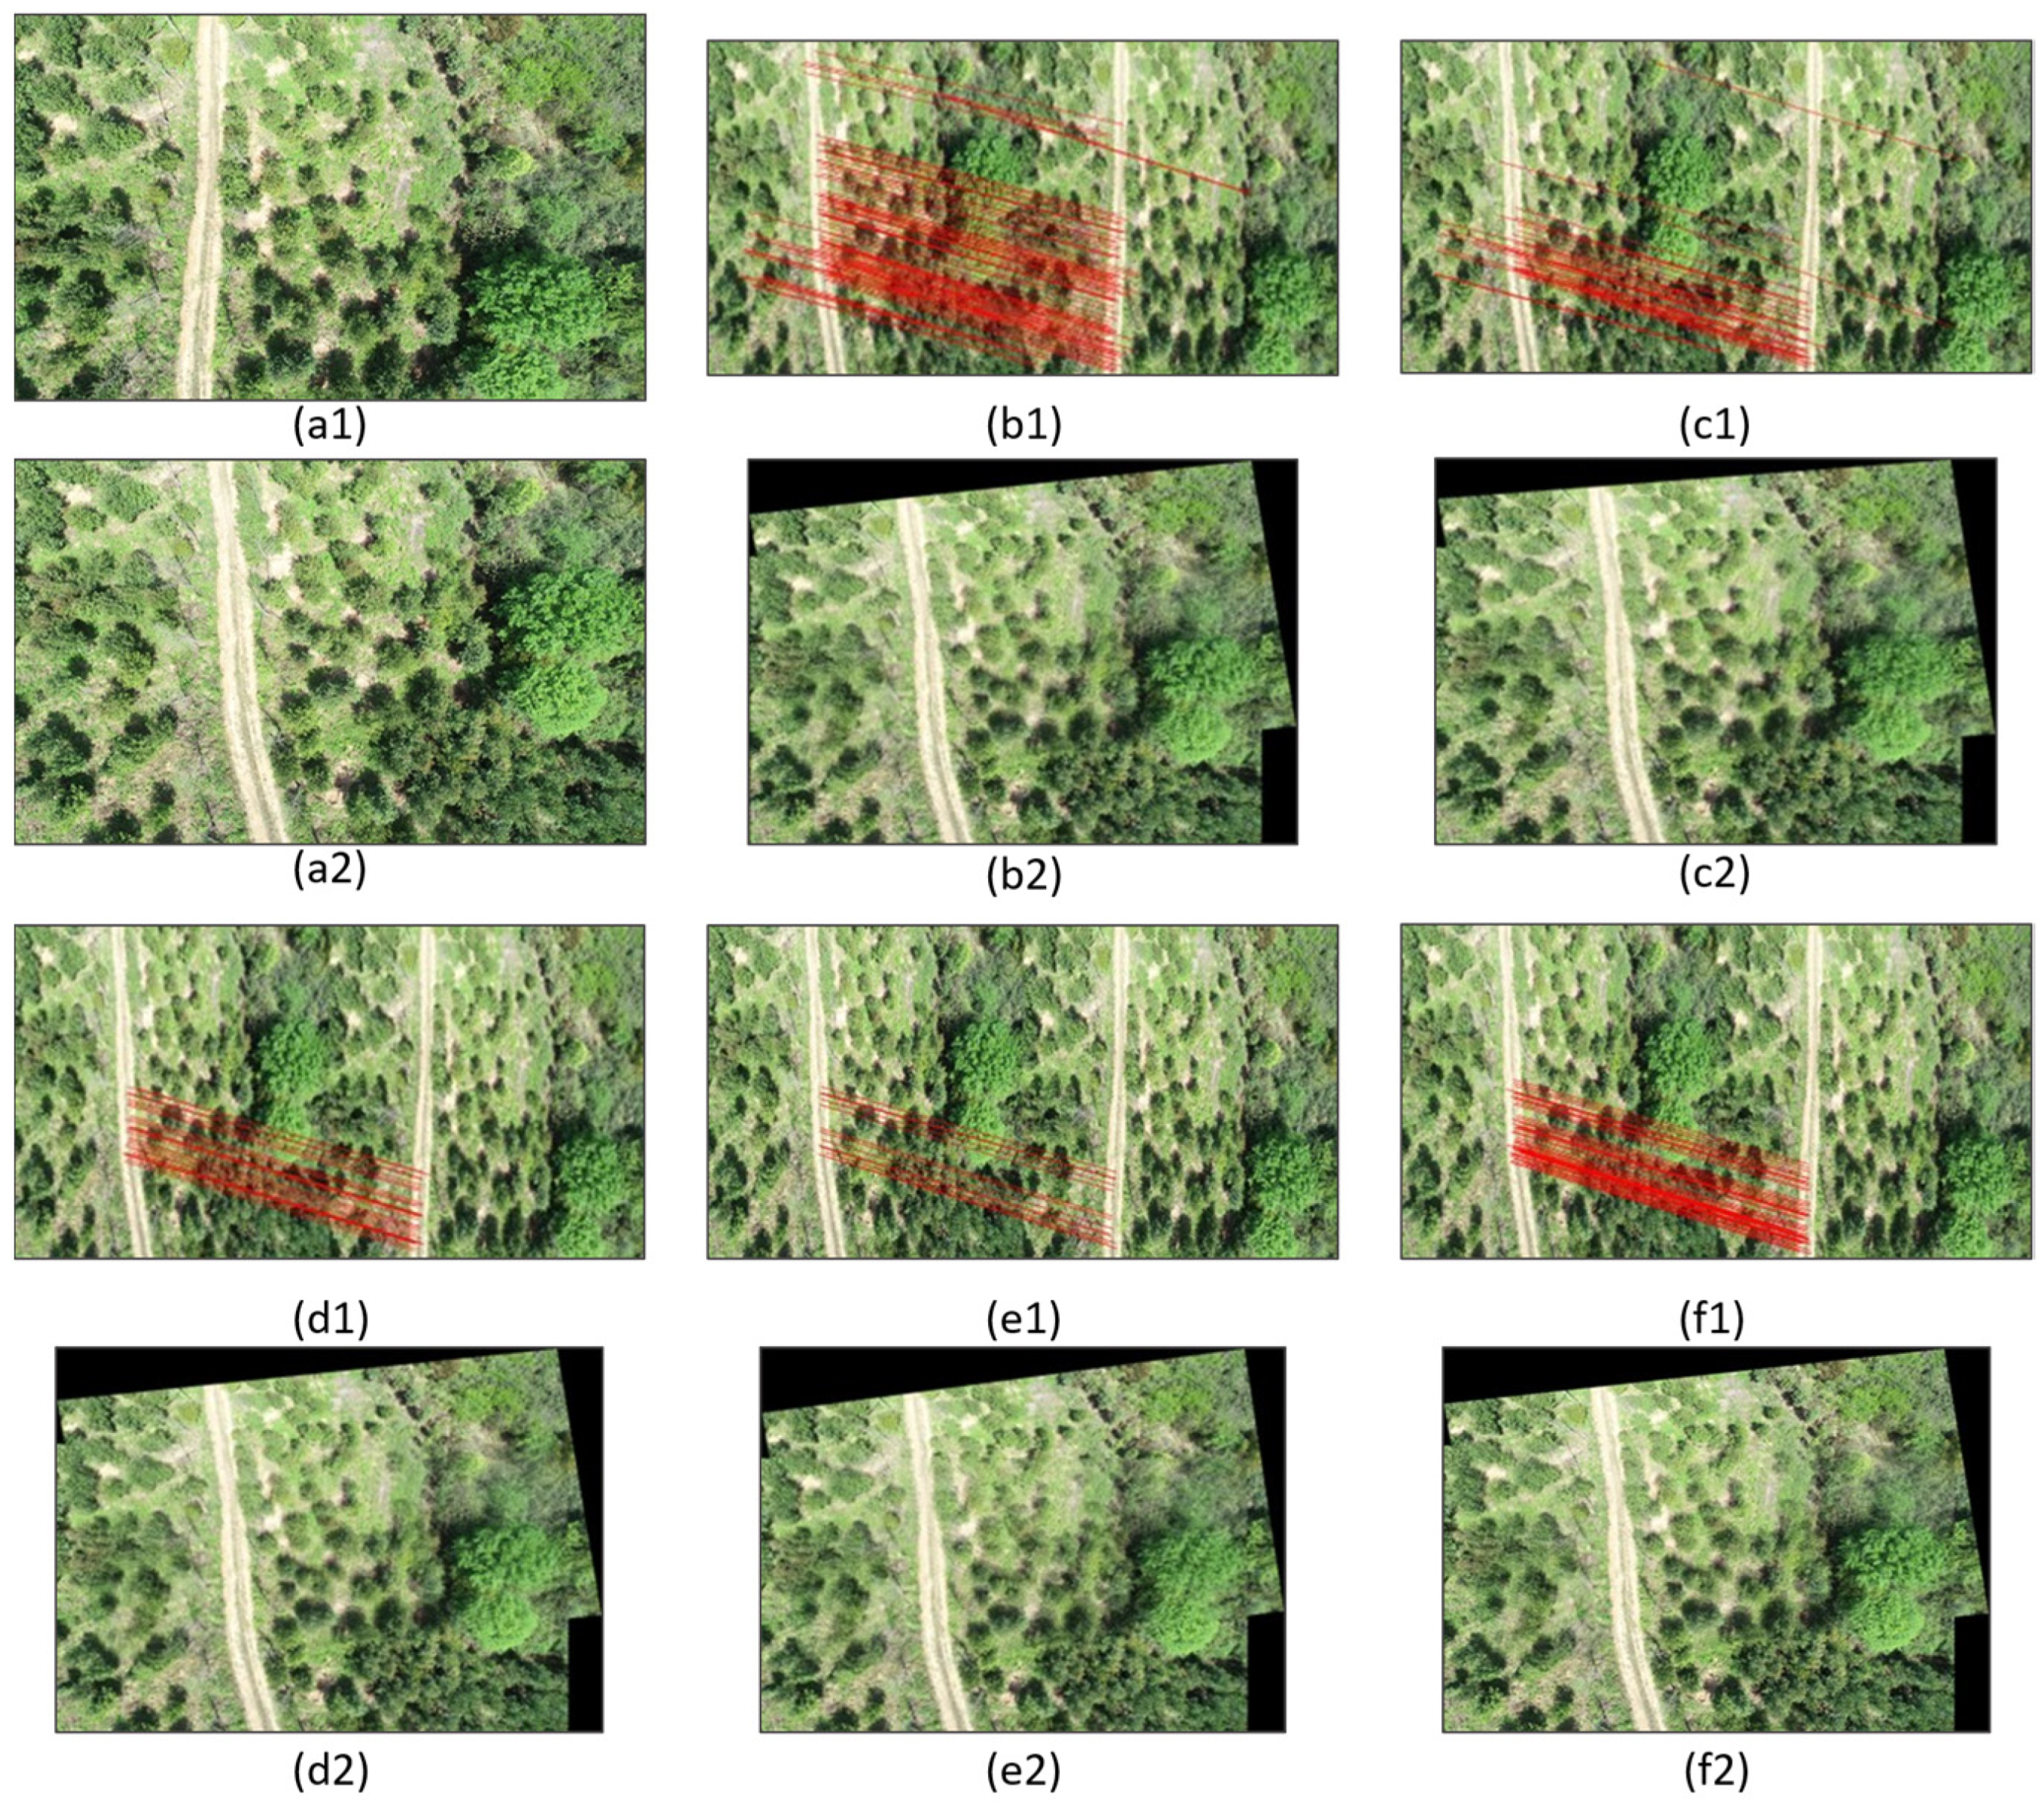
3.3. Orthophoto Registration Effect of Forest Images with Overlap Rate of 60% to 90%
Registration experiments were conducted on forest images with an overlap rate of 60% to 90% using the matching pairs and registration effects of the reference image and the image to be registered as references. The resulting image after the experiment is shown in
Figure 10. The registration performance comparison primarily refers to the accuracy and registration time, as shown in
Table 6.
The proposed method for forest images with a 60%–90% overlap achieves a 15.92% correct rate, outperforming SIFT, SIFT-OCT, and KAZE by 1.81%, 3.69%, and 1.6%, respectively. The stitching time is 53.12 s, faster than the other three methods, by 116.85 s, 31.5 s, and 105.116 s. Although PSO-SIFT’s accuracy is 3.08% higher due to its enhanced feature matching, it is 214.515 s slower. The KAZE algorithm exhibits ghosting in the stitching, and the angle issues affect the registration quality.
3.4. Orthophoto Registration Effect of Forest Images with Overlap Rate of 30% to 60%
Registration experiments were conducted on forest images with an overlap rate of 30% to 60%, using the matching pairs and registration effects of the reference image and the image to be registered as references. The resulting image after the experiment is shown in
Figure 11. The registration performance comparison primarily refers to the accuracy and registration time, as shown in
Table 7.
On forest images with an overlap rate of 30% to 60%, the method proposed in this paper has a correct rate of 48%, which is increased by 3.38%, 4.98%, and 2.63%, respectively, compared to those of the SIFT, SIFT-OCT, and KAZE algorithms. The stitching time of the proposed method is 44.753 s, which is shorter than these three methods by 116.85 s, 31.5 s, and 105.116 s, respectively. Compared to the PSO-SIFT algorithm, the proposed method has a 9.14% decrease in accuracy. In terms of time, the proposed method is 220.207 s faster than the PSO-SIFT algorithm.
3.5. Orthophoto Registration Effect of Forest Images with Overlap Rate Below 30%
Registration experiments were conducted on forest images with an overlap rate below 30%, using the matching pairs and registration effects of the reference image and the image to be registered as references. The resulting image after the experiment is shown in
Figure 12. The registration performance comparison primarily refers to the accuracy and registration time, as shown in
Table 8.
From the original forest images with an overlap rate below 30% and the registration effects of various algorithms, it can be observed that there is a significant difference in angle changes. The method proposed in this paper has a correct rate of 50%, which is 19.24% higher than that of the SIFT-OCT algorithm. Compared to the other three algorithms, the accuracy is lost by 4.76%, 14%, and 5.31%, respectively. In terms of time, it is 155.74 s, 35.5 s, 246.162 s, and 127.72 s faster than the four comparison algorithms, respectively.
3.6. Quantitative Decomposition Algorithm and Time Complexity
Additionally, this paper analyzes the time analysis and time complexity analysis of the feature descriptor generation and the breakdown of feature-matching operations for the algorithm. As shown in
Table 9 the resolution of the input image is 2560 × 1440. According to
Table 9, when generating feature descriptors, the algorithm proposed in this paper and SIFT-OCT are at the same level, reducing the generation of feature points in the first layer of the scale space and thus improving computational efficiency. Compared to other algorithms, the improvements are 38.92%, 0.62%, 47.17%, and 37.62%, respectively. Regarding the calculation of the time complexity for feature descriptors, it includes the construction of the scale-space pyramid, the detection of extrema, and the generation of descriptors. Here, M,N represents the image size, O((M × N)
) is the complexity of scale-space detection, and O(R × K × D) is the time complexity for generating descriptors, where R is the number of pyramid sub-regions, K is the number of feature points in each sub-region, and D is the descriptor dimension, C represents the proportion of effective feature points to the total number of feature points after skipping the first layer of the scale space. For the time of feature point matching, with a distance threshold set to 0.7, the efficiency of the algorithm proposed in this paper, using the Manhattan distance for initial matching and the subsequent FSC algorithm, has been improved by 72.40%, 44.57%, 81.71%, and 71.37% compared to the other algorithms. The time complexity of feature matching is the sum of the complexity of the initial matching and the complexity of registration fitting. Where K1 and K2 are the number of feature points in the two images, S is the time complexity of NNDR and Euclidean distance, M is the time complexity of NNDR and the Manhattan distance. T is the number of iterations for the RANASC algorithm, T’ is the number of iterations for FSC, I is the number of inliers, and D is the descriptor dimension. The overall time complexity can be calculated as the sum of the time complexities of the two stages.
4. Discussion
As shown in
Figure 13, the method proposed in this paper leads in terms of its matching accuracy for dense and non-dense forest images, while it lags behind the PSO-SIFT algorithm in terms of matching accuracy for the three types of forest images categorized by overlap rates. Upon analysis, it was shown that the PSO-SIFT algorithm’s enhanced feature-matching method becomes more robust as the image overlap rate decreases and the angle variation increases. This results in a higher matching accuracy compared to the proposed method. This is one of the reasons for our comparative study of the PSO-SIFT algorithm. The major drawback of the proposed method is that it significantly increases the time required for the feature-matching phase. In the case of images with an overlap rate of 30% or less, the proposed method falls behind the SIFT, PSO-SIFT, and KAZE algorithms in matching accuracy. Upon analysis, it was found that these types of data images have larger angle variations, similar structures to natural forest images, and a large number of green pixels. Additionally, the strategy of skipping the first scale-space octave results in a very small number of effectively identified feature points. As a result, the base for calculating the matching accuracy becomes smaller, leading to a decrease in matching accuracy. However, the deficiency in matching accuracy does not affect the registration image quality and effect.
As shown in
Figure 14, the proposed algorithm is, on average, 3.66 times, 1.71 times, 5.67 times, and 3.42 times faster than the compared algorithms in terms of registration times. The main factors contributing to the registration time are the feature extraction phase and the feature-matching phase. To address this issue, the improvements made in these two phases have shown significant effects. As can be seen in the figure, the proposed method for feature extraction and feature matching has faster performance in terms of speed.
Regarding the trade-off between feature-matching accuracy and registration time for the improved algorithm proposed in this paper, on the one hand, aside from the SIFT-OCT algorithm, other baseline methods generate a high number of feature points due to robust feature extraction, resulting in nearly double the time required for generating feature descriptors. This makes these methods less practical for image registration tasks that demand high efficiency. The proposed method uses GLOH descriptors to effectively address the issue of decreased accuracy in the SIFT-OCT algorithm caused by the low number of feature points due to its feature-detection strategy. Additionally, a low-complexity distance matching strategy and an efficient outlier removal method are adopted, significantly reducing the registration time compared to other baseline methods. The experimental results demonstrate that the improved algorithm maintains high matching accuracy while significantly reducing the overall registration time.
Additionally, a more in-depth analysis was conducted on the impact of vegetation coverage on algorithm accuracy, excluding the effects of significant disparity-induced pixel distortion. Accuracy tests were carried out using three sets of test images with progressively decreasing vegetation coverage. As illustrated in
Figure 15, the green line segments represent the initial matching results between the two images, while the red line segments indicate the correct matched point pairs after filtering. The results in
Table 10 indicate that, as the vegetation coverage decreases, the number of initial matched point pairs also decreases, which in turn improves accuracy. High vegetation coverage often introduces a substantial number of invalid feature points, thereby negatively affecting the matching accuracy of the algorithm.
The trade-off between feature-matching accuracy and registration time for the improved algorithm proposed in this paper is addressed. On the one hand, except for the SIFT-OCT algorithm, the other baseline methods nearly double the time for generating feature descriptors due to the high number of feature points resulting from robust feature extraction, which is not practical for tasks like image registration that demand high efficiency. Our method effectively addresses the accuracy degradation issue of the SIFT-OCT algorithm’s feature-detection strategy, which is caused by a limited number of feature points, by utilizing the GLOH descriptor. Additionally, by adopting a distance matching strategy with low time complexity and an efficient method for removing erroneous points, the registration time is significantly reduced compared to other baseline methods. The experimental results show that the improved algorithm significantly cuts down on the overall registration time while maintaining a high matching accuracy.
As shown in
Figure 16, the red markers indicate the detected feature points, while the yellow markers highlight examples of significant distortion and parallax in the overlapping regions between the reference image and the image to be registered. By comparing the orange boxes, it can be observed that in both images, there is distortion at the same position due to a large change in angle. For images with a 30% overlap ratio, the main challenges faced in feature extraction and matching are due to the small overlap area, which results in fewer reliable feature points. Additionally, the reduction in the overlapping region exacerbates distortion and parallax issues, making accurate matching more difficult.
5. Conclusions
This study improves the SIFT algorithm for feature extraction in natural forest images by optimizing the image registration process to suit their unique characteristics. By skipping the first scale-space octave, we reduce feature-detection time, enhancing overall efficiency. Due to the structural similarities in natural forests, which limit effective feature points for matching, we use the robust GLOH descriptor to ensure accurate registration, even with fewer points. During matching, the Manhattan distance is applied to further boost efficiency while maintaining sufficient feature pairs. The FSC algorithm then refines accuracy by eliminating erroneous matches and estimating transformation matrices. The robustness of our method was confirmed through comparisons with four other algorithms across five different datasets, effectively handling variations in vegetation density and overlap rates during registration.
While this paper presents an optimized registration method for high-resolution natural forest images, the performance still faces challenges with varying overlap ratios, particularly when the overlap ratio falls below 30%. In such scenarios, the overlapping region between the reference image and the image to be registered becomes limited, leading to increased parallax and more pronounced distortion, which negatively affects the matching accuracy. This poses a significant challenge for real-time stitching tasks. Future research could focus on developing more robust feature-detection methods, such as integrating deep learning features with traditional image texture features, to enhance matching performance in high-parallax, high-distortion conditions while maintaining strong real-time capabilities.


