Abstract
Developing high-efficiency mixed forests or converting low-efficiency pure forests into near-natural mixed forests with optimal structure and function is a crucial aspect of forest management. In the initial stages of afforestation or stand improvement, fertilization and planting distance significantly influence the formation and development of mixed forests. This study investigated how nutrients and planting distance affect root competition between five-year-old Chinese pine (Pinus tabuliformis) and one-year-old Chinese white poplar (Populus tomentosa) and identified the factors influencing the competitive ability of these two species. Field planting experiments used three fertilization gradients (63 g·m−2, 125 g·m−2, and 250 g·m−2) of Stanley compound fertilizer with an N:P:K ratio of 2:1:1 and two planting distances (25 cm and 50 cm). Each experimental group was planted in circular plots with a radius of 0.5 m, yielding a total of nine plots. The effects of different fertilization concentrations and planting distances on root distribution were analyzed both horizontally and vertically. Pearson correlation analysis was used to assess the relationship between roots and soil nutrients, while Levins’ niche overlap formula evaluated the differences in root competition between the species. Furthermore, principal component analysis quantified the relationships between impact factors and the root competitiveness of the two species. Results indicated that both species primarily allocated their fine root biomass to the shallow 0–10 cm layer. Pinus tabuliformis primarily extended to the southwest, while Populus tomentosa predominantly grew to the north. Both species exhibited enhanced root growth at moderate nutrient concentrations of 125 g·m−2. At a planting distance of 50 cm from Pinus tabuliformis, Populus tomentosa seedlings demonstrated superior root growth compared to those planted 25 cm apart. Pinus tabuliformis demonstrated greater competitive ability in the deeper 10–30 cm soil layers compared to Populus tomentosa, which showed the opposite pattern in the shallow 0–10 cm layers. Furthermore, available phosphorus (contribution rate of one impact factor on the competitiveness indexes, CR: −0.998), organic matter (CR: −0.978), total nitrogen (CR: −0.947), and alkali-hydrolysable nitrogen (CR: −0.937) significantly negatively impacted the competitiveness indexes of Pinus tabuliformis. The fine root surface area, volume, and length of Populus tomentosa also significantly negatively affected its competitiveness indexes, with all contribution rates exceeding an absolute value of 0.847. Results indicated that the root distributions of Pinus tabuliformis and Populus tomentosa overlapped spatially, with each species exhibiting advantages in different regions. Therefore, in future plantation reconstruction and forest management, it is essential to thoroughly evaluate root, soil, and fertilizer factors, adjusting planting distances accordingly, to effectively mitigate competition between the two species and successfully establish a mixed forest.
1. Introduction
Over the past thirty years, numerous artificial forests have been established globally to enhance the ecological environment [1]. Most of these forests are pure, while some are mixed, which offers better structural and functional characteristics and resembles natural forests more closely [2]. Recently, numerous studies have focused on converting low-efficiency pure forests, characterized by poor growth or function, into more efficient mixed forests [3]. For instance, methods such as mixed planting during initial afforestation, thinning and replanting of middle-aged forests, and the transformation of mature and over-mature forests are commonly used in afforestation and forest management [4,5]. Among the factors influencing the establishment and transformation of mixed forests, the selection and arrangement of tree species are extremely important. The competitive relationships among different tree species significantly affect seedling survival and growth, serving as intrinsic drivers of community succession [6]. The benefits of mixed forests depend on both aboveground and belowground interactions. Numerous studies show that root interactions are more crucial than aboveground interactions for determining resource utilization in intercropped communities [7,8]. Root competition is a mutually beneficial process for plant growth, where root development and spatial distribution directly influence nutrient absorption and utilization efficiency [9]. Fine roots, the primary organs for water and nutrient uptake in seedlings, exhibit characteristics such as a large absorption surface area, high physiological activity, and rapid growth and turnover [10]. When soil resource conditions change, plants can quickly adjust the structure and function of their fine roots to maximize resource use and adapt to competition [11]. Despite substantial progress in aboveground ecological research, its theories and methods are not directly applicable to belowground studies [12]. Therefore, investigating root responses during the growth processes of forest trees can further refine theories of competition in mixed forests.
During the initial stages of afforestation, seedling survival and growth are significantly influenced by nutrient supply and planting distance. Insufficient nutrient supply among tree species can alter their growth, development, and ecological niches [13]. Proper fertilization promotes the growth and development of forest root systems, maintains nutrient balance, and enhances economic benefits [14,15,16]. Fertilization significantly improves seedling morphological characteristics, such as root length and surface area [17]. It also encourages plants to absorb and store excess nutrients internally, enhancing nutrient absorption capacity, stress resistance, and growth rate [18]. For instance, fertilization significantly enhances the growth of pine (Pinus contorta Douglas ex Loudon) [19]. Phosphate fertilizer is crucial in facilitating root restoration on boreal Sphagnum-dominated peatlands [20]. On the other hand, planting distance is crucial for seedling growth and development. Close planting distances can enhance the overall utilization of light, water, and nutrients by seedling populations, leveraging population effects to boost productivity [21]. Taking Eucalyptus grandis, for instance, closely planting distances can enhance light energy utilization efficiency and increase stand production [22]. The planting distance can also alter nutrient cycling, as poplar increase nutrient utilization through closer and intimate underground interactions with other species. [23]. However, some studies have suggested that close planting distances increased competition intensity for nutrients and living space, which might hinder seedling root development [24,25]. Therefore, both fertilization concentration and planting distance are crucial for effective resource utilization, establishing a favorable population structure, and maximization of population advantages [26]. The optimal combination of these factors should maximize resource synergy and support the sustainable development of root systems across all tree species in mixed forest, thus ensuring successful forest establishment.
The Chinese pine (Pinus tabuliformis) and Chinese white poplar (Populus tomentosa) have been extensively planted as pure artificial forests during restoration efforts in the northern Rocky Mountains and the Loess Plateau in China. Pinus tabuliformis, a coniferous evergreen tree in the Pinaceae family, is characterized by deep roots and thrives in dry, cold climates. It is resistant to poor soils, cold, and wind, and can grow in deep, well-drained, acidic, neutral, or calcareous loam soils [27]. Populus tomentosa, commonly known as Chinese white poplar, belongs to the Salicaceae family. It is a deciduous tree species with a shallow root system, preferring sunny locations and thriving in cool, moist climates. It has well-developed roots, grows quickly, and is tolerant to smoke and pollution. These species are respectively coniferous and broad-leaved. They have distinct growth cycles and offer ecological and economic benefits at different times. Their roots are distributed across different soil layers, and their habitat requirements vary [28]. Among the root systems, fine roots (diameter ≤ 2 mm) play a crucial role in nutrient and water uptake in forest ecosystems and impact biogeochemical cycling by rapidly turning over biomass [29]. They are the most physiologically active components in forest soils. Considering their growth characteristics and resource utilization, these species are suitable for converting pure plantations into mixed ones. However, these species predominantly occur in pure forests, with mixed scenarios being less common. Therefore, the suitability of mixed planting, especially concerning root system development, requires further investigation in different regions.
Currently, the distribution of root systems (especially fine roots) and underground competition in mixed forests of Pinus tabuliformis and Populus tomentosa under varying nutrient levels and planting distances remain unclear. This study aims (1) to examine the spatial distribution of root systems and interspecies underground competition strategies at the seedling stage, (2) to optimize planting densities, and (3) to enhance the efficiency of light and soil use in mixed forests of these two species. The root systems of Pinus tabuliformis and Populus tomentosa were investigated by manipulating fertilization gradients and planting distances. The following hypotheses will be analyzed and verified as follows: (1) Since Pinus tabuliformis and Populus tomentosa are deep-rooted and shallow-rooted species, respectively, their fine roots can be distributed separately when seedlings are planted together; (2) higher fertilizer concentrations should promote better root growth in both seedlings; and, (3) due to more intense interspecific competition, smaller planting distance patterns may negatively affect seedling growth more.
2. Materials and Methods
2.1. Study Area
The experimental site was established at the forestry station of Shanxi Agricultural University in the Taigu District of northeastern Jinzhong, central Shanxi Province (112°34′43.83″–112°34′44.19″ E, 37°25′49.88″–37°25′50.59″ N, Shown in Figure 1) [30]. Taigu experiences a warm temperate continental climate, with an annual average temperature of 12.4 °C. Seasonal temperatures range from 10 °C in spring to 22 °C in autumn. The region exhibits distinct seasons: cold, dry winters with minimal snowfall; hot, rainy summers; and dry, windy springs. The average annual sunshine duration is 2527.5 h, with total precipitation of 397.1 mm and a frost-free period of 179 days. The annual average evaporation is approximately 1765.9mm. This climate provides abundant sunlight. The predominant soil type in Taigu is cinnamon soil, typically formed under xerophytic forest conditions in a warm temperate, semi-humid climate. This soil type often exhibits an argic horizon and a calcic horizon, and is generally in a dry state, with a sparse and porous surface layer [31]. The region’s wild vegetation includes tree species such as Pinus tabuliformis, Populus tomentosa, Salix babylonica L., Ulmus pumila L., and Robinia pseudoacacia L., along with shrubs like Lycium chinense Miller, Hippophae rhamnoides L., and Rosa xanthina Lindl [32].
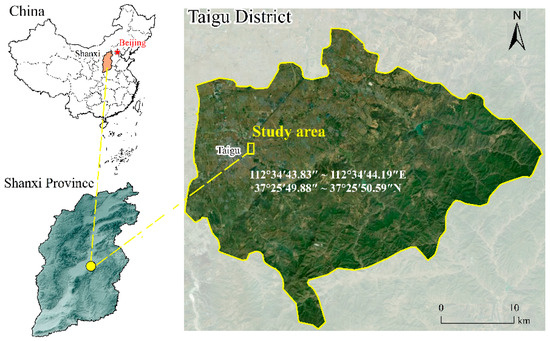
Figure 1.
Location map of the study area. The yellow area in the figure was the research area.
2.2. Experimental Design and Test Materials
In this experiment, common afforestation species in Shanxi Province, Pinus tabuliformis (hereinafter referred to as PIT) and Populus tomentosa (POT), were selected as experimental subjects. In April 2021, the annual cuttings of POT were planted around a central five-year-old seedling of PIT at radial distances of 25 cm and 50 cm in eight directions (POT25 denoted Populus tomentosa at a 25 cm radius from Pinus tabuliformis; POT50 denoted Populus tomentosa at a 50 cm radius from Pinus tabuliformis), as depicted in Figure 2. PIT seedlings were selected from the same cohort to ensure similar growth conditions, heights, and ground diameters. POT seedlings were propagated through hardwood cuttings from three-year-old lateral branches of Populus tomentosa. During the dormancy period, healthy and well-developed one-year-old woody cuttings with few lateral buds, and free from diseases and pests were selected. Excess leaves were removed, and the cuttings were bundled in specified quantities and wrapped in moist burlap bags before being stored in a refrigerated chamber at 0–4 °C. For the experiment, the basal ends of the stored cuttings were trimmed to approximately 10 cm to serve as cuttings for Populus tomentosa, ensuring that each segment contained 2–3 viable buds.
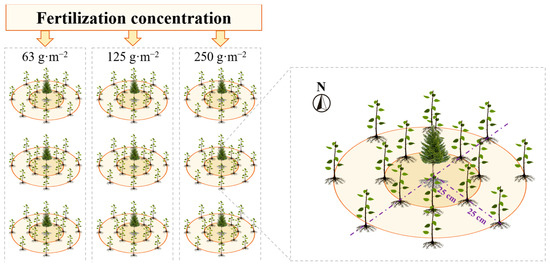
Figure 2.
Experiment Layout. Eight seedlings of Populus tomentosa were planted with Pinus tabuliformis as the center and 25 cm and 50 cm as the radius respectively.
To ensure uniform initial nutrient levels at all sample points, the soil preparation involved thorough mixing of the 30 cm layer at each site. This ensured homogeneity in soil properties throughout the study area. The soil properties were uniformly distributed across all sample points. The initial soil nutrients are shown in Table 1, referring to Wei, et al. [30]. After planting, Stanley compound fertilizer (Stanley Agricultural Group, Inc., Linyi, China), with an N:P:K ratio of 2:1:1, was employed as the standardized fertilizer. It was applied at three levels: 63 g·m−2, 125 g·m−2, and 250 g·m−2, with each treatment replicated three times, resulting in nine experimental plots. To prevent cross-contamination of fertilizer between adjacent sites, a 50 cm-deep plastic partition was installed between them to isolate nutrient flow. Throughout the trial, regular management of seedlings, including watering and weeding, was performed to ensure consistent survival rates.

Table 1.
Initial soil nutrient values in the experimental area.
2.3. Sample Collection and Measurement Indicators
2.3.1. Root and Soil Sampling
In September 2022, the complete root systems of PIT and POT were excavated using the whole-plant excavation method for measurement. The horizontal distribution of the root systems was categorized into four directions: northeast, southeast, northwest, and southwest, relative to the trunk. Vertically, the soil was stratified into four layers: 0–5 cm, 5–10 cm, 10–15 cm, and 15–30 cm, with no fine roots observed below 30 cm. A 1-m radius excavation area was established around the PIT as the center point. Surface debris, such as weeds and litter, was removed, and a shovel was used to carefully dig around the perimeter of the root system, starting from the outer edge and moving inward to avoid damaging the roots and maintaining their integrity. When fine roots were exposed, they were gently shaken to separate loose soil while preserving the rhizosphere soil attached to the root surface. Once fully exposed, scissors were used to collect samples of the roots based on their horizontal and vertical distribution. The samples were placed in labeled collection bags and transported to the laboratory.
In the laboratory, fine roots were measured using electronic calipers to separate them. Tweezers and brushes were employed to remove soil from the roots while rhizosphere soil was collected. Each composite soil sample for chemical property analysis consisted of three samples from different soil layers. The samples were air-dried and then filtered through a 2 mm sieve [33].
2.3.2. Fine Root Morphological Parameters
Previous studies showed that fine roots played a crucial role in nutrient uptake in forest ecosystems and were the most physiologically active components [30,34]. This study focused on several fine root morphological parameters: length, surface area, volume, specific length, and biomass. These indicators represented the distribution characteristics of fine roots. In the laboratory, roots were cleaned, and fine roots (0–2 mm diameter) were selected with digital calipers and scanned using an EPSON Perfection V750 scanner (Seiko Epson Corporation, Suwa, Nagano, Japan). The images were analyzed with Win-RHIZO Pro 2012 root analysis software to obtain fine root length, surface area, and volume. Subsequently, the roots were dried to a constant weight in an 85 °C oven, weighed using an electronic balance accurate to 0.001 g, and their biomass was calculated. Specific root length was then calculated using the formula:
2.3.3. Soil Nutrient Characteristics
Total nitrogen content in the soil was determined using selenium powder, copper sulfate, and sulfuric acid digestion, followed by analysis with a Kjeldahl Nitrogen Analyzer (K1100, Hanon Group, Jinan, China). Total phosphorus content in the soil was measured using perchloric acid–sulfuric acid digestion followed by molybdenum–antimony spectrophotometry. Organic soil matter content was assessed using the K2Cr2O7 oxidation method. Alkaline nitrogen content in the soil was measured using the alkali diffusion method, while available phosphorus content was determined by extracting with 0.5 mol/L NaHCO3 [35,36].
2.3.4. Intensity of Belowground Inter-Species Competition
Levins’ ecological niche overlap measure indicates the extent to which species shared resources and overlapped ecologically, reflecting competition [37,38]. Applying Levins’ formula, the underground competitive indexes were calculated. A higher index indicated greater competitive ability. The formulas were as follows:
where r denoted the number of resource dimensions (specifically r = 4; when calculated the overall competition index, ‘r’ referred to the horizontal resource dimensions in four directions. For competition between different soil layers, ‘r’ indicated the vertical resource dimensions, corresponding to four soil layers.). Labc denoted the competitive index of PIT against POT25 and POT50, Lbac represented the competitive index of POT25 against PIT and POT50, and Lcab stood for the competitive index of POT50 against PIT and POT25. B denoted the ecological niche width index, where Ba, Bb, and Bc had thresholds between 1/r and 1, while Labc, Lbac, and Lcab had thresholds between 0 and 1. Paj, Pbj, and Pcj represented the proportion of j—the resource dimension utilized by PIT, POT25, or POT50, relative to their total resource utilization, calculated using fine root biomass. Here, the resources included organic matter, nitrogen, phosphorus and so on, closely related to root biomass.
2.4. Statistical Analysis
One-way analysis of variance (ANOVA) was conducted using SPSS 25.0 (IBM/International Business Machines Corporation, Armonk, NY, USA) to assess significant differences among the metrics for PIT, POT25, and POT50 under single-factorial treatments of fertilization and nursery conditions. Post hoc LSD tests were conducted following significant ANOVA results to analyze specific differences between treatments. Pearson correlation analyses conducted using the “cor” function from the “ellipse” and “RColorBrewer” packages in R version 4.3.1. The assumptions of normality and homogeneity of variance for each variable were verified using the Shapiro–Wilk test and the Levene test. The root indicators all met the hypothesis, while the alkaline nitrogen content and total phosphorus content in the soils did not meet the hypothesis. Logarithmic and reciprocal conversions were used to convert them separately to meet the analysis requirements. Principal component analysis (PCA) was conducted and visualized using the “PCA()” function from the “FactoMineR” package in R version 4.3.1, and the results were extracted with the “factoextra” package. Data were graphically represented using Origin 2022 software (OriginLab, Northampton, MA, USA).
3. Results
3.1. Fine Root Characteristics in the Mixed Planting Seedlings of Pinus tabuliformis and Populus tomentosa
3.1.1. Fine Root Biomass
In the mixed planting experiment, fine root biomass of PIT, POT25, and POT50 showed significant spatial heterogeneity in both horizontal and vertical directions. Figure 3a shows that the fine root biomass of PIT generally increased and then decreased with higher fertilizer concentrations in the southeast, northwest, and southwest directions. However, in the northeast direction, the biomass was less affected by fertilizer concentration. For POT25, the fine root biomass decreased with increasing fertilizer concentration in the northeast, southwest, and northwest directions, except at 250 g·m−2. In the southeast direction, the biomass significantly increased compared to 63 g·m−2. In the northwest and southwest directions, the fine root biomass of POT50 increased with higher fertilizer concentrations. Overall, at a fertilizer concentration of 125 g·m−2, the fine root biomass of PIT was higher than at other concentrations, except in the northeast direction, reaching its maximum in the southwest direction. On the other hand, the maximum was observed for POT25 at 63 g·m−2 in the southeast direction, while POT50 reached its maximum at 250 g·m−2. This demonstrated that optimal fertilization concentrations for fine root growth differed between PIT and POT (planted at different distances from PIT). Additionally, the combined effects of planting distance and fertilizer concentration led to distinct distributions of fine root biomass in the four horizontal directions.
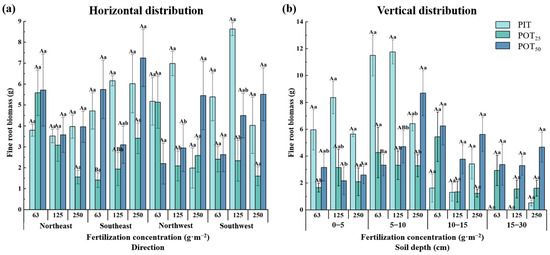
Figure 3.
The horizontal (a) and vertical (b) distribution characteristics of fine root biomasses within different fertilizer concentrations. (a) Different capital letters indicate that there were significant differences between different fertilization concentrations at the same distance in the same horizontal direction; different lowercase letters indicate that there were significant differences between different trees with the same fertilization concentration in the same horizontal direction; the same capital letter indicates that there was no significant difference (p < 0.05). (b) Different capital letters indicate that there were significant differences between the same distance and different fertilization concentrations at the same soil depth; different lowercase letters indicate that there were significant differences between different trees with the same fertilization concentration at the same soil depth; the same capital letter indicates that there was no significant difference (p < 0.05). PIT is the abbreviation for Pinus tabuliformis; POT25 is the abbreviation for Populus tomentosa at a 25 cm radius from Pinus tabuliformis; POT50 is the abbreviation for Populus tomentosa at a 50 cm radius from Pinus tabuliformis. The above notes are the same for same as figures below.
In the vertical directions (Figure 3b), the fine root biomasses of PIT, POT25, and POT50 generally increased and then decreased with soil depth, peaking in the 5–10 cm layer and being second highest in the 0–5 cm layer across all fertilizer concentrations. In the 0–5 cm layers, the fine root biomasses of both PIT and POT25 increased and then decreased with higher fertilizer concentrations, while the trend for POT50 was reversed. In the 5–10 cm layer, the fine root biomass of PIT increased and then decreased, similar to the surface layer. POT25 showed the opposite trend. In addition, POT50 showed an increase, with significant differences between fertilizer concentrations of 250 g·m−2 and 63 g·m−2. Despite variations with the fertilization concentrations, the fine root biomass in the 5–10 cm layer was the largest among the total biomass for both tree species. At fertilizer concentrations of 63 g·m−2, PIT, POT25, and POT50 contributed 60.3%, 29.9%, and 20.7%, respectively, of the total fine root biomass; at 125 g·m−2 the contributions were 54.9%, 35.5%, and 33.7%, respectively; and at 250 g·m−2 the contributions were 40.1%, 40.0%, and 40.3%, respectively. That indicated the roots of all three seedling types were developed in this layer, with PIT performing better than POT. In the 10–15 cm and 15–30 cm layer, the fine root biomasses of PIT and POT50 decreased and then increased with soil depth across all fertilizer concentrations. For POT25, the fine root biomass was highest at 63 g·m−2 and decreased at higher fertilization levels to nearly the same value. Thus, planting distance and fertilization concentration significantly affect fine root biomass at different soil depths. Specifically, in the active 5–10 cm layer, the fine root biomass of POT50 was significantly greater than that of POT25 at a fertilizer concentration of 250 g·m−2. It can be inferred that planting distance was crucial for the growth of Populus tomentosa under high nutrient conditions.
3.1.2. Fine Root Length
Fine root length was an important indicator of root morphology. As shown in Figure 4a, the fine root lengths of PIT showed patterns of increasing and then decreasing with increasing fertilizer concentration in all four horizontal directions. The fine root lengths of POT25 and POT50 (except in the northwest direction) exhibited the opposite trends. The response of PIT fine root lengths to fertilizer concentration indicated that a medium concentration (125 g·m−2) was optimal for their growth. The maximum root length was observed in the southwest direction, with the second largest in the northwest direction. On the other hand, in the northeast direction, the fine root length of POT25 at 63 g·m−2 was significantly greater than those at other concentrations. In the northwest direction, POT50 had the maximum fine root length at a concentration of 125 g·m−2. At 250 g·m−2, the fine root of both POT25 in the northwest direction and POT50 in the northeast direction were also increased. This pattern indicated that the root system of Pinus tabuliformis extended westward under moderate fertilization, while Populus tomentosa extended northward under higher fertilization.
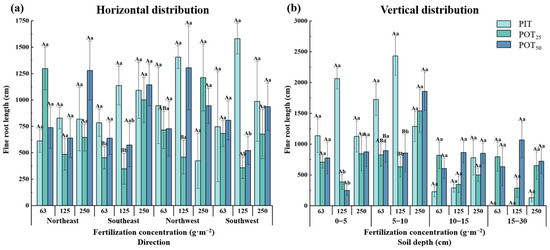
Figure 4.
The horizontal (a) and vertical (b) distribution characteristics of fine root lengths within different fertilizer concentrations.
The vertical distribution of the fine root lengths of PIT, POT25 and POT50 showed a pattern of increasing and then decreasing with soil depth across all fertilizer concentrations, peaking in the 5–10 cm layer and being second largest in the 0–5 cm layer (Figure 4b). In these layers, the fine root lengths of PIT increased and then decreased with higher fertilizer concentrations, whereas POT25 and POT50 exhibited the opposite trend. Specifically, in the 5–10 cm layer, the fine root lengths were significantly greater for PIT at 125 g·m−2, and for POT25 and POT50 at 250 g·m−2 compared to other concentrations. In this layer, at 63 g·m−2, the fine root lengths of PIT, POT25 and POT50 accounted for 55.8%, 26.3%, and 30.7% of the total, respectively; at 125 g·m−2, the percentages were 50.8%, 38.3%, and 28.1%, respectively; and at 250 g·m−2, they were 38.8%, 43.6%, and 43.1%, respectively. The fine root lengths of Populus tomentosa varied significantly with different fertilizer concentrations. Therefore, it could be inferred that fertilization concentration had a greater impact on fine root length than planting distance, particularly in the 5–10 cm layer.
3.1.3. Fine Root Surface Area
The surface area of fine roots also served as an indicator of root morphology. Figure 5a shows that the trends in fine root surface area for PIT, POT25, and POT50 mirrored the trends in fine root length for each treatment. That observation suggested there was efficient resource utilization and a reduction in competitive effects between the seedlings of the two species. Under moderate fertilization, the root system of Pinus tabuliformis extended westward, while Populus tomentosa roots extended northward under higher fertilization.
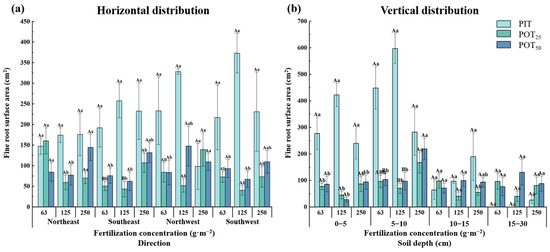
Figure 5.
The horizontal (a) and vertical (b) distribution characteristics of fine root surface areas within different fertilizer concentrations.
Figure 5b illustrates that the vertical fine root surface area of PIT, POT25, and POT50 exhibited a pattern of increasing and then decreasing with soil depth, peaking in the 5–10 cm layer and being second largest in the 0–5 cm layer across all fertilizer concentrations. The trends in vertical fine root surface area mirrored those observed in fine root lengths. In the 0–5 cm and 5–10 cm layers, the fine root surface area of PIT first increased and then decreased with higher fertilizer concentrations, while for POT25 and POT50, the trend was reversed. Specifically, in the 5–10 cm layer, there was a significant difference in fine root surface area between POT25 at fertilizer concentrations of 250 g·m−2 and 125 g·m−2. Additionally, the fine root surface area of POT50 was significantly greater at a fertilizer concentration of 250 g·m−2 compared to other concentrations. In the 5–10 cm soil layer, at a fertilizer concentration of 63 g·m−2, PIT, POT25, and POT50 contributed 56.8%, 26.2%, and 30.8% of the total fine root surface area, respectively. At 125 g·m−2, these percentages were 53.5%, 36.0%, and 27.3%, respectively, and at 250 g·m−2, they were 38.3%, 42.9%, and 44.3%, respectively.
3.1.4. Fine Root Volume
Figure 6a demonstrates that, except in the northeast direction, the root volume of PIT initially increased and then decreased with higher fertilization concentrations. For POT25, the root volume decreased and then increased with higher fertilization concentrations in all four directions. In the southeast direction, the root volume of POT25 was significantly larger at a fertilization concentration of 250 g·m−2 compared to other concentrations. In both the southeast and southwest directions, the root volume of POT50 initially increased and then decreased with higher fertilization concentrations. Specifically, in the southwest direction, PIT’s root volume peaked at a fertilization concentration of 125 g·m−2. In the northeast direction, POT25’s root volume was highest at a fertilization concentration of 63 g·m−2, while POT50’s root volume peaked at 250 g·m−2 and was notably larger than that of POT25. These results illustrated that the competitive effects between the seedlings of the two species were mitigated by extending roots in different directions.
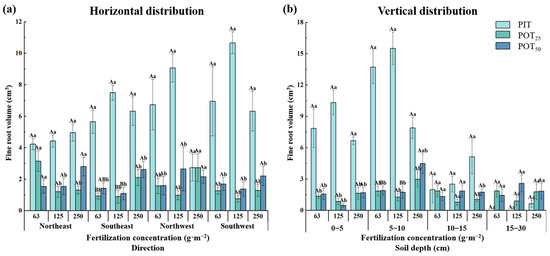
Figure 6.
The horizontal (a) and vertical (b) distribution characteristics of fine root volumes within different fertilizer concentrations.
Across the three fertilization concentrations (Figure 6b), the fine root volumes of PIT, POT25, and POT50 showed a pattern of increasing and then decreasing with soil depth, peaking in the 5–10 cm layer. In the 0–5 cm layer, PIT had significantly greater root volumes than POT25 and POT50 at all three fertilization concentrations, suggesting higher moisture and nutrient availability for PIT in this layer. At a fertilization concentration of 250 g·m−2 in the 5–10 cm layer, POT50 had a notably larger root volume than at other concentrations. In the 0–5 cm and 5–10 cm layers, PIT’s root surface area increased and then decreased with higher fertilization concentrations, whereas POT25 and POT50 showed the opposite trends. In the 5–10 cm layer, the root volumes of PIT, POT25, and POT50 constituted 58.3%, 26.8%, and 30.5% of the total root volume at 63 g·m−2; 54.7%, 33.4%, and 26.2% at 125 g·m−2; and 38.9%, 40.1%, and 46.0% at 250 g·m−2.
3.1.5. Specific Root Length
Specific root length reflected the efficiency of nutrient exchange between roots and soil. Higher specific root length values indicated a greater impact of roots on soil improvement. Figure 7a shows the specific root lengths of PIT were significantly smaller than those of POT25 and POT50. The specific root lengths generally increased and then decreased with rising fertilization concentrations, except in the southwest direction. In all four directions, POT25 exhibited a pattern of decreasing followed by increasing specific root length with higher fertilization concentrations. In the northeast and southwest directions, POT50 demonstrated a pattern of decreasing followed by increasing specific root length with higher fertilization concentrations. Compared to POT25, POT50 had generally larger specific root lengths at a fertilization concentration of 63 g·m−2 and smaller at 250 g·m−2. Specifically, in the northeast direction, PIT exhibited the longest specific root length at a fertilization concentration of 125 g·m−2, while POT25 had significantly shorter specific root lengths at other concentrations. In the northwest direction, POT25 exhibited the longest specific root length at a fertilization concentration of 250 g·m−2, significantly surpassing other concentrations. The results illustrated that, in the horizontal direction, the root systems of Populus tomentosa may have greater nutrient absorption capabilities and better effects on soil improvement compared to Pinus tabuliformis. Additionally, the specific root length of Populus tomentosa varied significantly with different planting distances and fertilization concentrations.
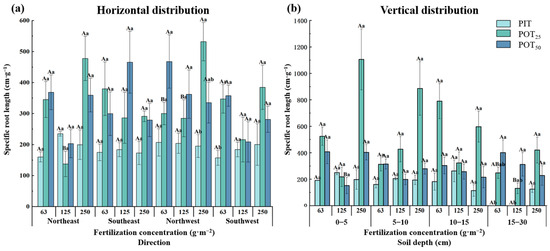
Figure 7.
The horizontal (a) and vertical (b) distribution characteristics of specific root lengths within different fertilizer concentrations.
Figure 7b reveals that, in the 0–5 cm layer, POT50 had a significantly shorter specific root length at a fertilization concentration of 125 g·m−2 compared to other concentrations. In the 5–10 cm and 10–15 cm layers, POT25 exhibited the longest specific root lengths at all three fertilization concentrations. The specific root length of PIT increased and then decreased with fertilization concentration, except in the 15–30 cm layer where this pattern did not occur. For POT50, the specific root length decreased and then increased with fertilization concentration in the 0–5 cm and 5–10 cm layers but decreased continuously in the 10–15 cm and 15–30 cm layers. Overall, POT25 exhibited longer specific root lengths across most fertilization concentrations and soil depths.
In summary, as fertilizer concentration increased, the fine roots of PIT generally showed a pattern of increasing and then decreasing in the southeast, northwest, and southwest directions. The maximum values of its fine root indicators often occurred in the southwest direction. For POT25, the fine root biomass decreased in the northeast, southwest, and northwest directions, while its morphological indicators displayed a pattern of decreasing followed by increasing, in contrast to PIT. For POT50, the fine root biomass increased, and the fine root volume initially increased and then decreased in the southwest direction. Additionally, all fine root lengths, surface area, and specific lengths exhibited a pattern of decreasing followed by increasing. For all fine root indicators of POT, the maximum values were mostly found in the northeast and northwest directions. Consequently, the biomass and morphological indicators of fine roots varied significantly between PIT, POT25, and POT50 across different horizontal directions. On the other hand, a vertical distribution analysis revealed that the fine root systems of seedlings from both species were primarily located in the 0–15 cm layer, with maximum values for most indicators found in the 5–10 cm layer. Generally, PIT had a larger fine root biomass and morphological indicators (excluding specific root length) compared to POT25 and POT50. However, the specific root lengths of POT25 were greatest in the 0–15 cm layer.
3.2. Correlations Between Fine Root Systems of the Two Types of Seedlings and Soil Nutrients
The correlations between fine root systems and soil nutrients of Pinus tabuliformis and Populus tomentosa are shown in Figure 8. For Pinus tabuliformis seedlings (Figure 8a), fertilization concentration was positively correlated with organic soil matter, total nitrogen, and available phosphorus, with correlation coefficients (CC) of 0.910, 0.859, and 0.843, respectively. Oppositely, fertilization concentration negatively correlated with fine root biomass (CC: −0.190), fine root volume (CC: −0.150), and fine root surface area (CC: −0.061). The morphological indicators of fine roots, including root length, surface area, and specific root length, showed positive correlations with different soil nutrients. In addition, fine root biomass (CC: −0.112) and fine root volume (CC: −0.053) had negative correlations with total nitrogen but positive correlations with other soil indicators.
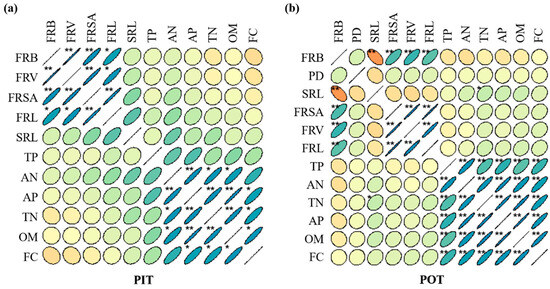
Figure 8.
Correlation analysis between fine root systems and soil nutrients of Pinus tabuliformis (a) and Populus tomentosa (b) respectively. (1) In the figure, blue indicates positive correlation and orange indicates negative correlation. The depth of color indicates the intensity of correlation. The darker the color, the stronger the correlation; the lighter the color, the weaker the correlation or non-correlation. (2) Abbreviations in the figure have the following meanings. PIT: Pinus tabuliformis; POT: Populus tomentosa; FC: fertilization concentration; PD: planting distance; FRL: fine root length; FRSA: fine root surface area; FRV: fine root volume; FRB: fine root biomass; SRL: specific root length; OM: organic matter; AN: alkali-hydrolysable nitrogen; TN: total nitrogen; AP: available phosphorus; TP: total phosphorus. * p < 0.05; ** p < 0.01.
For Populus tomentosa seedlings (Figure 8b), the correlations between fertilizer concentration, planting distance, root system, and soil nutrients were analyzed comprehensively. Fertilization concentration in Populus tomentosa showed highly significant positive correlations with organic soil matter (CC: 0.934), available phosphorus (CC: 0.912), total nitrogen (CC: 0.874), alkali-hydrolysable nitrogen (CC: 0.851), and total phosphorus (CC: 0.757). By contrast, the positive correlations between planting distance and these indicators were not significant. Specific root length was negatively correlated with fine root biomass (CC: −0.548), fine root volume (CC: −0.202), fine root surface area (CC: −0.173), and fine root length (CC: −0.132). All morphological indicators had positive correlations with the five soil nutrients. Additionally, fine root biomass was negatively correlated with all soil nutrients, indicating that soil nutrient uptake primarily occurred through the fine roots of Populus tomentosa.
3.3. Competitiveness Indexes About the Mixed Planting Seedlings and the Influencing Factors
The total competitiveness indexes of fine roots between Pinus tabuliformis and Populus tomentosa planted at various distances are shown in Figure 9. As fertilizer concentration increased, the total competitiveness indexes for both species showed a clear downward trend. PIT, POT25, and POT50 had their highest competitive indexes at a fertilization concentration of 63 g·m−2, with values of 0.0113 ± 0.0035, 0.0098 ± 0.0039, and 0.0089 ± 0.0031, respectively. At fertilization concentrations of 63 g·m−2 and 125 g·m−2, the total competitiveness indexes were ranked as follows: PIT > POT25 > POT50. However, the competitiveness index for POT25 was higher than that for PIT. This indicated that PIT had better competitive ability at low and moderate fertilization levels. At the higher fertilization concentration of 250 g·m−2, the root competition among all three seedling types decreased. Consequently, the relatively high competitiveness of POT25 compared to PIT and POT50 became apparent. Overall, the results indicated that planting distance, fertilizer concentration, and soil nutrients significantly influenced root competition and seedling growth.
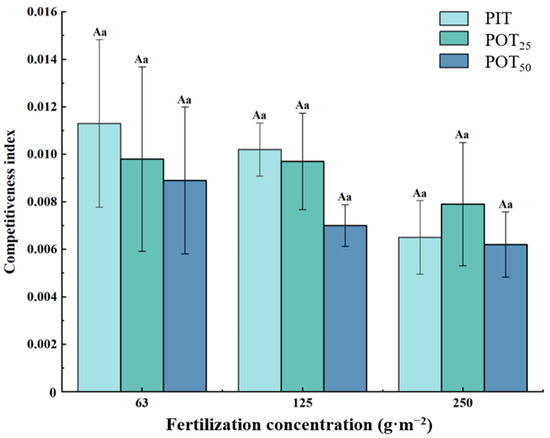
Figure 9.
Total competitiveness indexes of the three types of seedlings. The same capital letter indicates that there was no significant difference between different fertilization concentrations of the same tree; The same lowercase letter indicates that there was no significant difference between different trees with the same fertilization concentration (p < 0.05). The above notes are the same for Figure 10.
Figure 10 shows significant differences in root competitiveness indexes among the three types of seedlings across various vertical soil layers. In the 0–5 cm layer (Figure 10a), significant differences in competitiveness indexes were observed between POT25 and PIT at a fertilization concentration of 250 g·m−2. POT25 also showed significant differences in competitiveness indexes between fertilization concentrations of 125 g·m−2 and 250 g·m−2. In the other layers, the competitiveness indexes for different seedlings and fertilization concentrations were not significantly different. In the 0–5 cm and 5–10 cm layers (Figure 10a,b), PIT consistently had the lowest competitiveness indexes, while both species reached their highest indexes at 250 g·m−2. In the 10–15 cm layer (Figure 10c), PIT had the highest competitiveness index, while POT25 consistently had the lowest, regardless of fertilization concentration. Both Pinus tabuliformis and Populus tomentosa had their lowest indexes at 250 g·m−2 in this layer. In the 15–30 cm layer (Figure 10d), at 63 g·m−2 and 125 g·m−2, the three kinds of seedlings showed little competition. However, at 250 g·m−2, Pinus tabuliformis showed a slight competitive advantage over Populus tomentosa. In addition, in the deeper layer (10–15 cm), and at lower fertilization concentrations (63 g·m−2 and 125 g·m−2), PIT and POT50 had higher competitiveness indexes compared to the other seedlings. By contrast, POT25 had the highest competitiveness index in the shallower layer (5–10 cm) and at a higher fertilization concentration (250 g·m−2).
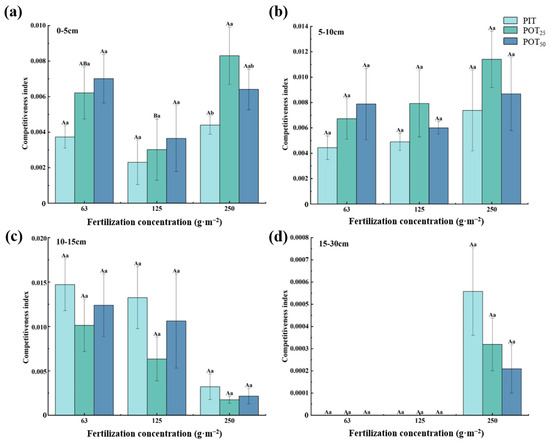
Figure 10.
Competitiveness indicators of the three types of seedlings for soil layers of 0–5cm (a), 5–10cm (b), 10–15cm (c), and 15–30cm (d).
The relationships between the competitive indexes and their influencing factors for PIT, POT25, and POT50 were analyzed using PCA. Figure 11 and Table 2 show that three principal components explained 93.23%, 88.01%, and 87.76% of the variance in the influencing factors for the competition indexes of PIT, POT25, and POT50, respectively. In Figure 11a, the first axis primarily represents the influence of soil factors on the PIT competitiveness index, explaining 49.90% of the variance. The second axis represents the effects of root morphological factors (excluding specific root length), explaining 32.44% of the variance. The third axis highlights the role of specific root length, explaining 10.89% of the variance in the influencing factors. The interpretations of the three principal components for POT25 and POT50 were generally consistent with those for PIT (see Figure 11b,c). For both species, the first axes represent the effects of soil factors, explaining 41.96% and 45.76% of the variance, respectively. The second axis explains how fine root biomass, volume, surface area, and length influenced the competitiveness indexes, accounting for 33.49% and 30.44% of the variance, respectively. The third axis, similar to PIT, focuses on specific root length, explaining 12.57% and 11.55% of the variance, respectively.
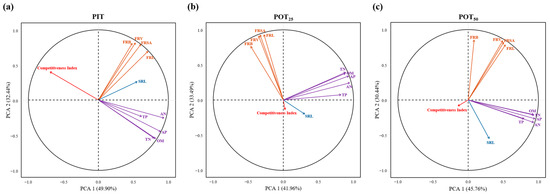
Figure 11.
Principal component analysis (PCA) of the competitiveness indexes and their influencing factors of seedings of Pinus tabuliformis (a), Populus tomentosa at a 25 cm radius from Pinus tabuliformis (b), Populus tomentosa at a 50 cm radius from Pinus tabuliformis (c) respectively. The abbreviations in the figure have the following meanings. PIT: Pinus tabuliformis; POT25: the abbreviation for Populus tomentosa at a 25 cm radius from Pinus tabuliformis; POT50: the abbreviation for Populus tomentosa at a 50 cm radius from Pinus tabuliformis; FRL: fine root length; FRSA: fine root surface area; FRV: fine root volume; FRB: fine root biomass; SRL: specific root length; OM: organic matter; AN: alkali-hydrolysable nitrogen; TN: total nitrogen; AP: available phosphorus; TP: total phosphorus. These abbreviations are the same as Table 2.
Table 2.
Interpretive degrees of the first three principal components.
In Figure 11, contribution rates (CRs) of all the impact factors on the competitiveness indexes are expressed in the lengths of the other colored arrows and their angles relative to the red arrows. Firstly, all the influencing factors affected PIT’s competitiveness index negatively. The primary factors were the available phosphorus (CR: −0.998), organic matter (CR: −0.978), total nitrogen (CR: −0.947), and alkali-hydrolysable nitrogen (CR: −0.937). Secondly, the main contributors to POT25’s competitiveness index were also negative, including fine root surface area (CR: −0.988), fine root volume (CR: −0.973), fine root length (CR: −0.965), and fine root biomass (CR: −0.842). However, specific root length and total phosphorus had positive effects on the index, with CR values of 0.242 and 0.074, respectively. Thirdly, the determinants of POT50’s competitiveness index were fine root length (CR: −0.856), fine root volume (CR: −0.852), fine root surface area (CR: −0.847), and total nitrogen (CR: −0.702). Except for specific root length (CR: 0.017), all other factors had negative contributions, with absolute CR values greater than 0.5. Considering the correlations with fertilizer concentration, planting distance, and other factors, both fertilizer concentration and planting distance had a strong negative effect on the competitiveness indexes of PIT, POT25, and POT50.
4. Discussion
4.1. Fine Roots Were Distributed Separately When the Seedlings of the Two Species Were Mixed Planted
Seedling roots were crucial for absorbing nutrients and water and were key sites for synthesizing hormones, organic acids, and amino acids [39,40]. Under soil nutrient stress, roots adjusted their growth direction and spatial distribution, either seeking non-competitive resources or avoiding competitive zones [41]. The spatial distribution of the root system was analyzed in both horizontal and vertical directions, with fine root distribution as a key factor. In the horizontal direction, the root system of Pinus tabuliformis predominantly extended southwest, while Populus tomentosa roots grew predominantly northeast and northwest. On the other hand, the highest values of the fine root system indicators for both species were primarily found in the 5–10 cm layer. Except for the specific root length of POT25, other fine root indicators of PIT were larger than those of POT25 and POT50. These results indicated that the root systems of the two seedlings were distinctly separated and employed different strategies to avoid resource competition, confirming previous research findings [41,42].
Due to their proximity to PIT, POT25 exhibited higher specific root lengths across different fertilization concentrations compared to POT50. This suggested that seedlings improved their water and nutrient absorption efficiency by increasing the ratio of fine roots to total roots in response to spatial growth constraints [43,44]. At all three fertilization concentrations, both Pinus tabuliformis and Populus tomentosa exhibited an initial increase followed by a decrease in fine root biomass, surface area, and volume with increasing soil depth. Fertilization caused nutrients to be mainly distributed in the 0–5 cm and 5–10 cm layers, thereby reducing the need for seedlings to explore deeper layers for nutrients. The finding aligned with Liu et al.’s results [45]. Fine roots were mainly concentrated in the shallow layers, demonstrating root plasticity and foraging behavior [46]. Thus, the separation in root distribution between Pinus tabuliformis and Populus tomentosa was influenced by both fertilization concentration and planting distance, confirming our first hypothesis. These findings offered valuable insights for mixed planting of the two seedlings under optimal fertilization and planting distance conditions.
4.2. Higher Fertilizer Concentrations Did Not Predict Better Root Growths
In the 0–5 cm and 5–10 cm layers, Pinus tabuliformis exhibited an initial increase in fine root biomass followed by a decrease, whereas Populus tomentosa showed an initial decrease followed by an increase with rising fertilization concentrations. These results contradicted the second hypothesis, which posited a significant positive correlation between root growth and fertilization concentration. And they were also contrasted with the reported increased root biomass with fertilization concentration [47]. This discrepancy may result from variations in root distribution caused by environmental resource heterogeneity, planting conditions, and intrinsic plant characteristics. Insufficient fertilization concentrations may not meet the nutrient requirements for optimal plant growth, while excessive concentrations can adversely affect soil quality, thereby inhibiting plant growth and development [48].
Understanding root nutrient absorption characteristics was essential for optimizing high-yield seedling planting models and fertilizer-water management techniques [49,50]. In this study, the fine root biomass of Pinus tabuliformis was negatively correlated with total nitrogen and fertilization concentration (N:P:K ratio of 2:1:1), but positively correlated with organic soil matter, alkali-hydrolyzable nitrogen, total phosphorus, and available phosphorus. Conversely, the fine root biomass of Populus tomentosa was negatively correlated with organic soil matter, total nitrogen, alkali-hydrolyzable nitrogen, total phosphorus, available phosphorus, and fertilization concentration, which was consistent with Wang et al.’s findings [51]. Therefore, fertilizers with a high nitrogen proportion negatively affected the root biomass of both seedling species. Specifically, Populus tomentosa exhibited a significant negative response to nitrogen and phosphorus fertilization. Similar results were observed in the root growth of young Populus tomentosa after the application of nitrogen fertilizer [52]. Therefore, higher fertilizer concentrations did not improve root growth in mixed seedling systems, and the nitrogen and phosphorus proportions in fertilization should be reduced.
4.3. Planting Distance Was Correlated with Most Seedling Growth Indicators Positively
Planting distance influenced the growth and spatial distribution of seedling roots. Selecting an appropriate planting distance significantly regulated the development of seedling population structure, biomass accumulation, and yield factors [53,54,55]. In this study, most indicators of Populus tomentosa at different planting distances showed no significant effects, contrary to the findings of Chen et al. [56] This discrepancy may result from variations in soil spatial constraints and changes in environmental factors related to different fertilization concentrations and planting distances. At planting distances of 25 cm and 50 cm from Pinus tabuliformis, factors such as light and ventilation had a greater impact on the growth of Populus tomentosa, potentially overshadowing the effects of planting distance. Total fine root biomass, length, surface area, and volume of Populus tomentosa increased with greater planting distances. This finding aligned with studies by Zhan et al. [57] on Populus nigra var. Italica, and Di et al. [58] on Populus davidiana. This indicated that increasing planting distance improved root biomass accumulation and root morphology in seedlings.
Conversely, excessively dense planting distances could lead to root competition, slow growth, poor nutrition, and hinder the accumulation of organic matter in seedlings. For young seedlings of Populus tomentosa, a planting distance of 25 cm restricted essential nutrients, water, and spatial resources, leading to stunted growth and inhibited development. At this closer distance, Populus tomentosa survived by increasing specific root length and adjusting root growth both horizontally and vertically to mitigate the negative effects of intraspecific and interspecific competition [59]. In addition, there was a negative correlation between planting distance and specific root length, indirectly supporting the observed root growth strategy. A planting distance of 50 cm enhanced root growth in Populus tomentosa with reduced competition from Pinus tabuliformis. However, as the trees matured, transplanting or thinning may become necessary to meet their increasing spatial and nutrient needs.
4.4. Underground Competition Between Pinus tabuliformis and Populus tomentosa Was Strong
When multiple species use the same resource concurrently, ecological niche overlap occurs, leading to competitive resource utilization. Such competition can influence seedling behavior within tree communities [60]. In this study, the competitiveness indexes of Pinus tabuliformis and Populus tomentosa decreased gradually as fertilizer concentration increased. When fertility was insufficient, biomass and morphological indicators of fine roots reflected intense competition for soil nutrients and growth space. The intensity of this competition can be reduced by increasing fertilizer concentration, as supported by Sun et al. [61] Pinus tabuliformis showed the highest competition indexes at fertilization concentrations of 63 g·m−2 and 125 g·m−2. This indicated that five-year-old Pinus tabuliformis seedlings, a pioneer species in afforestation of barren hills [62], showed strong root plasticity, enabling them to adapt to variable environmental conditions. Known for its deep-rooting characteristics, Pinus tabuliformis demonstrated higher competition indexes in the 10–15 cm and 15–30 cm soil layers across different fertilization concentrations. By contrast, the competition indexes of Populus tomentosa (a shallow root species) were higher in the 0–5 cm and 5–10 cm soil layers. Particularly at the high fertilizer concentration (250 g·m−2), Populus tomentosa had a higher competitive ability than Pinus tabuliformis. This suggested that under the combined stresses of nutrient availability and interspecies competition, both tree species adopted specific growth strategies and allocated more nutrients to their roots to effectively utilize spatial and nutrient resources [63], consistent with Hommel et al.’s findings [64].
It is generally believed that plants of the same species tend to segregate their roots during competition [65,66]. This study found that the competitiveness indexes of Pinus tabuliformis seedlings were higher in deeper soil layers, while those of Populus tomentosa seedlings were higher in shallower layers. This suggested that the fine roots of the two species grew interspersedly, with their competitive abilities separated vertically through mutual adaptation. Consequently, their competitive pressure on limited nutrient resources was reduced. Additionally, in the 15–30 cm soil layer, competition indexes for both Pinus tabuliformis and Populus tomentosa were zero at fertilization concentrations of 63 g·m−2 and 125 g·m−2. This was likely due to increased mechanical resistance encountered by roots at greater depths and limited natural rainwater infiltration, which reduced groundwater replenishment. As a result, the plants optimized their growth based on soil nutrients and environmental conditions [67].
Many factors influence interspecies competition, and seedling competitive abilities generally improve with growth. To maximize the economic benefits of mixed plantations, it is essential to dynamically assess the systems and identify key factors affecting competitiveness [68]. Here, three principal components affecting the two types of seedlings’ competitiveness indexes were distinguished, representing the soil factors, the root factors, and the specific root length. The soil factors, including available phosphorus (CR: −0.998), organic matter (CR: −0.978), total nitrogen (CR: −0.947), and alkali-hydrolysable nitrogen (CR: −0.937), negatively impacted the competitiveness indexes of Pinus tabuliformis. On the other hand, the root factors negatively affected the competitiveness of Populus tomentosa, with high contribution rates to competitiveness indexes in both POT25 and POT25 for fine root surface area (CRs: −0.988 and −0.847), fine root volume (CRs: −0.973 and −0.852), and fine root length (CRs: −0.965 and −0.856). Additionally, fertilizer concentration and planting distance strongly and negatively affected the competitiveness indexes of PIT, POT25, and POT50. Therefore, both fertilization and soil factors should be considered for Pinus tabuliformis seedlings, while planting distance and root morphology are crucial for Populus tomentosa seedlings in mixed planting scenarios. As Pinus tabuliformis matures, careful adjustments to the planting range of Populus tomentosa are necessary to sustainably develop the mixed forest and optimize resource utilization during the transition from a pure forest to a mixed forest.
5. Conclusions
When Pinus tabuliformis and Populus tomentosa seedlings were planted together, both species predominantly allocated their fine root biomass to the shallow 0–10 cm layer. However, Pinus tabuliformis primarily extended to the southwest, while Populus tomentosa grew towards the north horizontally. Their root growth thrived under moderate nutrient concentrations (125 g·m−2). At a planting distance of 50 cm from Pinus tabuliformis, Populus tomentosa seedlings exhibited superior root growth compared to those planted 25 cm apart. This planting arrangement also resulted in competition between the two species. Pinus tabuliformis demonstrated greater competitive ability in the deeper 10–30 cm layers than Populus tomentosa, which exhibited the opposite pattern in the shallow 0–10 cm layers. Furthermore, the factors influencing the competitive abilities of the two species varied. Organic soil matter, nitrogen, and phosphorus, with contribution rates exceeding 0.937, significantly negatively affected the competitiveness indexes of Pinus tabuliformis. The fine root surface area, volume, and length of Populus tomentosa also significantly negatively affected its competitiveness indexes, with contribution rates exceeding 0.847. To effectively mitigate competition between Pinus tabuliformis and Populus tomentosa while maximizing yield and benefits, it is advisable to evaluate root, soil, and fertilizer factors comprehensively and adjust the planting distance accordingly.
Author Contributions
X.W.: conceptualization, data curation, methodology, validation, visualization, writing—original draft, writing—review and editing. S.W.: conceptualization, data curation, methodology, validation, visualization, writing—original draft, writing—review and editing. Y.D.: conceptualization, data curation, formal analysis, methodology, visualization, writing—review and editing. L.J.: writing—review and editing, methodology, investigation, data curation. D.H.: data curation, writing—review and editing. W.L.: conceptualization, funding acquisition, writing—review and editing. All authors have read and agreed to the published version of the manuscript.
Funding
This research was supported by the National Natural Science Foundation of China (32371970, 31971644), National Key Research and Development Plan Project of China (2022YFF1300401), Shanxi Province Water Conservancy Science and Technology Research and Promotion Project (2024GM30), Scientific and Technological Innovation Project of Colleges and Universities in Shanxi Province (2021L105) and the Shanxi Provincial Outstanding Doctoral Program for Incentive Funds for Scientific Research Projects (SXYBKY2018032).
Data Availability Statement
The original contributions presented in this study are included in the article, further inquiries can be directed to the corresponding author. Data will be made available upon request.
Conflicts of Interest
The authors declare that they have no known competing financial interests or personal relationships that could have appeared to influence the work reported in this paper.
References
- Rahmonov, O.; Abramowicz, A.; Pukowiec-Kurda, K.; Fagiewicz, K. The link between a high-mountain community and ecosystem services of juniper forests in Fann Mountains (Tajikistan). Ecosyst. Serv. 2021, 48, 101255. [Google Scholar] [CrossRef]
- Seliger, A.; Ammer, C.; Seidel, D.; Zerbe, S. Drivers of tree regeneration in coniferous monocultures during conversion to mixed forests in Central Europe—Implications for forest restoration management. For. Ecosyst. 2024, 11, 100244. [Google Scholar] [CrossRef]
- Hérault, B.; N’Guessan, A.K.; Ouattara, N.; Ahoba, A.; Bénédet, F.; Coulibaly, B.; Doua-Bi, Y.; Koffi, T.; Koffi-Konan, J.; Konaté, I.; et al. The long-term performance of 35 tree species of sudanian West Africa in pure and mixed plantings. For. Ecol. Manag. 2020, 468, 118171. [Google Scholar] [CrossRef]
- Zhao, D.Y.; Bi, H.X.; Wang, N.; Liu, Z.H.; Hou, G.R.; Huang, J.H.; Song, Y.L. Does increasing forest age lead to greater trade-offs in ecosystem services? A study of a Robinia pseudoacacia artificial forest on the Loess Plateau, China. Sci. Total Environ. 2024, 926, 171737. [Google Scholar] [CrossRef] [PubMed]
- Zhang, J.W.; Finley, K. Early treatment effects on plantation growth and biodiversity in mature ponderosa pine forest. Can. J. For. Res. 2023, 54, 632–645. [Google Scholar] [CrossRef]
- Zeng, X.X.; Li, J.J.; Peng, Q.H.; Gong, C.; Ran, H.; Xie, T.T.; Liao, T.; Zhou, T.L.; Huang, D.M.; Song, Q.N.; et al. Differences in Response of Tree Species at Different Succession Stages to Neighborhood Competition. Forests 2024, 15, 435. [Google Scholar] [CrossRef]
- Peng, S.; Chen, H.Y. Global responses of fine root biomass and traits to plant species mixtures in terrestrial ecosystems. Glob. Eco. Biogeogr. 2021, 30, 289–304. [Google Scholar] [CrossRef]
- Freschet, G.T.; Roumet, C.; Comas, L.H.; Weemstra, M.; Bengough, A.G.; Rewald, B.; Bardgett, R.D.; De Deyn, D.B.; Johnson, D.; Klimešová, J.; et al. Root traits as drivers of plant and ecosystem functioning: Current understanding, pitfalls and future research needs. New Phytol. 2021, 232, 1123–1158. [Google Scholar] [CrossRef]
- Zhang, D.S.; Lyu, Y.; Li, H.B.; Tang, X.Y.; Hu, R.; Rengel, Z.; Zhang, F.S.; Whalley, W.R.; Davies, W.J.; Cahill, J.F., Jr.; et al. Neighbouring plants modify maize root foraging for phosphorus: Coupling nutrients and neighbours for improved nutrient-use efficiency. New Phytol. 2020, 226, 244–253. [Google Scholar] [CrossRef]
- Hou, X.F.; Wu, X.J.; Ma, C.H.; Tian, D.; Yan, Z.B.; Li, P. Effect of the elevated ozone on greening tree species of urban: Alterations in C-N-P stoichiometry and nutrient stock allocation to leaves and fine roots. Urban For. Urban Green. 2022, 76, 127735. [Google Scholar] [CrossRef]
- Kwatcho Kengdo, S.; Peršoh, D.; Schindlbacher, A.; Heinzle, J.; Tian, Y.; Wanek, W.; Borken, W. Long-term soil warming alters fine root dynamics and morphology, and their ectomycorrhizal fungal community in a temperate forest soil. Glob. Chang. Biol. 2022, 28, 3441–3458. [Google Scholar] [CrossRef] [PubMed]
- Weigelt, A.; Mommer, L.; Andraczek, K.; Iversen, C.M.; Bergmann, J.; Bruelheide, H.; Fan, Y.; Freschet, G.T.; Guerrero-Ramírez, N.R.; Kattge, J.; et al. An integrated framework of plant form and function: The belowground perspective. New Phytol. 2021, 232, 42–59. [Google Scholar] [CrossRef] [PubMed]
- Oldroyd, G.E.; Leyser, O. A plant’s diet, surviving in a variable nutrient environment. Science 2020, 368, eaba0196. [Google Scholar] [CrossRef] [PubMed]
- Li, X.W.; Zhang, C.L.; Zhang, B.B.; Wu, D.; Zhu, D.D.; Zhang, W.; Ye, Q.; Yan, J.H.; Fu, J.M.; Fang, C.L.; et al. Nitrogen deposition and increased precipitation interact to affect fine root production and biomass in a temperate forest: Implications for carbon cycling. Sci. Total Environ. 2021, 765, 144497. [Google Scholar] [CrossRef]
- Montagnoli, A.; Lasserre, B.; Terzaghi, M.; Byambadorj, S.O.; Nyam-Osor, B.; Scippa, G.S.; Chiatante, D. Fertilization reduces root architecture plasticity in Ulmus pumila used for afforesting Mongolian semi-arid steppe. Front. Plant Sci. 2022, 13, 878299. [Google Scholar] [CrossRef]
- Liu, G.C.; Xing, Y.J.; Wang, Q.G.; Wang, L.; Feng, Y.; Yin, Z.W.; Wang, X.C.; Liu, T. Long-term nitrogen addition regulates root nutrient capture and leaf nutrient resorption in Larix gmelinii in a boreal forest. Eur. J. For. Res. 2021, 140, 763–776. [Google Scholar] [CrossRef]
- Zheng, L.L.; Zhao, Q.; Sun, Q.Y.; Liu, L.; Zeng, D.H. Nitrogen addition elevated autumn phosphorus retranslocation of living needles but not resorption in a nutrient-poor Pinus sylvestris var. Mongolica plantation. For. Ecol. Manag. 2020, 468, 118174. [Google Scholar] [CrossRef]
- Chen, L.; Ma, Y.; Li, H.; Zeng, J.; Dell, B.; Li, Z.Y. Growth and nitrogen retranslocation of nutrient-loaded clonal Betula alnoides transplanted with or without fertilization. Forests 2021, 12, 1603. [Google Scholar] [CrossRef]
- Danyagri, G.; Baral, S.K.; Waterhouse, M.J.; Newsome, T.A. Climate-mediated lodgepole pine tree growth response to thinning and fertilization in interior British Columbia. For. Ecol. Manag. 2023, 544, 121161. [Google Scholar] [CrossRef]
- Liu, C.; Guêné-Nanchen, M.; Rochefort, L. Improving restoration outcomes of boreal Sphagnum-dominated peatlands after peat-extraction: The key role of phosphorus fertilization. Biol. Conserv. 2024, 298, 110770. [Google Scholar] [CrossRef]
- Liu, P.C.; Wang, W.D.; Bai, Z.Q.; Guo, Z.J.; Ren, W.; Huang, J.H.; Xu, Y.; Yao, J.; Ding, Y.; Zang, R.G. Competition and facilitation co-regulate the spatial patterns of boreal tree species in Kanas of Xinjiang, northwest China. For. Ecol. Manag. 2020, 467, 118167. [Google Scholar] [CrossRef]
- Oliveira, I.R.; Bouillet, J.P.; Guillemot, J.; Brandani, C.B.; Bordron, B.; Frayret, C.B.; Laclau, J.P.; Ferraz, A.V.; Gonçalves, J.L.M.; le Maire, G. Changes in light use efficiency explains why diversity effect on biomass production is lower at high planting density in mixed-species plantations of Eucalyptus grandis and Acacia mangium. For. Ecol. Manag. 2024, 554, 121663. [Google Scholar] [CrossRef]
- You, Y.M.; Wang, L.R.; Liu, X.T.; Wang, X.L.; Jiang, L.P.; Ding, C.J.; Wang, W.N.; Zhang, D.W.; Zhao, X.Y. Interspecific plant interaction structures the microbiomes of poplar-soil interface to alter nutrient cycling and utilization. Microbiol. Spectr. 2024, 12, e0336823. [Google Scholar] [CrossRef] [PubMed]
- Postma, J.A.; Hecht, V.L.; Hikosaka, K.; Nord, E.A.; Pons, T.L.; Poorter, H. Dividing the pie: A quantitative review on plant density responses. Plant Cell Environ. 2021, 44, 1072–1094. [Google Scholar] [CrossRef] [PubMed]
- Bo, H.J.; Wen, C.Y.; Song, L.J.; Yue, Y.T.; Nie, L.S. Fine-root responses of Populus tomentosa forests to stand density. Forests 2018, 9, 562. [Google Scholar] [CrossRef]
- Zhang, T.; Yan, Q.L.; Yuan, J.F.; Zhang, J.X. Application of fertilization in changing light adaptability and improving growth of Aralia elata (Miq.) Seem. seedlings under various light conditions in temperate forests. J. Plant Physiol. 2022, 277, 153804. [Google Scholar] [CrossRef]
- Wang, G.; Liu, F. The influence of gap creation on the regeneration of Pinus tabuliformis planted forest and its role in the near-natural cultivation strategy for planted forest management. For. Ecol. Manag. 2011, 262, 413–423. [Google Scholar] [CrossRef]
- Zeng, X.H.; Zhang, W.J.; Cao, J.S.; Liu, X.P.; Shen, H.T.; Zhao, X. Changes in soil organic carbon, nitrogen, phosphorus, and bulk density after afforestation of the “Beijing–Tianjin Sandstorm Source Control” program in China. Catena 2014, 118, 186–194. [Google Scholar] [CrossRef]
- Cornejo, N.S.; Hertel, D.; Becker, J.N.; Hemp, A.; Leuschner, C. Biomass, morphology, and dynamics of the fine root system across a 3,000 m elevation gradient on Mt. Kilimanjaro. Front. Plant Sci. 2020, 11, 13. [Google Scholar]
- Wei, X.; Yao, J.F.; Guo, Y.; Sui, X.; Lv, X.; Liu, X.M.; Dong, Y.; Liang, W.J. Study on associations between root and aboveground growth of mixed-planting seedlings of Populus tomentosa and Pinus tabuliformis under soil nutrient heterogeneity. Forests 2024, 15, 1151. [Google Scholar] [CrossRef]
- Dong, Y.; Zhang, Y.Q.; Liu, C.C. Study on soil nutrient spatial patterns and their driving factors in Jinzhong. Acta Ecol. Sin. 2018, 38, 8621–8629. [Google Scholar]
- Feng, D.D.; Xue, Q.Q.; Qi, J.Y.; Wang, L.J.; Li, H.; Men, L.; Zhang, Z.W. Community structure and occurrence regularity of pyralidae in artificial sea buckthorn plantation. Shanxi Agric. Sci. 2020, 48, 793–798. [Google Scholar]
- Liu, C.J.; Gong, X.W.; Dang, K.; Li, J.; Yang, P.; Gao, X.L.; Dou, X.P.; Feng, B. Linkages between nutrient ratio and the microbial community in rhizosphere soil following fertilizer management. Environ. Res. 2020, 184, 109261. [Google Scholar] [CrossRef] [PubMed]
- Feng, Y.H.; Sui, X.; Tang, J.; Liu, R.; Ling, X.L.; Liang, W.J.; Wei, X. Responses of belowground fine root biomass and morphology in Robinia pseudoacacia L. plantations to aboveground environmental factors. Glob. Ecol. Conserv. 2024, 50, e02863. [Google Scholar] [CrossRef]
- Xu, M.P.; Jian, J.N.; Wang, J.Y.; Zhang, Z.J.; Yang, G.H.; Han, X.H.; Ren, C.J. Response of root nutrient resorption strategies to rhizosphere soil microbial nutrient utilization along Robinia pseudoacacia plantation chronosequence. For. Ecol. Manag. 2021, 489, 119053. [Google Scholar] [CrossRef]
- Wang, Z.B.; Yang, H.J.; Wang, D.H.; Zhao, Z. Response of height growth of regenerating trees in a Pinus tabulaeformis Carr. plantation to different thinning intensities. For. Ecol. Manag. 2019, 444, 280–289. [Google Scholar] [CrossRef]
- Ni, L.; Guo, D.G.; Zhang, Q.G.; Li, Y.; Hu, X.Q.; Li, Y.; Feng, S.X. Niche characteristics and dynamics of dominant species in arbor layer of 4hm2 Pinus tabuliformis-Quercus wutaishansea mixed forest in Lingkong Mountain. Fronti. Ecol. Evol. 2024, 12, 1334665. [Google Scholar] [CrossRef]
- Levins, R.A. Evolution in Changing Environments: Some Theoretical Explorations. (MPB-2); Princeton University Press: Princeton, NJ, USA, 1982; Volume 2. [Google Scholar]
- Ranjan, A.; Sinha, R.; Singla-Pareek, S.L.; Pareek, A.; Singh, A.K. Shaping the root system architecture in plants for adaptation to drought stress. Physiol. Plant. 2022, 174, e13651. [Google Scholar] [CrossRef]
- Sharma, M.; Singh, D.; Saksena, H.B.; Sharma, M.; Tiwari, A.; Awasthi, P.; Botta, H.K.; Shukla, B.N.; Laxmi, A. Understanding the intricate web of phytohormone signalling in modulating root system architecture. Int. J. Mol. Sci. 2021, 22, 5508. [Google Scholar] [CrossRef]
- Jia, Z.T.; Giehl, R.F.; von Wirén, N. Nutrient–hormone relations: Driving root plasticity in plants. Mol. Plant 2022, 15, 86–103. [Google Scholar] [CrossRef]
- Zheng, G.C.; Su, X.P.; Chen, X.L.; Hu, M.Y.; Ju, W.; Zou, B.Z.; Wang, S.R.; Wang, Z.Y.; Hui, D.F.; Guo, J.F.; et al. Variations in fine root biomass, morphology, and vertical distribution in both trees and understory vegetation among Chinese fir plantations. For. Ecol. Manag. 2024, 557, 121748. [Google Scholar] [CrossRef]
- Wambsganss, J.; Freschet, G.T.; Beyer, F.; Goldmann, K.; Prada-Salcedo, L.D.; Scherer-Lorenzen, M.; Bauhus, J. Tree species mixing causes a shift in fine root soil exploitation strategies across European forests. Funct. Ecol. 2021, 35, 1886–1902. [Google Scholar] [CrossRef]
- Ding, J.X.; Kong, D.L.; Zhang, Z.L.; Cai, Q.; Xiao, J.; Liu, Q.; Yin, H.J. Climate and soil nutrients differentially drive multidimensional fine root traits in ectomycorrhizal-dominated alpine coniferous forests. J. Ecol. 2020, 108, 2544–2556. [Google Scholar] [CrossRef]
- Yeste, A.; Blanco, J.A.; Imbert, J.B.; Zozaya-Vela, H.; Elizalde-Arbilla, M. Pinus sylvestris L. and Fagus sylvatica L. effects on soil and root properties and their interactions in a mixed forest on the Southwestern Pyrenees. For. Ecol. Manag. 2021, 481, 118726. [Google Scholar] [CrossRef]
- Zhu, L.Q.; Yao, X.D.; Chen, W.L.; Robinson, D.; Wang, X.H.; Chen, T.T.; Jiang, Q.; Jia, L.Q.; Fan, A.; Wu, D.M.; et al. Plastic responses of below ground foraging traits to soil phosphorus rich patches across 17 coexisting AM tree species in a subtropical forest. J. Ecol. 2023, 111, 830–844. [Google Scholar] [CrossRef]
- Yan, X.L.; Dai, T.F.; Gao, Y.; Di, N.; Jia, L.M. Responses of fine root traits and soil nitrogen to fertilization methods and nitrogen application amounts in a poplar plantation. Forests 2023, 14, 282. [Google Scholar] [CrossRef]
- Wu, P.; Liu, F.; Wang, J.Y.; Liu, Y.H.; Gao, Y.; Zhang, X.Q.; Chen, G.Z.; Huang, F.Y.; Ahmad, S.; Zhang, P.; et al. Suitable fertilization depth can improve the water productivity and maize yield by regulating development of the root system. Agr. Water Manag. 2022, 271, 107784. [Google Scholar] [CrossRef]
- Germon, A.; Laclau, J.P.; Robin, A.; Jourdan, C. Tamm Review: Deep fine roots in forest ecosystems: Why dig deeper? For. Ecol. Manag. 2020, 466, 118135. [Google Scholar] [CrossRef]
- White, P.J.; George, T.S.; Gregory, P.J.; Bengough, A.G.; Hallett, P.D.; McKenzie, B.M. Matching roots to their environment. Ann. Bot. 2013, 112, 207–222. [Google Scholar] [CrossRef]
- Wang, X.; Liu, X.J.; Wang, J.; Tong, C.C.; Wu, Y. Temporal-spatial variations of root and soil nutrient under continuous intercropping of alfalfa and oat. Chin. J. Appl. Ecol. 2023, 34, 2683–2692. [Google Scholar]
- He, Y.L.; Xi, B.Y.; Li, G.D.; Wang, Y.; Jia, L.M.; Zhao, D.H. Influence of drip irrigation, nitrogen fertigation, and precipitation on soil water and nitrogen distribution, tree seasonal growth and nitrogen uptake in young triploid poplar (Populus tomentosa) plantations. Agr. Water Manag. 2021, 243, 106460. [Google Scholar] [CrossRef]
- Zeng, W.X.; Xiang, W.H.; Zhou, B.; Ouyang, S.; Zeng, Y.L.; Chen, L.; Freschet, G.T.; Valverde-Barrantes, O.J.; Milcu, A. Positive tree diversity effect on fine root biomass: Via density dependence rather than spatial root partitioning. Oikos 2021, 130, 1–14. [Google Scholar] [CrossRef]
- Ullah, F.; Gilani, H.; Sanaei, A.; Hussian, K.; Ali, A. Stand structure determines aboveground biomass across temperate forest types and species mixture along a local-scale elevational gradient. For. Ecol. Manag. 2021, 486, 118984. [Google Scholar] [CrossRef]
- Liu, T.T.; Wang, X.Y.; Shen, L.; Wei, W.W.; Zhang, S.; Wang, M.F.; Zhu, Y.; Tuertia, T.; Zhang, W. Apricot can improve root system characteristics and yield by intercropping with alfalfa in semi-arid areas. Plant Soil 2023, 1–18. [Google Scholar] [CrossRef]
- Chen, H.H.; Ding, G.J.; Wen, H.H.; Lu, Y. Effects of planting density on growth and economic benefit of masson pine plantation. Chin. For. Res. 2011, 24, 470–475. [Google Scholar]
- Zhan, L.F.; Yu, S.Q.; Wang, W.F.; Wang, Q.; Wang, J.B. Effects of horizontal spatial allocation on main fine root characters of Populus × euramericana cv. ‘Nanlin-95’ plantations. J. Beijing For. Univ. (Chin. Ed.) 2019, 41, 11–19. [Google Scholar]
- Di, N.; Xi, B.Y.; Pinto, J.R.; Wang, Y.; Li, G.D.; Jia, L.M. Root biomass distribution of triploid Populus tomentosa under wide-and narrow-row spacing planting schemes and its responses to soil nutrients. Chin. J. Plant Ecol. 2013, 37, 961–971. [Google Scholar] [CrossRef]
- Erktan, A.; Roumet, C.; Bouchet, D.; Stokes, A.; Pailler, F.; Munoz, F. Two dimensions define the variation of fine root traits across plant communities under the joint influence of ecological succession and annual mowing. J. Ecol. 2018, 106, 2031–2042. [Google Scholar] [CrossRef]
- Salahuddin; Rewald, B.; Razaq, M.; Lixue, Y.; Li, J.; Khan, F.; Jie, Z. Root order-based traits of Manchurian walnut & larch and their plasticity under interspecific competition. Sci. Rep. 2018, 8, 9815. [Google Scholar]
- Sun, Y.B.; Bi, H.X.; Duan, H.Q.; Peng, R.D.; Wang, J.J. Fine-root morphological variation and below-ground competition of an apple-peanut intercropping system. Chin. Sci. Soil Water Conserv. 2019, 17, 48–56. [Google Scholar]
- Wang, Z.B.; Jiang, L.N.; Gao, J.F.; Qing, S.Q.; Pan, C.; Wu, Y.; Yang, H.J.; Wang, D.H. The influence of microhabitat factors on the regeneration and species composition of understory woody plants in Pinus tabuliformis plantations on the Loess Plateau. For. Ecol. Manag. 2022, 509, 120080. [Google Scholar] [CrossRef]
- Mahaut, L.; Fort, F.; Violle, C.; Freschet, G.T. Multiple facets of diversity effects on plant productivity: Species richness, functional diversity, species identity and intraspecific competition. Funct. Ecol. 2020, 34, 287–298. [Google Scholar] [CrossRef]
- Hommel, R.; Siegwolf, R.; Zavadlav, S.; Arend, M.; Schaub, M.; Galiano, L.; Haeni, M.; Kayler, Z.E.; Gessler, A. Impact of interspecific competition and drought on the allocation of new assimilates in trees. Plant Biol. 2016, 18, 785–796. [Google Scholar] [CrossRef] [PubMed]
- Chen, B.J.; Xu, C.; Liu, M.S.; Huang, Z.Y.; Zhang, M.J.; Tang, J.; Anten, N.P. Neighborhood-dependent root distributions and the consequences on root separation in arid ecosystems. J. Ecol. 2020, 108, 1635–1648. [Google Scholar] [CrossRef]
- Luo, H.X.; Xu, H.; Chu, C.J.; He, F.L.; Fang, S.Q. High temperature can change root system architecture and intensify root interactions of plant seedlings. Front. Plant Sci. 2020, 11, 160. [Google Scholar] [CrossRef]
- Wu, C.; Bi, Y.L.; Zhu, W.B.; Yang, W.; Xue, C.; Li, H.; Liu, T. Arbuscular mycorrhizal inoculation alleviates water competition between adjacent plants in the mixed planting system. Rhizosphere 2023, 27, 100751. [Google Scholar] [CrossRef]
- Payn, T.; Carnus, J.; Freer-Smith, P.; Kimberley, M.; Kollert, W.; Liu, S.R.; Orazio, C.; Rodriguez, L.; Silva, L.N.; Wingfield, M.J. Changes in planted forests and future global implications. For. Ecol. Manag. 2015, 352, 57–67. [Google Scholar] [CrossRef]
Disclaimer/Publisher’s Note: The statements, opinions and data contained in all publications are solely those of the individual author(s) and contributor(s) and not of MDPI and/or the editor(s). MDPI and/or the editor(s) disclaim responsibility for any injury to people or property resulting from any ideas, methods, instructions or products referred to in the content. |
© 2024 by the authors. Licensee MDPI, Basel, Switzerland. This article is an open access article distributed under the terms and conditions of the Creative Commons Attribution (CC BY) license (https://creativecommons.org/licenses/by/4.0/).