Article

Farmers’ Socioeconomic Characteristics and Perception of Land Use Change Defining Optimal Agroforestry Practices in Khost Province, Afghanistan

by
Mujib Rahman Ahmadzai
1,2,*,
Mohd Hasmadi Ismail
1,
Pakhriazad Hassan Zaki
1,
Mohd. Maulana Magiman
3 and
Paiman Bawon
1
1
Department of Forestry Sciences and Biodiversity, Faculty of Forestry and Environment, Universiti Putra Malaysia, Serdang 43400, Malaysia
2
Department of Natural Resources Management, Faculty of Environment, Kabul University, Kabul 1006, Afghanistan
3
Department of Social Science and Management, Faculty of Humanities, Management and Science, Universiti Putra Malaysia, Bintulu Sarawak Campus, Bintulu 97008, Malaysia
*
Author to whom correspondence should be addressed.
Forests 2024, 15(11), 1877; https://doi.org/10.3390/f15111877
Submission received: 7 July 2024 / Revised: 12 September 2024 / Accepted: 23 September 2024 / Published: 25 October 2024
(This article belongs to the Section Forest Economics, Policy, and Social Science)

Abstract

:
Agroforestry practices evolve with the development of basic and advanced facilities, changes in natural and artificial factors of land, and land use trade-offs. This study aims to examine the farmers’ socioeconomic characteristics and perception of land use changes that define optimal agroforestry practices in Khost Province, Afghanistan. Data were collected from 662 farmers and analyzed using univariate Analysis of Variance (ANOVA) and Multivariate Analysis of Variance (MANOVA). The results found that forest and vegetable products, including fruits, berries, herbs, mushrooms, wild animals, oils, wood, honey, okra, eggplant, carrot, cucumber, pine nuts, pepper, and timber, have different impacts in terms of satisfaction with basic and advanced facilities, knowledge of land use changes, satisfaction with natural and artificial resources of land, and barriers to and economic benefits of land use. The limitations of this study included an absence of exogenous factors in the model such as climate change, financial conditions, market fluctuations, regulatory system, the area in which this study is selected, research design, and current condition of endogenous factors. Overall, this study defined a set of optimal agroforestry practices (expressed as crops and products) based on the farmers’ perception of land use changes in Khost Province, Afghanistan. This study provided useful insights for policymakers and development practitioners to promote agroforestry practice adoption and improve the socioeconomic development of agroforestry-dependent communities. Future works could explore the implications of agroforestry practices on the socioeconomic development of other dependent communities in Afghanistan.

1. Introduction

Political instability and destruction have reduced Afghanistan, a once progressive country that engaged in large-scale food production (specifically fruits), to a war zone. To date, Afghanistan ranks 155 on the Global Poverty Index, 0.349 on the Human Development Index, and 0.310 on the Gender Development Index. This appalling situation is a result of continuous environmental degradation rather than insufficient financial resources. In terms of skills and education, Afghanistan lacked the manpower of educated women to bridge this gap and develop an environmentally responsible community [1]. Agroforestry practices have positively impacted the socioeconomic development of dependent communities worldwide [2,3]. Agroforestry, as a sustainable land use approach that combines trees, crops, and livestock within a unified management framework, holds the potential to address challenges related to food security, poverty, and environmental sustainability in developing countries [4,5]. However, there is a notable lack of research on the economic and social advantages of agroforestry practices in Afghanistan, even though it has been a vital income source for rural communities for centuries [6].
Conceptually, agroforestry can catalyze economic, social, and environmental progress. One study provides possible solutions towards livelihood security and resilience to climate change, i.e., trees in farms [7]. By employing qualitative and quantitative research methods, [7] highlighted the benefits of agroforestry, such as shade and fruit, and the main tree species favorable to grow in semi-arid Isiolo County, Kenya, such as mango, papaya, banana, guava, and neem. The study also highlighted that the average scores of all five livelihood capital factors (financial, human, social, physical, and natural capital) were 10% higher for households practicing agroforestry, indicating more resilient livelihoods [7]. Another study highlighted the importance of tress as a source of fuelwood and fodder for rural populations in the Himalayas, India [8]. The study argued that smallholders can enhance resilience to climate change by adopting full dependency on natural resources, by avoiding the risk of total crop yield losses, and by reducing the time and effort needed to collect resources from outside the farm through the utilization of fuelwood and fodder in mountainous regions. In this vein, community uplift would provide the public with socioeconomic and environmental measures. The initiation of such agroforestry projects can advance the Khost Province to new levels. Despite addressing the environmental degradation caused by land use change and deforestation [9], the impact of agroforestry practices on dependent communities’ socioeconomic development in Khost Province, Afghanistan, remains under-examined. The current work bridged the literature gap by investigating the impact of agroforestry practices on the socioeconomic development of dependent communities in Khost Province.
The value of agriculture and its domestication must be supported through efficient preservation practices and other associated approaches for human development. Food insecurity was initially resolved via sufficient food resources, which resulted from food production and stability. Nevertheless, agriculture gradually declined with high population growth and poor yields or resources. Subsequently, agricultural production, such as agroforestry, was conceptualized to compensate for the greenery lost through environmental degradation. The recent decline in wheat (a staple food in Afghanistan) in agricultural production necessitated a novel and evolved approach, such as agroforestry. Past research on the impact of domesticating trees similarly to agriculture fields revealed positive results from production to the overall effect of greenery, which expanded with the increasing number of trees. As evidenced by past studies, the trees cultivated by primitive communities denoted the highest production level with notable success [10].
This study aims to examine the farmers’ socioeconomic characteristics and perception of land use changes that define optimal agroforestry practices in Khost Province, Afghanistan. The objectives are two-fold: to (i) examine the socioeconomic characteristics of farmers, and (ii) assess farmers’ perception of land use changes across the production of vegetables and forest products to define optimal agroforestry practices in Khost Province.

2. Literature Review

Most agroforestry studies proved to be descriptive or prescriptive. Current agroforestry practices are described or prescribed to address specific land use issues. Overall, economic references entail benefit–cost analyses, the relative profitability of different systems, and (in some cases) distributive and organizational issues [11]. An agroforestry system is expected to generate (i) an optimal output value at the exact resource cost or (ii) the same output value at a lower resource cost than a single crop system [12]. Economic benefits can be gained through agroforestry, which integrates trees and shrubs with other agricultural enterprises and provides farmers with additional income [13]. As farm labor is spread throughout the year, existing businesses can increase agricultural production and protect the environment by promoting agroforestry species on private farmlands that are not typically used for field crops [14,15]. As evidenced in past research, the introduction of multipurpose trees (mulberry trees) for sericulture could economically and environmentally benefit an agroforestry system compared to mono-cropping, where only one plant type is grown [16].
Agroforestry systems maximize land use, where every area is deemed suitable to cultivate valuable plants. Perennial, multiple-purpose crops that are planted once but yield benefits over time are emphasized [17]. Nevertheless, economic analysis of agroforestry and its theoretical foundation remains lacking due to the intricacies underpinning such assessments [6,18]. The paucity of economic agroforestry valuations can be partially explained by the spatial and temporal complexity of agroforestry systems [19], and the multiple inputs and outputs characterizing agroforestry [20,21].
The economic benefits of agroforestry have been extensively researched. For example, agroforestry systems were found to be more productive by 36% to 100% compared to monocultures, and the crop component yielded higher returns compared to negative returns from the tree component in agroforestry [22]. Studies conducted for comparison of agroforestry systems and business-as-usual agricultural practices indicated that the financial value of output produced in Mediterranean agroforestry systems is higher than that of the corresponding agricultural system [23]. However, in terms of profitability, the agricultural systems in Atlantic and Continental regions tended to be relatively more profitable. Overall, higher economic gain is reflected through the reduced externalities of pollution from nutrient and soil losses and increased advantages from carbon capture and storage linked to agroforestry landscapes [23]. Studies conducted on the diffusion of agroforestry systems highlighted the positive and relevant impact on the stocking rate (heads/pasture area) and a shift from cattle-raising activities to other high gross-added-value activities [24]. As a unified system with suitable methods to improve agricultural productivity and the natural environment, agroforestry can sustainably enhance food production and farmers’ economic conditions worldwide by positively contributing to soil fertility and household income [5]. Agroforestry practices and their symbiotic effects on improved crop growth and yield are widely recognized in addition to environmental, social, and economic aspects.
Several studies have been conducted on the socio-economic factors influencing the production of forestry products and vegetable farming. Among forestry products, these factors included education, gender, household income, ethnicity, distance to the market, and access to roads [25], elevation and shifting cultivation practices [26], social status, household status on foreign employment and landholding [27], age [28], wealth, racial composition, and home ownership [29], farm husbandry skills and years of residence [30], and several other factors. Among vegetable products, such factors included ethnicity, access to technical assistance, chemical fertilizers, pesticides, and improved seeds [31], education and farm environment [32], family size, extension services and credit services [33], market management, irrigation facilities, urban growth, price, and vegetable diseases [34], and several other factors. Hence, the importance of socio-economic factors in enhancing the production of forestry products was clearly stated.
In recent years, research has been carried out on the topic of agroforestry adoption in rural and urban areas. Studies showed that a higher proportion of farmers, around 60%, preferred to adopt agroforestry practices [27,35,36]. Adoption of agroforestry practices was found to be highly associated with effective utilization of land and material resources from forestry [27], life satisfaction and happiness [36], satisfaction from practicing agroforestry, aesthetic gratification, regenerative agricultural system, and knowledge transfer [37], as well as several socioeconomic and sociodemographic characteristics, including family size, age, land ownership, monthly household income [35,36,38], and farmers’ livelihood capital [39]. This signifies the importance of socioeconomic and sociodemographic characteristics of farmers as well as their satisfaction level towards agroforestry in increasing agroforestry adoption among farmers.
Agroforestry introduced several initiatives to adapt to the land use changes occurring due to changes in global climate, land degradation, prevailing poverty, and several other factors [38,40]. For instance, smallholder farmers in Western Kenya have started to use fuelwood found in trees of that region in place of timber and charcoal, which has increased their monthly income significantly [40]. Similarly, farmers in the Indian Eastern Himalayas and other parts of Asia adapted pineapple (Ananas comosus) agroforestry systems (PAFS) for harvesting pineapple, which has increased the bush density of pineapple and reduced the potential of forestry burn in the area [41]. Another advanced agroforestry system, rain-fed lowland rice and sugar plan (RLR-SP) hedges, has transformed the irrigation system and the process of farming shrimp, as well as converted deep-water rice areas into mixed gardens and paddy fields into small oil palm plantations, resulting in a significant land use change and increased production in the region [42]. Hence, agroforestry systems can be considered an alternative land use option in resource-deficient areas [38] and degraded farmland regions [43].
Community and socio-economic development is highly dependent on the availability of resources, particularly needed due to changing environmental, social, and economic factors of land use [44]. This urges the need to adopt agroforestry practices, which requires extensive research on factors that significantly improve their implementation [45]. Studying the level of satisfaction across these resources would encourage the agroforesters, policymakers, and the government to invest on such promising resources. For instance, satisfaction was found to be higher than natural, built, human, social, financial, political and cultural capitals together with negatively skewed distribution, hence suggesting that capital (or resources) should be built upon to enhance farmers’ satisfaction towards agroforestry [46]. Overall, the adoption of agroforestry practices was even witnessed to result in a prompt increase in fodder, fuelwood, and timber productions, with an indifferent level of lead production when compared to traditional farming practices [47]. Hence, it is important to determine which type of crop production can be significantly increased through agroforestry practices.
Having considered all the potential and promising benefits of agroforestry practices, it is deemed challenging to develop and distribute agroforestry as a viable means for farmers in diverse ecological and socioeconomic contexts. Following [48], agroforestry technology can only impact land management, productivity, or income with wide acceptance by farmers. Based on past research [35], farmers’ socioeconomic characteristics, resource availability, extension services, infrastructure, and markets render agroforestry adoption a complex process. The development of a novel input–output mix of annuals, perennials, green manure, fodder, and other components renders the adoption of agroforestry complex and challenging, specifically when different agroforestry technologies require multiple operations and management techniques. Thus, the three components of feasibility, profitability, and accessibility were considered in agroforestry adoption [20].
This extensive review of literature provided a wide range of economic, social, and environmental benefits of agroforestry [13,14,15,17,23,48]. However, it also challenged the farmers to adopt new ways of irrigation and planation in order to fully apply the agroforestry practices and obtain maximum benefits from it [38,40]. It requires the availability of facilities and infrastructure, which shapes farmers’ satisfaction towards their availability and links economic and technological impact of land use change with agroforestry adoption [20,21,27,36,37]. Evidently, the use of specialized agroforestry practices and systems maximizes crop productivity and, hence, significantly increases farmers’ income [38,39,40,41,42,43]. Hence, it would be interesting to study whether farmers’ satisfaction level with facilities and infrastructure, knowledge of land use changes, satisfaction with land resources, and perception of land use trade-offs differ across the production of vegetables and forest products and, hence, define the optimal agroforestry practices in Khost Province, Afghanistan.

3. Materials and Methods
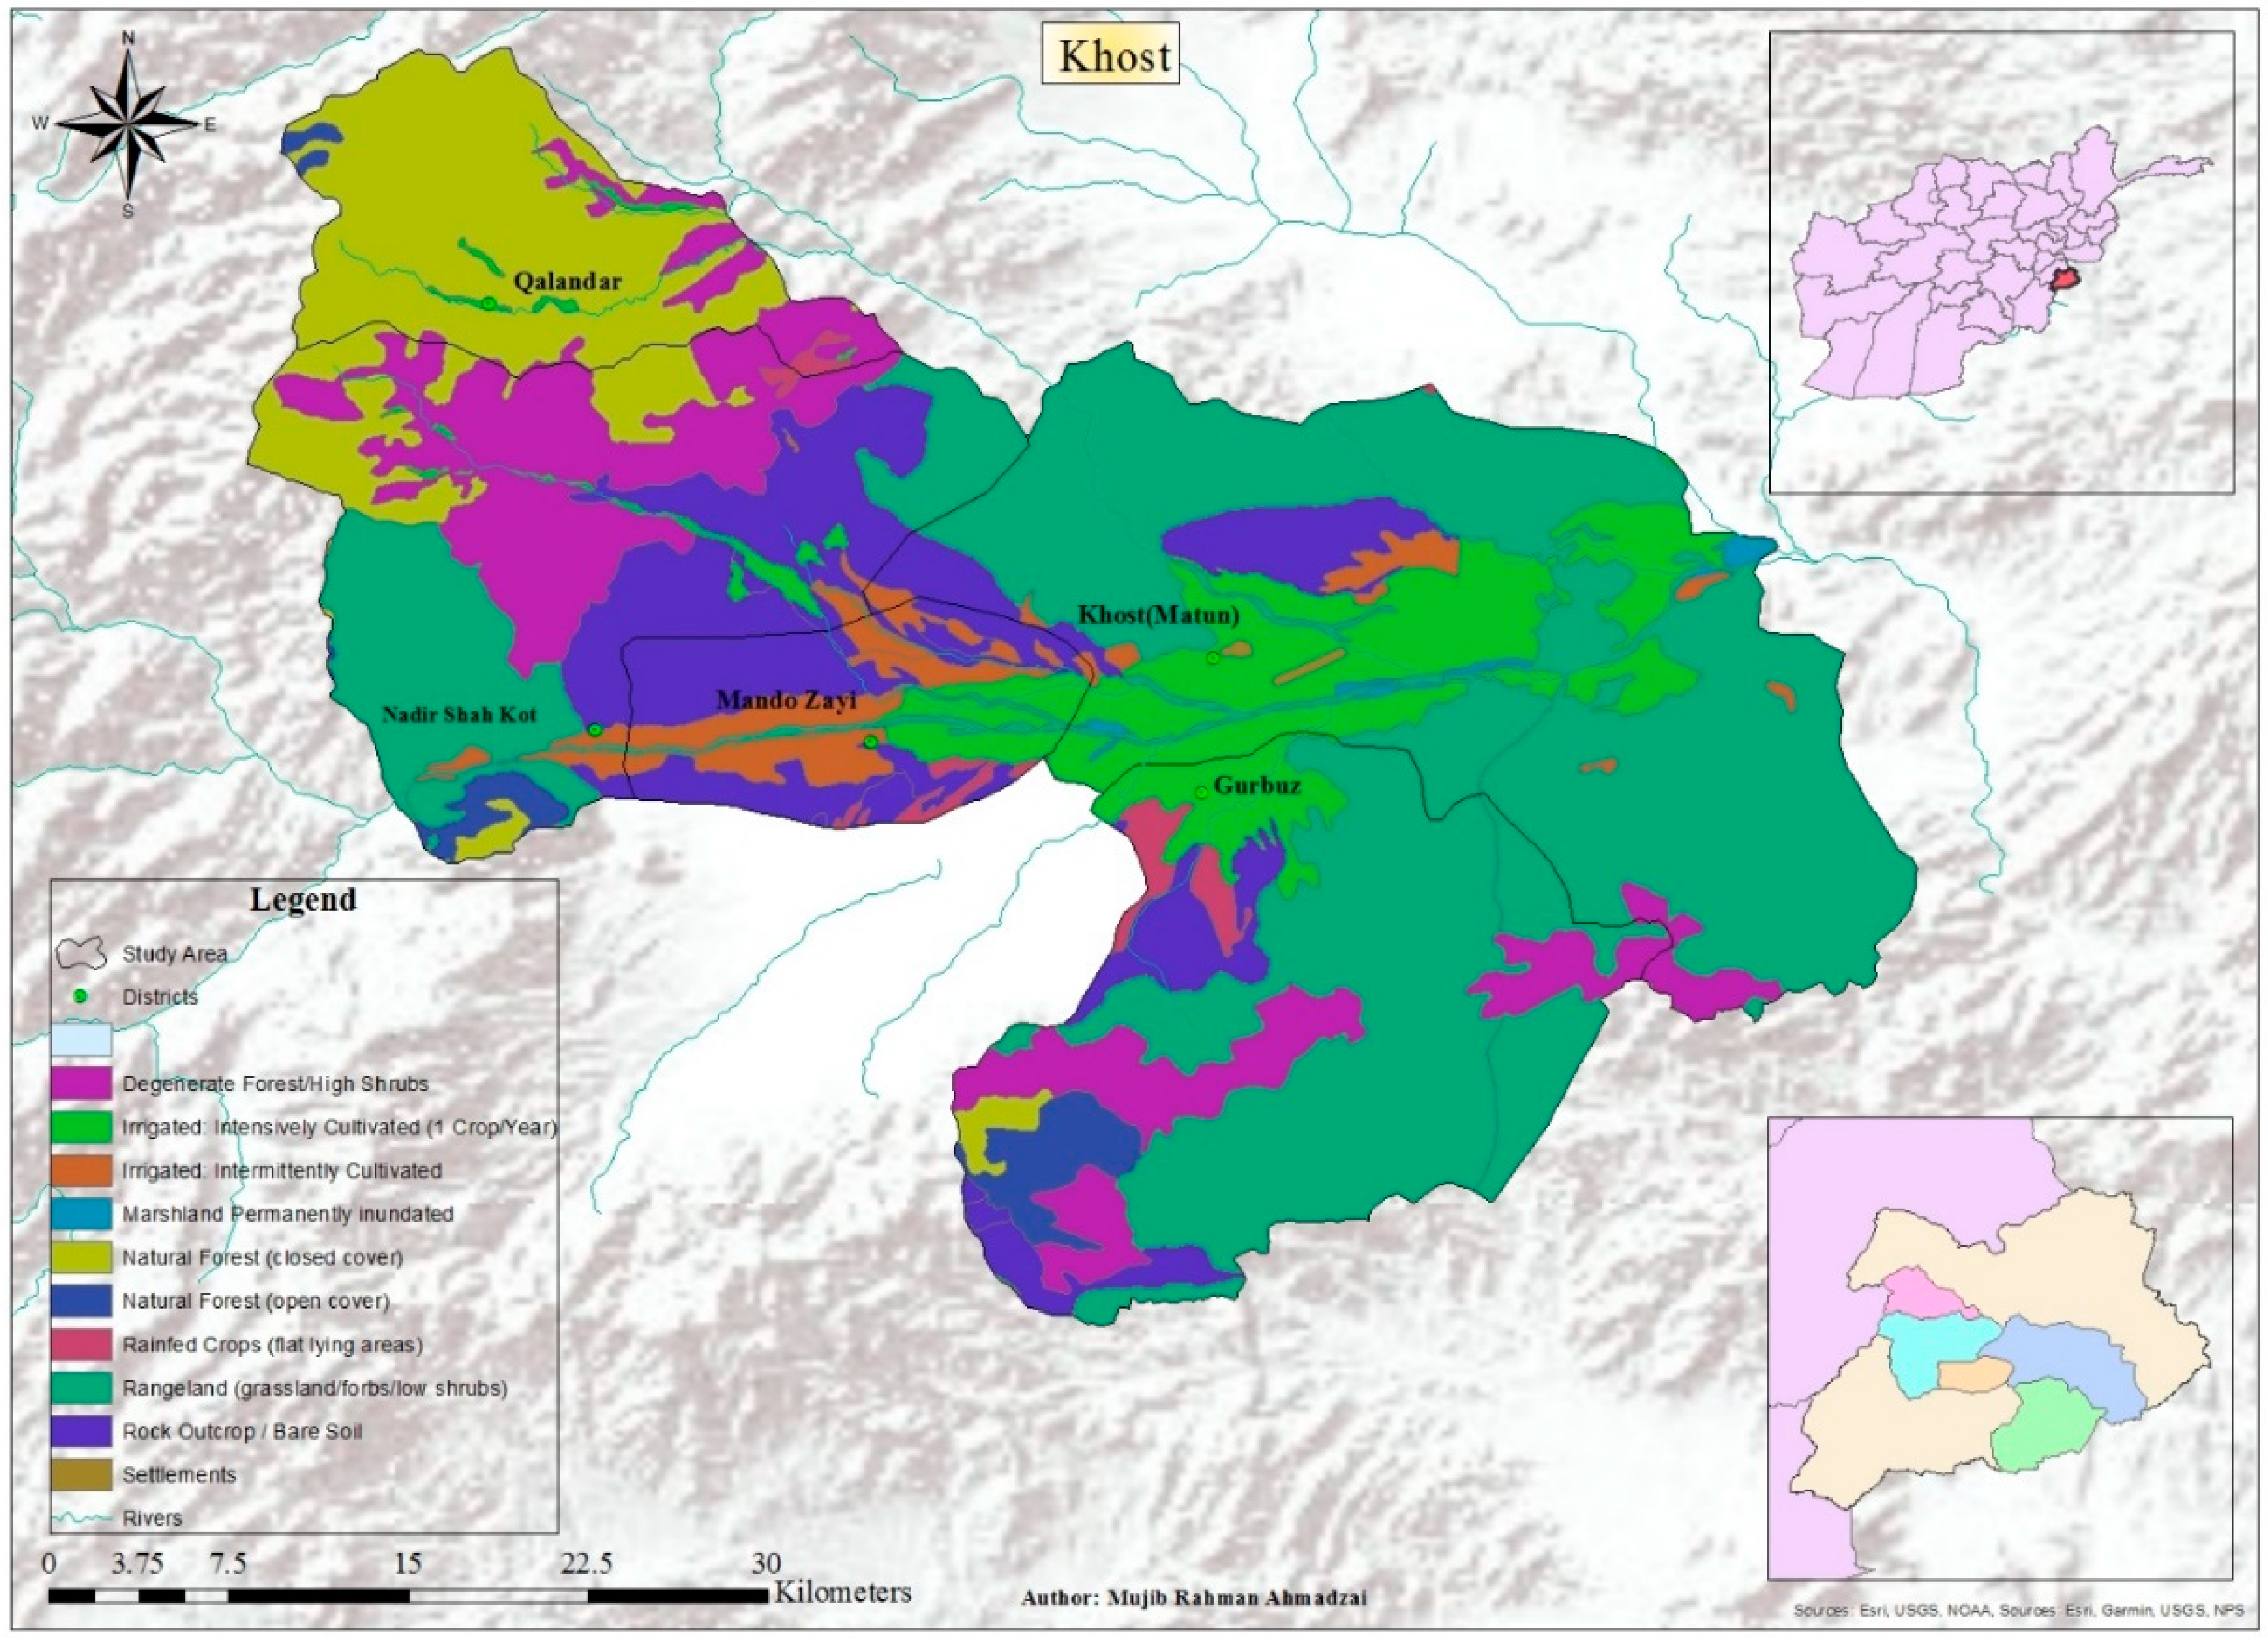
3.1. Study Area

This study was conducted in five districts—Gurbuz, Khost “Matun,” Mandozayi, Musakhel, and Qalandar—of Khost Province (Figure 1). Khost Province is situated in Southeastern Afghanistan and is primarily characterized by the Khost Valley and the encompassing mountains. Rangelands stretch from the Gurbuz district in the south to Jaji the Maydan district in the north. The Khost Valley and Bak areas support rain-fed and intensively irrigated crops. Natural forests line the border with the Durand Line and Paktia Province. Afghanistan’s Khost Province lies at an elevation of approximately 1180 m above mean sea level, positioned between 33°59 and 33°46 north latitudes and 69°19 and 70°21 east longitudes. The population stands at 614,584 (2018), encompassing an area of 4284.34 km2.
The combined forest and shrub cover across these districts spans 365.82 km2, which represents 23.62% of the entire province’s geographical area. Concerning forest canopy density classes within this province, they are primarily categorized as closed forests. The total forest area in Khost Province measures 1200.88 km2. This region boasts abundant natural resources, enabling extensive agroforestry activities to be undertaken.

3.2. Research Design

This study utilized a quantitative approach to examine the farmers’ socioeconomic characteristics and perception of land use changes across the production of vegetables and forestry products that define optimal agroforestry practices in Khost Province, Afghanistan. Such an approach allowed the researchers to quantitatively measure how farmers’ perceptions of land use changes are associated with the production of certain vegetables and forest products and consequently define best agroforestry practices in Khost Province, Afghanistan. In pursuit of a quantitative approach, a cross-sectional research design was employed to gather data through questionnaires filled between 8 February and 15 February 2023. The questionnaires were physically distributed by visiting each district and targeting agroforestry practicing farmers in each district. Ten students, four lecturers, and two administrative managers assisted in collecting the data to ensure data precision and reduce cost and time.

3.3. Study Population

Agroforestry-practicing farmers in Khost Province made up the study population. These farmers were suffering from declining socioeconomic status, and their main farming activity in this area was agroforestry, which had been practiced for a very long time.

3.4. Sampling Technique

Stratified sampling technique was used to determine the sample size obtained from each district. The target population was stratified into a stratum of five districts based on their homogeneity in terms of agroforestry being the farmers’ main source of income and their declining socioeconomic status.

3.5. Study Sample

Krejcie and Morgan’s formula [49] was employed to calculate the sample size from a stratum of five districts based on their current population. At present, the total population of Khost ‘Matun’, Manduzay, Gurbuz, Musekhel, and Qalandar is 161,780, 66,020, 30,670, 48,000, and 11,970, respectively. Hence, considering 1% error and 99% confidence interval, Krejcie and Morgan’s formula calculated a required sample size of 687 from all five districts, with 350 samples from Khost ‘Matun’, 142 samples from Manduzay, 65 samples from Gurbuz, 104 samples from Musakhel, and 26 samples from the Qalandar region. A total of 750 questionnaires were distributed physically, and 687 questionnaires were returned, which led the researchers to equalize the calculated sample size needed from each district, resulting in 91.6% response rate.

3.6. Research Instrument

A structured questionnaire was self-designed and self-administrated with the help of a team of nine experts from Kabul University and three experts from the Ministry of Agriculture. Later, twelve professors from Kabul University validated the questionnaire after removing 40 invalid questions from it. The questionnaire was divided into six sections: (i) sociodemographic information including age, gender, marital status, race, number of household members, and member of any association; (ii) economic activity including education level, job/employment, working experience, monthly work income, and monthly household income; (iii) satisfaction with facilities and infrastructure in the residential area (7 items); (iv) knowledge of land use changes (6 items); (v) satisfaction with land resources (6 items); and (vi) perception of land use trade-offs (13 items). An example item of variable ‘satisfaction with facilities and infrastructure’ would be ‘Having electricity supply’, while an example item of variable ‘knowledge of land use changes’ would be ‘I feel that my area is getting warmer now due to land use change’. Similarly, an example item of variable ‘satisfaction with land resources’ would be ‘Development of hydroelectric dam’, while an example item of variable ‘perception of land use trade-offs’ would be ‘Herbs are getting difficult to find’. The questions for these variables were asked to determine respondents’ agreement with each variable. The questions for sections (iii) to (vi) were measured on 5-point Likert scale, ranging from strongly disagree (1) to strongly agree (5). Lastly, a list of vegetables and forest products was provided with Yes/No scale to ask the respondents which products they and their families were producing and engaged in.

3.7. Exploratory Factor Analysis and Reliability of Research Instruments

Exploratory factor analysis via principal components was used as the extraction method, while varimax served as the rotation method to determine the factors of the following variables: ‘satisfaction with facilities and infrastructure’, ‘knowledge of land use changes’, ‘satisfaction with land resources’ and ‘perceptions of land use trade-offs’. Questions or items with a factor loading under 0.60, which did not fall into the underlying constructs, were excluded. All the construct questions revealed a factor loading above 0.60 and were included in the factor extracted (Table 1). Particularly, all the variables were extracted with over 60% of variances explained by factors measuring the constructs. The reliability test was assessed using Cronbach’s alpha upon extracting the factors. In line with [50], the Cronbach’s alpha score of all constructs exceeded the threshold level of 0.70 (Table 1). Hence, all the factors extracted revealed good reliability to commence the analysis.

3.8. Data Analysis Methods

This study applied multivariate ANOVA (MANOVA) for comparing satisfaction with facilities and infrastructure, knowledge of land use changes, satisfaction with land resources, and perception of land use trade-offs across the production of vegetables and forest products in Khost Province. MANOVA analysis determined which forest and vegetable products were significantly different in terms of extracted sub-dimensions of satisfaction with facilities and infrastructure (basic and advanced facilities), satisfaction with land resources (natural and artificial resources), and perceptions of land use trade-offs (barriers to land use and economic benefits of land use). However, since only one factor was extracted for knowledge of land use changes, univariate ANOVA was conducted to compare the knowledge of land use changes across the production of vegetables and forest products in Khost Province.
Here, the dependent variables included satisfaction with facilities and infrastructure (basic and advanced facilities), knowledge of land use changes, satisfaction with land resources (natural and artificial resources), and perception of land use trade-offs (barriers to land use and economic benefits of land use). The grouping variables in this study were the production of all vegetables and forest products, whereby the production of each product was recorded separately and coded as 0 = No and 1 = Yes for analysis purposes. All these separate variables for each of the vegetable and forest products were entered as ‘fixed factors’ in MANOVA and univariate ANOVA due to their categorical nature, and their main effects on each of dependent variables were separately tested. Here, since farmers were engaged in more than one product and even in forest production and vegetable farming at the same time, the percentages of total respondents engaged in the production of each product is mentioned alongside their names in brackets. For univariate ANOVA, a significance value of F-test statistic in tests of between-subjects effects lower than 0.05 leads to the rejection of null hypothesis [50]. However, for MANOVA analysis, the significant differences in each sub-dimension of dependent variables were determined through the significance of F-test statistics indicated by the tests of between-subjects effects table of MANOVA analysis [50,51]. If the significance value of the F-test statistic was lower than 0.05, the null hypothesis was rejected [50,51].

4. Results

4.1. Demographic Characteristics

Frequency distribution was designed to describe the frequency and percentage of respondents across different demographic characteristics. The results indicated that around two-thirds of the respondents were equally distributed among the age groups between 25 and 34 years old (35.5%) and between 15 and 24 years old (35.4%) (Table 2). Almost 92% of respondents were male. Almost two-thirds of the respondents were married (68.6%), while 30% of respondents were single. Almost all respondents were Pashtun (97.8%). Furthermore, most of the respondents had more than 20 members in their household (29.1%), followed by respondents with 10 to 14 members (26.6%) and respondents with 5 to 9 members (22.0%). Lastly, a majority of the respondents had no membership in any association (73.9%).

4.2. Socioeconomic Characteristics of Agroforestry Communities in Khost Province

Frequency distribution was designed to describe the frequency and percentage of respondents across different socioeconomic characteristics. The results indicated that one-third of the respondents had secondary-school-level education (33.2%), followed by respondents who had college/university education (24.0%) and those who had no formal education (23.0%) (Table 3). Regarding economic activity, approximately half of the respondents (50.4%) were self-employed. The remaining half included government employees (15.4%), NGO workers (13.1%), and farmhands (11.3%). Additionally, about half of the respondents (49.1%) had 1 to 5 years of work experience, followed by 6 to 10 years (27.1%), and 11 to 15 years (18.2%). Concerning income, nearly half of the respondents (42.1%) earned less than AFG 5000 per month. The percentage of respondents decreased notably as the monthly income increased. Finally, a substantial portion (44.5%) reported a monthly household income below AFG 15,000, 19.4% had an income ranging from AFG 16,000 to AFG 20,000, and 10.6% reported an income between AFG 26,000 and AFG 30,000.
Hence, it is evident from the frequency distribution that most of the respondents had secondary-school-level education (33.2%), were self-employed (50.4%), had been working for 1 to 5 years (49.1%), earned less than AFG 5000 monthly (42.1%), and had a monthly household income of less than AFG 5000 (44.5%). Overall, income, education, employment level, working experience, monthly income, and monthly household income provide an overview of the socioeconomic characteristics of agroforestry communities in Khost Province.

4.3. Farmers’ Perception of Land Use Changes across Production of Forest Products

MANOVA was performed to compare farmers’ satisfaction with facilities and infrastructure, satisfaction with land resources, and perception of land use trade-offs across the production of forest products. Meanwhile, univariate ANOVA was conducted to compare the knowledge of land use changes across the production of forest products. Such a comparison links the satisfaction with certain types of facilities and infrastructure, farmers’ knowledge of changes in land use, satisfaction with certain types of land resources, and farmers’ perception about land use trade-offs (barriers to land use versus economic benefits of land use) to the production of certain forest products, which was defined in the analysis.
The results from MANOVA in Table 4 indicate that satisfaction with basic facilities and infrastructure differed significantly across farmers producing or not producing wood (F (1, 274) = 4.85; p < 0.05). This implied that not having wood in their portfolio results in higher satisfaction with basic facilities and infrastructure (M = 3.78, SD = 0.828) than having wood in their portfolio (M = 3.56, SD = 0.852). Furthermore, satisfaction with advanced facilities and infrastructure differed significantly across the production of fruits and berries [Fruits: F (1, 274) = 4.45; p < 0.05, Berries: F (1, 274) = 5.76, p < 0.05]. This implied that having berries and fruits in their portfolio results in higher satisfaction with advanced facilities and infrastructure (Berries: M = 3.74, SD = 0.825; Fruits: M = 3.86, SD = 0.611) than not having berries (M = 3.68, SD = 0.528) and fruits (M = 3.57, SD = 0.797).
Based on the results derived from univariate ANOVA (Table 4), knowledge of land use changes differed significantly across the production of berries, and wild animals were significantly related to these [Berries: F (1, 274) = 7.34, p < 0.01, Wild Animals: F (1, 274) = 6.77, p < 0.01]. In particular, having berries in their portfolio results in higher knowledge of land use changes (M = 3.68, SD = 0.687) than not having berries (M = 3.74, SD = 0.716), while not having wild animals in their portfolio results in lower knowledge of land use changes (M = 3.87, SD = 0.668) than having wild animals (M = 3.67, SD = 0.738).
In terms of satisfaction with land resources, the results in Table 4 indicated that satisfaction with the natural resources of land differed significantly across the production of wild animals and timber [Berries: F (1, 274) = 24.92, p < 0.001; Wild Animals: F (1, 274) = 8.34, p < 0.01; Timber: F (1, 274) = 4.32, p < 0.05]. This implied that having berries in their portfolio resulted in higher satisfaction with natural resources (M = 3.43, SD = 1.499) than not having berries (M = 2.89, SD = 1.493). Also, having wild animals and timber in their portfolio resulted in lower satisfaction with natural resources [Wild Animals: M = 2.87, SD = 1.580; Timber: M = 2.88, SD = 1.593] than not having wild animals (M = 3.27, SD = 1.433) and timber (M = 3.27, SD = 1.433). Furthermore, the satisfaction with the artificial resources of land differed significantly across the production and non-production of herbs, mushrooms, and berries [Herbs: F (1, 274) = 3.86, p < 0.05; Mushrooms: F (1, 274) = 6.94, p < 0.01; Berries: F (1, 274) = 4.61, p < 0.05]. This implied that having mushrooms in their portfolio led to higher satisfaction with artificial resources (M = 3.93, SD = 0.720) than not producing mushrooms (M = 3.66, SD = 0.775). Also, having herbs and berries in their portfolio led to lower satisfaction with artificial resources [Herbs: M = 3.71, SD = 0.853; Berries: M = 3.69, SD = 0.936] than not having herbs (M = 3.80, SD = 0.696) and berries (M = 3.81, SD = 0.633).
The MANOVA analysis in Table 4 also revealed that perception about barriers to land use differed significantly across farmers producing or not producing pine nuts, berries, wild animals, and timber [Pine Nuts: F (1, 274) = 24.92, p < 0.001; Berries: F (1, 274) = 24.92, p < 0.001; Wild Animals: F (1, 274) = 8.34, p < 0.01; Timber: F (1, 274) = 4.32, p < 0.05]. This implied that having pine nuts and berries in their portfolio led to a better perception about barriers to land use [Pine Nuts: M = 3.70, SD = 0.867; Berries: M = 3.74, SD = 0.879] than not having pine nuts (M = 3.64, SD = 0.779) and berries (M = 3.63, SD = 0.783). Also, having wild animals and timber in their portfolio led to a reduced perception about barriers to land use [Wild Animals: M = 3.55, SD = 0.914; Timber: M = 3.59, SD = 0.893] compared to not having wild animals (M = 3.76, SD = 0.729) and timber (M = 3.73, SD = 0.755) in their portfolio. Similarly, the results also revealed that perceptions about economic benefits of land use differed significantly across farmers producing or not producing berries, wild animals, and timber [Berries: F (1, 274) = 28.44, p < 0.001; Wild Animals: F (1, 274) = 4.39, p < 0.05; Timber: F (1, 274) = 7.37, p < 0.001]. In particular, having berries in their portfolio led to a better perception about economic benefits of land use (M = 4.06, SD = 0.673) than not having berries (M = 3.71, SD = 0.734). Also, having wild animals and timber in their portfolio led to a reduced perception about economic benefits of land use [Wild Animals: M = 3.83, SD = 0.725; Timber: M = 3.81, SD = 0.679] compared to not having wild animals (M = 3.85, SD = 0.632) and timber (M = 3.86, SD = 0.670).

4.4. Farmers’ Perception of Land Use Changes across Vegetable Farming

Similar to that carried out with forest products, a MANOVA was performed to compare farmers’ satisfaction with facilities and infrastructure, satisfaction with land resources, and perception of land use trade-offs across vegetable farming, while a univariate ANOVA was conducted to compare the knowledge of land use changes across vegetable farming.
The results from the MANOVA in Table 5 indicated that satisfaction with basic facilities and infrastructure differed significantly across farmers producing and not producing okra and cucumber [Okra: F (1, 687) = 4.51; p < 0.05; Cucumber: F (1, 687) = 7.42; p < 0.01]. Also, having okra and cucumber in their portfolio led to increased satisfaction with basic facilities and infrastructure [Okra: M = 3.87, SD = 0.868; Cucumber: M = 3.80, SD = 0.837] compared to not having okra (M = 3.54, SD = 0.964) and cucumber (M = 3.58, SD = 0.980). Similarly, satisfaction with advanced facilities and infrastructure differed significantly across farmers producing and not producing cucumber (F (1, 687) = 5.66, p < 0.05). This further implied that having cucumber in their portfolio led to increased satisfaction with advanced facilities and infrastructure (M = 3.88, SD = 0.754) compared to not having cucumber (M = 3.52, SD = 0.853).
The results from the univariate ANOVA regarding the knowledge of land use changes in Table 5 indicated that knowledge of land use changes differed significantly across farmers producing and not producing okra, eggplant, and carrot only [Okra: F (1, 687) = 4.02; p < 0.05; Eggplant: F (1, 687) = 9.30; p < 0.01; Carrot: F (1, 687) = 5.73; p < 0.05]. This further implied that having okra and carrot in their portfolio led to greater knowledge of land use changes [Okra: M = 3.82, SD = 0.765; Carrot: M = 3.78, SD = 0.750] than not having okra (M = 3.67, SD = 0.769) and carrot (M = 3.69, SD = 0.778). Also, farmers with eggplant in their portfolio had lesser knowledge of land use changes (M = 3.67, SD = 0.759) than those without eggplant (M = 3.74, SD = 0.775).
The results from the MANOVA regarding satisfaction with land resources in Table 5 indicated that satisfaction with natural resources of land changes differed significantly across farmers producing and not producing yellow pumpkin (F (1, 687) = 4.61; p < 0.05). This implied that having yellow pumpkin in their portfolio led to higher satisfaction with the natural resources of land (M = 3.45, SD = 1.370) than not having eggplant (M = 3.02, SD = 1.564). Similarly, the results also revealed that satisfaction with artificial resources of land changes differed significantly across farmers producing and not producing pepper, potato, eggplant, carrot, and cucumber [Pepper: F (1, 687) = 4.81; p < 0.05; Potato: F (1, 687) = 5.08; p < 0.05; Eggplant: F (1, 687) = 12.18; p < 0.001; Carrot: F (1, 687) = 8.02; p < 0.01; Cucumber: F (1, 687) = 9.07; p < 0.01]. This implied that having pepper, carrot, cucumber, potato, and eggplant in their portfolio led to higher satisfaction with artificial resources of land [Pepper: M = 3.95, SD = 0.808; Carrot: M = 3.90, SD = 0.824; Cucumber: M = 3.91, SD = 0.745; Potato: M = 3.80, SD = 0.887; Eggplant: M = 3.76, SD = 0.890] than not having pepper (M = 3.65, SD = 0.862), carrot (M = 3.64, SD = 0.862), cucumber (M = 3.64, SD = 1.887), potato (M = 3.68, SD = 0.844) and eggplant (M = 3.70, SD = 0.841).
The results from the MANOVA regarding the perception of land use trade-offs in Table 5 indicated that the perception about barriers to land use differed significantly across farmers producing and not producing pepper and okra [Pepper: F (1, 687) = 4.71; p < 0.05; Okra: F (1, 687) = 5.29; p < 0.05]. This implied that having okra in their portfolio led to a better perception about barriers to land use (M = 3.84, SD = 0.837) than not having okra (M = 3.62, SD = 0.866), while having pepper in their portfolio led to a lower perception about barriers to land use (M = 3.64, SD = 0.922) than not having pepper (M = 3.70, SD = 0.843). Similarly, the results also revealed that the perception about economic benefits of land use differed significantly across farmers producing and not producing onion and okra [Onion: F (1, 687) = 5.16; p < 0.05; Okra: F (1, 687) = 4.01; p < 0.05]. This implied that having onion and okra in their portfolio led to a reduced perception about the economic benefits of land use [Onion: M = 3.99, SD = 0.755; Okra: M = 4.02, SD = 0.746] compared to not having onion (M = 3.76, SD = 0.826) and timber (M = 3.76, SD = 0.824).

5. Discussion

While examining the socioeconomic factors and perception of land use changes that define optimal agroforestry practices in Khost Province, Afghanistan, this study found that certain agroforestry products (expressed as vegetables and forest products) are more suitable to grow due to farmers’ satisfaction with facilities and infrastructure, knowledge of land use changes, satisfaction with land resources, and perception of land use trade-offs. These forest products include fruits, berries, timber, oils, wood, honey, wild animals, herbs, mushrooms and pine nuts, while the vegetables include pepper, eggplant, carrot and cucumber. The production of these vegetables and forest products defines the optimal agroforestry practices, which can generate more produce and more income for the local agroforestry community of Khost Province, Afghanistan. Defining optimal agroforestry practices leads farmers towards the identification of appropriate crops and products that best suit the availability of facilities, infrastructures and land resources, as well as land use changes and trade-offs. This phenomenon is often studied and proven efficient in other regions like Europe [52], South Africa [53,54], China [55], and Southeast Asia [56], as well as at a global level [57].
As opposed to mono-cropping, multi-cropping and multipurpose trees under am agroforestry process and procedure can have more economic and environmental benefits due to the land use changes. The deployment of intercropping and agroforestry can be adapted to encounter the challenges and negative factors of land use change, including the availability and accessibility of vegetables and forestry products. A study emphasizing the differences between agroforestry and farm mosaic systems explained that cultivating one crop on a certain land is risky particularly in drought conditions due to climate and market uncertainty [58]. The best strategy is to move towards agroforestry, which can be an economically efficient diversification strategy [58]. While adapting towards economies of scale and scope, it is best to engage with trees and crops, which will generate higher incomes and more produce for the local community.
Considering the farmers’ satisfaction with facilities and infrastructure in Khost Province, Afghanistan, it is best to produce fruits, berries, and cucumber among all vegetable and forestry products, as these were found to have more satisfactory results compared to all products. Moreover, it is best to produce herbs, mushrooms, wild animals, oil, wood, honey, okra, eggplant and carrot among all vegetable and forestry products, as these were found to be more productive based on locals’ knowledge about land use changes. In terms of satisfaction with land resources, including satisfaction with logging resources, development of a planted forest and a hydroelectric dam, agricultural activities, and government policy, it is best to produce mushrooms, berries, wild animals, eggplant, carrot, and cucumber to maximize the economic and environmental benefits of these land resources. Lastly, in terms of perception about land use trade-offs, including barriers to land use such as a scarcity of fruits, wild animals and river sources, and economic benefits of land use such as the suitability of prices, availability of consumers, and presence of job opportunities, it is best to produce pine nuts, berries, wild animal, timber, pepper, okra, onion, and cucumber to maximize the benefits from land use trade-offs. Farmers can rely on these vegetables and forest products to define optimal agroforestry practices in Khost Province, Afghanistan. The cultivation of these crops and products is also beneficial to cope with the changes in soil nutrition and the fertilization value of soil. Similar to the findings of this study, studies conducted in Asia, Southeast Asia, Europe and South Africa also presented a set of the most efficient crops that can be cultivated based on the available resources, infrastructure, nutrient concentration in soil, climate change, and other land use changes [52,53,54,55,56,59]. Due to land use change, agroforestry can be an economically efficient diversification strategy as opposed to mono-cropping systems. Multi-cropping and intercropping are some of the promising strategies to cope with land use changes, changes in facilities and infrastructure, changes in land resources, and for maximizing the economic benefits of land use while coping with barriers to land use.
While examining the socioeconomic characteristics of Khost Province, Afghanistan, this study found that most people have secondary-school-level education. Almost half of the population are self-employed with an experience of 1 to 5 years of experience and with a monthly income of less than AFG 5000. The monthly household income of these people is below AFG 15,000. A majority of the population in Khost Province, Afghanistan, relies on agricultural activities as their main source of livelihood. Overall, income, education, employment level, working experience, monthly income, and monthly household income provide an overview of the socioeconomic characteristics of agroforestry communities in Khost Province. Hence, it can be argued that agroforestry is the best possible adaption strategy towards land use changes in Khost Province, Afghanistan.
The study findings offer valuable insights for policymakers and practitioners to devise strategies for sustainable agroforestry, aiming to elevate the socioeconomic status of communities. This study enriches the existing literature on rural development and resource management by scrutinizing how various agroforestry products influence the social and economic dynamics. Collaboration among agencies, local authorities, and community representatives is essential for improving community facilities and infrastructure, thereby enhancing living conditions and fostering sustainable development. Initiatives such as knowledge-sharing sessions and increased market access for agroforestry products can create additional income avenues for community members. Future studies could replicate this study in other Afghan areas and provinces, which would enhance generalizability. Interviews with farmers and agroforesters could offer valuable insights into practices, their potential benefits, and drawbacks, augmenting research objectivity and practicality.

6. Conclusions

This study aims to examine the farmers’ socioeconomic factors and perception of land use changes that define optimal agroforestry practices in Khost Province, Afghanistan. This study found that certain agroforestry products (expressed as vegetables and forest products) are more suitable to grow due to farmers’ satisfaction with facilities and infrastructure, knowledge of land use changes, satisfaction with land resources, and perception of land use trade-offs. Specifying these crops and products results in cultivation of agroforestry products that would create productive and sustainable use of agricultural land in Khost Province, Afghanistan. By investigating farmers’ perception of land use change in terms of four main elements, i.e., farmers’ satisfaction with facilities and infrastructure, knowledge of land use changes, satisfaction with land resources, and perception of land use trade-offs, this study provides a set of optimal agroforestry practices that effectively work to support the challenging changes in land use, and helps farmers understand which crops’ or forest products’ production is more favorable for them.
Several future proposals can be suggested based on this study’s findings and limitations. Firstly, potential scholars can explore factors beyond land use change, such as climate change, shifts in policies and regulations, and changes in financial support available to farmers and agroforesters, which may affect the socioeconomic characteristics of agroforestry systems in dependent communities of Afghanistan. Secondly, an experimental or longitudinal design can also be employed to examine the long-term effects of such environmental shifts. Thirdly, the current work can be replicated in other areas and provinces in Afghanistan as well as in other agricultural countries such as Pakistan, India, Bangladesh, Liberia, Nigeria, Ghana, etc., in order to increase outcome generalizability. In addition, similar studies can be conducted with simpler sampling techniques, such as purposive sampling or convenience sampling, to replicate the findings and implications of this research. Similarly, similar studies can be conducted on large-scale or medium-scale farmers to increase the generalizability of the findings. Lastly, future researchers can also interview farmers and agroforesters to determine the practices used and their potential benefits and drawbacks for enhanced research objectivity and generalizability.

7. Limitations

This study encountered several limitations. Firstly, this work primarily focused on the change in land use and its effects on agroforestry. Secondly, the study area was restricted to Khost Province, Afghanistan, with each district demonstrating varying levels of soil nutrition, soil moisture, temperature, and precipitation. Third, it was considered challenging to adopt a well-established questionnaire that measures the socioeconomic characteristics of agroforestry-dependent communities. Fourth, the survey data were influenced by selection bias, which can affect outcome generalizability. Fifth, the empirical data were generally collected from small-scale or large-scale farmers, which could influence the socioeconomic impacts of their agroforestry practices. Moreover, stratified sampling was applied on the study population of each district, which includes children and infants that are yet to select an occupation. Oversimplication may urge researchers to apply a different sampling technique, such as purposive sampling or other non-probability sampling for the calculation of sample size. Furthermore, the cross-sectional design of this study rendered it impossible to examine the impact of land use change and agroforestry practices on the socioeconomic factors over a decade. Lastly, this study solely focused on farmers’ and agroforesters’ current socioeconomic attributes. This limitation may pose new challenges to land use and climate change and shifts in temperature and precipitation, which were not included in the current study’s scope.

Author Contributions

Data curation, M.R.A.; formal analysis, M.R.A.; funding acquisition, M.R.A. and M.H.I.; investigation, M.R.A.; methodology, M.R.A.; resources, M.R.A. and M.H.I.; supervision, P.H.Z. and M.H.I.; writing—original draft, M.R.A.; writing—review and editing, P.H.Z., M.H.I., M.M.M. and P.B.; All authors have read and agreed to the published version of the manuscript.

Funding

This study was supported by grants from the Afghanistan Research Initiative (ARI) at the University of Central Asia, funded by Canada’s International Development Research Centre (IDRC) and the Aga Khan Foundation Canada (AKFC). The grants were awarded to Ahmadzai Mujib Rahman, a Ph.D. scholar at the University of Putra Malaysia. The authors are grateful to ARI and AKFC for their financial support.

Data Availability Statement

Data are contained within the article.

Conflicts of Interest

The authors declare no conflicts of interest.

References

  1. Hamidazada, M.; Cruz, A.M.; Yokomatsu, M. Vulnerability Factors of Afghan Rural Women to Disasters. Int. J. Disaster Risk Sci. 2019, 10, 573–590. [Google Scholar] [CrossRef]
  2. Kiptot, E.; Franzel, S.; Degrande, A. Gender, Agroforestry and Food Security in Africa. Curr. Opin. Environ. Sustain. 2014, 6, 104–109. [Google Scholar] [CrossRef]
  3. Mukhlis, I.; Rizaludin, M.S.; Hidayah, I. Understanding Socio-Economic and Environmental Impacts of Agroforestry on Rural Communities. Forests 2022, 13, 556. [Google Scholar] [CrossRef]
  4. van Noordwijk, M. Agroforestry-Based Ecosystem Services: Reconciling Values of Humans and Nature in Sustainable Development. Land 2021, 10, 699. [Google Scholar] [CrossRef]
  5. Siles, P.; Cerdán, C.R.; Staver, C. Smallholder Coffee in the Global Economy—A Framework to Explore Transformation Alternatives of Traditional Agroforestry for Greater Economic, Ecological, and Livelihood Viability. Front. Sustain. Food Syst. 2022, 6, 808207. [Google Scholar] [CrossRef]
  6. Amare, D.; Darr, D. Agroforestry Adoption as a Systems Concept: A Review. Policy Econ. 2020, 120, 102299. [Google Scholar] [CrossRef]
  7. Quandt, A.; Neufeldt, H.; McCabe, J.T. Building Livelihood Resilience: What Role Does Agroforestry Play? Clim. Dev. 2019, 11, 485–500. [Google Scholar] [CrossRef]
  8. Nagar, B.; Rawat, S.; Pandey, R.; Kumar, M.; Alatalo, J.M. Fuelwood and Fodder Consumption Patterns among Agroforestry-Practicing Smallholder Farmers of the Lower Himalayas, India. Environ. Dev. Sustain. 2022, 24, 5594–5613. [Google Scholar] [CrossRef]
  9. Kouassi, J.-L.; Gyau, A.; Diby, L.; Bene, Y.; Kouamé, C. Assessing Land Use and Land Cover Change and Farmers’ Perceptions of Deforestation and Land Degradation in South-West Côte d’Ivoire, West Africa. Land 2021, 10, 429. [Google Scholar] [CrossRef]
  10. Leakey, R.R.B. The Intensification of Agroforestry by Tree Domestication for Enhanced Social and Economic Impact. In Multifunctional Agriculture; Elsevier: Amsterdam, The Netherlands, 2017; pp. 375–376. [Google Scholar]
  11. Staton, T.; Breeze, T.D.; Walters, R.J.; Smith, J.; Girling, R.D. Productivity, Biodiversity Trade-Offs, and Farm Income in an Agroforestry versus an Arable System. Ecol. Econ. 2022, 191, 107214. [Google Scholar] [CrossRef]
  12. Hoekstra, D.A. Economics of Agroforestry. Agrofor. Syst. 1987, 5, 293–300. [Google Scholar] [CrossRef]
  13. Raj, A.; Jhariya, M.K.; Yadav, D.K.; Banerjee, A.; Meena, R.S. Agroforestry: A Holistic Approach for Agricultural Sustainability. In Sustainable Agriculture, Forest and Environmental Management; Springer: Singapore, 2019; pp. 101–131. [Google Scholar]
  14. Kassie, G.W. Agroforestry and Farm Income Diversification: Synergy or Trade-off? The Case of Ethiopia. Environ. Syst. Res. 2018, 6, 8. [Google Scholar] [CrossRef]
  15. Santiago-Freijanes, J.J.; Mosquera-Losada, M.R.; Rois-Díaz, M.; Ferreiro-Domínguez, N.; Pantera, A.; Aldrey, J.A.; Rigueiro-Rodríguez, A. Global and European Policies to Foster Agricultural Sustainability: Agroforestry. Agrofor. Syst. 2021, 95, 775–790. [Google Scholar] [CrossRef]
  16. Rasool Mir, M.; Latif Khan, I.; Baqual, M.F.; Banday, M.; Raja, R.; Khursheed, S. Mulberry-Based Agroforestry System: An Effective Way of Maintaining Livelihood Security and Climate Change Mitigation. In Agroforestry and Climate Change; Includes bibliographical references and index; Apple Academic Press: Waretown, NJ, USA, 2019; pp. 299–318. [Google Scholar]
  17. Ahmadzai, M.R.; Zaki, P.H.; Ismail, M.H.; Bawon, P.; Karam, D.S. The Societal and Economic Impact of Reforestation Strategies and Policies in Southeast Asia—A Review. Forests 2022, 14, 1. [Google Scholar] [CrossRef]
  18. Gonçalves, C.d.B.Q.; Schlindwein, M.M.; Martinelli, G.d.C. Agroforestry Systems: A Systematic Review Focusing on Traditional Indigenous Practices, Food and Nutrition Security, Economic Viability, and the Role of Women. Sustainability 2021, 13, 11397. [Google Scholar] [CrossRef]
  19. Notaro, M.; Collado, C.; Depas, J.K.; Dumovil, D.; Denis, A.J.; Deheuvels, O.; Tixier, P.; Gary, C. The Spatial Distribution and Height of Associated Crops Influence Cocoa Tree Productivity in Complex Agroforestry Systems. Agron. Sustain. Dev. 2021, 41, 60. [Google Scholar] [CrossRef]
  20. Do, H.; Luedeling, E.; Whitney, C. Decision Analysis of Agroforestry Options Reveals Adoption Risks for Resource-Poor Farmers. Agron. Sustain. Dev. 2020, 40, 20. [Google Scholar] [CrossRef]
  21. Martinelli, G.d.C.; Schlindwein, M.M.; Padovan, M.P.; Gimenes, R.M.T. Decreasing Uncertainties and Reversing Paradigms on the Economic Performance of Agroforestry Systems in Brazil. Land Use Policy 2019, 80, 274–286. [Google Scholar] [CrossRef]
  22. Lehmann, L.M.; Smith, J.; Westaway, S.; Pisanelli, A.; Russo, G.; Borek, R.; Sandor, M.; Gliga, A.; Smith, L.; Ghaley, B.B. Productivity and Economic Evaluation of Agroforestry Systems for Sustainable Production of Food and Non-Food Products. Sustainability 2020, 12, 5429. [Google Scholar] [CrossRef]
  23. Kay, S.; Graves, A.; Palma, J.H.N.; Moreno, G.; Roces-Díaz, J.V.; Aviron, S.; Chouvardas, D.; Crous-Duran, J.; Ferreiro-Domínguez, N.; García de Jalón, S.; et al. Agroforestry Is Paying off–Economic Evaluation of Ecosystem Services in European Landscapes with and without Agroforestry Systems. Ecosyst. Serv. 2019, 36, 100896. [Google Scholar] [CrossRef]
  24. Gori Maia, A.; Eusebio, G.d.S.; Fasiaben, M.d.C.R.; Moraes, A.S.; Assad, E.D.; Pugliero, V.S. The Economic Impacts of the Diffusion of Agroforestry in Brazil. Land Use Policy 2021, 108, 105489. [Google Scholar] [CrossRef]
  25. Amusa, T.O.; Jimoh, S.O.; Azeez, I.O. Socio-Economic Factors Influencing Marketing of Non-Timber Forest Products in Tropical Lowland Rainforests of South-Western Nigeria. South. For. A J. For. Sci. 2017, 79, 161–168. [Google Scholar] [CrossRef]
  26. Phompila, C.; Lewis, M.; Ostendorf, B.; Clarke, K. Forest Cover Changes in Lao Tropical Forests: Physical and Socio-Economic Factors Are the Most Important Drivers. Land 2017, 6, 23. [Google Scholar] [CrossRef]
  27. Cedamon, E.; Nuberg, I.; Shrestha, K.K. How Understanding of Rural Households’ Diversity Can Inform Agroforestry and Community Forestry Programs in Nepal. Aust. For. 2017, 80, 153–160. [Google Scholar] [CrossRef]
  28. Garekae, H.; Thakadu, O.T.; Lepetu, J. Socio-Economic Factors Influencing Household Forest Dependency in Chobe Enclave, Botswana. Ecol. Process. 2017, 6, 40. [Google Scholar] [CrossRef]
  29. Fan, C.; Johnston, M.; Darling, L.; Scott, L.; Liao, F.H. Land Use and Socio-Economic Determinants of Urban Forest Structure and Diversity. Landsc. Urban Plan. 2019, 181, 10–21. [Google Scholar] [CrossRef]
  30. Ofoegbu, C.; Chirwa, P.W.; Francis, J.; Babalola, F.D. Socio-Economic Factors Influencing Household Dependence on Forests and Its Implication for Forest-Based Climate Change Interventions. South. For. A J. For. Sci. 2017, 79, 109–116. [Google Scholar] [CrossRef]
  31. Joshi, N.P.; Piya, L. Determinants of Small-Scale Commercial Vegetable Farming Among Vegetable Growers in Nepal. Sage Open 2021, 11, 215824402110101. [Google Scholar] [CrossRef]
  32. Sroka, W.; Dudek, M.; Wojewodzic, T.; Król, K. Generational Changes in Agriculture: The Influence of Farm Characteristics and Socio-Economic Factors. Agriculture 2019, 9, 264. [Google Scholar] [CrossRef]
  33. Djoumessi, Y.; Afari-Sefa, V.; Kamdem, C.B.; Bidogeza, J.-C. Socio-Economic and Institutional Factors Underlying Efficiency of Smallholder Vegetable Farms in Southwest Region of Cameroon. Int. J. Soc. Econ. 2018, 45, 93–106. [Google Scholar] [CrossRef]
  34. Rai, M.K.; Paudel, B.; Zhang, Y.; Khanal, N.R.; Nepal, P.; Koirala, H.L. Vegetable Farming and Farmers’ Livelihood: Insights from Kathmandu Valley, Nepal. Sustainability 2019, 11, 889. [Google Scholar] [CrossRef]
  35. Ahmad, S.; Xu, H.; Ekanayake, E.M.B.P. Socioeconomic Determinants and Perceptions of Smallholder Farmers towards Agroforestry Adoption in Northern Irrigated Plain, Pakistan. Land 2023, 12, 813. [Google Scholar] [CrossRef]
  36. Wijayanto, H.W.; Lo, K.-A.; Toiba, H.; Rahman, M.S. Does Agroforestry Adoption Affect Subjective Well-Being? Empirical Evidence from Smallholder Farmers in East Java, Indonesia. Sustainability 2022, 14, 10382. [Google Scholar] [CrossRef]
  37. Romanova, O.; Gold, M.A.; Hall, D.M.; Hendrickson, M.K. Perspectives of Agroforestry Practitioners on Agroforestry Adoption: Case Study of Selected SARE Participants. Rural Sociol. 2022, 87, 1401–1431. [Google Scholar] [CrossRef]
  38. Khan, M.; Mahmood, H.Z.; Abbas, G.; Damalas, C.A. Agroforestry Systems as Alternative Land-Use Options in the Arid Zone of Thal, Pakistan. Small-Scale For. 2017, 16, 553–569. [Google Scholar] [CrossRef]
  39. Ahmad, S.; Caihong, Z.; Ekanayake, E.M.B.P. Livelihood Improvement through Agroforestry Compared to Conventional Farming System: Evidence from Northern Irrigated Plain, Pakistan. Land 2021, 10, 645. [Google Scholar] [CrossRef]
  40. De Giusti, G.; Kristjanson, P.; Rufino, M.C. Agroforestry as a Climate Change Mitigation Practice in Smallholder Farming: Evidence from Kenya. Clim. Chang. 2019, 153, 379–394. [Google Scholar] [CrossRef]
  41. Reang, D.; Hazarika, A.; Sileshi, G.W.; Pandey, R.; Das, A.K.; Nath, A.J. Assessing Tree Diversity and Carbon Storage during Land Use Transitioning from Shifting Cultivation to Indigenous Agroforestry Systems: Implications for REDD+ Initiatives. J. Environ. Manag. 2021, 298, 113470. [Google Scholar] [CrossRef]
  42. Dumrongrojwatthana, P.; Wanich, K.; Trébuil, G. Driving Factors and Impact of Land-Use Change in a Fragile Rainfed Lowland Rice-Sugar Palm Cultural Agroforestry System in Southern Thailand. Sustain. Sci. 2020, 15, 1317–1335. [Google Scholar] [CrossRef]
  43. Chiemela, S.N.; Noulekoun, F.; Zenebe, A.; Abadi, N.; Birhane, E. Transformation of Degraded Farmlands to Agroforestry in Zongi Village, Ethiopia. Agrofor. Syst. 2018, 92, 1317–1328. [Google Scholar] [CrossRef]
  44. Wang, J.; Lin, Y.; Glendinning, A.; Xu, Y. Land-Use Changes and Land Policies Evolution in China’s Urbanization Processes. Land Use Policy 2018, 75, 375–387. [Google Scholar] [CrossRef]
  45. Tey, Y.S.; Li, E.; Bruwer, J.; Abdullah, A.M.; Brindal, M.; Radam, A.; Ismail, M.M.; Darham, S. The Relative Importance of Factors Influencing the Adoption of Sustainable Agricultural Practices: A Factor Approach for Malaysian Vegetable Farmers. Sustain. Sci. 2014, 9, 17–29. [Google Scholar] [CrossRef]
  46. Munsell, J.F.; Addlestone, B.J.; Bukowski, C.J.; Nkembi, L.; Kingsly, N.; Moore, E.A. Relationships between Agroforestry and Community Development According to Practitioners. Agrofor. Syst. 2018, 92, 1387–1396. [Google Scholar] [CrossRef]
  47. Paudel, D.; Tiwari, K.R.; Raut, N.; Sitaula, B.K.; Bhattarai, S.; Timilsina, Y.P.; Thapa, S. Which Agroforestry Practice Is Beneficial? A Comparative Assessment of the Traditional and the Improved Agroforestry Techniques in the Midhills of Nepal. Adv. Agric. 2021, 2021, 1–8. [Google Scholar] [CrossRef]
  48. Kassie, G.W. Agroforestry and Land Productivity: Evidence from Rural Ethiopia. Cogent Food Agric. 2016, 2, 1259140. [Google Scholar] [CrossRef]
  49. Krejcie, R.V.; Morgan, D.W. Determining Sample Size for Research Activities. Educ. Psychol. Meas. 1970, 30, 607–610. [Google Scholar] [CrossRef]
  50. Hair, J.F.; Black, W.C.; Babin, B.J.; Anderson, R.E. Multivariate Data Analysis, 7th ed.; Pearson Education Limited: Harlow, UK, 2014. [Google Scholar]
  51. Field, A. Discovering Statistics Using IBM SPSS Statistics, 6th ed.; SAGE Publications Ltd.: London, UK, 2024. [Google Scholar]
  52. Hong, J.; Gruda, N.S. The Potential of Introduction of Asian Vegetables in Europe. Horticulturae 2020, 6, 38. [Google Scholar] [CrossRef]
  53. Maseko, I.; Mabhaudhi, T.; Tesfay, S.; Araya, H.; Fezzehazion, M.; Plooy, C. African Leafy Vegetables: A Review of Status, Production and Utilization in South Africa. Sustainability 2017, 10, 16. [Google Scholar] [CrossRef]
  54. van Zonneveld, M.; Kindt, R.; Solberg, S.Ø.; N’Danikou, S.; Dawson, I.K. Diversity and Conservation of Traditional African Vegetables: Priorities for Action. Divers. Distrib. 2021, 27, 216–232. [Google Scholar] [CrossRef]
  55. Wang, H.; Li, X.; Song, J. Vegetable Genetic Resources in China. Hortic. Plant J. 2018, 4, 83–88. [Google Scholar] [CrossRef]
  56. van Noordwijk, M.; Ekadinata, A.; Leimona, B.; Catacutan, D.; Martini, E.; Tata, H.L.; Öborn, I.; Hairiah, K.; Wangpakapattanawong, P.; Mulia, R.; et al. Agroforestry Options for Degraded Landscapes in Southeast Asia. In Agroforestry for Degraded Landscapes; Springer: Singapore, 2020; pp. 307–347. [Google Scholar]
  57. Tort, Ö.Ö.; Vayvay, Ö.; Çobanoğlu, E. A Systematic Review of Sustainable Fresh Fruit and Vegetable Supply Chains. Sustainability 2022, 14, 1573. [Google Scholar] [CrossRef]
  58. Paul, C.; Weber, M.; Knoke, T. Agroforestry versus Farm Mosaic Systems–Comparing Land-Use Efficiency, Economic Returns and Risks under Climate Change Effects. Sci. Total Environ. 2017, 587–588, 22–35. [Google Scholar] [CrossRef] [PubMed]
  59. Sharma, U.C.; Datta, M.; Sharma, V. Land Use and Management. In Soils in the Hindu Kush Himalayas. Geography of the Physical Environment; Springer: Cham, Switzerland, 2023; pp. 295–462. [Google Scholar]
Figure 1. The location of Khost Province (specific research area) in Afghanistan and the current physical situations, such as river lines, build-up, forest and shrubs, barren land, etc., effects and the location of sampling sites.
Forests 15 01877 g001
Table 1. Exploratory factor analysis and instrument’s reliability result.
ConstructFactor ExtractedExplained Variances %α Value
Satisfaction with Facilities and InfrastructureSatisfaction with Basic Facilities and Infrastructure 52.08%0.754
Satisfaction with Advanced Facilities and Infrastructure13.97%0.864
Knowledge of Land Use Changes Knowledge of Land Use Changes61.13%0.868
Satisfaction with Land Resources Satisfaction with Natural Resources of Land 53.52%1.000
Satisfaction with Artificial Resources of Land20.28%0.833
Perception of Land Use Trade-offsPerception about Barriers to Land Use 54.05%0.907
Perception about Economic Benefits of Land Use 14.54%0.917
Table 2. Demographic characteristics of the respondents.
VariablesCategoriesFrequencyPercentage
Age15–24 years24335.4%
25–34 years24435.5%
35–44 years11917.3%
45–54 years679.8%
55–64 years121.7%
65 years and above20.3%
GenderMale62991.6%
Female588.4%
Marital StatusSingle20630.0%
Married47168.6%
Divorced101.4%
RacePashtun67297.8%
Tajik40.6%
Hazara40.6%
Others71.0%
No. of Household Members1–48211.9%
5–915122.0%
10–1418326.6%
15–197110.4%
20 and above20029.1%
Member of any AssociationYes17926.1%
No50873.9%
Table 3. Socioeconomic characteristics of the respondents.
VariablesCategoriesFrequencyPercentage
Education LevelNo Formal Education15823.0%
Primary School9013.1%
Secondary School22833.2%
College/University16524.0%
Master446.4%
Ph.D.20.3%
Job/EmploymentSelf-Employed34650.4%
Working at NGOs9013.1%
Working at a farm7811.3%
Government Worker10615.4%
Others679.8%
Working Experience 1–5 years33749.0%
6–10 years18627.1%
11–15 years12518.2%
16 years and above395.7%
Monthly Work Income AFG 5000 and below28942.1%
AFG 6000–AFG 800016524.0%
AFG 9000–AFG 10,00011817.2%
AFG 11,000–AFG 15,0007310.6%
AFG 16,000 and above426.1%
Monthly Household Income AFG 15,000 and below30644.5%
AFG 16,000–AFG 20,00013319.4%
AFG 21,000–AFG 25,000558.0%
AFG 26,000–AFG 30,0007310.6%
AFG 31,000–AFG 35,000487.0%
AFG 36,000–AFG 40,000436.3%
AFG 41,000 and above294.2%
Table 4. Comparison of satisfaction with facilities and infrastructure, knowledge of land use changes, satisfaction with land resources, and perception of land use trade-offs across the production of forest products.
Production of Forest Products
(% of Total Sample Size Engaged in a Certain Product)
Satisfaction with Level of Facilities and InfrastructureKnowledge of Land Use ChangesSatisfaction with Land ResourcesPerception of Land Use Trade-Offs
Basic FacilitiesAdvanced FacilitiesNatural ResourcesArtificial ResourcesBarriersEconomic Benefits
MANOVA
F (p-Value)
Univariate ANOVA
F (p-Value)
MANOVA
F (p-Value)
MANOVA
F (p-Value)
Corrected Model0.93 (0.521)1.86 (0.039) *1.576 (0.099)3.42
(<0.001) ***
2.36 (0.007) **2.18 (0.013) *3.42
(<0.001) ***
Intercept4414.51
(<0.001) ***
6318.23
(<0.001) ***
6849.31
(<0.001) ***
1103.03
(<0.001) ***
6033.23
(<0.001) ***
4920.67
(<0.001) ***
8593.04
(<0.001) ***
Herbs (40.5%)0.64 (0.425)0.89 (0.347)0.00 (0.979)0.00 (0.947)3.86 (0.050) *0.50 (0.482)2.04 (0.155)
Mushrooms (40.1%)2.09 (0.150)0.01 (0.907)0.01 (0.912)2.01 (0.157)6.94 (0.009) **1.01 (0.316)0.67 (0.413)
Fruits (48.5%)0.01 (0.906)4.45 (0.036) *0.58 (0.449)0.00 (0.999)1.23 (0.269)1.06 (0.305)0.12 (0.728)
Pine Nuts (47.4%)0.40 (0.530)1.07 (0.303)0.18 (0.673)1.25 (0.265)1.32 (0.252)3.99 (0.047) *1.62 (0.204)
Berries (38.0%)0.21 (0.647)5.76 (0.017) *7.34 (0.007) **24.92
(<0.001) ***
4.61 (0.033) *5.26 (0.023) *28.44
(<0.001) ***
Wild Animals (44.2%)0.01 (0.941)0.60 (0.438)6.77 (0.010) *8.34 (0.004) ***0.21 (0.650)7.23 (0.008) **4.39 (0.037) *
Food Crops (43.4%)0.05 (0.817)0.89 (0.345)0.00 (0.967)0.17 (0.684)0.01 (0.908)0.02 (0.880)0.25 (0.619)
Decorative Material for Craft (44.5%)0.38 (0.536)0.11 (0.746)2.41 (0.121)0.96 (0.329)0.30 (0.586)3.42 (0.066)1.82 (0.178)
Timber (44.5%)0.40 (0.527)0.16 (0.685)3.72 (0.055)4.32 (0.039) *1.57 (0.211)5.83 (0.016) *7.37 (0.007) **
Oils (38.0%)0.03 (0.872)0.20 (0.656)0.00 (0.961)2.00 (0.159)3.11 (0.079)2.27 (0.133)0.92 (0.338)
Wood (44.2%)4.85 (0.028) *2.30 (0.130)1.86 (0.173)0.03 (0.853)0.04 (0.834)1.45 (0.229)0.54 (0.464)
Honey (36.5%)0.15 (0.702)0.56 (0.454)1.12 (0.292)0.98 (0.322)1.91 (0.169)1.51 (0.221)0.73 (0.393)
* p < 0.05, ** p < 0.01, *** p < 0.001.
Table 5. Comparison of satisfaction with facilities and infrastructure, knowledge of land use changes, satisfaction with land resources, and perception of land use trade-offs across the production of vegetables.
Production of Vegetables
(% of Total Sample Size Engaged in a Certain Products)
Satisfaction with Level of Facilities and InfrastructureKnowledge of Land Use ChangesSatisfaction with Land ResourcesPerception of Land Use Trade-offs
Basic FacilitiesAdvanced FacilitiesNatural ResourcesArtificial ResourcesBarriersEconomic Benefits
MANOVA
F (p-Value)
Univariate ANOVA
F (p-Value)
MANOVA
F (p-Value)
MANOVA
F (p-Value)
Corrected Model2.86
(<0.001) ***
2.84
(<0.001) ***
1.89 (0.022) *1.35 (0.165)3.21
(<0.001) ***
1.94 (0.017) *2.05 (0.011) *
Intercept5986.82
(<0.001) ***
7712.75
(<0.001) ***
9144.35
(<0.001) ***
1705.35
(<0.001) ***
7948.99
(<0.001) ***
7223.58
(<0.001) ***
9117.96
(<0.001) ***
Zucchini (26.5%)0.17 (0.681)0.04 (0.851)2.39 (0.122)0.10 (0.755)0.02 (0.896)0.78 (0.376)1.66 (0.198)
Yellow Pumpkin (24.5%)2.15 (0.143)0.46 (0.499)0.10 (0.750)4.61 (0.032) *0.18 (0.671)0.00 (0.979)1.06 (0.302)
Lettuce (25.9%)0.24 (0.626)1.18 (0.277)0.52 (0.472)0.11 (0.743)0.03 (0.862)0.00 (0.953)1.51 (0.220)
Pepper (24.3%)0.13 (0.722)0.00 (0.949)0.03 (0.862)0.00 (0.980)4.81 (0.029) *4.71 (0.030) *0.11 (0.743)
Potato (30.1%)0.27 (0.602)3.73 (0.054)1.13 (0.288)0.04 (0.850)5.08 (0.025) *2.66 (0.103)1.06 (0.304)
Onion (34.8%)0.10 (0.750)0.51 (0.473)0.11 (0.742)3.18 (0.075)1.30 (0.255)0.42 (0.518)5.16 (0.023) *
Pumpkin (25.5%)3.76 (0.053)1.14 (0.286)0.25 (0.617)0.01 (0.908)1.67 (0.196)0.08 (0.783)1.49 (0.222)
Turnip (24.0%)0.03 (0.853)0.35 (0.556)2.42 (0.120)0.48 (0.490)0.07 (0.791)0.58 (0.449)0.00 (0.983)
Okra (32.0%)4.51 (0.034) *1.46 (0.227)4.02 (0.045) *0.71 (0.401)0.89 (0.346)5.29 (0.022) *4.01 (0.046) *
Garlic (29.1%)1.05 (0.305)0.46 (0.499)0.03 (0.855)0.72 (0.395)1.31 (0.253)0.15 (0.701)0.02 (0.878)
Eggplant (34.2%)1.31 (0.252)0.54 (0.463)9.30 (0.002) **0.13 (0.723)12.18 (0.001) ***1.77 (0.184)0.09 (0.752)
Carrot (30.1%)2.28 (0.131)3.63 (0.057)5.73 (0.017) *0.57 (0.450)8.02 (0.005) **1.46 (0.227)0.01 (0.914)
Watermelon (23.7%)3.25 (0.072)0.33 (0.566)0.67 (0.415)0.00 (0.983)1.26 (0.261)0.49 (0.486)0.00 (0.980)
Melon (24.7%)0.62 (0.431)0.04 (0.842)0.52 (0.472)0.44 (0.506)1.67 (0.196)0.00 (0.961)0.40 (0.527)
Cucumber (27.7%)7.42 (0.007) **5.66 (0.018) *0.12 (0.728)0.04 (0.851)9.07 (0.003) **3.24 (0.072)0.88 (0.347)
* p < 0.05, ** p < 0.01, *** p < 0.001.
Disclaimer/Publisher’s Note: The statements, opinions and data contained in all publications are solely those of the individual author(s) and contributor(s) and not of MDPI and/or the editor(s). MDPI and/or the editor(s) disclaim responsibility for any injury to people or property resulting from any ideas, methods, instructions or products referred to in the content.

