Article

Collaborative Governance of Stakeholders in the Payment for Forest Ecosystem Services: An SA-SNA-EGA Approach

1
School of Economics and Management, Beijing Forestry University, Beijing 100083, China
2
State Key Laboratory of Efficient Production of Forest Resources, Beijing 100083, China
*
Author to whom correspondence should be addressed.
Forests 2024, 15(10), 1806; https://doi.org/10.3390/f15101806
Submission received: 24 August 2024 / Revised: 2 October 2024 / Accepted: 14 October 2024 / Published: 15 October 2024
(This article belongs to the Section Forest Economics, Policy, and Social Science)

Abstract

Forests provide goods and services while maintaining ecological security. However, the market does not adequately reflect their economic benefits, posing a significant challenge to the Payments for Forest Ecosystem Services (PFES). The involvement of multiple stakeholders with varying responsibilities and interests complicates collaboration and hinders effective governance. This study proposes an integrated approach using stakeholder analysis, social network analysis, and evolutionary game analysis to explore the collaborative governance of stakeholders in PFES. Through field surveys, the study empirically investigates PFES in China, demonstrating the effectiveness of this integrated approach. The results indicate the following: (i) Stakeholders are classified into three categories; the key stakeholders include the central and local governments, forest managers, and paying users. (ii) Stakeholders still need to strengthen collaboration. Local governments, forest managers, their employees, and communities exert widespread influence; paying users and research institutions have high efficiency in resource sharing. (iii) Five evolutionarily stable strategies are observed at different stages. Government intervention is crucial for changing the stagnant state. Benefits and government incentives have a positive impact on stakeholder collaborative governance. The research findings offer theoretical insights to enhance stakeholder collaboration and promote the development of the PFES. Key strategies include addressing key stakeholders’ needs, diversifying incentives, and establishing an accessible information platform.

1. Introduction

Approximately 1.15 billion hectares of forests globally are primarily dedicated to producing timber and non-timber products, with more than 186 million hectares allocated for cultural services [1]. However, the economic benefits of these forests are significantly underestimated. Approximately 25% of the global population depends on forests for their livelihoods, and payments for ecosystem services are a crucial mean to enhance the economic benefits of forests and improve the economic conditions of those who rely on them [2]. Forests play a crucial role in ensuring ecological security, and preserving their ecological benefits is essential for effective forest management. Consequently, implementing Payments for Forest Ecosystem Services (PFES) presents greater challenges. PFES is a system where payments are made to providers to encourage the supply of ecosystem services [3,4,5,6].
International organizations and various countries have extensively explored approaches to the PFES. These include the United Nations’ clean development mechanism, the European Union’s carbon emissions trading system, the United States’ voluntary markets for wildlife habitat, Mexico’s payment for water conservation, and Costa Rica’s payments for environmental services [7,8]. As the fifth-largest country in terms of forest area, China has relatively recently initiated PFES. Since 2016, China has implemented a series of policies aimed at promoting PFES, shifting the management model from the polluter pays principle to the user pays principle [9,10]. Despite active pilot projects across various provinces, progress has been slow. The reform involves numerous stakeholders, with the government remaining the primary payer. Moreover, there is limited private capital investment and weak participation from market forces.
The public goods nature of forests makes it difficult to convert benefits within market mechanisms, leading to the “free rider” problem. To address this, Pigou [11] proposed government taxation and fiscal subsidies; Coase [12] advocated for optimal resource allocation through market transactions; Ostrom [13] observed that government and market interventions did not achieve the desired outcomes in the practice of natural resource management and proposed a third solution: polycentric self-governance. This theory reflects the underlying logic of stakeholder collaboration among the government, the market, and the public [14].
Stakeholders have an influence on organizational goals and are influenced by them [15]. In this study, collaborative governance is defined as the process through which stakeholders engage in effective cooperation and decision-making regarding PFES by sharing information and resources and coordinating their actions. Collaborative governance highlights the importance of participation and interaction among all stakeholders to effectively manage forest resource externalities through negotiation and cooperation [16]. However, in practice, stakeholders possess different resources and interests due to variations in their responsibilities. The government needs to balance the ecological, economic, and social benefits of forests; forest managers (FMs) focus on operational efficiency; and market participants seek to maximize corporate profits. These differing interests make close cooperation of stakeholders challenging. Therefore, systematically analyzing various stakeholders and addressing the issues caused by conflicting demands is crucial for strengthening collaborative governance in the PFES.
Previous research has laid the theoretical foundation for this study. Evaluating the economic value of forests and determining payment amounts for their use have been key areas of focus for scholars [17,18,19,20]. Guo et al. [21] and Liu et al. [22] examined the willingness of FMs to collect payments and the influencing factors through case studies. However, assessing the value of forests and constructing accounting systems are insufficient on their own. Incorporating human factors into resource management and designing policies can effectively address the challenges of forest valuation [23,24].
Zhu et al. [25], Sheng et al. [26], and Gao et al. [27] studied ecosystem and forest management models from the perspective of stakeholders, analyzing the conflicts among different stakeholders in governance. Evolutionary game analysis (EGA) has become an effective tool for scholars to address these issues [28,29]. Additionally, stakeholder analysis (SA) and social network analysis (SNA) have provided strong support for studying the importance and influence of stakeholders [30,31]. China’s PFES is in its early stages, with most research involving theoretical analysis and case studies to describe the current development status or using bibliometric methods to summarize the PFES research in China [32,33]. A systematic and comprehensive analysis of the mechanisms underlying stakeholder selection and decision-making in governance within the PFES has not yet been conducted.
To address existing research gaps, this study introduces an integrated SA-SNA-EGA approach, structured around the logical sequence of “identifying stakeholders, classifying them, exploring their relationships, and analyzing their behavioral games”. This approach aims to elucidate the complex stakeholder dynamics of the PFES. Specifically, SA analyzes the interests of stakeholders related to the PFES, SNA investigates the mutual influences among stakeholders, and EGA further reveals the collaborative equilibrium of key stakeholders at different stages of the PFES. This study seeks to clarify the roles and interactions of stakeholders in the collaborative governance of PFES. By doing so, it aims to enhance the effectiveness of stakeholder governance and facilitate their collaboration in promoting PFES initiatives.
The study focuses on solving the following questions: (i) identifying and classifying the PFES stakeholders to determine key stakeholders; (ii) exploring stakeholder relationships and roles within collaborative governance; and (iii) examining the behavioral evolution of key stakeholders, the evolutionarily stable strategy (ESS) of cooperation under various scenarios, and the influence of key parameters on this evolution. We specifically focus on the EGA of key stakeholders rather than all stakeholders to better understand the main forces driving the PFES. Since China’s PFES is still in its pilot stage and lacks defined policies and benefit distributions, a broad stakeholder analysis may overlook major conflicts and result in ineffective strategies.
This study contributes by (i) proposing an integrated method for studying stakeholder collaborative governance, SA-SNA-EGA, extending the research framework for systematic stakeholder analysis, and (ii) focusing on the PFES and thus providing a theoretical basis for China and other countries interested in PFES to coordinate stakeholders in jointly promoting PFES.

2. Materials and Methods

Based on survey and simulation data, this study investigated the collaborative mechanisms of stakeholders in the PFES using SA-SNA-EGA. Initially, stakeholder analysis was conducted. We surveyed scholars through semi-structured interviews and questionnaires to identify stakeholders. Using Mitchell’s score-based method, stakeholders were categorized, and priorities were determined. Subsequently, we used UCIENT 6.0 for SNA to visualize the relationships of stakeholders. Both overall and individual network analyses were employed to assess the significance and influence of these complex relationships. Finally, an evolutionary game model was developed to examine the behavioral interactions of key stakeholders with varying demands. Simulations using MATLAB 2021a illustrated the dynamic processes under different scenarios, demonstrating how stakeholders collaboratively govern PFES. The research framework is depicted in Figure 1.

2.1. Stakeholder Analysis (SA)

2.1.1. Semi-Structured Interviews and Questionnaires

This study began with preliminary field research involving China’s forestry regulatory agencies and FMs, selecting Guangxi Zhuang Autonomous Region and Fujian Province as the research areas due to their advancements in PFES. Through semi-structured interviews, we identified various stakeholders involved in PFES, establishing a practical foundation for stakeholder recognition. We then conducted literature reviews using databases such as Web of Science, CNKI, and Google Scholar to extract stakeholder information from previous PFES studies, further supporting our identification process. By integrating these findings, we developed comprehensive conclusions.
Building on the framework proposed by Heuninckx et al. [34], we categorized stakeholders in China’s PFES into two dimensions: direct and potential impacts. Direct stakeholders include the government, FMs who hold usage rights (such as state-owned forest farms or private forest owners), and enterprises or individuals (paying users) intending to pay for the forests. Potential stakeholders encompass consumers, FM employees, FM communities, environmental non-governmental organizations (NGOs), the public, research institutions, media, financial institutions, and future generations [35,36,37,38].
To ensure a comprehensive and objective sample, we employed a combination of stratified and purposive sampling methods. We invited 62 scholars from forestry regulatory agencies, including provincial and municipal bureaus such as the Beijing Municipal Forestry and Parks Bureau, Fujian Provincial Forestry Bureau, Guangxi Zhuang Autonomous Region Forestry Bureau, Nanning Forestry Bureau, and Sanming Forestry Bureau, as well as relevant universities like Beijing Forestry University and Northwest A&F University, to participate in semi-structured interviews and surveys. This approach ensured that the selected scholars had the necessary expertise and experience, enhancing the research’s validity.
The formal research process involved providing scholars with a summary list of direct and potential stakeholders and inviting them to respond based on the realities of China’s PFES. The questionnaire comprised three sections: the first aimed to exclude stakeholders with weak ties to PFES; the second assessed the legitimacy, power, and urgency of identified stakeholders; and the third evaluated the interrelationships among these stakeholders.

2.1.2. Mitchell’s Score-Based Method

Using Mitchell’s score-based method [39], stakeholders were assessed based on three dimensions: legitimacy, power, and urgency. This evaluation employed a 5-point Likert scale, with scores ranging from 1 to 5 [40]. Stakeholders scoring above 4 in two or more dimensions were classified as key stakeholders; those scoring between 3 and 4 in two or more dimensions were classified as expectant stakeholders; and those scoring between 1 and 3 in two or more dimensions were classified as latent stakeholders.

2.2. Social Network Analysis (SNA)

SNA coordinated organizational behavior and helped understand social phenomena through the network. An adjacency matrix was constructed to map the network, showing mutual influences among stakeholders. Overall network analysis, including network density and block modeling, was complemented by individual network analysis, which involved measuring centrality and analyzing core-periphery structures. This combined visual and quantitative approach facilitated a comprehensive exploration of stakeholder relationships in the PFES. For details, refer to Table 1.
D e n s i t y = M / N ( N 1 )
where N represented the number of stakeholders, and M represented the actual number of relationships among stakeholders.
D e g α = β n x α β ,   α β
where α and β were stakeholders, D e g α represented the degree centrality of α , and x α β indicated the connection between α and β . Degree centrality was divided into in-degree and out-degree. Due to the presence of stakeholders with the same in-degree values in this study, out-degree was chosen to clearly differentiate between stakeholders.
B e t α = β n γ n g β γ ( α ) / g β γ ,   β γ α ,   β < γ
where α , β , and γ were stakeholders, B e t α represented the betweenness centrality of α . g β γ ( α ) denoted the number of shortest paths between β and γ that passed through α , g β γ represented the total number of shortest paths between β and γ , and g β γ ( α ) / g β γ indicated the probability that α was on the shortest path between β and γ .
C l o α = 1 / β d α β
where α and β were stakeholders, C l o α represented the closeness centrality of α , and d α β denoted the shortest distance between α and β .

2.3. Evolutionary Game Analysis (EGA)

Using EGA, this study examined the behavioral strategies of key stakeholders to evaluate the long-term stability of the PFES and to optimize policy design for effective stakeholder collaboration. The process involved the following steps: (i) Constructed a cost-benefit system based on the behavioral strategies of key stakeholders under various scenarios to derive the payoff matrix. (ii) Calculated replicator dynamics function and equilibrium points. (iii) Assessed the stability of these equilibrium points. (iv) Conducted simulation analysis through numerical simulations to explore these dynamics.

3. Results

3.1. SA Results

Figure 2 displays the results of stakeholder identification. Local governments and FMs were universally selected, achieving a 100% selection rate. Other stakeholders, listed by descending selection rate, included the central government, paying users, FM employees, FM communities, the public, consumers, research institutions, environmental NGOs, and financial institutions. Media and future generations were excluded from further study due to selection rates below 10%.
Table 2 presents the results of Mitchell’s score-based method, with stakeholders represented as I–XI. The scores revealed significant differences among stakeholders: (i) Legitimacy: Stakeholders I (4.48), II (4.32), III (4.29), and IV (4.23) scored above 4. The remaining stakeholders were ranked VI, VII, IX, X, V, VIII, and XI. (ii) Power: Stakeholder I scored highest at 4.58, followed by II with 4.39 and III with 4.13. Stakeholders IV, VI, and IX scored above 3, while the remaining stakeholders scored below 3. (iii) Urgency: Stakeholders I, II, III, and IV scored above 4. According to Mitchell et al. [39], the classification was as follows: key stakeholders: I, II, III, IV; expectant stakeholders: VI, VII, IX; latent stakeholders: V, VIII, X, XI.

3.2. SNA Results

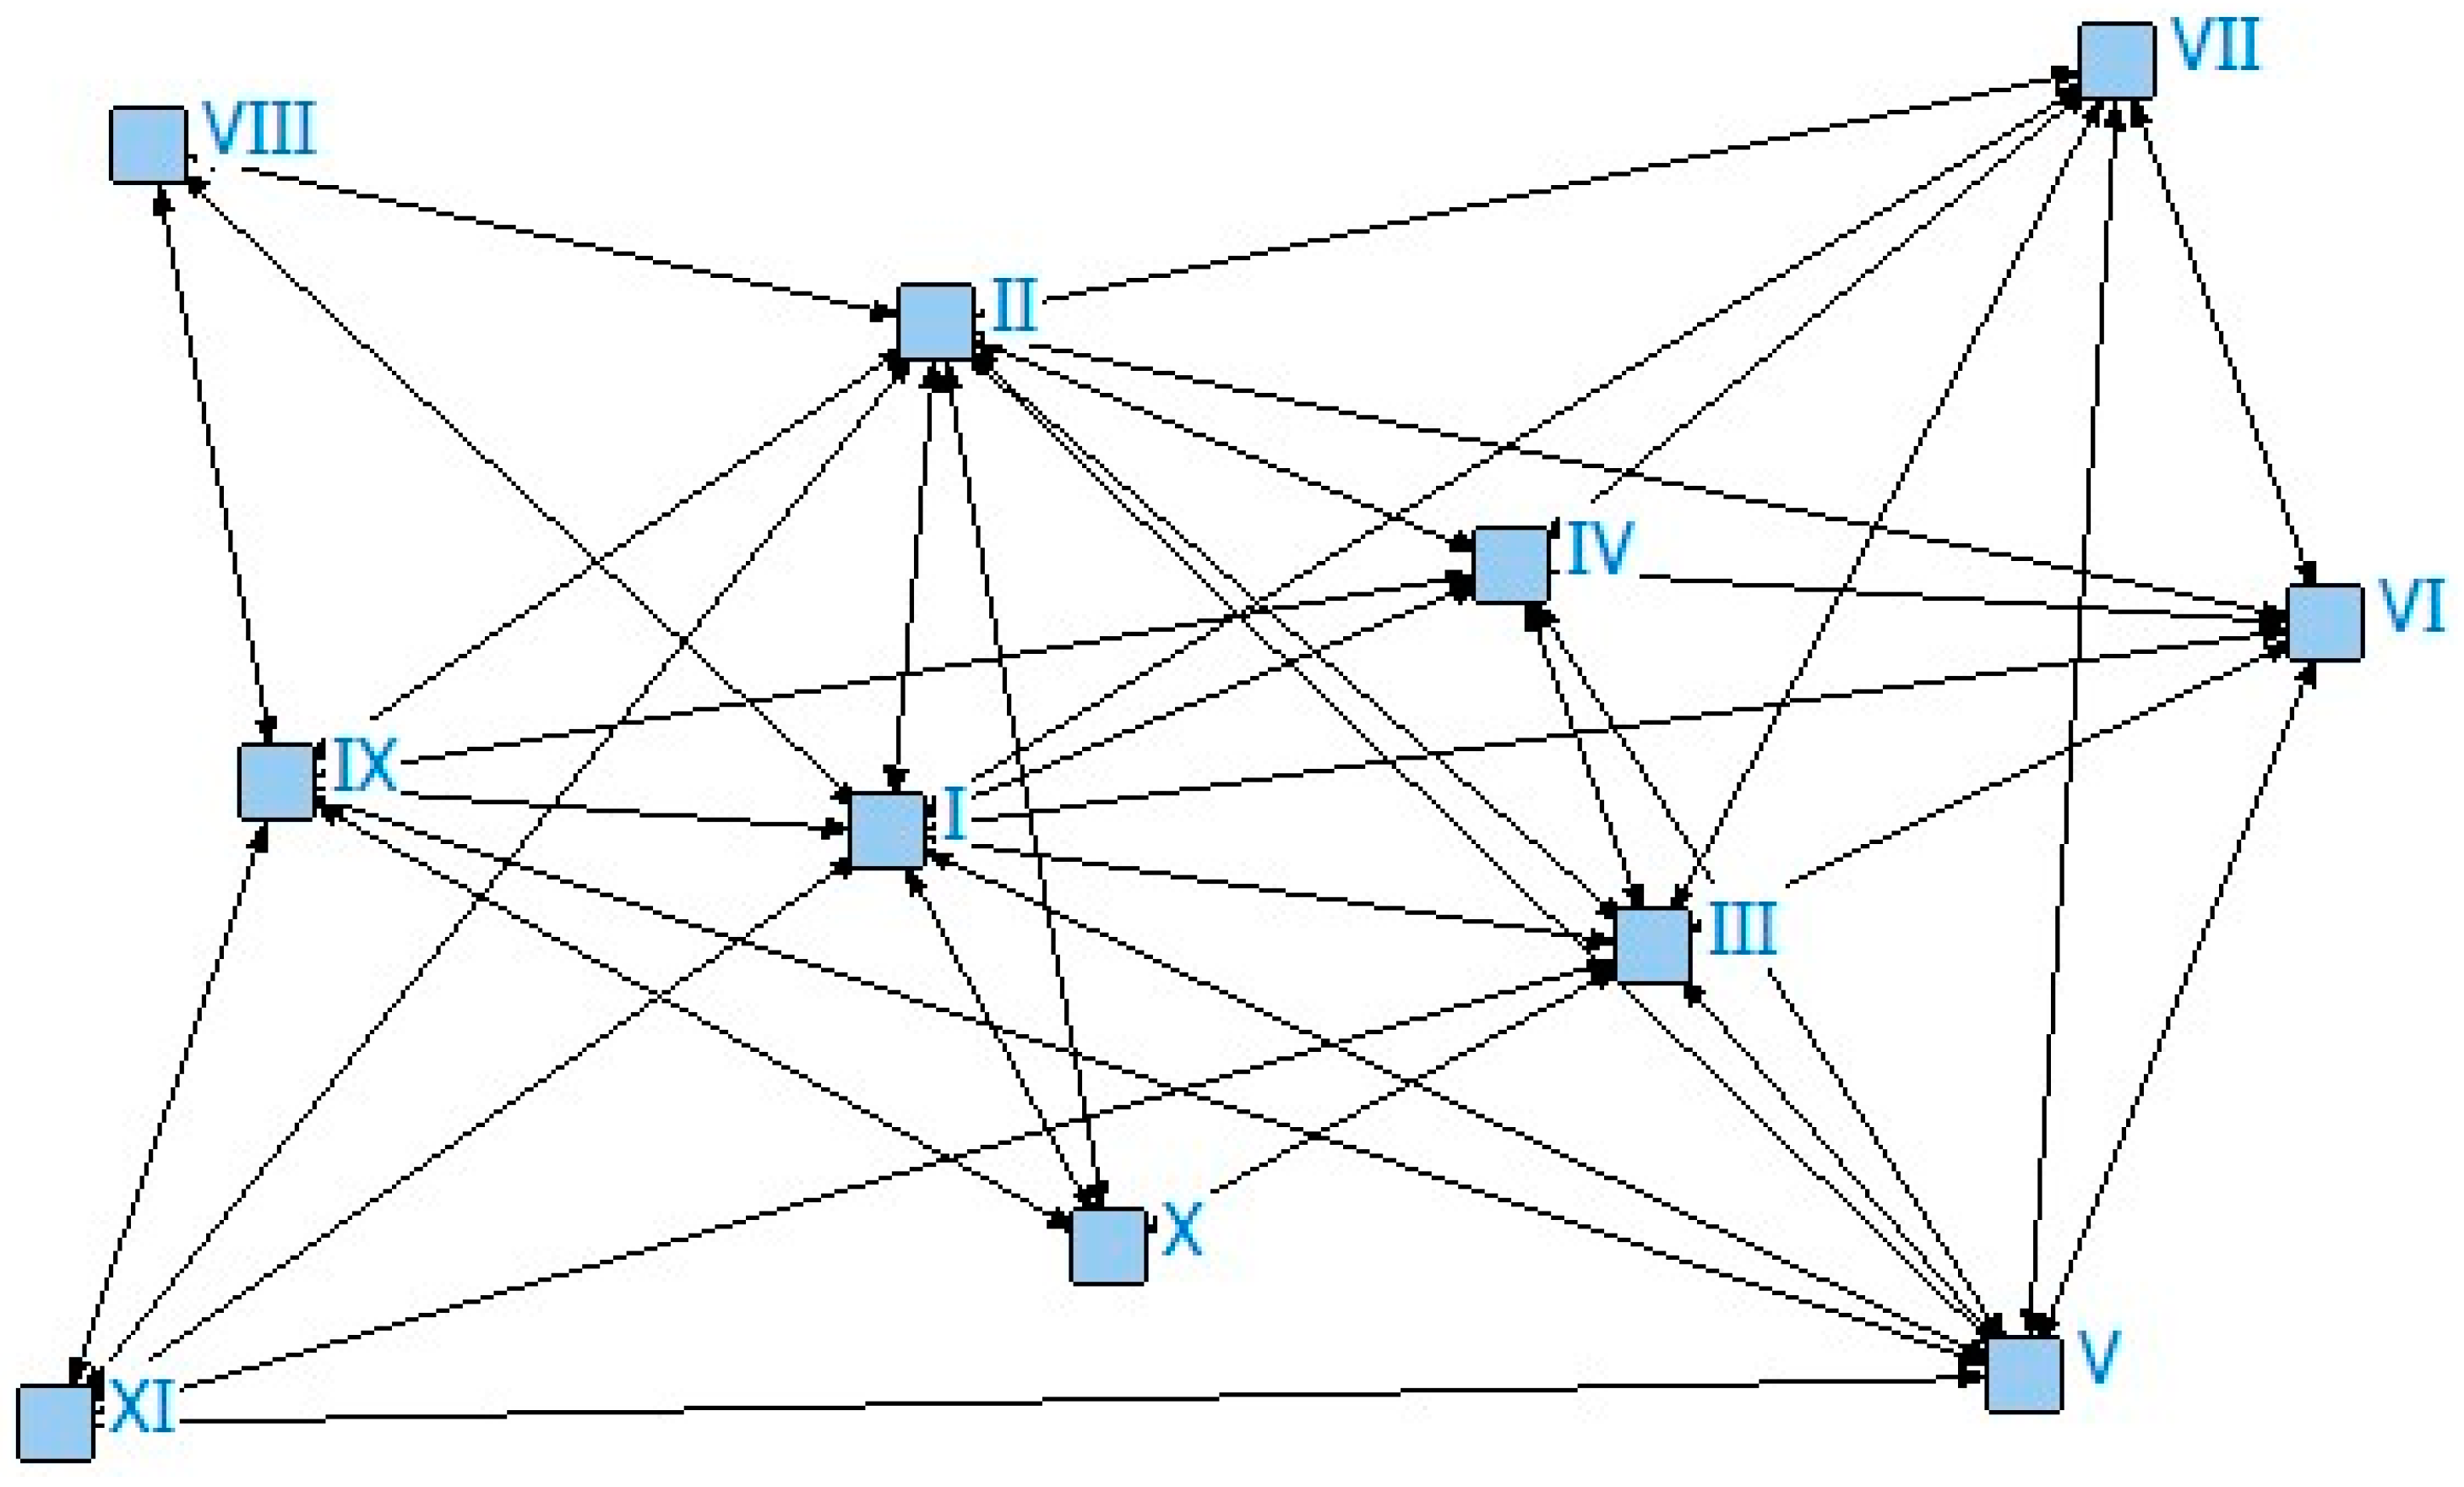
3.2.1. Social Network Graph

The results from the questionnaire were analyzed by assigning a value of 1 to stakeholders identified as influential by over 75% of experts and a value of 0 otherwise. This analysis produced the stakeholders’ adjacency matrix (Table A1). The matrix provided the basis for mapping the stakeholder network as well as for overall and individual network analyses.
The stakeholder social network graph was generated by importing the adjacency matrix into NetDraw 2.0, visually depicting the complex relationships of stakeholders (Figure 3). In this graph, each node represents an individual stakeholder, with the node positions indicating their significance within the network. Stakeholders I, II, III, and IV were centrally located with relatively dense connections. In contrast, stakeholders V, VI, VII, VIII, IX, and XI were positioned on the periphery, with VIII having the fewest connections.

3.2.2. Overall Network Analysis

Calculated using Formula (1), the network density was found to be 0.464. The block model was then applied to derive the blocked matrix and density matrix (Figure 4 and Table A2).
Figure 5 indicates that the PFES stakeholders were divided into four blocks: block 1: I, XI, and VIII; block 2: IX, V; block 3: II, III, VI, VII; block 4: IV, X. The goodness-of-fit test yielded a value of 0.653, indicating a good fit for this division. Density matrix values greater than the overall network density of 0.464 were recorded as 1, and those less as 0, resulting in the image matrix (Table A3). Based on this matrix, the simplified block transfer relationships are as follows: (i) block 3 transfers to block 4; (ii) block 4 transfers to blocks 2 and 3; (iii) block 1 transfers to block 2; and (iv) block 2 does not display transferability (Figure 5).

3.2.3. Individual Network Analysis

The centrality indicators are shown in Table 3. Stakeholders I and II had the highest degree centrality, each scoring 9, followed by stakeholder III with 8, and stakeholder IV with 6. Stakeholders VI and VII both had a degree centrality of 4, indicating considerable influence. The remaining stakeholders, ranked in descending order of degree centrality, were X, IX, XI, VIII, and V, suggesting comparatively weaker influence. Stakeholders I, II, III, and IV also topped the betweenness centrality rankings. In terms of closeness centrality, stakeholder I ranked highest, followed by II, III, IV, VI, VII, X, IX, VIII, V, and XI. The core-periphery structure analysis showed that stakeholders I, II, III, and IV were in the core class, while the other stakeholders were in the peripheral class (Figure 6).

3.3. EGA Results

3.3.1. Model Specifications and Payoff Matrix

Assumption 1: Based on the following reasons, the key stakeholders in the PFES included the government, FMs, and paying users, as illustrated in Figure 7.
Results from the SA and SNA revealed that stakeholders I, II, III, and IV, specifically, the central government, local governments, FMs, and paying users, were the key stakeholders in the PFES. As the PFES in China is still in the early stages of reform, the distribution of benefits among these entities is not yet clearly defined, which makes it challenging to differentiate their roles. Furthermore, China’s centralized government system means that local governments operate under the coordination of the central government. Consistent with previous research [44,45], the central and local governments were collectively referred to as “government”.
Assumption 2: The scenario assumed the existence of information asymmetry among the three stakeholders, where decision-making was bounded by rationality. Initially, identifying the optimal strategy was challenging, requiring gradual adjustments.
Assumption 3: Strategies and probabilities. The government’s strategy set included { G 1 , G 2 }, where G 1 denoted intervention in the PFES through incentives or penalties and G 2 denoted non-intervention. The government chose the probability of intervention as x ( x [ 0 , 1 ] ) and the probability of non-intervention as 1 − x . The FMs’ strategy set is { S 1 , S 2 }, with S 1 representing proactive management and S 2 representing superficial management. The probability of active management was y ( y [ 0 , 1 ] ), and the probability of superficial management was 1 − y . The paying users’ strategy set is { P 1 , P 2 }, where P 1 represented participation and P 2 represented non-participation. The probability of participation was z ( z [ 0 , 1 ] ), and the probability of non-participation was 1 − z . The game tree illustrating these strategy combinations is shown in Figure 8.
Assumption 4: Cost-benefit indicators were detailed in Table 4. Assuming all parameters were positive for general applicability, the costs and benefits of different strategy combinations were used to construct the payoff matrix for the three-party game (Table 5).

3.3.2. ESS Based on the Replicator Dynamics Function

Based on the research by Smith and Price [46], the expected profits U and the average profits U ¯ for the different strategies of key stakeholders were calculated using the payoff matrix. This analysis was used to construct the three-dimensional dynamic system of the PFES. U 1 x represented the expected profits of government intervention, U 1 1 x represented the expected profits of non-intervention, U ¯ 1 represented the average profits, and F x represented the replicator dynamics function for the government.
U 1 x = y z R 1 + R 2 C 1 C 2 + B 1 I 1 I 2 + K 1 + y 1 z R 1 + R 2 C 1 C 2 I 2 + 1 y z R 1 + R 2 C 1 C 2 I 1 + K 1 + K 2 + 1 y 1 z R 1 + R 2 C 1 C 2 + K 2
U 1 1 x = y z R 1 C 1 + B 1 + y 1 z R 1 C 1 + 1 y z R 1 C 1 + 1 y 1 z R 1 C 1
U ¯ 1 = x U 1 x + 1 x U 1 1 x
F x = d x / d t = x U 1 x U ¯ 1 = x ( 1 x ) ( z I 1 y I 2 + z K 1 y K 2 + K 2 + R 2 C 2 )
U 2 y represented the expected profits of active management by FMs, U 2 1 y represented the expected profits of superficial management, U ¯ 2 represented the average expected profits, and F y represented the replicator dynamics function for the FMs.
U 2 y = x z R 3 + R 4 C 3 C 4 + C 7 + B 2 + I 2 I 3 + x 1 z R 3 + R 4 C 3 C 4 + I 2 + 1 x z R 3 + R 4 C 3 C 4 + C 7 I 3 + 1 x 1 z R 3 + R 4 C 3 C 4
U 2 1 y = x z R 3 C 3 + C 7 + B 2 K 2 + x 1 z R 3 C 3 K 2 + 1 x z R 3 C 3 + C 7 + 1 x 1 z R 3 C 3
U ¯ 2 = y U 2 y + ( 1 y ) U 2 1 y
F y = d y / d t = y U 2 y U ¯ 2 = y 1 y x I 2 z I 3 + x K 2 + R 4 C 4
U 3 z represented the expected profits of paying users’ participation, U 3 1 z represented the expected profits of non-participation, U ¯ 3 represented the average expected profits, and F z represented the replicator dynamics function for the paying users.
U 3 z = x y R 5 + R 6 C 5 C 6 C 7 + B 3 + I 1 + I 3 K 1 + x 1 y R 5 + R 6 C 5 C 6 C 7 + I 1 K 1 + 1 x y R 5 + R 6 C 5 C 6 C 7 + I 3 + 1 x 1 y R 5 + R 6 C 5 C 6 C 7
U 3 1 z = x y R 5 C 5 + B 3 + x 1 y R 5 C 5 + 1 x y R 5 C 5 + 1 x 1 y R 5 C 5
U ¯ 3 = z U 3 z + 1 z U 3 1 z
F z = d z / d t = z U 3 z U ¯ 3 = z 1 z x I 1 + y I 3 x K 1 + R 6 C 6 C 7
The replication dynamics function of the whole system could be obtained as follows:
F x = x ( 1 x ) ( z I 1 y I 2 + z K 1 y K 2 + K 2 + R 2 C 2 ) F y = y ( 1 y ) ( x I 2 z I 3 + x K 2 + R 4 C 4 ) F z = z ( 1 z ) ( x I 1 + y I 3 x K 1 + R 6 C 6 C 7 )
Setting F x = 0 , F y = 0 , F z = 0 in Equation (17), we calculated nine local equilibrium points. These included eight pure strategy equilibrium points, E 1 (0,0,0), E 2 (0,0,1), E 3 (0,1,0), E 4 (1,0,0), E 5 (1,0,1), E 6 (1,1,0), E 7 (0,1,1), E 8 (1,1,1), as well as one mixed strategy equilibrium point, E 9 ( x * , y * , z * ) , where x * , y * , and z * lay between 0 and 1, representing non-zero and non-one solutions.

3.3.3. Analysis of the Stability of the Model

Using the Jacobian matrix to explore the stability of the equilibrium points [47], we substituted Equation (17) into Equation (18) and obtained the Jacobian matrix for this study, as shown in Equation (19). By substituting the equilibrium points, we derived the eigenvalues, which are presented in Table 6.
According to Lyapunov stability theory [48] and Friedman theory [49], an equilibrium point is asymptotically stable only if the real parts of its eigenvalues are less than zero. In such cases, the strategy constitutes an ESS; otherwise, the equilibrium point is unstable. E 9 ( x * , y * , z * ) was identified as a saddle point, with the sum of its eigenvalues being zero. As it failed to satisfy the condition of having all negative eigenvalues, it did not qualify as an ESS and was excluded from further discussion in Table 6.
J = F ( x ) / x F ( x ) / y F ( x ) / z F ( y ) / x F ( y ) / y F ( y ) / z F ( z ) / x F ( z ) / y F ( z ) / z
J = 1 2 x z I 1 y I 2 + z K 1 y K 2 + K 2 + R 2 C 2 x 1 x ( I 2 K 2 ) x 1 x I 1 + K 1 1 2 y y 1 y ( I 2 + K 2 ) ( x I 2 z I 3 + x K 2 + R 4 C 4 ) y 1 y I 3 1 2 z z 1 z I 1 K 1 z 1 z I 3 ( x I 1 + y I 3 x K 1 + R 6 C 6 C 7 )
Based on the current state of China’s PFES, the eigenvalue signs for E 1 through E 8 were analyzed (Table 7). Paying users involved in the PFES face significant initial capital investments. While long-term benefits from ecosystem services such as timber, water conservation, and eco-tourism can be substantial through marketization, the benefits may be delayed since China is still in the pilot phase. In the short term, without subsidies, the costs may outweigh the benefits. Thus, it was assumed that R 6 < C 6 C 7 . Similarly, incorporating natural resources into a public trading system is expected to yield economic benefits that surpass the costs. However, during the initial phase, the additional costs associated with active operations in FMs may exceed the additional economic benefits. Hence, it was assumed that R 4 < C 4 .

3.3.4. Numerical Simulation of the Evolutionary Game Model

This study used MATLAB 2021a to simulate five scenarios and analyze how benefits and government incentives influence the ESS of the PFES. The simulations analyzed the dynamic evolution of strategies among the three agents involved. Parameters for the simulations were derived from the PFES in China and relevant research [19,50].
The Impact of Benefits on the Evolution of Tripartite Behaviors
To analyze the impact of different benefits on the evolution of the game agents’ behaviors, simulations were conducted 50 times by adjusting R 2 , R 4 , and R 6 and starting from different initial probabilities (Figure 9). The first set of parameters used was K 1 = 2 , K 2 = 3 , C 2 = 12 , C 4 = 16 , C 6 = 16 , C 7 = 2 , I 1 = 3 , I 2 = 2 , and I 3 = 1 . The values assigned for each scenario were as follows: (i) Scenario 1: R 2 = 8 , R 4 = 10 , R 6 = 15 ; (ii) Scenario 2: R 2 = 16 , R 4 = 10 , R 6 = 15 ; (iii) Scenario 3: R 2 = 16 , R 4 = 10 , R 6 = 18 ; (iv) Scenario 4: R 2 = 16 , R 4 = 13 , R 6 = 15 ; (v) Scenario 5: R 2 = 16 , R 4 = 13 , R 6 = 18 . These simulations provided insights into how varying benefits influence the strategic behaviors of the key stakeholders in the PFES.
The Impact of Government Incentives on the Evolution of Tripartite Behaviors
This section examines the impact of government incentives on the behavior evolution of the three agents, focusing on scenarios where government incentives are greater than, equal to, or less than penalties. First, the effect of different government incentives on FMs was illustrated (Figure 10). The second set of parameters used was R 2 = 16 , R 4 = 13 , R 6 = 18 , C 2 = 10 , C 4 = 16 , C 6 = 16 , C 7 = 2 , I 1 = 3 , I 3 = 1 , K 1 = 2 , and K 2 = 3 . The values for I 2 were sequentially set to 5, 3, and 1, corresponding to I 2 > K 2 , I 2 = K 2 , and I 2 < K 2 , respectively.
Next, the impact of varying government incentives for paying users was examined (Figure 11). The third set of parameters used was R 2 = 16 , R 4 = 13 , R 6 = 18 , C 2 = 12 , C 4 = 16 , C 6 = 16 , C 7 = 2 , I 2 = 2 , I 3 = 1 , K 1 = 5 , and K 2 = 3 . The values for I 1 were sequentially set to 7, 5, and 3, corresponding to I 1 > K 1 , I 1 = K 1 , and I 1 < K 1 , respectively. By examining these scenarios, the study highlights how different government incentives influence the strategic behaviors of the agents in the PFES.

4. Discussion

4.1. Classification, Influence Relationships, and Roles of Stakeholders

Based on identifying stakeholders, this study used Mitchell’s score-based method to classify stakeholders and conduct the SA. Further, SNA was employed to map and examine the relationships and collaborative dynamics among the PFES stakeholders.
First, stakeholders were categorized into key, expectant, and latent groups. Key stakeholders include the central government, local governments, FMs, and paying users, all of whom had significant influence on the PFES. The central government influences PFES through policy-making and supervision. It can influence PFES through legal, political, and economic means. Local governments act as agents of the central government and execute these policies [51]. In China, except for the Northeast and Inner Mongolia National Forest Regions, PFES requires approval from local governments. FMs manage forests according to the law, participating in qualification evaluations, contract signing, and other activities. Paying users, as market participants, obtain the rights to forest land use and under-forestry planting upon signing contracts, and their demands influence the marketization process of forests. Thus, these four entities were identified as key stakeholders, aligning with the practical progress of PFES in China and supported by both regulations and literature [52,53].
Second, we mapped the stakeholder network and analyzed both the overall and individual networks. The overall network density is 0.464, indicating that while stakeholders are connected, the connections are loose, making consensus challenging. This underscores the necessity of studying stakeholder collaborative mechanisms.
The block model identified stakeholder roles and collaboration patterns. Stakeholders within the same block share similar roles and conflicts. Paying users and research institutions were grouped together, differing from Pelyukh et al. [54], likely due to differing classification criteria. We classified stakeholders based on their positions and connection patterns within the network. According to Burt [55], block 3 (local governments, FMs, FM employees, and FM communities) and block 4 (paying users and research institutions) have sending and receiving relationships; they exhibit higher density and frequent interactions. Block 3 functions as the “primary” actor, block 4 acts as a “broker” connecting network parts, and block 1 (central government, environmental NGOs, and financial institutions) serves as a “mediator” to resolve conflicts. Block 2 (consumers and the public) is more “peripheral” with fewer connections.
Local governments, FMs, and FM employees transmit information to the public and consumers through paying users and research institutions. Simultaneously, decisions made by the central government, financial institutions, and environmental NGOs directly influence public attitudes toward the PFES.
Third, individual network analysis shows that the central government, local governments, FMs, and paying users are the top four stakeholders in terms of degree centrality, reflecting their extensive cooperation and powerful influence on other stakeholders. Their betweenness centrality far exceeds that of the others, placing them at the center of the network. They act as bridges within the collaborative governance, highlighting their strong resource control in the PFES, and could access valuable resources through the shortest paths. Moreover, these four stakeholders also had high closeness centrality, followed closely by FM employees and communities. This indicated their strong ability to disseminate information and easily acquire and transfer resources. Efficient transmission is crucial for stakeholder collaboration, and policies should leverage their high transmission capacity to enhance cooperation.
Combining the relationship network diagram and core-periphery structure analysis, it is evident that the PFES stakeholders demonstrate a “core-periphery” structure. The central government, local governments, FMs, and paying users occupy the core area and markedly influence PFES. They hold advantageous positions in resource acquisition and information capture. This finding aligns with the classification of Mitchell’s score-based method, designating them as the key groups for PFES and highlighting their leading role in collaborative governance. The government should prioritize the interests of core-class stakeholders when developing policies, while also taking into account the concerns of peripheral-class stakeholders. Enhancing collaboration in governance could potentially motivate peripheral-class stakeholders to participate. Peripheral-class stakeholders have a lower impact on the network and are more susceptible to external influences in their decision-making. However, their views can cause a cascading effect on PFES. If their interests are compromised, there is a likelihood that they may shift from a dormant state to an active one, disrupting collaborative relationships. This is consistent with the findings of Kujala et al. [56].

4.2. Behavioral Evolution of Key Stakeholders

This study explored the evolutionary process of stakeholder behavioral strategies across various stages of PFES, identifying ESS within collaborative governance. It further examined how benefits and government incentives influence the behavioral evolution of the three involved parties. These insights contribute to a deeper understanding of stakeholder dynamics and collaborative mechanisms in the context of PFES.
First, the system reveals five ESSs, which we align with different stages of FMs based on the life cycle theory [57]. In the initial stage, corresponding to E 1 (0,0,0), the economic benefits of forests are minimal, leading the government, FMs, and paying users to make passive decisions, resulting in stagnation. In the middle stage, corresponding to E 4 (1,0,0), E 5 (1,0,1), and E 6 (1,1,0), the government intervenes, but the strategies of FMs and paying users vary depending on the scenario. Government intervention prompts favorable behavior from FMs or paying users. In the mature stage, corresponding to E 8 (1,1,1), an ideal state is reached where all three agents actively participate and cooperate. Currently, China’s PFES is transitioning from E 4 to E 5 and E 6 . The government has started to intervene, but due to information asymmetry, FMs and paying users are at a disadvantage and adopt passive strategies, unable to assess the PFES prospects.
Second, as the stakeholders’ benefits are adjusted, the ESS gradually shifts from inefficient to efficient stable states. Adjusting government benefits evolves the system towards E 4 (1,0,0), a low-efficiency state where the three parties do not cooperate and government intervention fails, wasting fiscal resources. Increasing the benefits for paying users evolves the system towards E 5 (1,0,1), and increasing the benefits for FMs evolves the system towards E 6 (1,1,0). In these two states, one party’s lack of proactiveness hinders the reform process. Increasing the benefits for all three parties evolves the system towards E 8 (1,1,1), an ideal state where they all engage in PFES, actively participating and collaboratively governing the PFES.
Third, to achieve the ideal state E 8 (1,1,1) in PFES, scientific incentives from the government are needed. If the government’s incentives for FMs are less than penalties, the system cannot converge to a stable state, resulting in government intervention failure. If incentives for paying users are less than the penalties, the system stabilizes at E 6 (1,1,0), where paying users choose not to participate. When government incentives for FMs or paying users are equal to or greater than penalties, the system evolves positively, converging to E 8 (1,1,1). As incentives increase, FMs are more likely to actively explore PFES, and paying users’ participation probability increases. Government incentives encourage social capital involvement in PFES, strengthening stakeholder collaboration. Among the five ESSs, except for the initial inefficient state, the remaining four ESSs all involve government intervention, indicating that without government intervention, the economic potential of forests cannot be fully realized.

4.3. Methodological Innovations

This study proposes the integrated “SA-SNA-EGA” approach to assess stakeholder collaborative governance, based on the logical framework of stakeholder “identification-classification-interrelationships-behavioral game”.
SA has become an essential tool in natural resource management, integrating human factors with natural sciences to enhance the efficiency of governance practices [58]. This method helps to clarify stakeholders’ roles, interests, and power dynamics. Reed et al. [59] outlined a progressive approach to studying stakeholders through description, categorization, and relationship analysis, emphasizing that recognizing and grouping stakeholders is crucial for understanding their collaborative dynamics in collective actions.
Researchers have expanded the scope of SA by combining it with other methodologies, thereby broadening the research framework on natural resource stakeholders [60,61]. For instance, Muchangos et al. [62] integrated SA with SNA to evaluate stakeholder engagement and interactions by constructing linked networks. Unlike SA, SNA employs quantitative metrics to analyze the relational networks of stakeholders and their influence on each other.
Understanding stakeholder roles and impacts is only the beginning; further insight into their governance decisions is crucial for studying collaborative mechanisms. Evolutionary game theory provides a theoretical foundation for this exploration. Zhao et al. [63] and Yuan and Li [64] developed multi-agent EGA to analyze collaborative behaviors among stakeholders. The combination of SNA and EGA offers robust support for studying stakeholder cooperation and decision-making, integrating quantitative analysis with mathematical modeling [65].
This study aimed to develop a comprehensive research framework for stakeholder collaboration, building on existing research to establish a chain of analysis from the initial identification of stakeholders to the final examination of their governance decisions. Reed et al. [59] and Zhou et al. [60] have substantially advanced this field. SA recognized and prioritized key stakeholders, SNA investigated the structure of stakeholder networks, and EGA determined optimal strategies for collaboration. By combining these approaches, this study provided clear and practical insights into stakeholder interactions and collaboration mechanisms.

4.4. Limitations

Firstly, the survey data were based on the PFES in China, and the research conclusions were drawn accordingly. As a result, the study may not fully capture long-term trends. The significance and influence of stakeholders within the network are changing; thus, collaboration will evolve with the reform of the PFES system. Additionally, the research may have been influenced by the respondents’ understanding and communication abilities. Despite efforts to ensure an objective sample, the exclusion of certain stakeholders could introduce some bias in the results. Future research should continue to examine stakeholder dynamics related to PFES and conduct new data surveys at subsequent stages to refine the research framework.
Moreover, in constructing the EGA, we combined the central and local governments into a single entity, as detailed in Section 3.3.1. However, as the economic benefits of forests become more apparent, conflicts between central and local governments are likely to increase, potentially leading to policies that clarify benefit distribution. Although we considered this issue when projecting future scenarios, the game model’s participants could not be modified during the simulation. Consequently, this model may not fully apply to stakeholder research once benefit distribution mechanisms are clarified. Future researchers should consider adjusting the model and participant selection according to different periods to better reflect the evolving collaborative governance of stakeholders.
Finally, this study explored the relationships and interactions among stakeholders involved in PFES within the framework of collaborative governance. While the role of government was considered, the impact of external factors, such as policy documents, was less emphasized. Since PFES is closely tied to institutional policies, future research should broaden its scope to examine the influence of these policies and guidelines, offering a more comprehensive understanding of the collaborative governance landscape.

5. Conclusions and Policy Implications

5.1. Conclusions

The integrated SA-SNA-EGA approach, utilizing both survey and simulation data, provides a comprehensive study of the stakeholder collaborative mechanism in China’s PFES from qualitative and quantitative perspectives. SA identified and classified the stakeholders in the PFES. SNA explored stakeholder relationships, their importance, and influence through overall and individual networks. EGA constructed models to analyze the ESS and the effects of government incentives on stakeholder behavior in various scenarios.
(i)
The study determines key stakeholders as the central government, local governments, FMs, and paying users. Expectant stakeholders include FM employees, FM communities, and the public, while latent stakeholders comprise consumers, environmental NGOs, research institutions, and financial institutions.
(ii)
Stakeholders are interconnected, but their ties remain weak, suggesting significant potential for future collaboration. Local governments, FMs, FM employees, and FM communities exert significant influence over other stakeholders’ decisions; paying users and research institutions act as intermediaries controlling information flow; and the central government, environmental NGOs, and financial institutions foster cooperation by resolving conflicts among stakeholders.
(iii)
Key stakeholders (central government, local governments, FMs, and paying users) rank highly in terms of degree centrality, betweenness centrality, and closeness centrality, reflecting their central role in the network. They maintain close relationships with other stakeholders and exhibit strong control and resource transmission capabilities. In contrast, research institutions, consumers, and other stakeholders are positioned on the periphery.
(iv)
There are five ESSs for key stakeholders in PFES governance: the initial stage (0,0,0), middle stage (1,0,0), (1,0,1), (1,1,0), and the mature stage (1,1,1). Government intervention is necessary to address stagnation in the initial stage. With government intervention, FMs actively manage, and paying users participate, leading to the ideal state of PFES.
(v)
The benefits and government incentives positively impact the collaborative stability of key stakeholders. As benefits increase, the likelihood of cooperation among government, FMs, and paying users rises, advancing the system toward the ideal state. When government incentives to FMs or paying users exceed penalties, key stakeholders are positively motivated to govern the PFES, accelerating the realization of economic benefits from forests.

5.2. Policy Implications

This study expands the application of stakeholder theory in the PFES and proposes a new approach to the study of stakeholder collaboration. Based on the main findings, the following implications are presented to support feasible government policy-making that coordinates stakeholders in promoting PFES, thereby facilitating a positive cycle of ecological protection and economic development in state forests.
(i)
Focus on the demands of key stakeholders. They have a dominant position in controlling resources and transmitting information. The government should take different guidance measures according to their different functions; give full play to their influence, communication, and control; and encourage the remaining stakeholders to actively participate.
(ii)
Diverse incentive measures should be adopted. In the initial stage of PFES, uncertain returns mean that government incentives play a crucial effect in enhancing stakeholder collaboration. According to the diverse interests of stakeholders, the government should adopt education and training, financial subsidies, tax breaks, and other forms of incentives, provide government commendation and financial support for FMs, and increase tax incentives for paying users.
(iii)
The government and FMs should jointly establish a public information platform to enhance communication and feedback mechanisms. Currently, paying users face delays in accessing market information, and public awareness of PFES remains low, limiting active cooperation among stakeholders. By setting up channels for transaction information, policy interpretation, and feedback through the platform, both online and offline, these efforts can reduce information asymmetry and promote greater transparency in transactions.

Author Contributions

Conceptualization, X.W.; methodology, X.W.; software, X.W.; validation, X.W., H.L. and W.C.; formal analysis, X.W.; investigation, X.W. and H.L.; resources, W.C.; data curation, H.L.; writing—original draft preparation, X.W.; writing—review and editing, X.W., H.L. and W.C.; visualization, X.W.; supervision, W.C.; project administration, W.C.; funding acquisition, W.C. All authors have read and agreed to the published version of the manuscript.

Funding

This research was funded by the Fundamental Research Funds for the Central Universities “Research on the Supply Capacity and Efficiency Measurement of Ecological Products in State owned Forest Farms under the Background of Carbon Peaking and Carbon Neutrality Strategy” (grant number 2023SKY01).

Data Availability Statement

The data used in this study cannot be made publicly available due to privacy restrictions imposed by the stakeholders.

Conflicts of Interest

The authors declare no conflicts of interest.

Appendix A

Table A1. The adjacency matrix of the PFES stakeholders’ influence.
IIIIIIIVVVIVIIVIIIIXXXI
I01111111101
II10111111101
III11011110011
IV01101110100
V00010000000
VI01110010000
VII01110100000
VIII10001000000
IX11000000001
X01100000100
XI00001000100
Table A2. The density matrix of the PFES stakeholders.
Block 1Block 2Block 3Block 4
Block 10.5000.8330.3330.167
Block 20.3330.0000.1250.250
Block 30.4170.3751.0000.625
Block 40.0000.7500.7500.000
Table A3. The image matrix of the PFES stakeholders.
Block 1Block 2Block 3Block 4EmissionInternality
Block 1110011
Block 2000000
Block 3001111
Block 4011020
Acceptance0211
Internality1010

References

  1. FAO. Global Forest Resources Assessment 2020—Main Report; FAO: Rome, Italy, 2020. [Google Scholar] [CrossRef]
  2. United Nations Department of Economic and Social Affairs. United Nations Strategic Plan for Forests, 2017–2030. 2017. Available online: https://www.un.org/esa/forests/wp-content/uploads/2016/12/UNSPF_AdvUnedited.pdf (accessed on 23 May 2024).
  3. Wunder, S. Payments for Environmental Services: Some Nuts and Bolts. Cifor Occas. Pap. 2005, 42, 1–32. [Google Scholar] [CrossRef]
  4. Do, T.H.; Vu, T.P.; Nguyen, V.T.; Catacutan, D. Payment for Forest Environmental Services in Vietnam: An Analysis of Buyers’ Perspectives and Willingness. Ecosyst. Serv. 2018, 32, 134–143. [Google Scholar] [CrossRef]
  5. Asbjornsen, H.; Wang, Y.; Ellison, D.; Ashcraft, C.M.; Atallah, S.S.; Jones, K.; Mayer, A.; Altamirano, M.; Yu, P. Multi-Targeted Payments for the Balanced Management of Hydrological and Other Forest Ecosystem Services. For. Ecol. Manag. 2022, 522, 120482. [Google Scholar] [CrossRef]
  6. Tacconi, L. Redefining Payments for Environmental Services. Ecol. Econ. 2012, 73, 29–36. [Google Scholar] [CrossRef]
  7. Von Thaden, J.; Manson, R.H.; Congalton, R.G.; López-Barrera, F.; Jones, K.W. Evaluating the Environmental Effectiveness of Payments for Hydrological Services in Veracruz, México: A Landscape Approach. Land Use Policy 2021, 100, 105055. [Google Scholar] [CrossRef]
  8. Frey, G.E.; Kallayanamitra, C.; Wilkens, P.; James, N.A. Payments for Forest-Based Ecosystem Services in the United States: Magnitudes and Trends. Ecosyst. Serv. 2021, 52, 101377. [Google Scholar] [CrossRef]
  9. Tian, M.; Zheng, Y.; Sun, X.; Zheng, H. A Research on Promoting Chemical Fertiliser Reduction for Sustainable Agriculture Purposes: Evolutionary Game Analyses Involving ‘Government, Farmers, and Consumers’. Ecol. Indic. 2022, 144, 109433. [Google Scholar] [CrossRef]
  10. Yu, H.; Xie, W.; Yang, L.; Du, A.; Almeida, C.M.V.B.; Wang, Y. From Payments for Ecosystem Services to Eco-Compensation: Conceptual Change or Paradigm Shift? Sci. Total Environ. 2020, 700, 134627. [Google Scholar] [CrossRef]
  11. Pigou, A.C. The Economics of Welfare; Macmillan and Co., Ltd.: London, UK, 1920. [Google Scholar]
  12. Coase, R.H. The Problem of Social Cost. J. Law Econ. 1960, 3, 1–44. [Google Scholar] [CrossRef]
  13. Ostrom, E. A General Framework for Analyzing Sustainability of Social-Ecological Systems. Science 2009, 325, 419–422. [Google Scholar] [CrossRef]
  14. McGinnis, M.D.; Ostrom, E. Reflections on Vincent Ostrom, Public Administration, and Polycentricity. Public Adm. Rev. 2012, 72, 15–25. [Google Scholar] [CrossRef]
  15. Freeman, R.E. Strategic Management: A Stakeholder Approach; Cambridge University Press: Cambridge, UK, 2015; ISBN 978-0-521-15174-0. [Google Scholar]
  16. Lukman, T.; Yahaya, A.-K.; N-yelkabo Tuu, G. External Stakeholders in the Collaborative Governance of Natural Resources in Ghana: Experiences from the Wa West District. Environ. Chall. 2023, 13, 100769. [Google Scholar] [CrossRef]
  17. Smajgl, A.; Xu, J.; Egan, S.; Yi, Z.-F.; Ward, J.; Su, Y. Assessing the Effectiveness of Payments for Ecosystem Services for Diversifying Rubber in Yunnan, China. Environ. Model. Softw. 2015, 69, 187–195. [Google Scholar] [CrossRef]
  18. Gao, X.; Zeng, S.; Shen, J.; Yang, X.; Kang, L.; Chi, C.; Song, R. Predicting Payment for Ecosystem Services Regarding Land Use: A Simulation Study in China. Environ. Impact Assess. Rev. 2023, 98, 106972. [Google Scholar] [CrossRef]
  19. Yang, W.; Liu, W.; Viña, A.; Luo, J.; He, G.; Ouyang, Z.; Zhang, H.; Liu, J. Performance and Prospects of Payments for Ecosystem Services Programs: Evidence from China. J. Environ. Manag. 2013, 127, 86–95. [Google Scholar] [CrossRef] [PubMed]
  20. Bitoun, R.E.; David, G.; Devillers, R. Strategic Use of Ecosystem Services and Co-Benefits for Sustainable Development Goals. Sustain. Dev. 2023, 31, 1296–1310. [Google Scholar] [CrossRef]
  21. Guo, T.; Wu, S.; Zhang, X.; Zhang, C.; Yang, J.; Cheng, S. Measurement and Influencing Factors of Willingness to Accept Payment for Ecosystem Service Provision: A Case Study of a Leading Forest Farm in China. Forests 2023, 14, 2417. [Google Scholar] [CrossRef]
  22. Liu, Z.; Feng, Z.; Chang, C. GEF Innovative Forest Management Plan—Taking Grassland Forest Farm in Fengning County as an Example. Sustainability 2022, 14, 7795. [Google Scholar] [CrossRef]
  23. Menzel, S.; Teng, J. Ecosystem Services as a Stakeholder-Driven Concept for Conservation Science. Conserv. Biol. 2010, 24, 907–909. [Google Scholar] [CrossRef]
  24. Liu, P.; Yin, R.; Zhao, M. Reformulating China’s Ecological Restoration Policies: What Can Be Learned from Comparing Chinese and American Experiences? For. Policy Econ. 2019, 98, 54–61. [Google Scholar] [CrossRef]
  25. Zhu, H.; Zhang, Y.; Chen, Y.; Zhao, M.; Bo, C. Constructing a Model of Government Purchasing of Ecological Services: Evidence from China’s Northeast Tiger and Leopard National Park. Land 2022, 11, 1737. [Google Scholar] [CrossRef]
  26. Sheng, J.; Wang, H. Community-Based Incentive Coordination in Payments for Ecosystem Services: China’s Wolong Nature Reserve. J. Environ. Plan. Manag. 2023, 1–25. [Google Scholar] [CrossRef]
  27. Gao, X.; Xu, W.; Hou, Y.; Ouyang, Z. Market-Based Instruments for Ecosystem Services: Framework and Case Study in Lishui City, China. Ecosyst. Health Sustain. 2020, 6, 1835445. [Google Scholar] [CrossRef]
  28. Coordes, R. Coordination of Forest Management through Market and Political Institutions. For. Policy Econ. 2016, 72, 66–77. [Google Scholar] [CrossRef]
  29. Mahdi, R.; Said, R.M.; Tasseda, B.; Margarida, C. A New Integrated Cooperative Game and Optimization Model for the Allocation of Forest Resources. Eur. J. Oper. Res. 2024, 316, 329–340. [Google Scholar] [CrossRef]
  30. Giordano, R.; Máñez Costa, M.; Pagano, A.; Mayor Rodriguez, B.; Zorrilla-Miras, P.; Gomez, E.; Lopez-Gunn, E. Combining Social Network Analysis and Agent-Based Model for Enabling Nature-Based Solution Implementation: The Case of Medina del Campo (Spain). Sci. Total Environ. 2021, 801, 149734. [Google Scholar] [CrossRef]
  31. Rahimi-Feyzabad, F.; Yazdanpanah, M.; Gholamrezai, S.; Ahmadvand, M. An Analysis of the Stakeholders of Groundwater Resources Management in Iran. Environ. Sci. Policy 2022, 136, 270–281. [Google Scholar] [CrossRef]
  32. Wei, X.; Liang, C.; Chen, W. Exploring Current Status and Evolutionary Trends on the Paid Use of State-Owned Forest Resources in China: A Bibliometric Perspective. Sustainability 2022, 14, 5516. [Google Scholar] [CrossRef]
  33. Li, T.; Cui, Y.; Liu, A. Spatiotemporal Dynamic Analysis of Forest Ecosystem Services Using “Big Data”: A Case Study of Anhui Province, Central-Eastern China. J. Clean. Prod. 2017, 142, 589–599. [Google Scholar] [CrossRef]
  34. Heuninckx, S.; Boveldt, G.T.; Macharis, C.; Coosemans, T. Stakeholder Objectives for Joining an Energy Community: Flemish Case Studies. Energy Policy 2022, 162, 112808. [Google Scholar] [CrossRef]
  35. Yiwen, Z.; Kant, S.; Vertinsky, I. Enhancing Stakeholder Engagement in Sustainable Forest Management: A Multi-Domain Comparative Analysis of Forest-Related Beliefs, Values, and Behaviors of Canadian Aboriginal and Non-Aboriginal Groups. Sustain. Dev. 2024, 32, 4202–4221. [Google Scholar] [CrossRef]
  36. Ba, F.; Liu, J.; Zhu, T.; Liu, Y.; Zhao, J. CDM Forest Carbon Sequestration Projects in Western China: An Analysis Using Actor-Centered Power Theory. For. Policy Econ. 2020, 115, 102139. [Google Scholar] [CrossRef]
  37. Başkent, E.Z.; Balci, H. A Priory Allocation of Ecosystem Services to Forest Stands in a Forest Management Context Considering Scientific Suitability, Stakeholder Engagement and Sustainability Concept with Multi-Criteria Decision Analysis (MCDA) Technique: A Case Study in Turkey. J. Environ. Manag. 2024, 369, 122230. [Google Scholar] [CrossRef] [PubMed]
  38. Long, K.; Wang, Y.; Zhao, Y.; Chen, L. Who Are the Stakeholders and How Do They Respond to a Local Government Payments for Ecosystem Services Program in a Developed Area: A Case Study from Suzhou, China. Habitat Int. 2015, 49, 1–9. [Google Scholar] [CrossRef]
  39. Mitchell, R.K.; Agle, B.R.; Wood, D.J. Toward a Theory of Stakeholder Identification and Salience: Defining the Principle of Who and What Really Counts. Acad. Manag. Rev. 1997, 22, 853–886. [Google Scholar] [CrossRef]
  40. Likert, R. A Technique for the Measurement of Attitudes. Arch. Psychol. 1932, 22, 55. [Google Scholar]
  41. White, H.C.; Boorman, S.A.; Breiger, R.L. Social Structure from Multiple Networks. I. Blockmodels of Roles and Positions. Am. J. Sociol. 1976, 81, 730–780. [Google Scholar] [CrossRef]
  42. Schoenfeld, M.; Pfeffer, J. Shortest Path-Based Centrality Metrics in Attributed Graphs with Node-Individual Context Constraints. Soc. Netw. 2021, 77, 93–103. [Google Scholar] [CrossRef]
  43. Bai, C.; Zhou, L.; Xia, M.; Feng, C. Analysis of the Spatial Association Network Structure of China’s Transportation Carbon Emissions and Its Driving Factors. J. Environ. Manag. 2020, 253, 109765. [Google Scholar] [CrossRef]
  44. Lu, C.; Liu, H.-C.; Tao, J.; Rong, K.; Hsieh, Y.-C. A Key Stakeholder-Based Financial Subsidy Stimulation for Chinese EV Industrialization: A System Dynamics Simulation. Technol. Forecast. Soc. Change 2017, 118, 1–14. [Google Scholar] [CrossRef]
  45. Onbhuddha, R.; Ogata, S. The Influence of Stakeholder on a Company’s Sustainable Practice: Insights from the Japanese Perspective. J. Clean. Prod. 2024, 436, 140402. [Google Scholar] [CrossRef]
  46. Smith, J.M.; Price, G.R. The Logic of Animal Conflict. Nature 1973, 246, 15–18. [Google Scholar] [CrossRef]
  47. Hofbauer, J.; Sigmund, K. Evolutionary Games and Population Dynamics; Cambridge University Press: Cambridge, UK, 1998. [Google Scholar]
  48. Lyapunov, A.M. The General Problem of the Stability of Motion. Int. J. Control 1992, 55, 531–534. [Google Scholar] [CrossRef]
  49. Friedman, D. Evolutionary Games in Economics. Econometrica 1991, 59, 637–666. [Google Scholar] [CrossRef]
  50. Zhao, J.; Liu, J.; Giessen, L. How China Adopted Eco-Friendly Forest Development: Lens of the Dual-Track Mechanism. For. Policy Econ. 2023, 149, 102931. [Google Scholar] [CrossRef]
  51. Fan, W.; Wang, S.; Gu, X.; Zhou, Z.; Zhao, Y.; Huo, W. Evolutionary Game Analysis on Industrial Pollution Control of Local Government in China. J. Environ. Manag. 2021, 298, 113499. [Google Scholar] [CrossRef]
  52. Paavola, J.; Hubacek, K. Ecosystem Services, Governance, and Stakeholder Participation: An Introduction. Ecol. Soc. 2013, 18, 42. [Google Scholar] [CrossRef]
  53. Bartczak, A.; Metelska-Szaniawska, K. Should We Pay, and to Whom, for Biodiversity Enhancement in Private Forests? An Empirical Study of Attitudes towards Payments for Forest Ecosystem Services in Poland. Land Use Policy 2015, 48, 261–269. [Google Scholar] [CrossRef]
  54. Pelyukh, O.; Lavnyy, V.; Paletto, A.; Troxler, D. Stakeholder Analysis in Sustainable Forest Management: An Application in the Yavoriv Region (Ukraine). For. Policy Econ. 2021, 131, 102561. [Google Scholar] [CrossRef]
  55. Burt, R.S. Positions in Networks. Soc. Forces 1976, 55, 93. [Google Scholar] [CrossRef]
  56. Kujala, J.; Heikkinen, A.; Lehtimäki, H. Understanding the Nature of Stakeholder Relationships: An Empirical Examination of a Conflict Situation. J. Bus Ethics 2012, 109, 53–65. [Google Scholar] [CrossRef]
  57. Baker, M.J. Product Life Cycles and Diffusion Theory. In Marketing New Industrial Products; Baker, M.J., Ed.; Macmillan Education: London, UK, 1975; pp. 24–47. ISBN 978-1-349-02122-2. [Google Scholar]
  58. Bois, A.S.; Boix, M.; Montastruc, L. Multi-Actor Integrated Modeling Approaches in the Context of Water-Energy-Food Nexus Systems: Review. Comput. Chem. Eng. 2024, 182, 108559. [Google Scholar] [CrossRef]
  59. Reed, M.S.; Graves, A.; Dandy, N.; Posthumus, H.; Hubacek, K.; Morris, J.; Prell, C.; Quinn, C.H.; Stringer, L.C. Who’s in and Why? A Typology of Stakeholder Analysis Methods for Natural Resource Management. J. Environ. Manag. 2009, 90, 1933–1949. [Google Scholar] [CrossRef] [PubMed]
  60. Zhou, J.-H.; Zhu, Y.-M.; He, L.; Mu, B.-X. Recognizing and Coordinating Multidimensional Dynamic Stakeholder Value Conflicts for Sustainability-Oriented Construction Land Reduction Projects in Shanghai, China: An Integrated SA-SNA-TRIZ Approach. J. Clean. Prod. 2022, 348, 131343. [Google Scholar] [CrossRef]
  61. Haji, L.; Hayati, D.; Rezaei-Moghaddam, K.; Ghanbarian, G.A. Toward Co-Management of Iran’s Rangelands: Combining Stakeholder Analysis and Social Networks Analysis. Glob. Ecol. Conserv. 2023, 46, e02572. [Google Scholar] [CrossRef]
  62. Dos Muchangos, L.S.; Tokai, A.; Hanashima, A. Stakeholder Analysis and Social Network Analysis to Evaluate the Stakeholders of a MSWM System—A Pilot Study of Maputo City. Environ. Dev. 2017, 24, 124–135. [Google Scholar] [CrossRef]
  63. Zhao, R.; Peng, L.; Zhao, Y.; Feng, Y. Coevolution Mechanisms of Stakeholder Strategies in the Green Building Technologies Innovation Ecosystem: An Evolutionary Game Theory Perspective. Environ. Impact Assess. Rev. 2024, 105, 107418. [Google Scholar] [CrossRef]
  64. Yuan, N.; Li, M. Research on Collaborative Innovation Behavior of Enterprise Innovation Ecosystem under Evolutionary Game. Technol. Forecast. Soc. Change 2024, 206, 123508. [Google Scholar] [CrossRef]
  65. Molinero, X.; Riquelme, F. Influence Decision Models: From Cooperative Game Theory to Social Network Analysis. Comput. Sci. Rev. 2021, 39, 100343. [Google Scholar] [CrossRef]
Figure 1. The research framework.
Forests 15 01806 g001
Figure 2. Selection rate of stakeholders in China’s PFES.
Forests 15 01806 g002
Figure 3. The influence network graph of the PFES stakeholders.
Forests 15 01806 g003
Figure 4. The blocked model of the PFES stakeholders.
Forests 15 01806 g004
Figure 5. The block model simplification diagram.
Forests 15 01806 g005
Figure 6. The core-periphery structure analysis results of the PFES stakeholders.
Forests 15 01806 g006
Figure 7. Game relationship of key stakeholders in the PFES.
Forests 15 01806 g007
Figure 8. The stakeholders game tree model.
Forests 15 01806 g008
Figure 9. The evolution process of the whole system: The colored lines typically represent the evolutionary trajectories of agents. (a) The evolution process of condition ①; (b) The evolution process of condition ②; (c) The evolution process of condition ③; (d) The evolution process of condition ④; (e) The evolution process of condition ⑤.
Forests 15 01806 g009
Figure 10. The impact of government incentives for FMs on the evolution of tripartite behaviors.
Forests 15 01806 g010
Figure 11. The impact of government incentives for paying users on the evolution of tripartite behaviors.
Forests 15 01806 g011
Table 1. SNA indicators of the PFES stakeholders.
IndicatorsRole in This StudyFormulae or Steps
Overall
network analysis
Network densityMeasure the overall network closeness of stakeholders.Formula (1)
Block modelSimplify the network to clarify the different functions and relationship conflicts of stakeholders within the overall network [41].Stakeholders were grouped into blocks, generating both a block matrix and a density matrix.
Individual network analysisCentrality analysisDegree
centrality
Evaluate the stakeholders’ status and their direct influence within the network.Formula (2)
Betweenness
centrality
Evaluate stakeholders’ intermediary roles and their control power within the network.Formula (3)
Closeness
centrality
Measure the efficiency and transitivity of stakeholders in sharing information and resources [42].Formula (4)
Core-
periphery structure analysis
Determine if a “core-periphery” structure exists among stakeholders and identify the dominant and marginalized stakeholders if present [43].Quantify the core area of stakeholders to identify the core and peripheral areas.
Table 2. Mitchell’s score-based method results for the PFES stakeholders.
CodeStakeholdersLegitimacyPowerUrgency
IThe central government4.484.584.06
IILocal governments4.324.394.13
IIIFMs4.294.134.23
IVPaying users4.233.684.13
VConsumers3.132.772.84
VIFM employees3.943.393.48
VIIFM communities3.652.943.16
VIIIEnvironmental NGOs2.972.842.68
IXThe public3.423.523.03
XResearch institutions3.232.972.74
XIFinancial institutions2.522.392.35
Table 3. The centrality analysis results for the PFES stakeholders.
CodeStakeholdersDegree CentralityCloseness CentralityBetweenness Centrality
IThe central government913.3790.91
IILocal governments918.5390.91
IIIFMs815.6783.33
IVPaying users612.2071.43
VConsumers12.8343.48
VIFM employees40.0062.50
VIIFM communities40.0062.50
VIIIEnvironmental NGOs20.0052.63
IXThe public37.6755.56
XScientific research institutions30.2058.82
XIFinancial institutions20.5341.67
Table 4. The cost-benefit system of key stakeholders.
Game AgentParameterMeanings
Government R 1 Benefits of non-intervention
C 1 Costs of non-intervention
R 2 Additional benefits of intervention (the portion of forest land rent and PFES benefits remitted to the government)
C 2 Additional costs for supervision and approval contracts of intervention
I 1 Financial subsidies and tax incentives for the participation of paying users
I 2 Financial subsidies and commendations for the active management of FMs
K 1 Penalties such as fines for paying users causing forest damage
K 2 Penalties such as fines and sanctions for superficial management of FMs
B 1 Additional benefits when FMs engage in active management and paying users participate
FMs R 3 Benefits of superficial management
C 3 Costs of superficial management
R 4 Additional benefits of active management (PFES benefits remitted to the FMs)
C 4 Additional costs for reviewing materials and the daily supervision of active management
I 3 Incentives such as technical support and empirical guidance for paying users of active management
B 2 Additional benefits when the government intervenes and paying users participate
Paying users R 5 Benefits of non-participation
C 5 Costs of non-participation
R 6 Additional benefits of participation
C 6 Additional operating costs of participation
C 7 Additional nurturing costs of forests
B 3 Additional benefits when the government intervenes and FMs engage in active management
Table 5. The payoff matrix of the evolutionary game model.
Selected StrategyPayoffs of GovernmentPayoffs of FMsPayoffs of Paying Users
G 1 , S 1 , P 1 R 1 + R 2 C 1 C 2 + B 1 I 1 I 2 + K 1 R 3 + R 4 C 3 C 4 + C 7 + B 2 + I 2 I 3 R 5 + R 6 C 5 C 6 C 7 + B 3 + I 1 + I 3 K 1
G 1 , S 1 , P 2 R 1 + R 2 C 1 C 2 I 2 R 3 + R 4 C 3 C 4 + I 2 R 5 C 5 + B 3
G 1 , S 2 , P 1 R 1 + R 2 C 1 C 2 I 1 + K 1 + K 2 R 3 C 3 + C 7 + B 2 K 2 R 5 + R 6 C 5 C 6 C 7 + I 1 K 1
G 1 , S 2 , P 2 R 1 + R 2 C 1 C 2 + K 2 R 3 C 3 K 2 R 5 C 5
G 2 , S 1 , P 1 R 1 C 1 + B 1 R 3 + R 4 C 3 C 4 + C 7 I 3 R 5 + R 6 C 5 C 6 C 7 + I 3
G 2 , S 1 , P 2 R 1 C 1 R 3 + R 4 C 3 C 4 R 5 C 5
G 2 , S 2 , P 1 R 1 C 1 R 3 C 3 + C 7 R 5 + R 6 C 5 C 6 C 7
G 2 , S 2 , P 2 R 1 C 1 R 3 C 3 R 5 C 5
Table 6. The eigenvalues of the Jacobian matrix.
Equilibrium Point λ 1 λ 2 λ 3
E 1 (0,0,0) K 2 + R 2 C 2 R 4 C 4 R 6 C 6 C 7
E 2 (0,0,1) I 1 + K 1 + K 2 + R 2 C 2 I 3 + R 4 C 4 R 6 + C 6 + C 7
E 3 (0,1,0) I 2 + R 2 C 2 R 4 + C 4 I 3 + R 6 C 6 C 7
E 4 (1,0,0) K 2 R 2 + C 2 I 2 + K 2 + R 4 C 4 I 1 K 1 + R 6 C 6 C 7
E 5 (1,0,1) I 1 K 1 K 2 R 2 + C 2 I 2 I 3 + K 2 + R 4 C 4 I 1 + K 1 R 6 + C 6 + C 7
E 6 (1,1,0) I 2 R 2 + C 2 I 2 K 2 R 4 + C 4 I 1 + I 3 K 1 + R 6 C 6 C 7
E 7 (0,1,1) I 1 I 2 + K 1 + R 2 C 2 I 3 R 4 + C 4 I 3 R 6 + C 6 + C 7
E 8 (1,1,1) I 1 + I 2 K 1 R 2 + C 2 I 2 + I 3 K 2 R 4 + C 4 I 1 I 3 + K 1 R 6 + C 6 + C 7
Table 7. Analysis of partial stability.
Equilibrium PointSign of λ 1 Sign of λ 2 Sign of λ 3 Status
E 1 (0,0,0) * ESS (①)
E 2 (0,0,1) * + Unstable
E 3 (0,1,0) * + * Unstable
E 4 (1,0,0) * * * ESS (②)
E 5 (1,0,1) * * ESS (③)
E 6 (1,1,0) * * * ESS (④)
E 7 (0,1,1) * + * Unstable
E 8 (1,1,1) * * * ESS (⑤)
Note: “ * ” represents an undetermined symbol; Condition ①: K 2 + R 2 < C 2 ; Condition ②: K 2 + R 2 > C 2 , R 4 + I 2 < C 4 K 2 , R 6 + I 1 < C 6 + C 7 + K 1 ; Condition ③: R 2 + K 1 + K 2 > C 2 + I 1 ,   R 4 + I 2 < C 4 + I 3 K 2 , R 6 + I 1 > C 6 + C 7 + K 1 ; Condition ④: R 2 > C 2 + I 2 ,   R 4 + I 2 > C 4 K 2 ,   R 6 + I 1 + I 3 < C 6 + C 7 + K 1 ; Condition ⑤: R 2 + K 1 > C 2 + I 1 + I 2 ,   R 4 + I 2 > C 4 + I 3 K 2 ,   R 6 + I 1 + I 3 > C 6 + C 7 + K 1 .
Disclaimer/Publisher’s Note: The statements, opinions and data contained in all publications are solely those of the individual author(s) and contributor(s) and not of MDPI and/or the editor(s). MDPI and/or the editor(s) disclaim responsibility for any injury to people or property resulting from any ideas, methods, instructions or products referred to in the content.

