Article

Investigating the Impact of Garden Plant Smellscapes on Human Well-Being: A Case Study of Pine Forests

1
School of Landscape Architecture, Beijing Forestry University, Beijing 100083, China
2
College of Landscape Architecture and Art, Northwest Agriculture & Forestry University, Yangling District, Xianyang 712100, China
*
Author to whom correspondence should be addressed.
Forests 2024, 15(10), 1794; https://doi.org/10.3390/f15101794
Submission received: 2 August 2024 / Revised: 26 September 2024 / Accepted: 6 October 2024 / Published: 12 October 2024
(This article belongs to the Section Urban Forestry)

Abstract

:
The smellscape of garden plants plays a crucial role in promoting human well-being. Despite this, empirical data on the specific effects of distinct stimulation methods on public health remain insufficient. The objective of this research is to investigate the influence of three distinct sensory modalities, olfactory, visual, and their combined effect, on both physiological and psychological reactions to a pine forest’s smellscape. A sample of 95 college students was selected, with data collected through both physiological and psychological measurements. The analysis focused on variables such as blood pressure (BP), pulse rate (P), pulse pressure (PP), skin conductance (SC), brainwave patterns (α, β), the odor emotion semantic differential (SD), and the State Anxiety Inventory (S-AI) scale. The results reveal that in the pine forest aroma environment, the central nervous system shows a compromise effect during olfactory–visual interaction, with greater autonomic nervous system (ANS) activation compared with either stimulus alone, suggesting cumulative effects. Psychologically, the influence of olfactory interaction on anxiety fell between that of visual and olfactory stimulation. Participants consistently reported that the combination of both the sight and scent of a pine forest was the most invigorating. Furthermore, research revealed that combining olfactory and visual stimuli led to a more profound amplification of positive environmental perceptions compared with when each sense was engaged individually. These findings lay the groundwork for understanding how garden plant aromas contribute to human well-being.

1. Introduction

In an era marked by rapid urbanization and increasing societal pressures, individuals are experiencing heightened health concerns [1]. Following the recent epidemic, public health has received significant attention on a global scale [2]. Consequently, there is a growing interest in research focused on reducing stress and promoting relaxation through the improvement of living environments.

1.1. Garden Plants and Their Connections to Human Health

The significance of urban green spaces in fostering well-being has been widely acknowledged, particularly for their pivotal contribution to health enhancement. Garden plants play a pivotal role by purifying the air, absorbing carbon dioxide, and releasing bactericidal agents, which increase negative ion levels [3,4]. These environmental benefits—such as detoxification, environmental monitoring, regulation of temperature and humidity, noise reduction, radiation mitigation, sewage purification, soil preservation, and dust control—are closely linked to improvements in physiological health. Additionally, the arrangement of plants [5], color schemes [6,7,8], plant community types [9,10], and spatial design [11,12] elicit emotional and psychological responses, often promoting emotional well-being and mental restoration.

1.2. Health Benefits of Aromas in Garden Plants

From the late 1990s through the early 21st century, there has been a growing interest in aromatherapy as olfactory research gained recognition [13]. Empirical evidence suggests that plant scents possess therapeutic properties, functioning as natural agents for improving health. These fragrances have been shown to influence mood and memory, alleviating anxiety, depression, and memory decline in Alzheimer’s patients [14,15], as well as reducing agitation and aggression while enhancing mood [16]. Modern scientific studies emphasize the role of aromatic compounds such as terpenoids, esters, and phenolic compounds in shaping the intensity and therapeutic effects of essential oils. For example, rosemary and lemongrass are known for their nervine regulatory and antidepressant effects [17], while geranium, lavender, and violet scents act as natural sleep aids, relieving insomnia and stress [18]. Additionally, the volatiles from pine, cypress, and camphor have invigorating effects, providing cognitive stimulation and circulatory benefits [19]. The aroma of Abies holophylla Max. has been found to positively influence the autonomic nervous system, lower blood pressure, improve heart rate variability, and enhance vascular health, contributing to stress relief and vasodilation [20].

1.3. The Concept and Characteristics of a Smellscape

The term “smellscape” was first introduced by the environmentalist Porteous [21], sparking increased scholarly interest in the olfactory dimensions of landscape quality. It is crucial to distinguish between odor and the broader concept of a “smellscape”, particularly when considering the spatial environments. Olfactory perception plays a multifaceted role in how humans interact with space, memory, and experience, helping to create unique spatiotemporal realms [22,23]. Smellscapes possess distinct characteristics in environmental aesthetics, such as their spatiotemporal nature [24,25], their ability to guide perception [26,27,28], their inherent inevitability [29], their polyphonic complexity [30,31,32], their emotional depth [33,34,35], the persistence of smell-related memories [36,37,38,39,40], and preferences based on scent concentration [41,42,43]. Moreover, smellscapes often integrate with other sensory inputs, particularly vision [44,45,46,47], and hold both aesthetic and cultural significance.

1.4. An Overview of Human Olfactory Perception Assessment Methodologies

Odors are the fundamental elements of olfaction. The identification of odors is determined by their chemical composition, while the perception of odor—encompassing intensity and hedonic value—relates to olfactory quality, which is influenced by the characteristics of the odor and an individual’s olfactory capabilities [23]. However, our understanding of the olfactory system’s processing mechanisms remains limited, and the integration of olfaction with multisensory information from other senses is still in its early stages [48].
Psychological studies suggest that scents often evoke vivid images in the brain, reviving memories of specific times, events, places, or sensations, fostering associations that may be either pleasant or unpleasant, enriching cognitive input [49].
Currently, the assessment of human olfactory perception primarily relies on psychophysical testing methods. This concept originated from the works of pioneers such as Weber, Fechner, Thurstone [50], Peryam et al. [51], and Stevens [52]. In the interdisciplinary field of olfaction and psychology, these tests quantify sensory perception through verbal or conscious responses from participants. Key components of psychophysical assessments include measuring basic olfactory sensitivity and threshold odor detection [53]. Historically, olfactory pleasantness rating scales date back to ancient times [54], with the earliest use of pleasant–unpleasant scales in olfactory studies being attributed to Young [55], who used a 7-point scale ranging from −3 (extremely unpleasant) to +3 (extremely pleasant) to assess hedonic responses over time. The two most commonly used scales for subjective odor evaluations are category scales and linear scales [50,51]. In contemporary studies of plant odors and human perception, emotion-based odor rating scales, largely derived from these traditional scales, are widely used [42,53], with category scales being the most prevalent.

1.5. An Overview of Smellscape Evaluation Methods

As the concept of smellscapes inherently revolves around an “atmosphere of scents”, the perceptual aspect is central to smellscape research [21,22,56]. Consequently, studies on smellscapes focus heavily on the human relationship with scent environments. By the late 1980s, the field began shifting from mechanical “artificial nose” methods to public evaluation and olfactory assessments. There are three primary methodologies for investigating smellscapes: subjective evaluation, physiological measurement, and psychological measurement. Among these, subjective evaluation and physiological feedback methods are the most commonly used.
Subjective evaluation methods generally involve assessing olfactory environments through various techniques, such as scent surveys and mapping of built spaces. These methods often include “smell walks” (similar to soundwalks), distributing online questionnaires to the general population (preferably excluding locals with established olfactory biases [21]), conducting interviews, or relying on expert panels for evaluation. These approaches gather data on urban or regional atmospheric scents.
Physiological measurement methods are widely used in the study of “Human–Natural Environment Relationships” [57], predominantly through laboratory-based investigations. These techniques generally fall into three main categories: autonomic nervous system (ANS) indices, central nervous system (CNS) markers, and biomarkers reflecting stress responses. The ANS, alternatively referred to as the autonomic or unconscious nervous system, functions independently and beyond conscious command [58,59]. Its responses reflect psychological factors like emotions, motivation, attention, preferences, and physical movement, primarily managed by the sympathetic nervous system (SNS) and the parasympathetic nervous system (PNS) [60]. Common ANS indicators include blood pressure (SBP, DBP), pulse rate (P) [61], oxygenated hemoglobin concentration in the prefrontal cortex (oxy-Hb) [62], heart rate variability (HRV) [59,62,63], flow-mediated dilation (FMD) [20,62], skin conductance (SC), and skin temperature (ST). The CNS, comprising the spinal cord and brain, is crucial for human behavioral patterns and sensory functions, including hearing, taste, smell, sensation, and sight. It also controls fine motor skills, particularly in the hands, feet, and face [64,65]. Measures related to the CNS include electroencephalography (EEG) recordings for brainwave analysis [66], cerebral blood flow dynamics assessed through changes in hemoglobin concentration [63], brain region activation via functional magnetic resonance imaging (fMRI) or near-infrared spectroscopy (NIRS) [46,67,68,69], and electromyography (EMG) for muscle activity analysis [70]. Biomarkers commonly studied in the context of human–environment interactions include salivary alpha-amylase activity [71], salivary cortisol concentration [63], and salivary secretory immunoglobulin A (IgA) levels [63].
Psychometric methods are frequently used in studies exploring the relationship between humans and the natural environment. Utilizing specialized psychological assessment tools, these methodologies aim to systematically analyze and interpret psychological and social dynamics within groups or solitary individuals, employing quantitative analysis to derive insights from observed phenomena [72]. In the context of smellscape assessments, commonly used psychological scales include the Profile of Mood States (POMS) [61,63,73,74], the State–Trait Anxiety Inventory (STAI) [75], the Geneva Emotion and Odor Scale (GEOS), and the Aroma Sentiment Difference (SD) scale [23,62,76,77,78,79,80,81,82,83].

1.6. A Review of the Impact of Garden Plant Smellscapes on Human Health

The influence of garden plant aromas on human health is increasingly attracting research attention, although the number of related studies remains limited and largely focuses on the impacts of specific plant odors or essential oils on physiological or psychological aspects of humans. These studies, while fragmentary, demonstrate the relationship between olfaction and human health, particularly emphasizing preferences for different scent types in landscape settings. Current research primarily employs methods such as physiological measurement, psychological assessment, or a combination of both, aiming to understand how odor factors in landscape plant aromas influence human health [80].
However, current research faces several limitations. Many studies only partially represent smellscapes, often neglecting the interactive nature of olfaction with other senses, such as vision. Additionally, methodological challenges persist, including inconsistent stimulus durations [20,48,62,66,79,81,82,83], varied odor delivery devices [20,46,62,66,73,74,75,76,77,78,79,81,82,83,84,85,86,87,88,89,90], and singular approaches to stimulation [45,46,79,83,91,92]. These issues highlight the need for further investigation to address these inconsistencies and improve the understanding of olfactory interactions and their effects on health.

1.7. The Purpose and Significance of the Research

As research into smellscapes and garden plant wellness expands and interdisciplinary approaches emerge, the impact of garden plant smellscapes on human health is gaining increasing attention. Despite this growing interest, the field remains in its early stages, necessitating a deeper understanding of smellscape characteristics and a more thorough exploration of research methodologies. Current studies mainly focus on the direct effects of plant odors on human health, often neglecting the broader aspects of smellscapes.
A smellscape represents an “environmental aroma” perceived by humans, where garden plant scents influence visitors’ physiological and mental well-being through sensory stimulation and interact with other senses. A comprehensive, multidimensional sensory approach is essential to fully understand the health benefits of garden plant smellscapes.
The objective of this research is to examine the effects of common garden plant smellscapes on human health by employing college students with normal olfactory capabilities as subjects. By measuring the physiological and psychological effects of the pine smellscape—a prevalent garden plant—under various stimulation conditions, this research seeks to provide insights into how garden plant smellscapes affect human health from an interdisciplinary sensory interaction perspective. The goal is to contribute a theoretical foundation to the study of garden plant smellscapes and their health benefits.

2. Materials and Methods

2.1. Research Design

This research is divided into three main sections:
  • Impact of plant fragrances on human well-being: The first section explores the effect of pine scent on human physiological and psychological well-being. This experiment simulates the influence of pine aroma, common in garden settings, on various physiological and psychological indicators.
  • Influence of visual landscapes: The second section examines the impact of visual landscapes associated with the scent of pine trees. The experimental materials consist of visual images depicting pine tree environments, used to simulate the effects of visual stimuli associated with the aroma of pine trees on various physiological and psychological indicators.
  • The combined impact of scent and visual stimulation: This section explores the interactive effects of fragrance from landscape plants with visual stimuli. The experiment simulates the influence of the scent of pine tree and the visual scene of a pine forest on physiological and psychological indicators of the human body.
The research focuses on three distinct stimulus categories: olfaction, vision, and their combined effects. Physiological and psychological metrics are used as outcome variables to capture responses to these stimuli, aiming to compare and clarify the differential impacts on human well-being from plant aromas, their corresponding visual landscapes, and the synergistic effects of their combined stimulation.

2.2. Test Site

The experiment was conducted in a VR laboratory with the following specifications: the indoor dimensions of the lab were 4 m in length, 3 m in width, and 3.1 m in height, providing a total area of 12 square meters (Figure 1). To minimize external influences on the subjects’ mood, the room’s ambient lighting was controlled to 300 Lux, with sound levels maintained at 45 ± 5 dB. Environmental conditions were controlled to an optimal range with a temperature maintained at 25 degrees Celsius, precise within a margin of plus or minus 2 degrees, and a relative humidity of 55%, also fluctuating within a 5% tolerance. In the laboratory, the brainwave tester and multiparameter biofeedback instrument were positioned behind the subjects’ chairs. A white wall was situated opposite the chairs to prevent unnecessary visual distractions. To maintain consistency in experimental conditions, doors and windows were closed throughout the experiment.

2.3. Subjects

A total of 95 undergraduate and postgraduate students, aged between 18 and 26, participated in this study. Recruitment was conducted through the campus network. Preliminary interviews were used to screen out volunteers with rhinitis or olfactory disorders, and individuals with colds were excluded from the study. Individuals possessing color vision deficiencies, as determined through the utilization of the updated Fifth Edition Color Blindness Test Map, were not included in this study. Individuals were mandated to have obtained adequate rest prior to the examination, abstain from smoking and alcohol, and avoid using strong perfumes or cosmetics on the day of the experiment. All subjects were briefed on the experimental process and provided their consent prior to participation.

2.4. Research Methods and Test Materials Collection

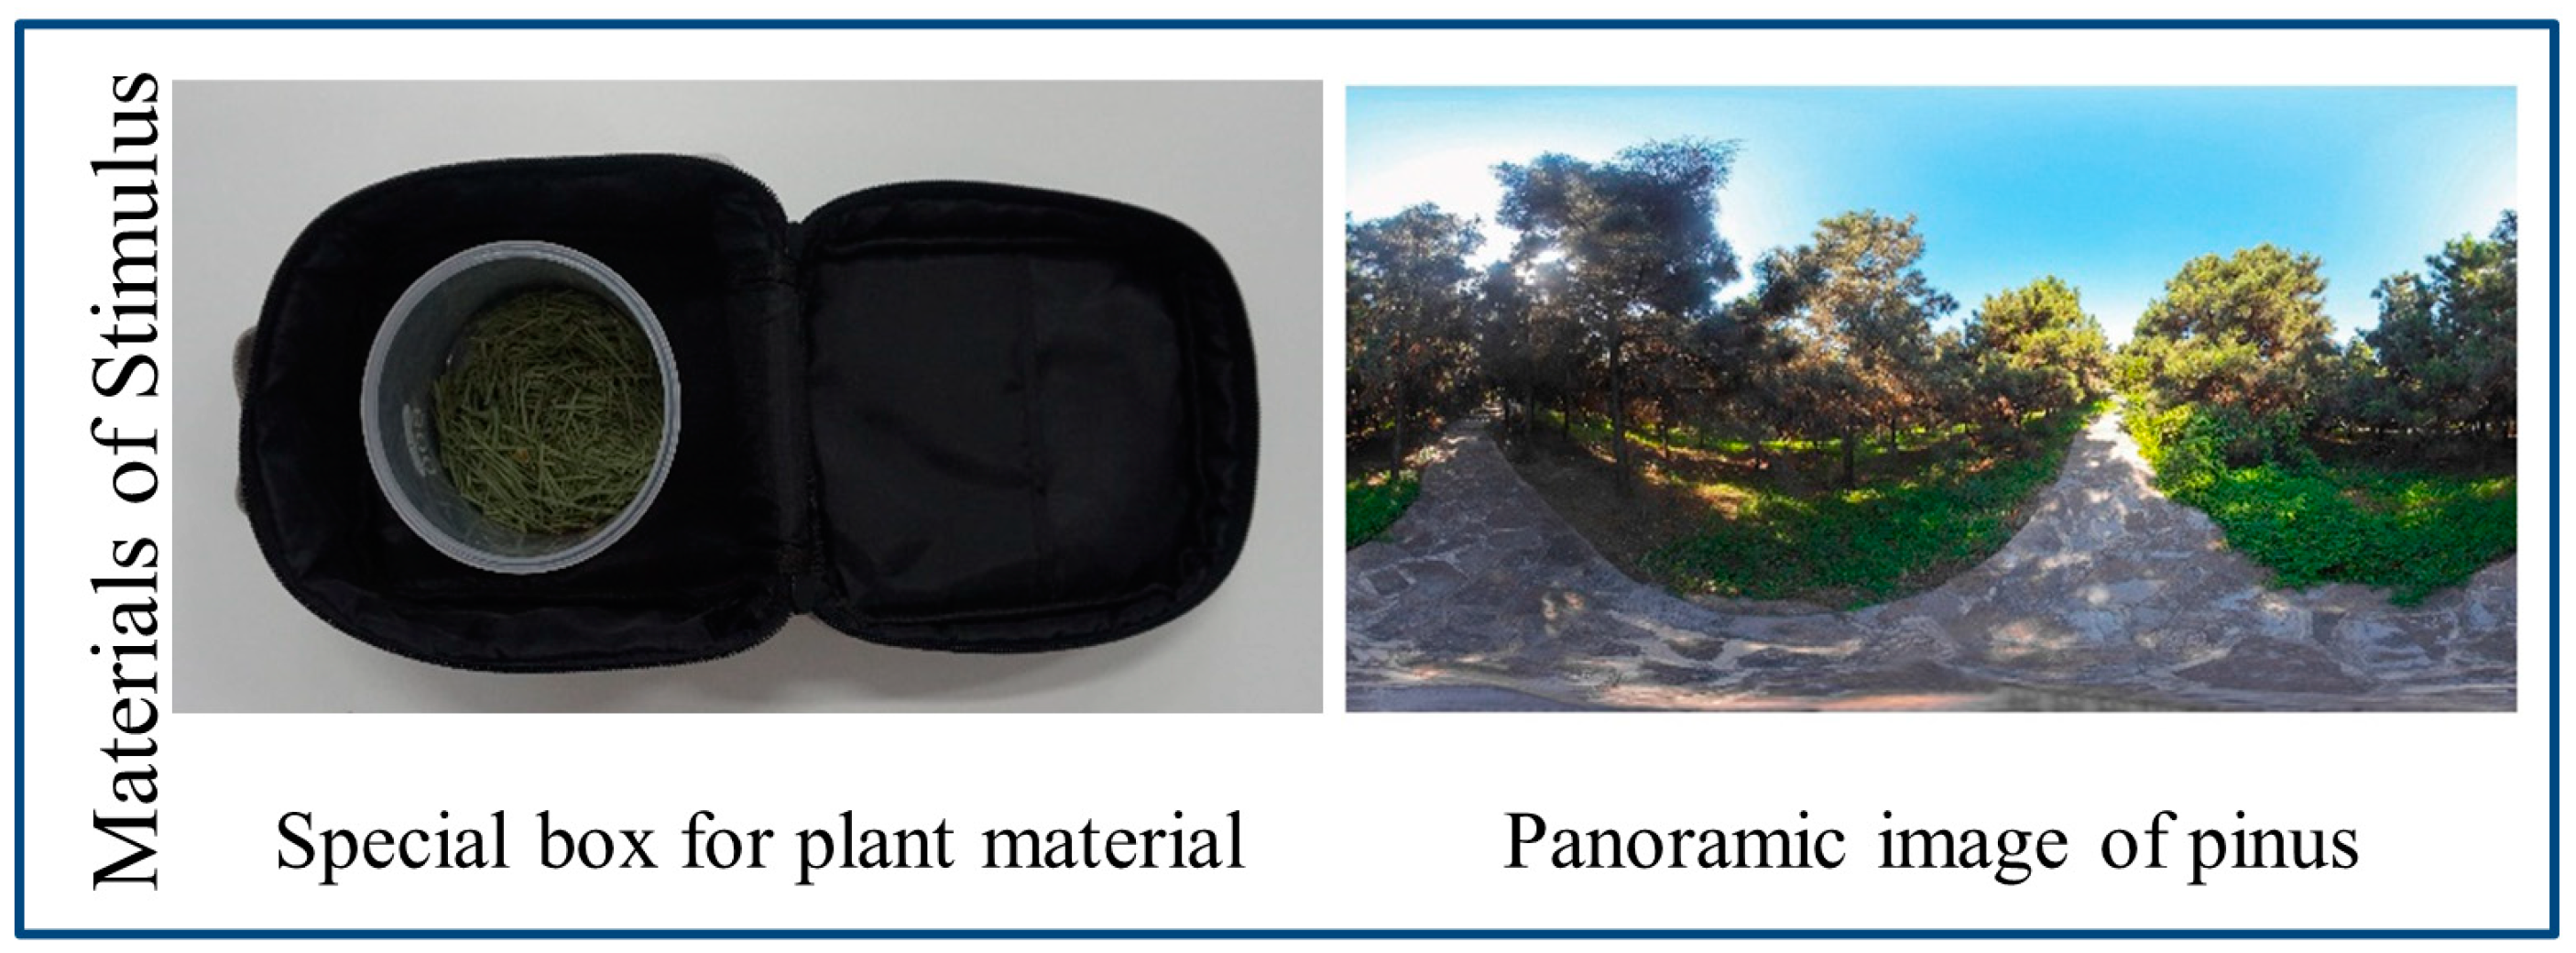
The experimental materials comprised both olfactory and visual stimuli. The olfactory stimuli originated from the pine forest within the southern campus of Northwest A&F University’s green spaces, China. These were collected 0.5 to 1 h prior to the test day to ensure authenticity. The leaves were cut to a uniform size using scissors to enhance the release of volatile compounds. Subsequently, the processed foliage was encapsulated within a transparent, odorless polyethylene (PE) cylinder of 600 milliliters. To mitigate potential visual interference in olfactory evaluation, the container was securely enclosed within a specifically designed enclosure (Figure 2), which remained concealed until the testing phase, when it was unsealed for olfactory inspection. The container was mounted on an adjustable-height tripod, positioned at the same height as the subject’s nose with a horizontal distance of 10 cm [62,78,93,94], ensuring a consistent sniffing radius for each participant. The visual stimuli consisted of panoramic photographs of pine forest landscapes in the green space of the south campus of Northwest A&F University of China, captured using an Insta360 panoramic camera (Insta360Pro-I, 7680 × 3840 (8K) pixels). These images were imported into a virtual reality device to simulate the visual aspect of the pine forest environment.
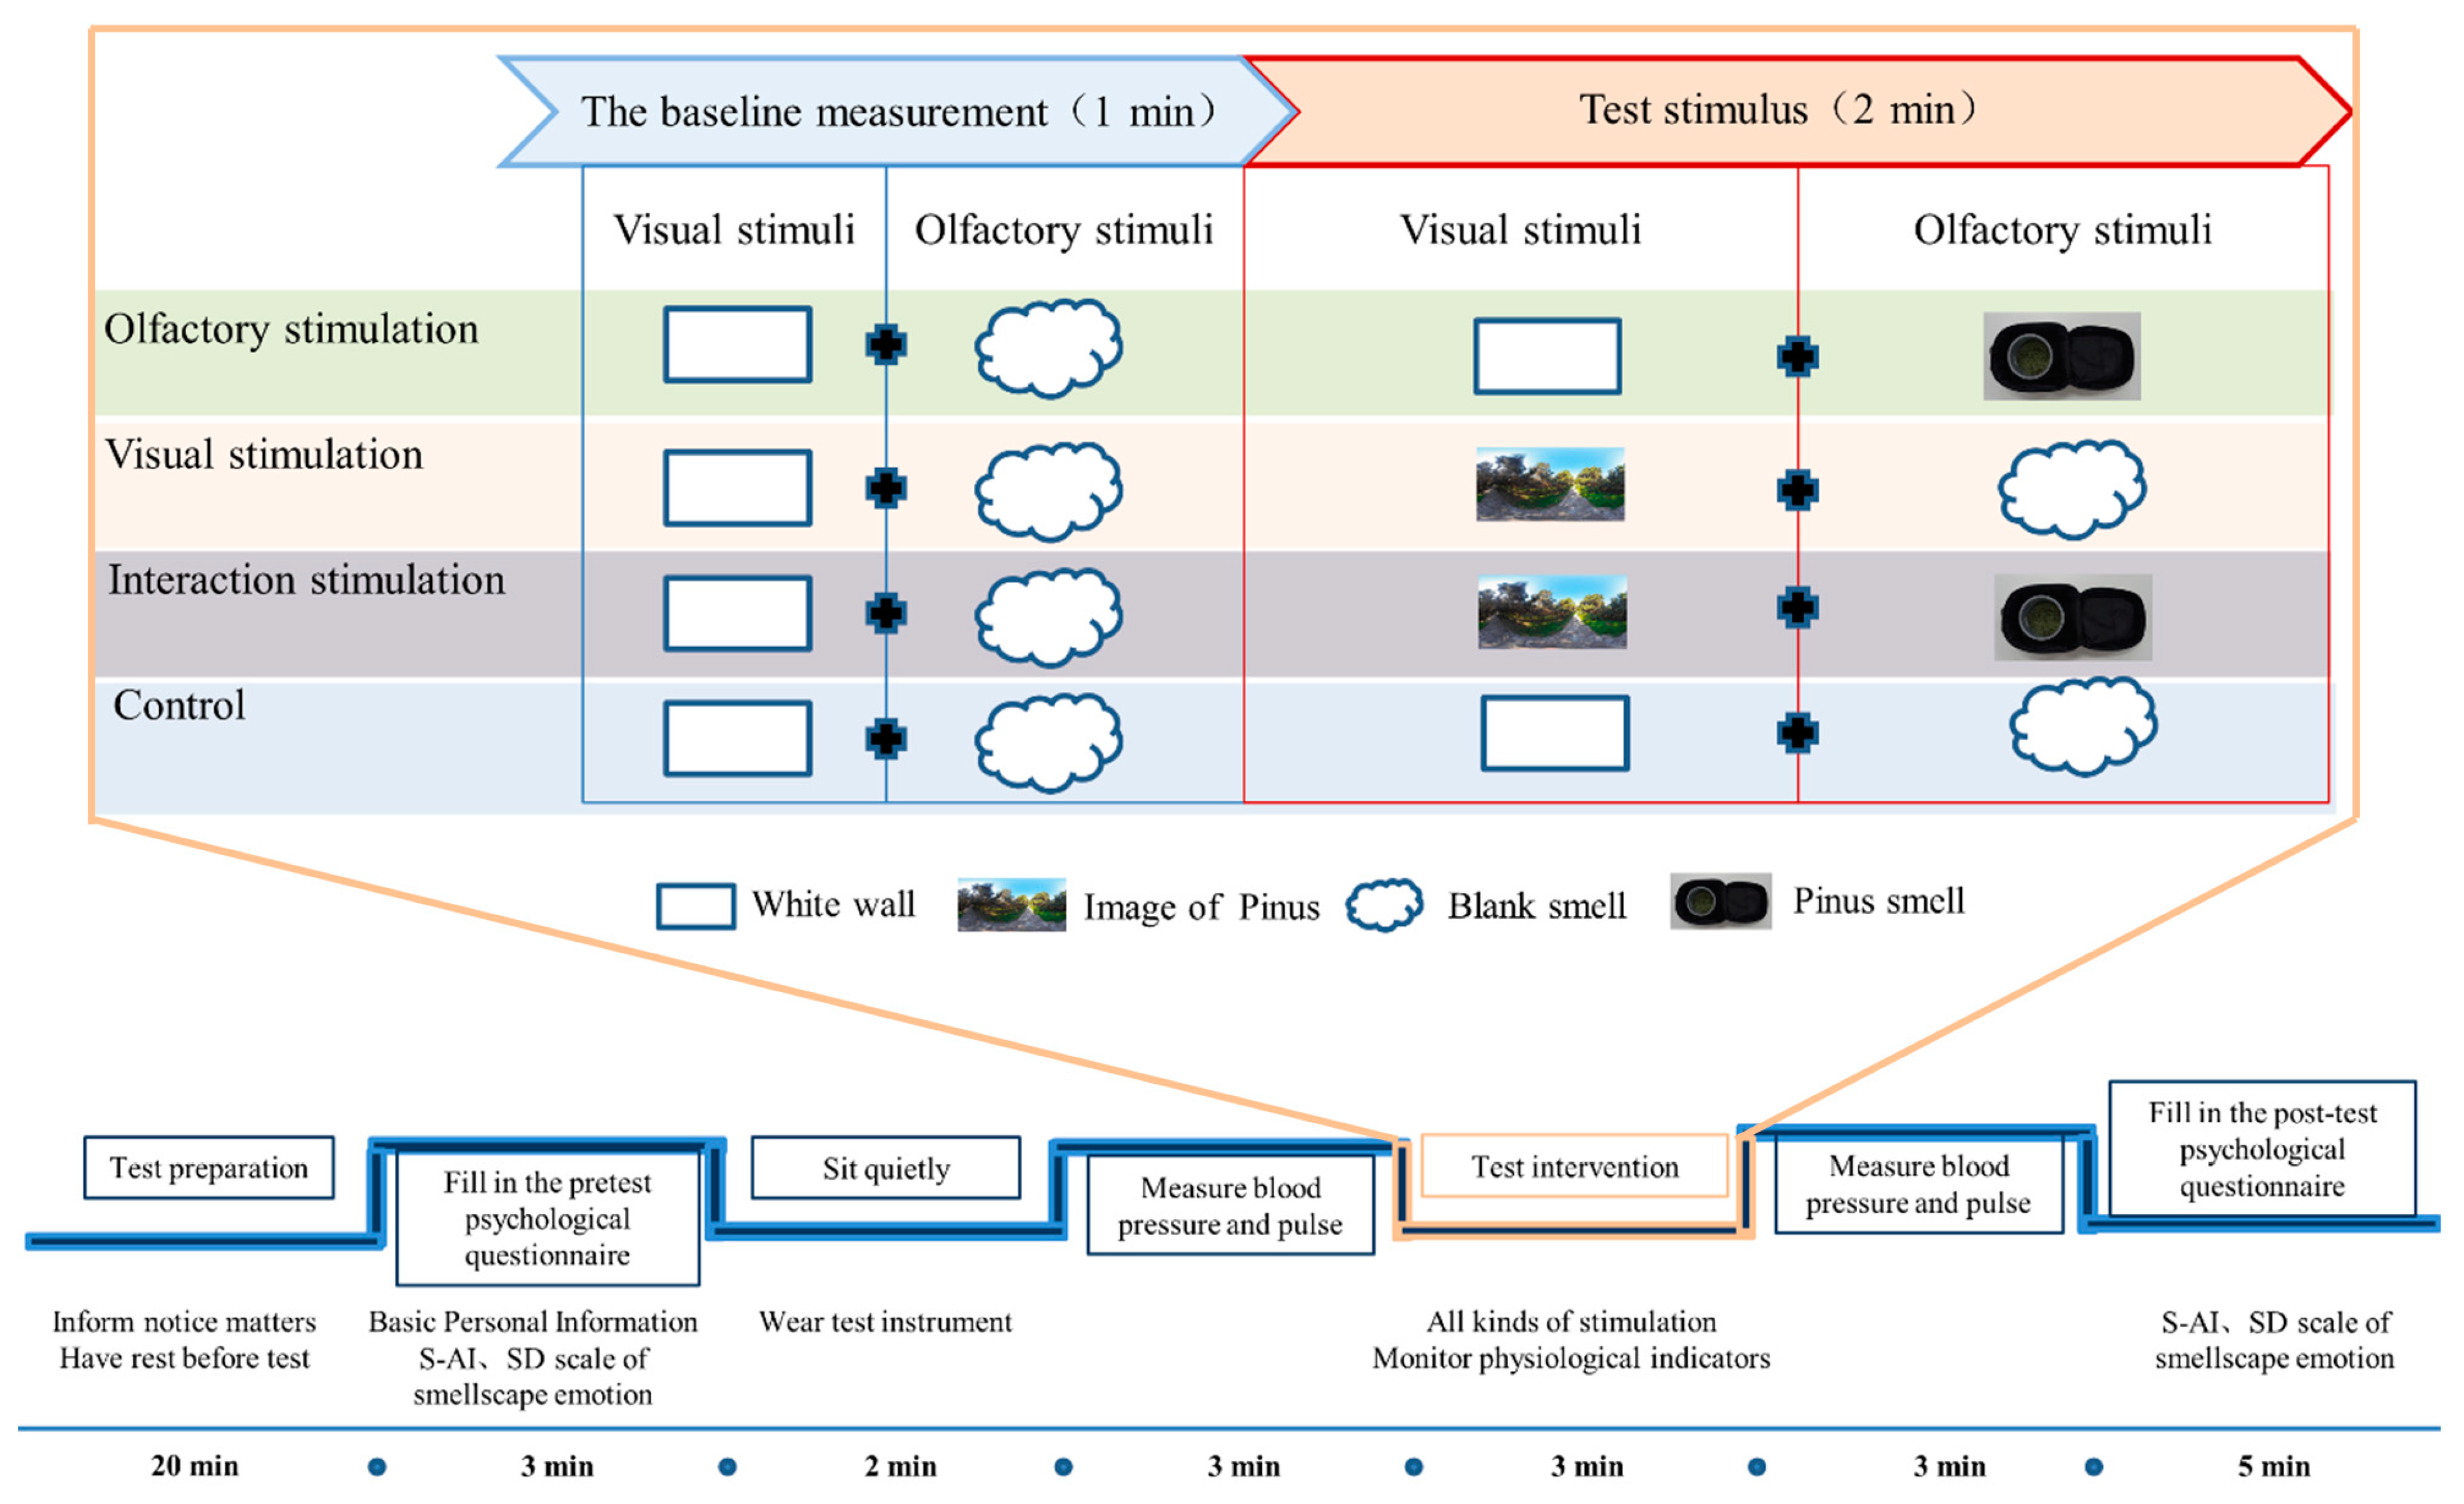
Upon the initiation of the experiment, participants were systematically allocated into four distinct groups: olfactory sensory stimulation group, visual sensory stimulation group, olfactory–visual interaction sensory stimulation group, and control group. In every experimental set, participants were randomly assigned stimuli and underwent both physical and psychological assessments. The experimental protocol, excluding variations in stimulus type (Figure 3), closely followed a standardized procedure. Participants were asked to inhale neutral odors and don virtual reality headsets to view laboratory walls, constituting the control condition. Each individual’s assessment lasted approximately 39 min, punctuated by a 10-minute ventilation break between sessions to eliminate lingering odors.

2.4.1. Physiological Assessments Methods

The biofeedback device (VISHEEW, Infiniti3000A, Nanjing, China), equipped with multiple parameters, was deployed to gauge skin conductance (SC), with concurrent data acquisition facilitated by Bioneuro software (2022). As a physiological biomarker of emotional stress, SC is intricately linked to sweat gland dynamics, with heightened activity during states of excitement, tension, fear, or anxiety resulting in enhanced conductivity and correspondingly elevated SC levels. Conversely, a state of tranquility corresponds to a decline in SC values [95].
The NeuroSky portable Brainwave device (Silicon Valley, San Francisco, California, USA), equipped with a TGAM brainwave chip, was employed to measure and record Alpha and Beta brainwave patterns. Employing the eSense™ algorithm, the resulting data underwent rigorous processing. Unlike conventional methodologies like interviews or questionnaires, electroencephalographic (EEG) assessments, responding to stimuli, offer a more objective perspective into subjects’ genuine cognitive states, providing real-time physiological insights [96]. Brainwave fluctuations serve as reliable scientific markers of emotional shifts [97]. Typically, Alpha waves (α) are linked to heightened mental activity, signifying improved learning and cognitive engagement [98], while Beta waves (β) correlate with enhanced focus; an escalation in β wave intensity denotes heightened attention [73].
A sophisticated electronic sphygmomanometer (OMRON, HEM-7211, Kyoto, Japan) was deployed to accurately gauge and document systolic blood pressure (SBP), diastolic blood pressure (DBP), heart rate (R), and pulse pressure (PP). SBP and DBP are vital physiological parameters frequently employed to evaluate the correlation between plant volatiles and public health [47,99,100,101]. Sympathetic excitation manifests as increased blood pressure, while parasympathetic activation results in decreased blood pressure [47]. Understanding the distinctions between PP, SBP, DBP, and heart rate is crucial in assessing an individual’s general well-being [101]. Medical studies have shown that increased PP can reduce arterial wall elasticity and is associated with conditions such as aortic insufficiency and severe anemia [102]. Pulse (P) is an important cardiovascular health indicator, typically rising during stress or stressful environments and falling during relaxed states [103].

2.4.2. Psychological Assessments Methods

The psychological responses of participants to odors were assessed by measuring state anxiety levels and emotions triggered by the smells. The assessment of state anxiety was conducted utilizing the State Anxiety Inventory (S-AI), a specific component of the STAI, as formulated by Spielberger C.D. et al. Participants independently completed a self-assessment questionnaire with 20 items, each measuring how they felt “at this moment”. Every item was assessed on a four-point scale, with a rating of four signifying significant anxiety. The total score ranged from 20 (lowest anxiety) to 80 (highest anxiety), with higher scores indicating greater anxiety levels.
The semantic differential (SD) method, considered a reliable and effective tool for quantifying subjective perceptions of external stimuli [104,105], was used to measure emotions evoked by odor stimuli. A refined adaptation of the semantic differential approach, as detailed in reference [104], was employed to develop the Odor Emotion SD Scale. This scale aimed to evaluate participants’ emotional reactions to various scents [105]. In accordance with the methodologies employed by Jo et al. [74] and Xiao et al. [18], the questionnaire consisted of 13 pairs of adjectives with opposite meanings. Participants rated these pairs on a five-point scale (−2, −1, 0, 1, 2), including “thick–light”, “pungent–not pungent”, “uncomfortable–comfortable”, “unpleasant–pleasant”, “frustrated–pleasant”, “disgusted–liked”, “strange–familiar”, “lazy–exciting”, “nervous–relaxed”, “fidgety–calm”, “no vitality–vigorous”, “negative–positive”, and “not refreshing–refreshing”.

2.5. Statistical Analyses

Statistical analyses, including paired T-tests, one-way ANOVA, post hoc LSD tests, and the Wilcoxon rank-sum test, were conducted utilizing SPSS version 25.0. For data visualization, Microsoft PowerPoint and Adobe Photoshop CS6 were employed. As for the psychological indicators, for S-AI, the change data of the total score of the scale of the control group and the experimental groups before and after receiving the stimulus (Δ) were compared in pairs for analysis of variance and post-LSD test. For the olfactory mood scale, the Wilcoxon rank-sum test was performed for the mean score of each adjective option in each group.
To ensure data uniformity, a comprehensive analysis was conducted on the physiological and psychological parameters of the participants, utilizing the initial measurements taken prior to exposure to the olfactory stimulus as the benchmark for comparison. The alterations in pre- and poststimulus data (denoted as Δ) were calculated utilizing the subsequent methodology: Δ = PSV-BSV (Δ: the change amount of indexes before and after stimulus; PSV: indicator data after stimulus; BSV: baseline value (prestimulus indicator data).

3. Results

3.1. Participant Demographic Analysis

A comprehensive collection of 95 valid samples was gathered, consisting of 21 male students (22%) and 74 female students (78%). All participants were either undergraduate or graduate students, with each experimental group containing between 23 and 24 subjects. Due to instrument operational errors, data from 1 to 2 participants per experiment were lost for physiological indicators. However, the number of effectively collected samples remained consistently above 23. Psychological scale samples were slightly higher than the physiological indicator samples (Table 1).

3.2. Changes in Physiological Indicator Data

3.2.1. The Alterations Observed in Autonomic Nervous System Metrics

A paired T-test is utilized in this research to evaluate the impact of individual sensory modalities, including olfaction and visual perception, as well as their combined effect, on participants’ physiological responses pre- and during stimulation. As indicated in Table 2, there was no significant variation in the subjects’ SBP readings from prestimulation to the onset of olfactory stimulation (before, M = 107.72, SD = 11.89; during, M = 106.04, SD = 11.66, p > 0.05), and their DBP values did not increase significantly either (before, M = 63.63, SD = 7.24; during, M = 64.35, SD = 7.40, p > 0.05), but their PP values (before, M = 44.09, SD = 8.36; during, M = 41.70, SD = 8.88, p < 0.05) and SC values (before, M = 2.12, SD = 1.46; during, M = 1.89, SD = 1.34, p < 0.05) decreased significantly, and p-values (before, M = 73.63, SD = 8.94; during, M = 75.48, SD = 7.24, p < 0.05) increased significantly. Upon exposure to visual stimuli, there were no notable fluctuations observed in the participants’ DBP and P. But their SBP (before, M = 104.96, SD = 11.75; during, M = 99.38, SD = 9.92, p < 0.05), PP (before, M = 44.40, SD = 10.03; during, M = 39.78, SD = 6.43, p < 0.05), and SC (before, M = 3.22, SD = 2.45; during, M = 2.99, SD = 2.28, p < 0.05) decreased significantly. Upon concurrent olfactory and visual stimulation, significant elevations in participants’ DBP (before, M = 63.38, SD = 6.05; during, M = 65.88, SD = 7.03, p < 0.05) were recorded, accompanied by a notable decrease in PP values (before, M = 43.38, SD = 7.40; during, M = 39.98, SD = 4.40, p < 0.05); however, SBP (before, M = 106.75, SD = 9.98; during, M = 105.85, SD = 7.98, p > 0.05), P (before, M = 74.58, SD = 8.14; during, M = 74.35, SD = 9.43, p > 0.05), and SC (before, M = 1.72, SD = 1.43; during, M = 1.66, SD = 1.28, p > 0.05) remained relatively stable.
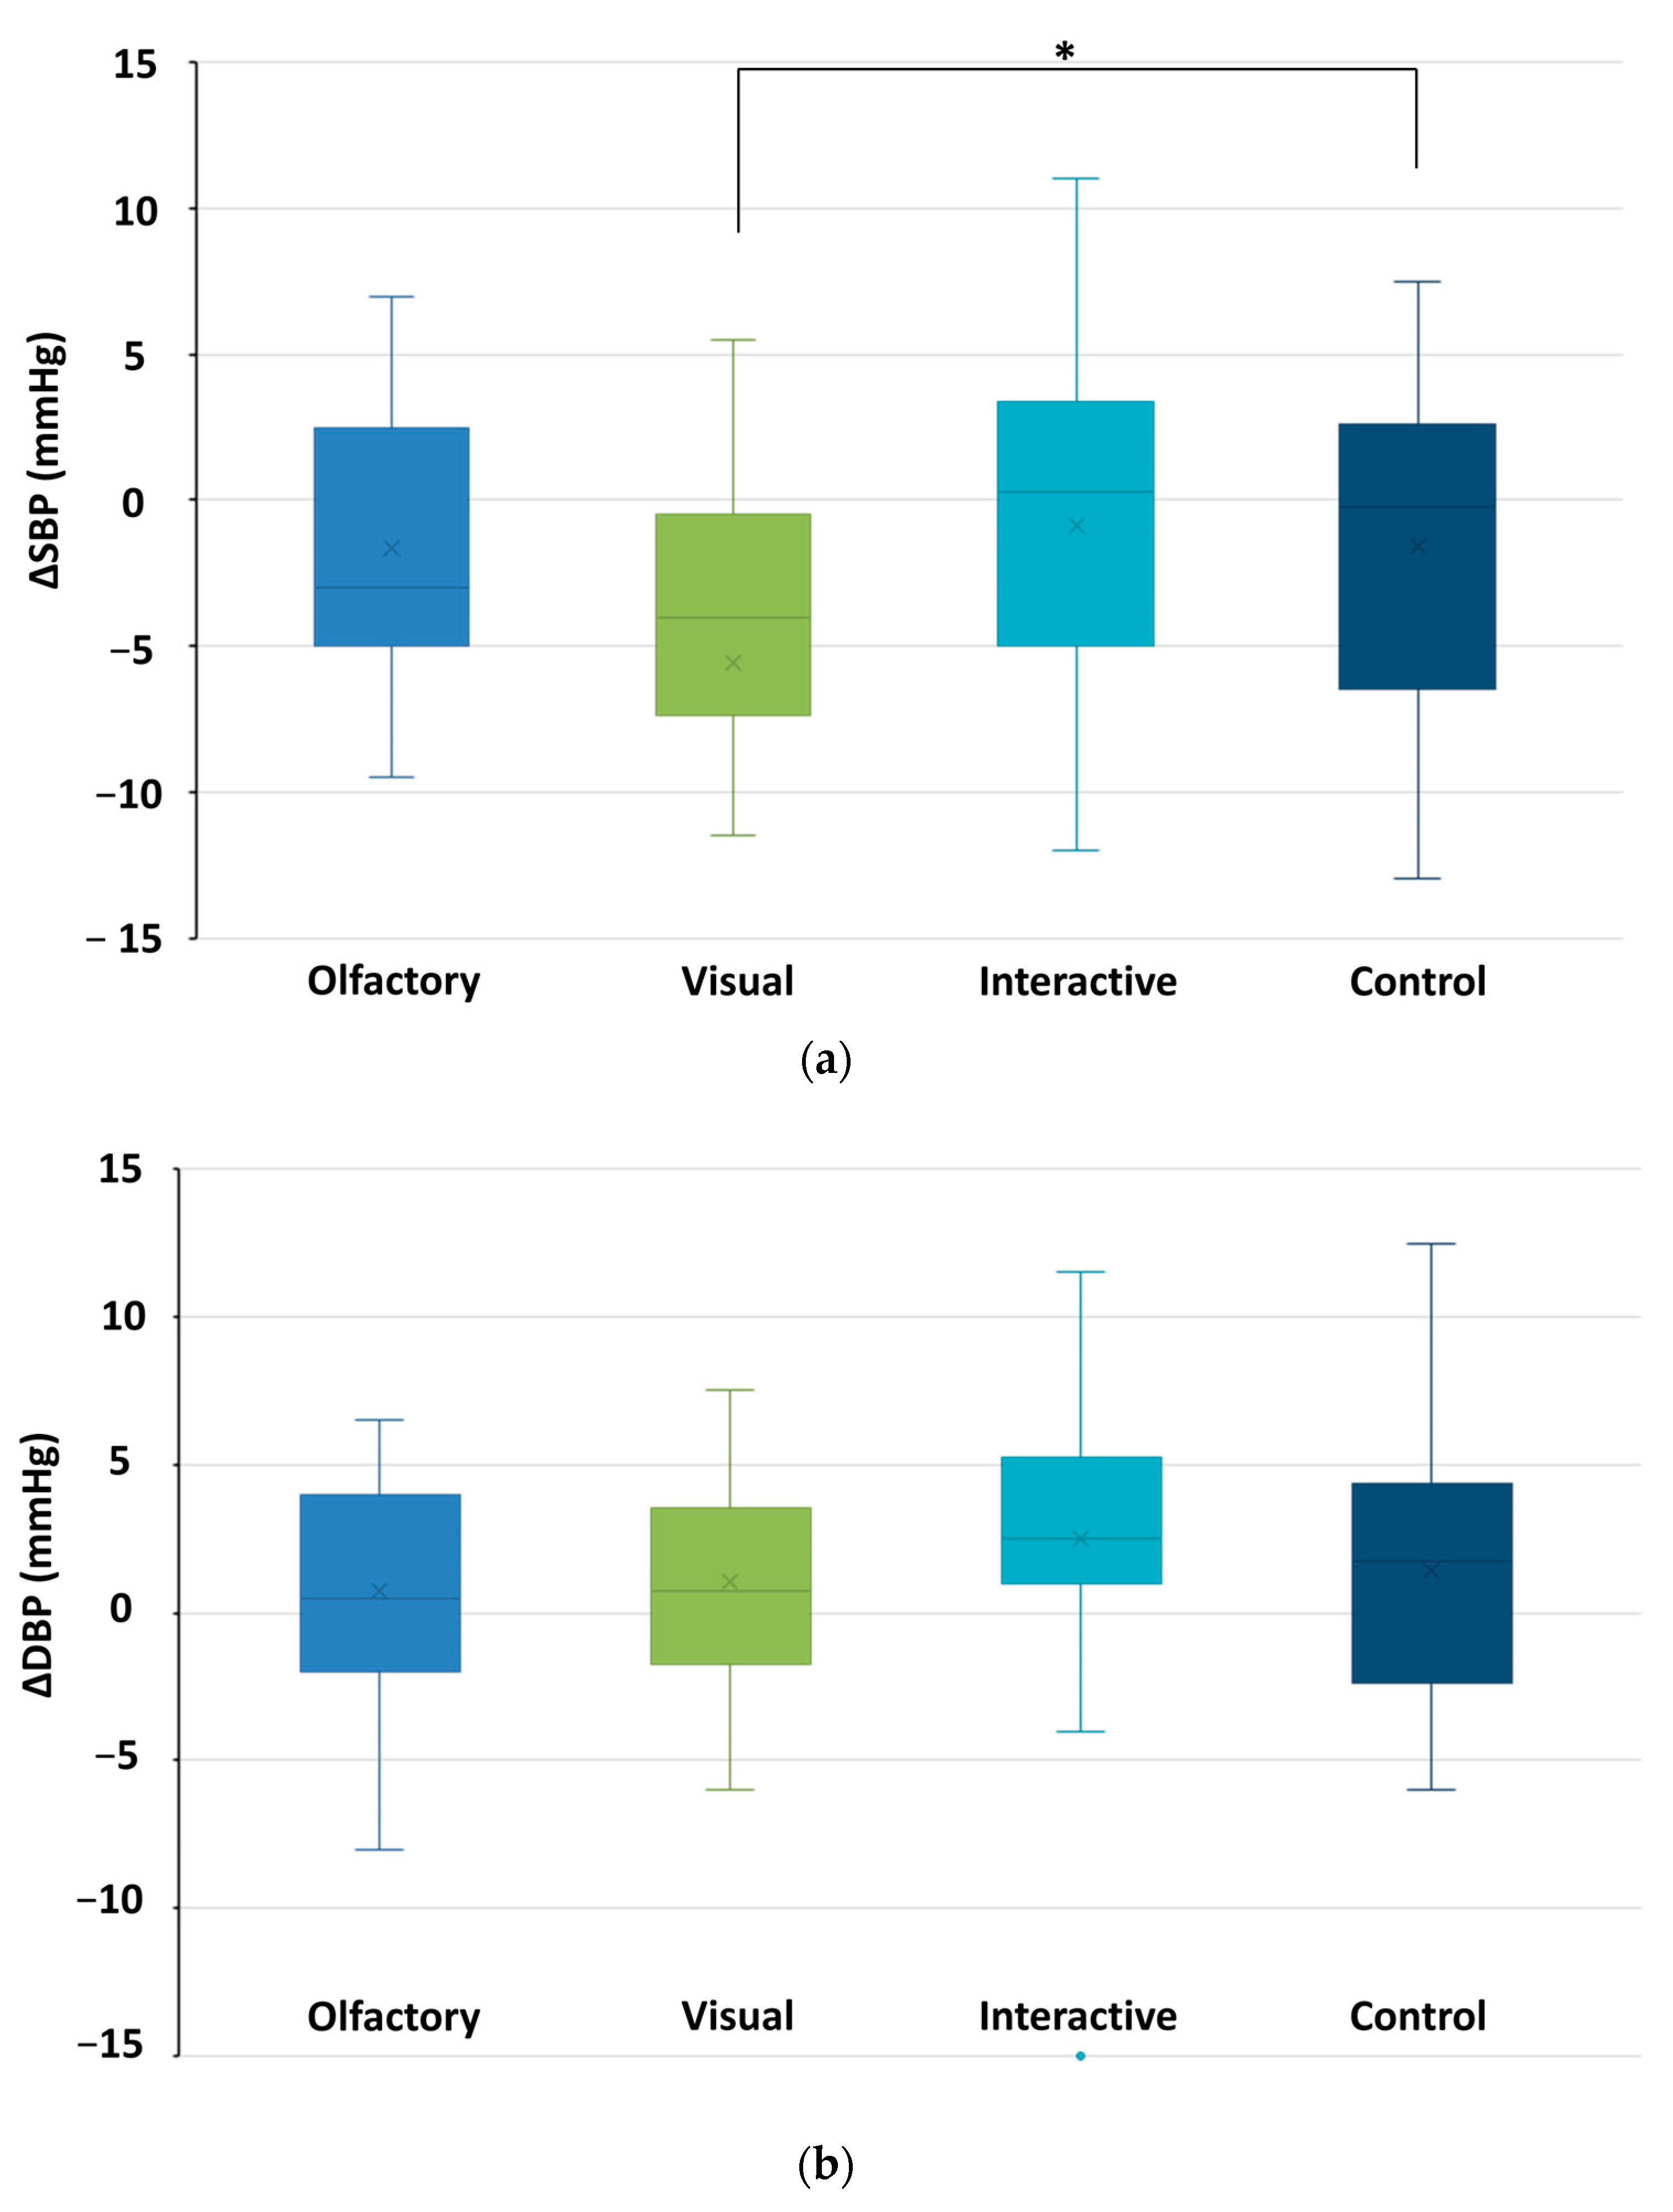
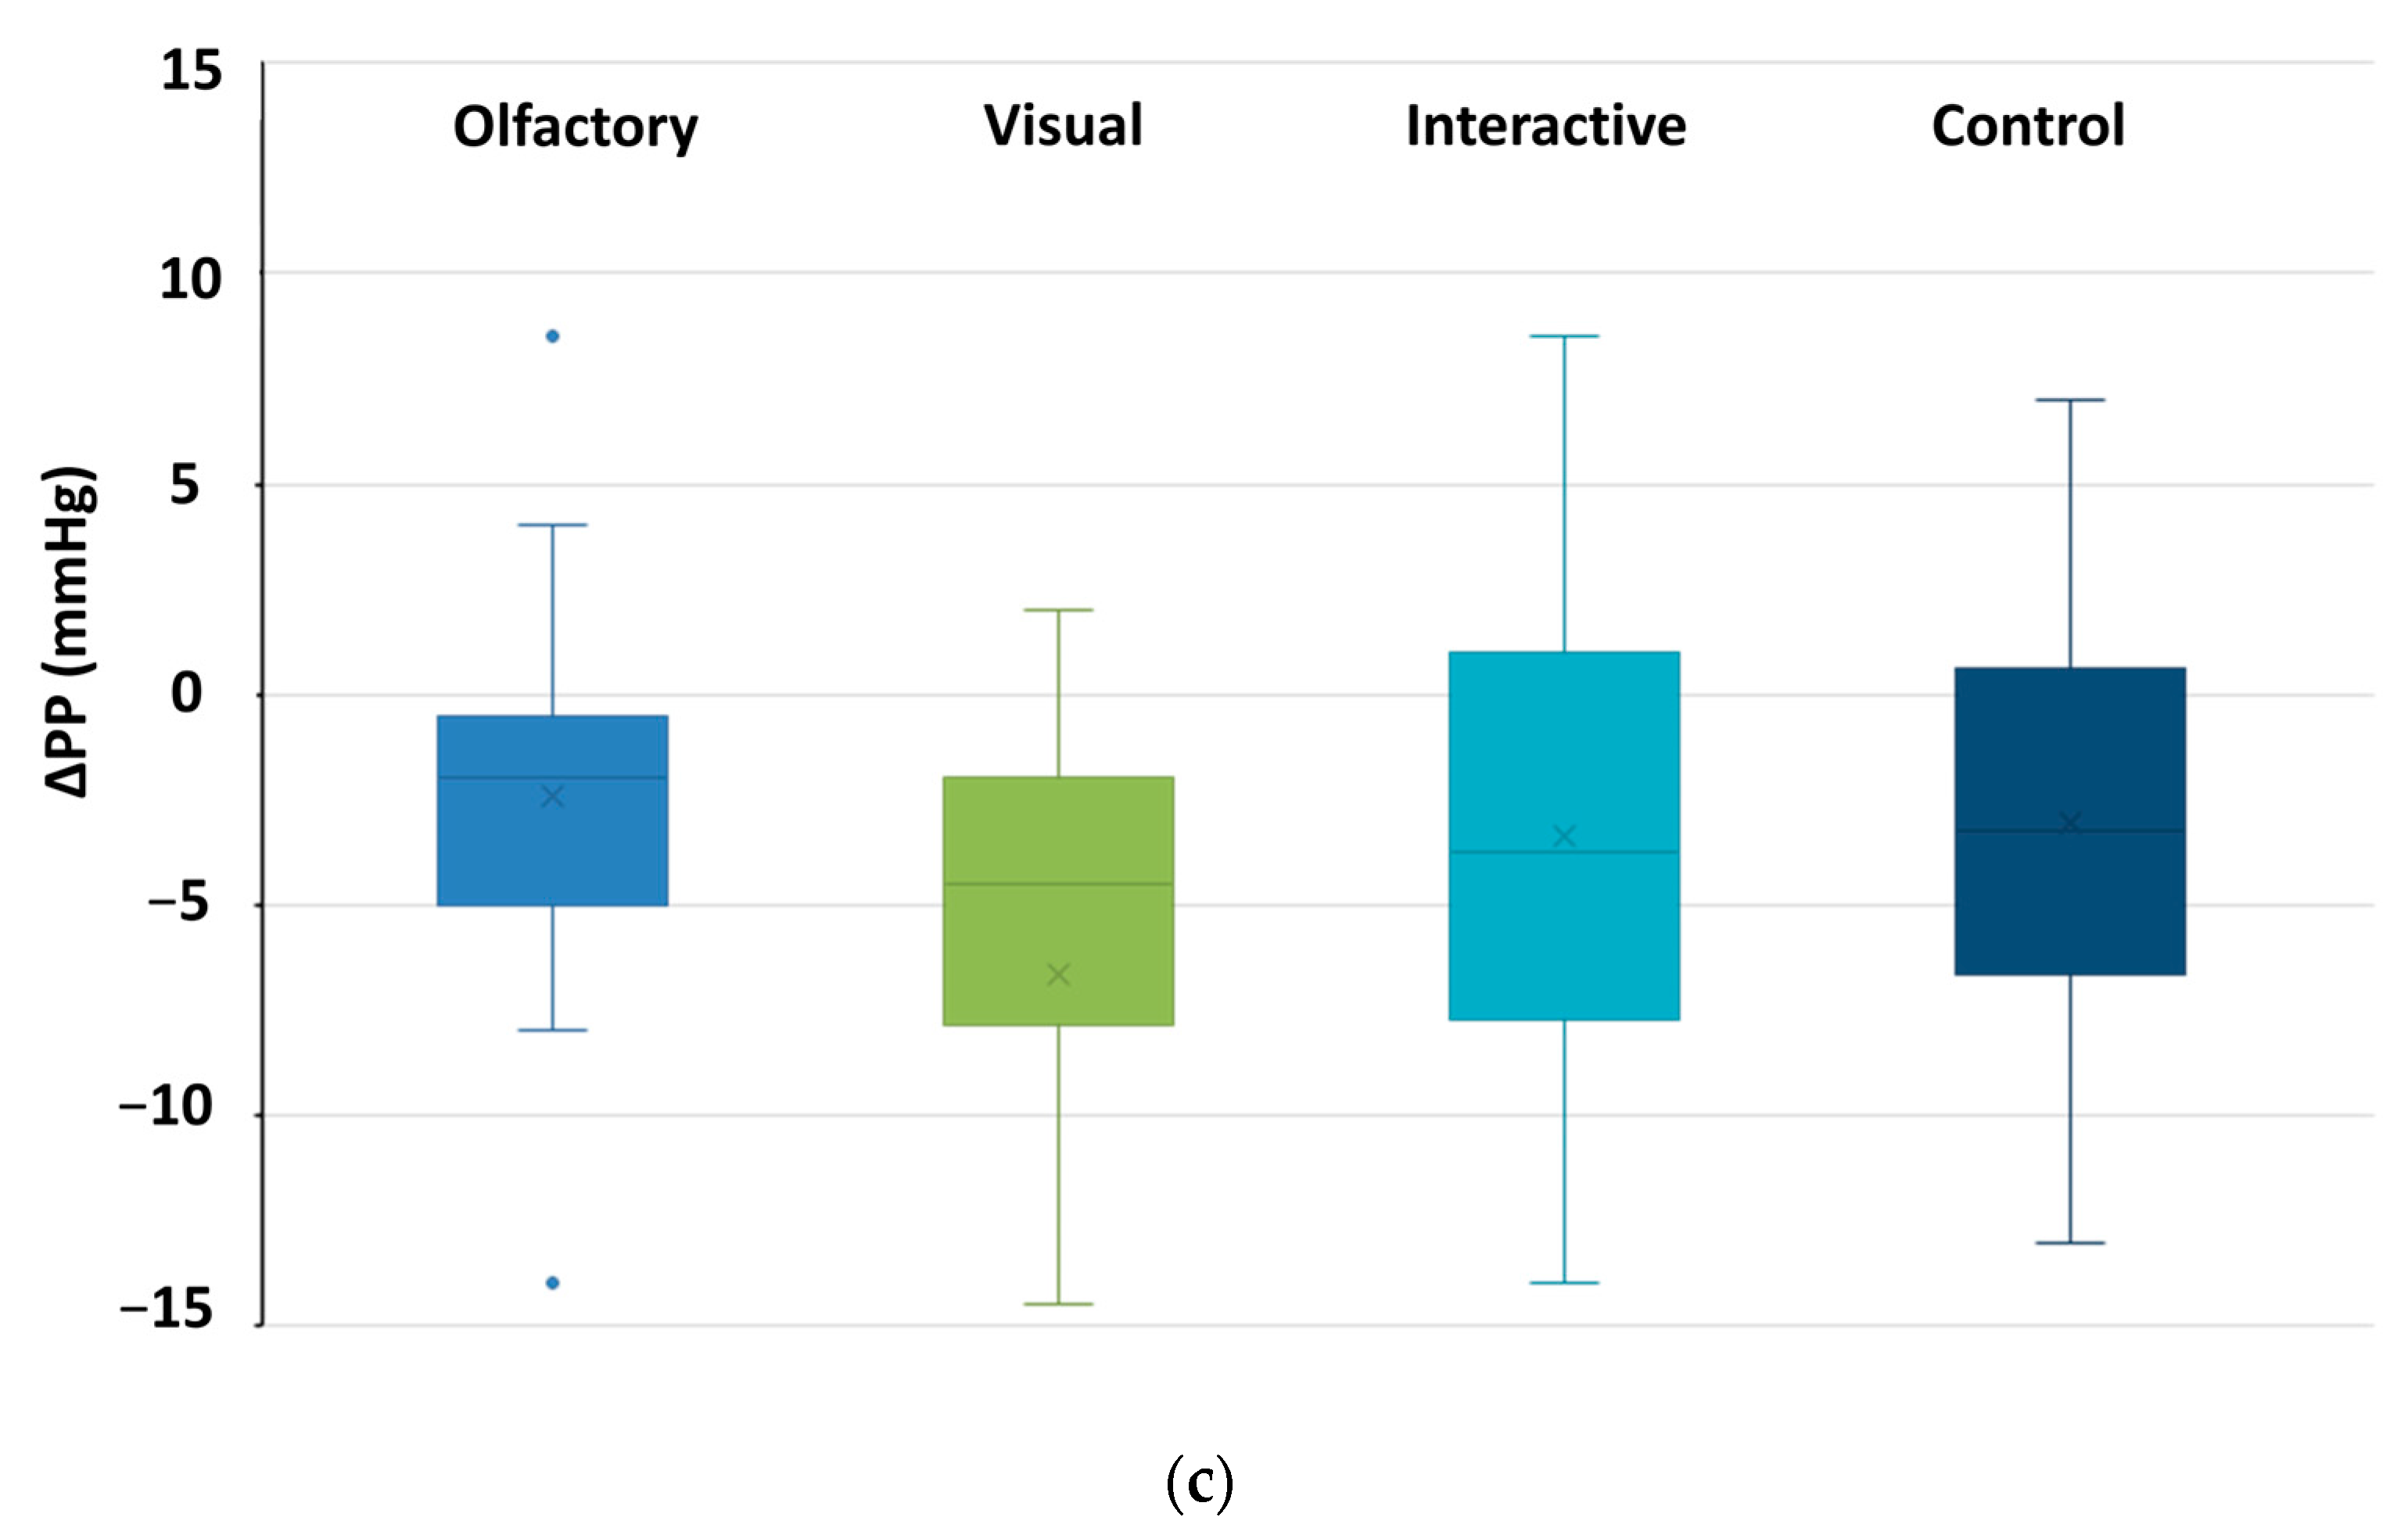
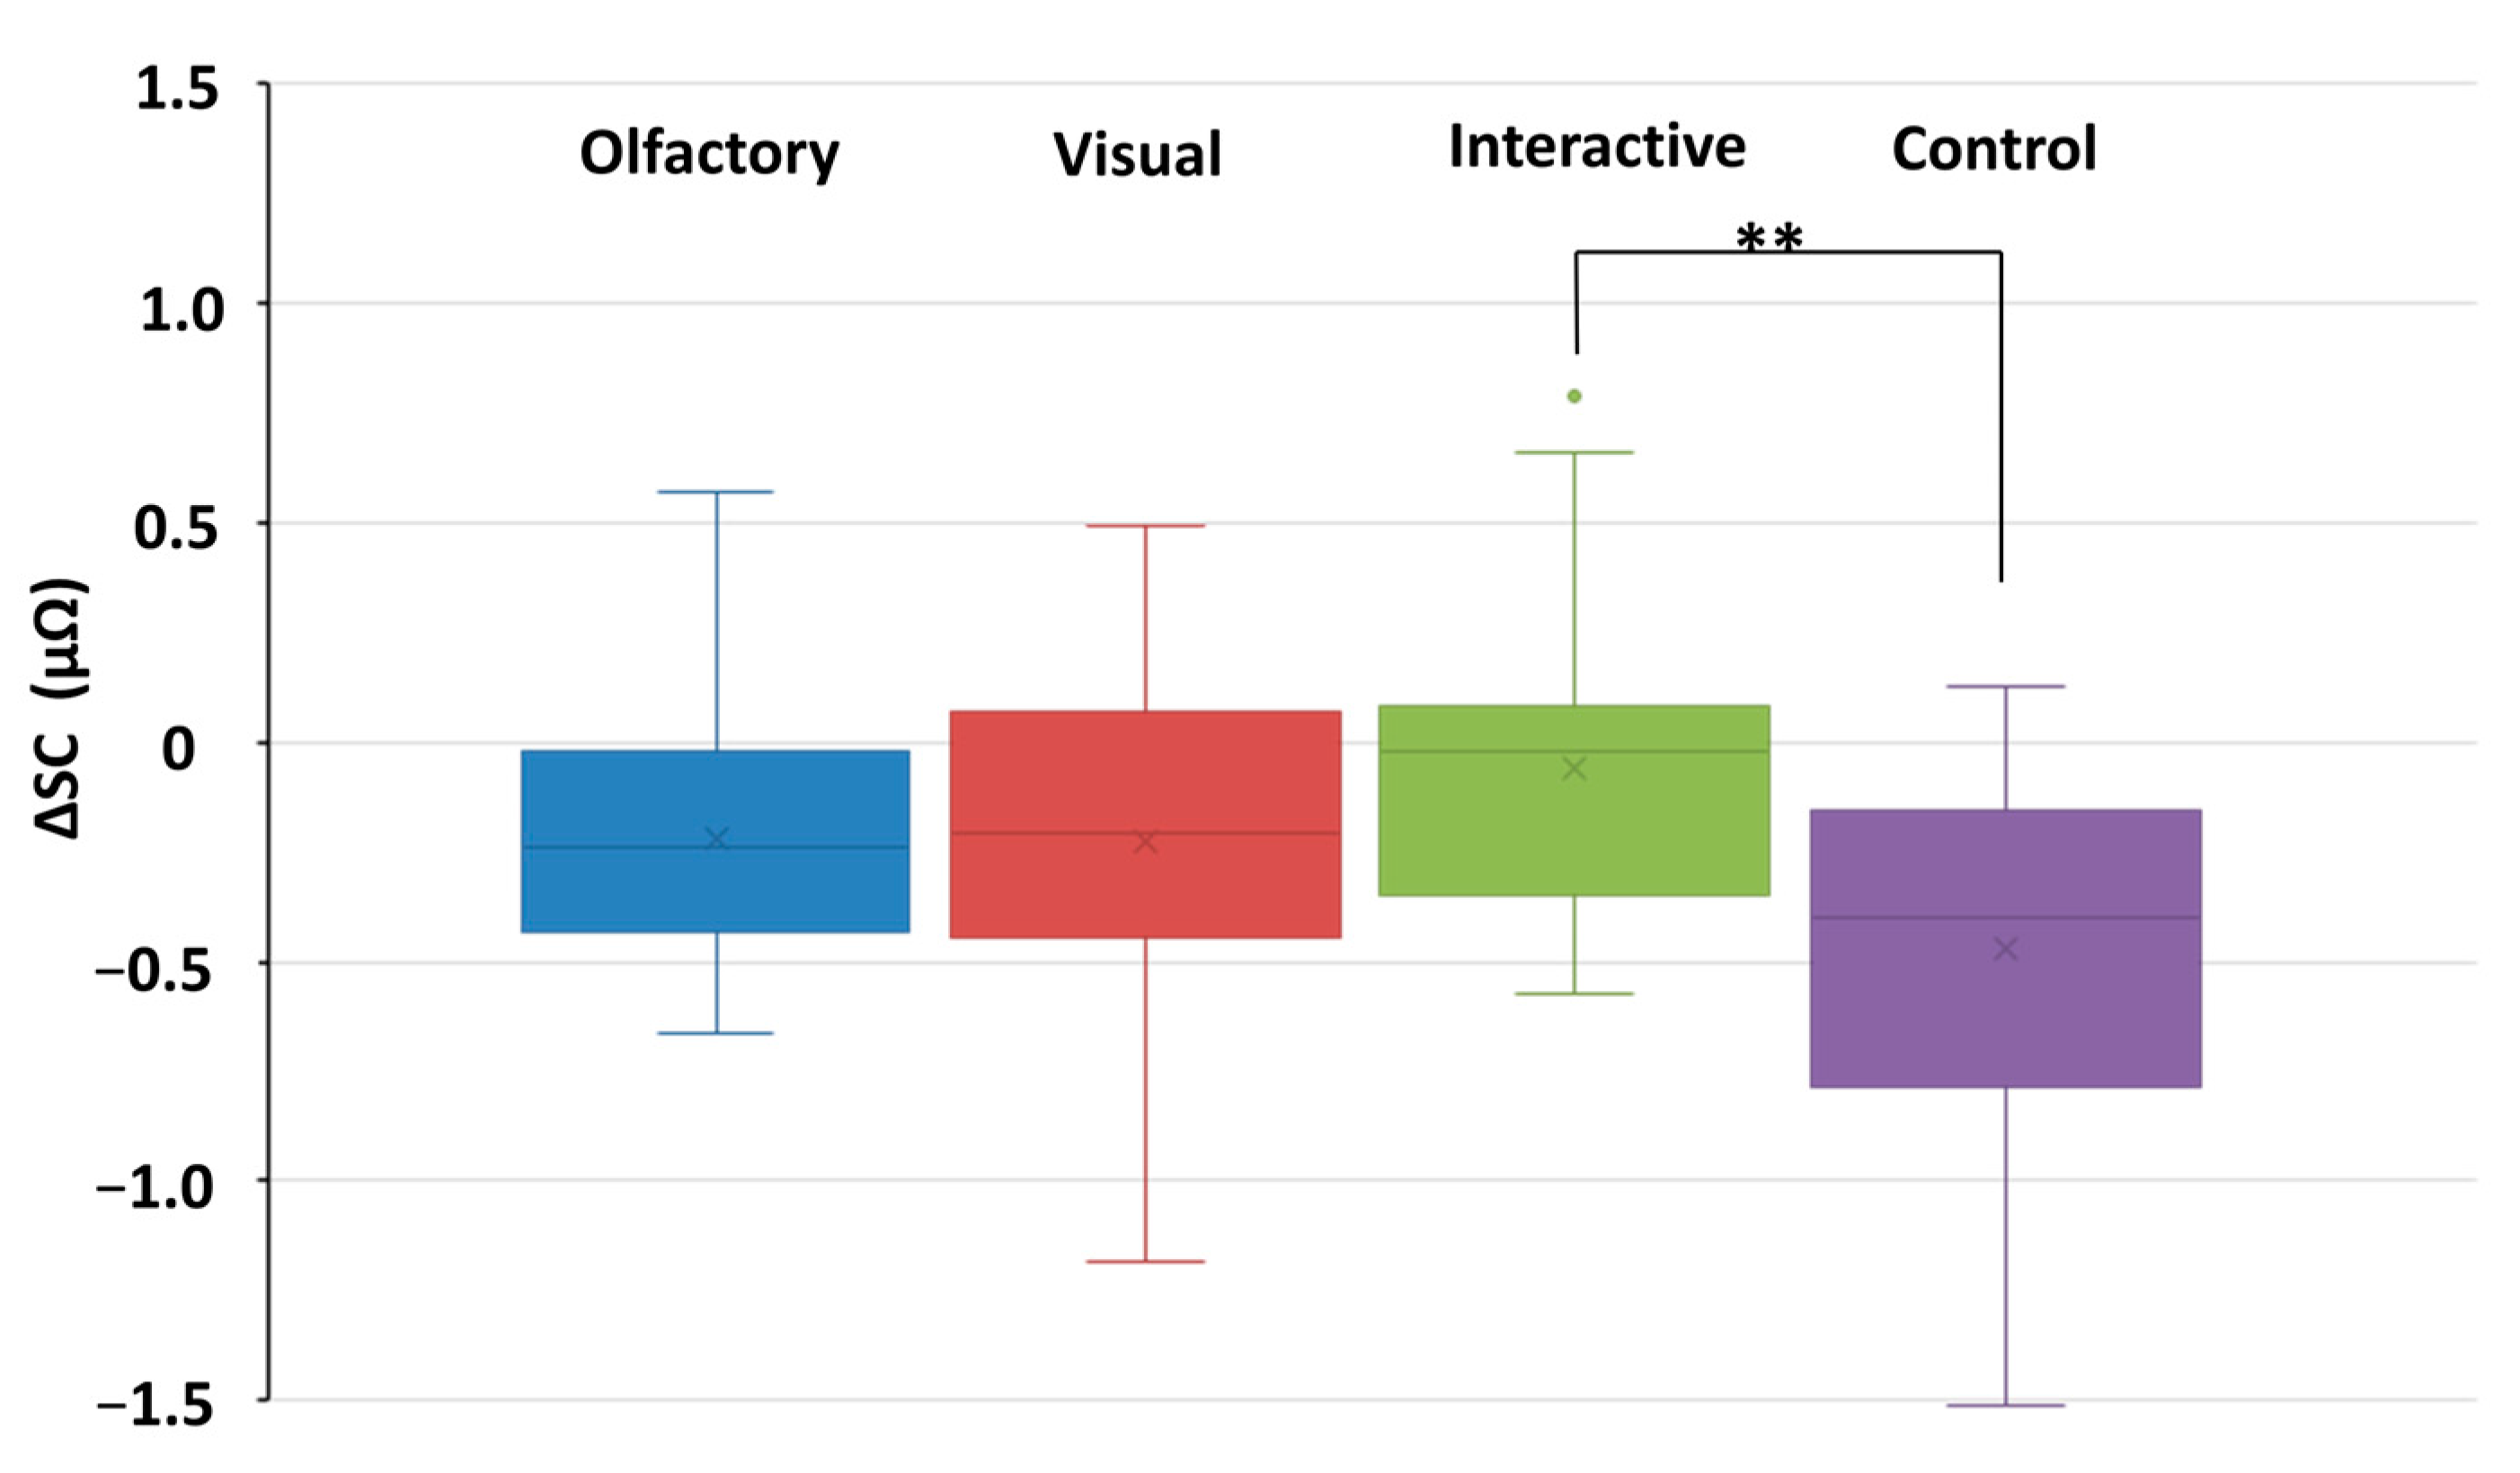
An ANOVA analysis was performed to investigate potential variations in physiological metrics across different groups, subsequently facilitated by a post hoc LSD test for detailed comparisons. In all three stimulation scenarios, no notable deviations were observed in blood pressure, pulse pressure variation, or pulse readings compared with the baseline measurements, except for systolic pressure in response to visual stimulation (ΔSBP: control, M = −1.60, SD = 2.05; olfactory, M = −1.68, SD = 0.23, p > 0.05; visual, M = −5.58, SD = 1.83, p < 0.05; olfactory–visual, M = −0.90, SD = 2.00, p > 0.05, Figure 4a; ΔDBP: control, M = 1.46, SD = 2.08; olfactory, M = 0.72, SD = 0.16; visual, M = 1.07, SD = 0.31; olfactory–visual, M = 2.50, SD = 0.98, p > 0.05, Figure 4b; ΔPP: control, M = −3.06, SD = 1.69; olfactory, M = −2.39, SD = 0.52; visual, M = −4.62, SD = 3.60 m; olfactory–visual, M = −3.40, SD = 3.00, p > 0.05, Figure 4c; ΔP: control, M = 0.02, SD = 2.61; olfactory, M = 1.85, SD = 1.70; visual, M = 0.97, SD = 0.05; olfactory–visual, M = −0.23, SD = 1.29, p > 0.05, Figure 5). The mean scores of each participant’s SC values relative to the baseline during the experimental period were computed, and the corresponding averages are depicted in Figure 6. Significant distinctions were observed in the olfactory–visual interactive stimulation group compared with the control (ΔSC: control, M = −0.47, SD = 0.01; olfactory, M = −0.23, SD = 0.12, p > 0.05; visual, M = −0.23, SD = 0.17, p > 0.05; olfactory–visual, M = −0.06, SD = 0.15, p < 0.01). The olfactory and visual stimuli groups did not exhibit a notable distinction from the control group.

3.2.2. The Alterations Observed in Central Nervous System Metrics

As illustrated in Table 2, a notable reduction was observed in both alpha and beta wave activity from prestimulation to the period of olfactory stimulation (α waves: olfactory, before, M = 16.49, SD = 8.96; during, M = 11.36, SD = 5.40, p < 0.01; β waves: olfactory, before, M = 11.42, SD = 6.06; during, M = 8.47, SD = 5.10, p < 0.01). No substantial alterations were observed in α and β wave amplitudes throughout the olfactory–visual interactive stimulation period (α waves: before, M = 22.08, SD = 19.79; during, M = 21.98, SD = 14.57, p > 0.05; β waves: before, M = 15.91, SD = 12.46; during, M = 15.88, SD = 10.49, p > 0.05).
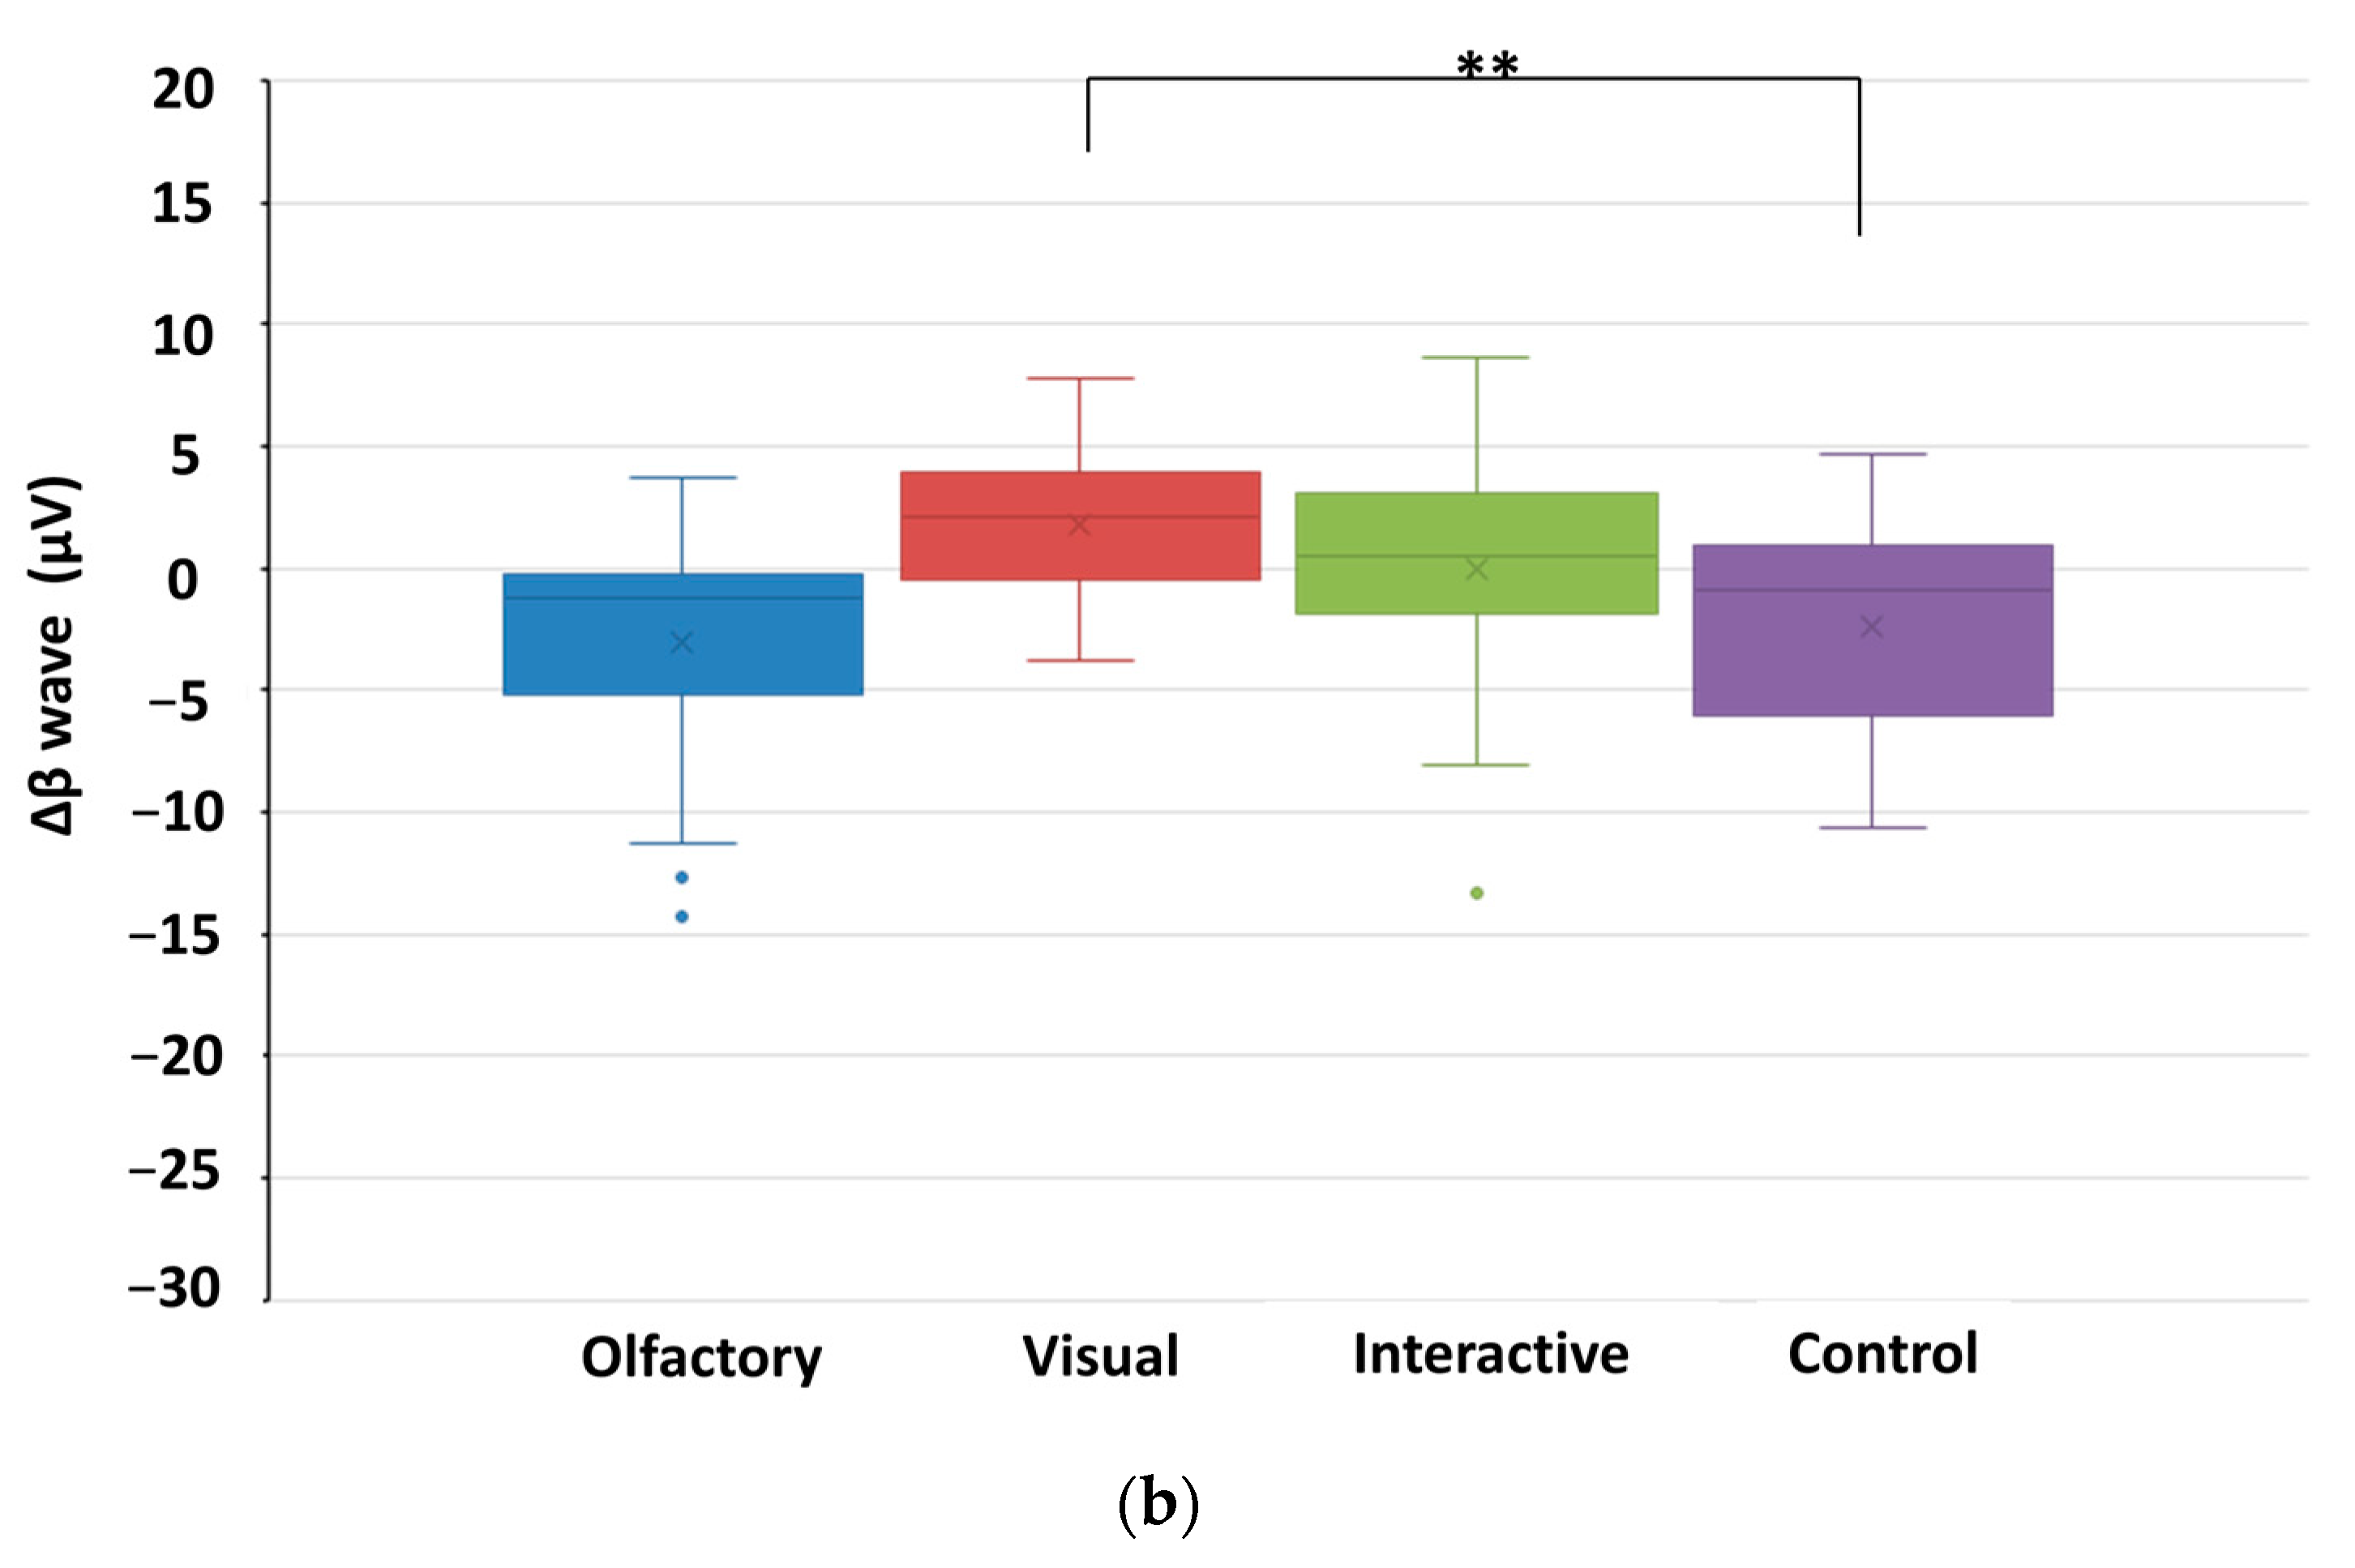
The graphical representation in Figure 7 illustrates the mean values of alpha and beta waves in relation to the established baseline across the four experimental stimuli. Notably, a discernible deviation was observed exclusively under the visual stimulation condition when compared with the control scenario (Δα waves: control, M = −5.18, SD = 6.64; visual, M = 2.17, SD = 1.00, p < 0.01, Figure 7a; Δβ waves: control, M = −3.26, SD = 3.5; visual, M = 1.82, SD = 0.18, p < 0.01, Figure 7b).

3.2.3. Differences in Physiological Effects Resulting from Various Types of Stimuli Encountered in Garden Plant Smellscapes

A comprehensive analysis via one-way ANOVA revealed statistically significant disparities (p < 0.001) in three physiological metrics: SC, alpha waves, and beta waves, differentiating the control group from each experimental stimulus group.
A notable distinction was observed in SC variations between the control and olfactory–visual stimulus groups, as detailed in Table 3. Two experiment combinations have revealed significant disparities in alpha brainwave amplitude fluctuations. Notably, distinct differences were noted postcontrol group assessment, particularly between the olfactory and olfactory–visual interaction interventions. In terms of beta brainwave amplitude variability, clear variances emerged across the three configurations, which primarily engaged two stimulus modalities combinations: visual and olfactory, visual and combined olfactory–visual presentations.

3.3. Changes in Psychological Indicator Data

3.3.1. The Alterations Observed in State Anxiety Scale Scores

The results of the paired sample T-test indicate no substantial variation in state anxiety levels among subjects post presentation of the pine scent (before, M = 34.09, SD = 7.68, during, M = 33.65, SD = 7.85, p > 0.05) and olfactory–visual interaction stimuli (before, M = 34.25, SD = 5.89, during, M = 31.50, SD = 7.96, p > 0.05). Upon observing the pine forest landscape, there was a notable reduction in state anxiety (before, M = 36.13, SD = 7.55; during, M = 30.96, SD = 4.59, p < 0.05) (Table 4).
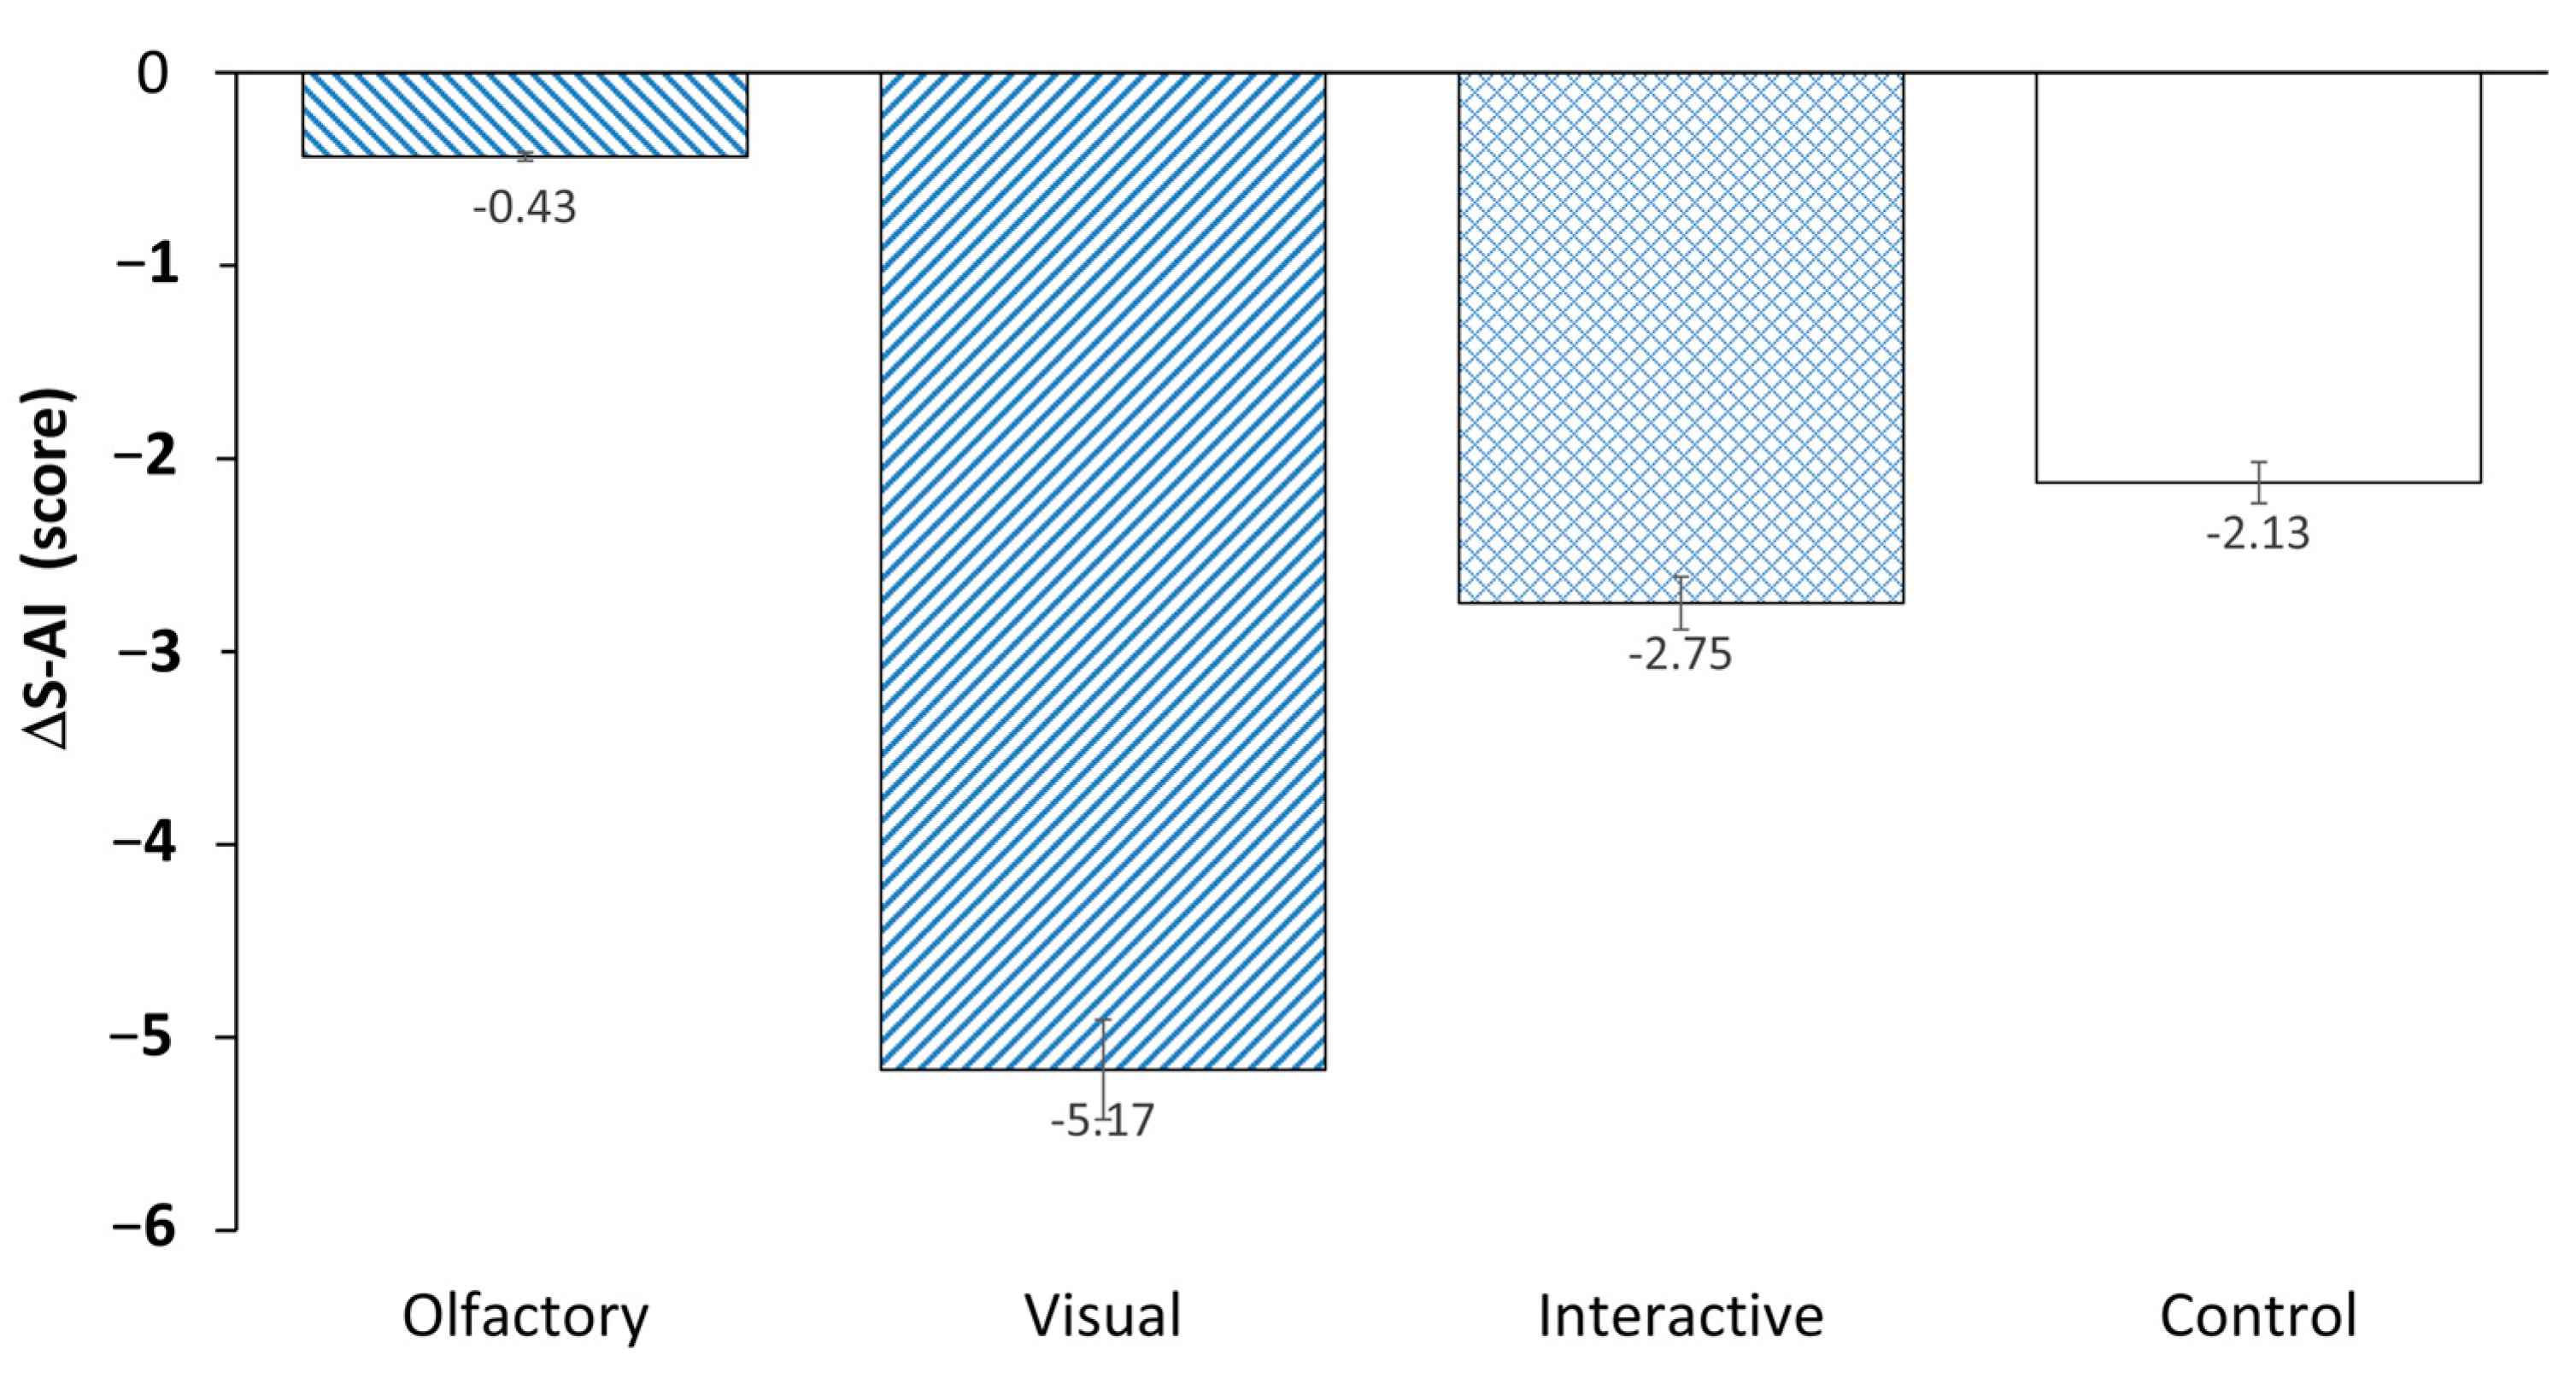
In Figure 8, the average performance of S-AI relative to the baseline across the four stimulation conditions is depicted. While no statistically significant disparity was observed in the overall score of S-AI between the experimental groups and the control group, a discernible downward trend became apparent in the scores of all groups.

3.3.2. The Alterations Observed in Odor Emotion SD Scale Scores

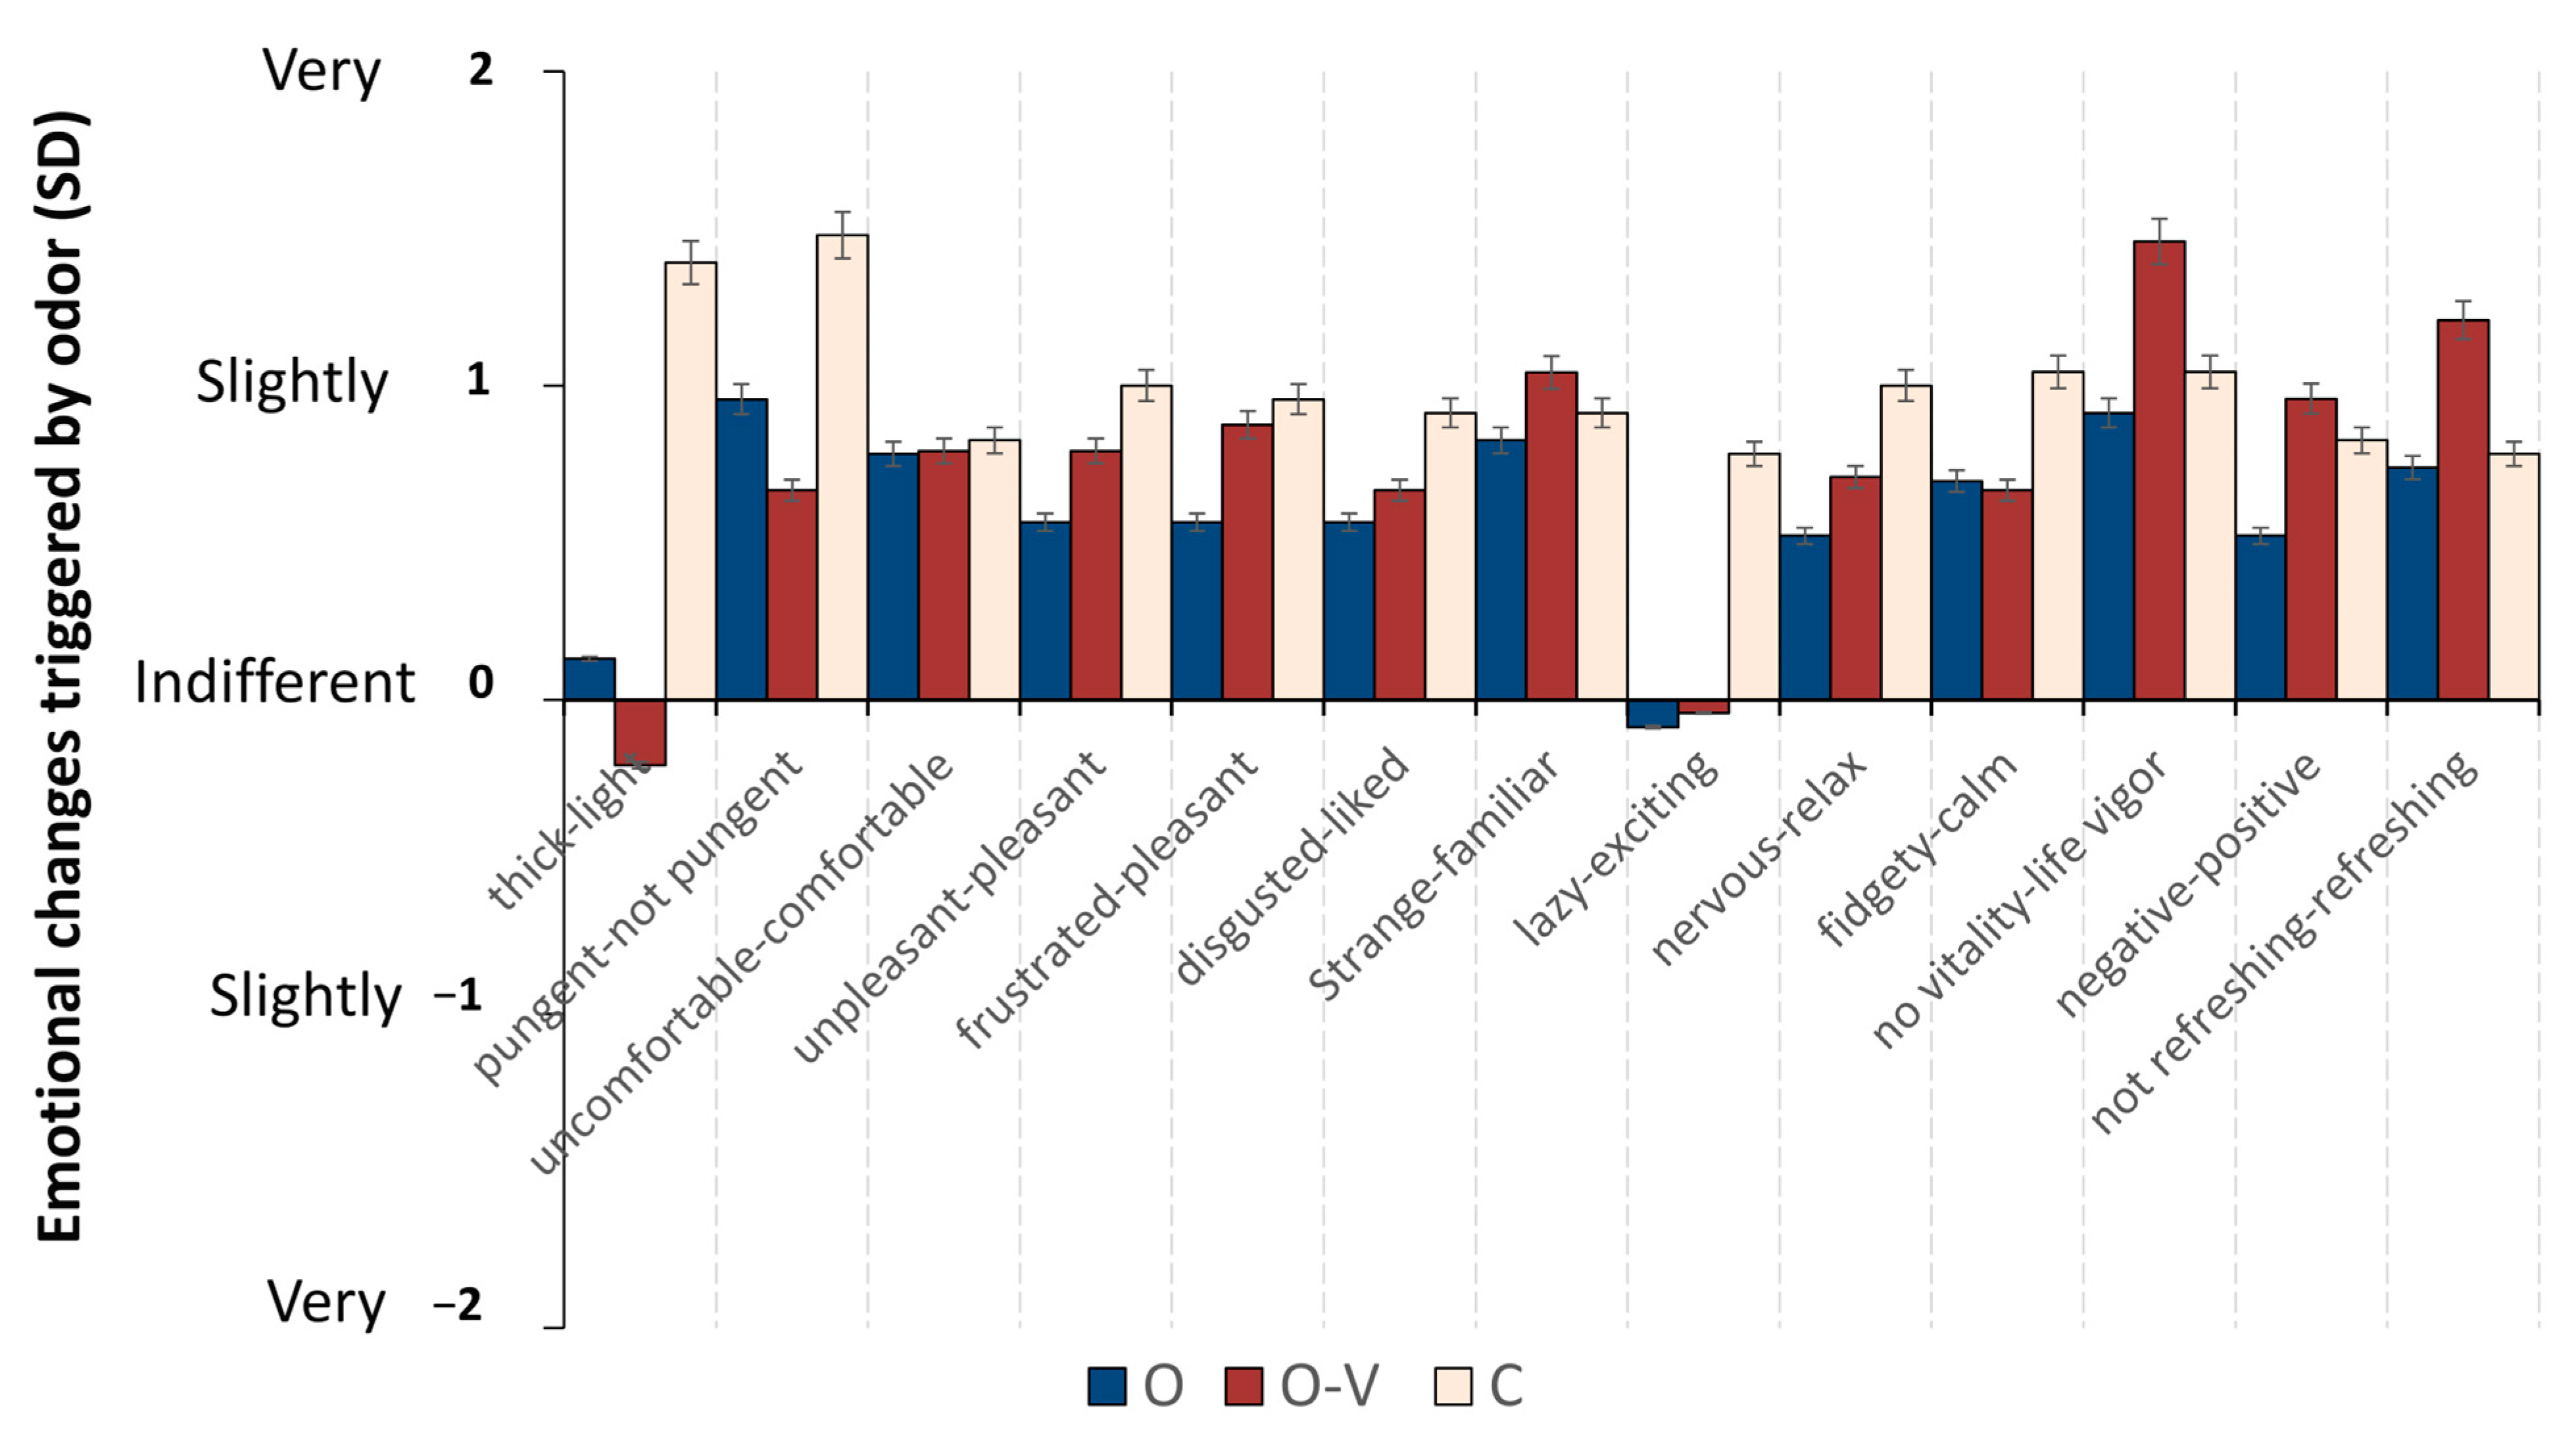
The alterations in odor emotion score measurements, as depicted in Figure 9, are displayed pre and post exposure to various stimulus types. After exposure to the pine scent alone, subjects described the odor as being less intense compared with when they simultaneously experienced the scent with visual imagery of a pine forest. Specifically, the pine scent alone was perceived as less “thick” and “pungent” compared with when combined with the visual stimulus. When the pine scent was combined with visual imagery of the pine forest, subjects reported that the scent was more “pleasant”, “liked”, “familiar”, “relaxed”, “energetic”, “positive”, and “refreshing” compared with when only the scent was presented. This suggests that the visual component enhances the overall sensory experience of the pine aroma, making it more favorable in terms of various emotional attributes.

3.3.3. The Diverse Psychological Impacts of Various Stimuli Linked to a Garden’s Smellscape

The statistical evaluation through ANOVA and subsequent LSD post hoc assessments did not yield any discernible statistical disparities in the aggregate score of the S-AI pre- and post exposure to the diverse stimuli.
Wilcoxon rank sum tests were conducted on the odor-emotion SD scale data across all groups, revealing statistically significant differences in the average scores for three adjective pairs: “thick–light” (p = 0.000), “lazy–exciting” (p = 0.046), and “no vitality–life vigor” (p = 0.005) (Table 5).
Regarding the “thick–light” descriptor, subjects perceived a significant difference between the pine scent and the air control, with the pine scent being rated as “obviously thick” (p < 0.1) (Figure 9). Nonetheless, no statistically significant disparity was observed between the pine-scented and pine olfactory–visual interaction groups (Z = −0.810, Sig.(two-tailed) = 0.418), suggesting that the intensity of the pine scent was not affected by the presence of visual stimuli when both were at the same concentration.
No notable distinction was observed between the olfactory and olfactory–visual interaction groups with respect to the descriptor “lazy–exciting”, indicating that the perception of the pine scent as “languid” or “exhilarating” was not influenced by the visual stimuli. However, significant disparities were noted between the experimental groups (olfactory vs. control: Z = −2.383, Sig.(two-tailed) = 0.017; olfactory–visual interactive vs. control: Z = −2.318, Sig.(two-tailed) = 0.02), indicating notable distinctions in outcomes. This suggests that the pine scent, whether alone or with visual stimuli, was perceived as substantially more “lazy” in comparison with the air control.
Regarding “no vitality–life vigor”, a notable distinction was observed between the olfactory group and the olfactory–visual interaction group (Z = −1.973, Sig.(two-tailed) = 0.049). After introducing the visual stimulus, respondents perceived the pine scent as more “active”, indicating that the visual component had a notable effect on the subjective perception of the scent’s “vitality”.

4. Discussion

4.1. Investigation into the Impact of Olfactory Cues on Physiological Parameters

SC is governed by the sympathetic nervous system and is considered a reliable measure of emotional arousal [106]. According to Baer et al. [107], there was no significant difference in cutaneous electrical responses triggered by olfactory stimuli, consistent with the results of our investigation. Our results show that both SC and PP values significantly decreased from prestimulus levels upon exposure to pine scents. Nonetheless, no statistically significant variations were observed in these physiological parameters when compared with the control group. This aligns with previous research where the impact of plant odors on ANS indicators such as blood pressure and pulse was minimal. According to Jo et al. [63], the olfactory characteristic of Pinus densiflora was not found to have a significant impact on human cardiovascular parameters. Similarly, Fan et al. [108] observed no significant changes in ANS-related indices like systolic blood pressure and heart rate after exposure to plant aromas such as those from Rosa setate × R. rugosa.
Regarding CNS metrics, our study found a significant decline in alpha (α) and beta (β) wave amplitudes following pine scent exposure, but these changes were not statistically significant when compared with the control group. Lorig [109] found similar results in their study of EEG responses to odors, suggesting that α wave activity did not show notable effects. They speculated that this might be due to participants’ expectations of the smell, potentially influencing their EEG responses. Kim et al. [110] suggested that CNS activity could be activated during mental tasks but not during rest, which might explain why EEG features were not distinctly affected by the resting state of the participants in this study. This implies that while EEG technology is sensitive, it may require more nuanced experimental designs to capture meaningful variations in brainwave activity during olfactory stimulation.

4.2. Investigation into the Impact of Visual Cues on Physiological Parameters

This study observed a significant decrease in SBP, PP, and SC during exposure to pine landscape visuals. However, these changes were not statistically significant compared with the control group. In contrast to prior studies like Wang et al.s’ [111], who observed a substantial rise in SC following a 1–3 min viewing of bamboo forest videos, this discovery presents a differing outcome. The discrepancy may be due to differences between static images and dynamic videos in their effects on the autonomic nervous system. Additionally, variations in the type of plant landscapes might contribute to different physiological responses.
In contrast, our research group’s previous study demonstrated a significant increase in SC when participants viewed landscapes featuring lawns, roses, and Osmanthus [112]. This study also found that the amplitude of α and β brainwaves significantly increased compared with the control group during visual stimulation. Notably, the β wave amplitude was significantly higher in the visual stimulation group than in the olfactory stimulation group, indicating that visual stimuli may have a stronger impact on CNS activity than olfactory stimuli. This supports the long-standing notion that the visual system is a primary channel for humans to receive and process environmental information [113].

4.3. Investigation into the Impact of Synchronized Olfactory–Visual Cues on Physiological Response Metrics

Our research revealed a statistically significant elevation in SC values during concurrent olfactory–visual stimulation compared with the control group, surpassing the increments noted from isolated olfactory or visual stimulation. This suggests that olfactory–visual interaction may induce a heightened sympathetic nervous response, possibly due to a cumulative effect of combined sensory inputs. It appears that the combination of visual and olfactory stimuli can elicit a stronger emotional and sympathetic reaction than either stimulus alone. This heightened response could be attributed to the subconscious emotional and sympathetic excitation triggered by the simultaneous exposure to both olfactory and visual stimuli related to garden plants.
Song et al. [79] noted that sequential exposure to sensory stimuli derived from forests, involving both olfaction and vision, influenced parasympathetic activity in a cumulative manner. However, sympathetic reactions did not exhibit a corresponding pattern, which corresponds to our research outcomes to some extent. The precise mechanisms responsible for this phenomenon continue to elude comprehension, with a specific emphasis on the interplay between visual cues and olfactory perception [42]. Andrea Buettner’s [114] research suggests that central and peripheral nervous system responses may operate independently, which might help explain the observed effects.
The alterations in alpha and beta brainwave amplitudes during concurrent olfactory–visual stimulation exhibited an intermediate pattern, reflecting their unique dynamics when compared with individual olfactory and visual stimulations. This suggests a compromise effect in CNS activity, where the level of brain activation due to the combined sensory input is between that elicited by pure visual or olfactory stimuli. This may reflect a balanced effect, with the calming, relaxing, and refreshing sensations induced by the combined stimuli falling between the effects of each stimulus type independently.

4.4. Investigation into the Impact of Olfactory, Visual, and Their Interactions on Psychometric Measures

The results from the S-AI scale indicate a general downward trend in anxiety scores across all stimulus conditions. Although no statistically significant differences were observed relative to the control group, this trend suggests that both olfactory and visual-olfactory interactive stimuli related to pine forests may help alleviate anxiety to some extent. This finding aligns with previous research showing that plant-based environments can reduce psychological anxiety. For example, Zhang et al. [115] found that ornamental plant landscapes help alleviate psychological anxiety, while Kritsidima et al. [116] and Karaman et al. [117] demonstrated that lavender scent can significantly reduce anxiety in dental and surgical patients. This might be because human sensory systems are biologically adapted to natural environments with plants [118].
Interestingly, despite previous findings suggesting that odor stimuli are more effective at evoking emotional responses than other sensory stimuli [111], the results from the S-AI scale do not show a greater relaxation effect for the visual-olfactory interaction compared with individual stimuli. Instead, the effect was intermediate.
According to the SD scale results, the pine forest smellscape is perceived as more dynamic, uplifting, and odorous when both seen and smelled, despite the odor concentration being the same across all test conditions. This suggests that the interaction between olfactory and visual stimuli can enhance positive mental perceptions of the environment. Our current findings align with those previously reported by Shankar et al. [119], who noted that congruence between olfactory and visual cues enhances positive psychological perceptions of the environment.
Neuroscientific studies offer some explanation for these effects. Gottfried et al. [120] found that the integration of olfactory and other sensory modalities can improve odor perception. The orbitofrontal cortex, which is involved in multimodal integration, receives afferent inputs from both the primary olfactory cortex and visual association areas [121]. Single neurons in the orbitofrontal cortex have been shown to respond to olfactory and visual stimuli either separately or simultaneously [122]. This suggests that the brain’s ability to integrate multimodal sensory information may contribute to the enhanced positive perceptions observed in this study.

5. Conclusions

Olfactory–visual interaction stimuli, related to the smellscape of garden plants, can contribute to relaxation, vitality restoration, and an uplifting spirit. This study found that in olfactory–visual interaction, the central nervous system’s activity is intermediate between responses to single-olfactory and single-visual stimuli, showing a compromise effect. However, the excitement of the autonomic nervous system is notably higher with olfactory–visual interaction, indicating a cumulative effect compared with a single stimulus.
Although the anxiety-relieving effects of olfactory–visual interaction were not significantly greater than those of individual visual or olfactory stimuli, it was found to enhance positive mental perceptions of the environment more effectively than either type of stimulus alone.
The study revealed that while visual stimuli significantly affected brain-wave responses, odor stimuli did not produce significant brain-wave changes. This suggests that EEG techniques are sensitive in olfactory tests but that more varied experimental designs are needed to fully capture EEG activities. Future experimental designs should include tasks requiring mental activities rather than simply resting to better characterize EEG responses.
In today’s fast-paced society, exposure to the olfactory and visual stimulation of fragrant plants in parks or along streets can help alleviate stress and promote mental well-being, making a significant contribution to public health. The findings of this research provide crucial data to support such an approach and contribute to the theoretical foundation for scent landscape design in horticulture. However, this study has certain limitations, including an overrepresentation of young participants. Future research should expand the sample to include individuals from diverse age groups, educational backgrounds, life experiences, occupations, and cultural contexts to provide a more comprehensive validation of the findings. Additionally, although this study’s experimental design incorporated olfactory, visual, and combined sensory stimuli—considered scientifically innovative—there are other environmental factors present in green spaces, such as sound and other sensory inputs. Future studies could integrate these elements to further substantiate the positive impact of green spaces on health.

Author Contributions

Conceptualization, X.Z. and Q.Z.; methodology, X.Z. and Q.Z.; software, X.Z.; formal analysis, X.Z.; resources, X.Z.; data curation, X.Z.; writing—original draft preparation, X.Z.; writing—review and editing, X.Z.; visualization, X.Z.; supervision, Q.Z. All authors have read and agreed to the published version of the manuscript.

Funding

The present investigation received financial support from the Natural Science Foundation of Shaanxi Province, the founder: Shaanxi Provincial Department of Science and Technology, the funding number: 2023-JC-YB-205.

Data Availability Statement

The data can be obtained upon request from the authors.

Acknowledgments

We extend our heartfelt appreciation to the College of Landscape Architecture and Art at Northwest A&F University for their invaluable platform support. We are also grateful to Ling Qu, Tian Gao, Ruijie Hao, Xingyue Fang, Xiaowan Zhang, Jiayu Guo, and the anonymous reviewers who have contributed their insightful comments on earlier drafts of this document.

Conflicts of Interest

No conflicting interests are declared by the authors.

References

  1. Lederbogen, F.; Kirsch, P.; Haddad, L.; Streit, F.; Tost, H.; Schuch, P.; Wüst, S.; Pruessner, J.C.; Rietschel, M.; Deuschle, M. City living and urban upbringing affect neural social stress processing in humans. Nature 2011, 474, 498–501. [Google Scholar] [CrossRef] [PubMed]
  2. Yin, L.; Zhang, Y.; Yang, X.; Wan, M. Research and construction of healthy landscape of residential green space in Wuhan in the post-epidemic era. Chin. Garden 2021, 37, 14–19. [Google Scholar]
  3. Selmi, W.; Weber, C.; Rivière, E.; Blond, N.; Mehdi, L.; Nowak, D. Air pollution removal by trees in public green spaces in Strasbourg city, France. Urban For. Urban Green. 2016, 17, 192–201. [Google Scholar] [CrossRef]
  4. Liu, L.C.; Seyler, B.; Liu, H.; Feng, C.; Wang, Q.; Li, Y. Biogenic volatile organic compound emission patterns and secondary pollutant formation potentials of dominant greening trees in Chengdu, southwest China. J. Environ. Sci. 2022, 114, 179–193. [Google Scholar] [CrossRef]
  5. Kaan, I.; Ismail, K.; Ramazan, E.; Hakan, S. Atmospheric Cd, Cr, and Zn. Deposition in Several Landscape Plants in Mersin, Türkiye. Water Air Soil Pollut. 2022, 233, 05607–05608. [Google Scholar]
  6. Jennifer, D.; Waliczek, T.M.; Zajicek, J.M. The Relationship between Levels of Greenery and Landscaping at Track and Field Sites, Anxiety, and Sports Performance of Collegiate Track and Field Athletes. Hort Technol. 2011, 21, 329–335. [Google Scholar]
  7. Chris, N.; Alistair, G.; Suyin, L.P.C.; Sanjiana, M.; Mehdi, B.; Jenny, R. Color Aesthetics: A transatlantic comparison of psychological and physiological impacts of warm and cool colors in garden landscapes. Wellbeing Space Soc. 2021, 2, 100038. [Google Scholar]
  8. Thorpert, P. Green Is Not Just Green-Human Colour Perception in Urban Green Contexts. Doctoral Dissertation, Swedish University of Agricultural Sciences, Alnarp, Sweden, 2019. [Google Scholar]
  9. Chen, X.; Wang, Y.; Huang, T.; Lin, Z. Research on Digital Experience and Satisfaction Preference of Plant Community Design in Urban Green Space. Land 2022, 11, 1411. [Google Scholar] [CrossRef]
  10. Kang, N.; Xiu, M.L. Effects of visual characteristics of different plant community types on human psychology. Chin. J. Northwest For. Univ. 2017, 32, 315–320. [Google Scholar]
  11. Song, R.; Chen, Q.; Zhang, Y.; Jia, Q.A.; He, H.; Gao, T.; Qiu, L. Psychophysiological restorative potential in cancer patients by virtual reality (VR)-based perception of natural environment. Front. Psychol. 2022, 13, 1003497. [Google Scholar] [CrossRef]
  12. Lee, M.; Kim, E.; Choe, J.; Choi, S.; Ha, S.; Kim, G. Psychological Effects of Green Experiences in a Virtual Environment: A Systematic Review. Forests 2022, 13, 1625. [Google Scholar] [CrossRef]
  13. Moss, M.; Cook, J.; Wesnes, K.; Duckett, P. Aromas of rosemary and lavender essential oils differentially affect cognition and mood in healthy adults. Int. J. Neurosci. 2003, 113, 15–38. [Google Scholar] [CrossRef]
  14. Brawley, E.C. Gardens of Memories. Alzhmer’s Care Today 2004, 5, 154–164. [Google Scholar]
  15. Cohen Mansfield, J.; Werner, P. Outdoor Wandering Parks for Persons with Dementia. Alzheimer Dis. Assoc. Disord. 1999, 13, 109–117. [Google Scholar] [CrossRef] [PubMed]
  16. Bhat, L.C. Benefits and Attributes of Plants & Aromatherapy within A Healthcare Environment and Their Influence on Healthy & Longevity. Int. J. Complement. Altern. Med. 2017, 8, 13–14. [Google Scholar]
  17. Cen, C.T.; Lei, Y. Studies on the antidepressant effects of essential oils of Rosemary and lemongrass and in vivo aromas. J. Shanghai JiaoTong Univ. (Agric. Sci.) 2009, 1, 82–85. [Google Scholar]
  18. Jie, O.Y.; Xiao, D.W.; Bing, Z. Research progress in the application of spice plants. Fragr. Cosmet. 2002, 5, 32–34. [Google Scholar]
  19. Ming, S.; Ping, L.; Jin, H.L.; Qi, X.Z. Functions and garden applications of aromatic plants. Pract. Technol. For. 2007, 2, 46–47. [Google Scholar]
  20. Baik, H.J.; Kim, H.J.; Jae, S.Y.; Yi, B.Y. Effects of Fragrance Components of Abies holophylla Max. on Stress Relief and Improvement of Vascular Function. J. People Plants Environ. 2018, 21, 223–232. [Google Scholar] [CrossRef]
  21. Porteous, J.D. Smellscape. Prog. Hum. Geogr. 1985, 9, 356–378. [Google Scholar] [CrossRef]
  22. Xiao, J.; Tait, M.; Kang, J. A perceptual model of smellscape pleasantness. Cities 2018, 76, 105–115. [Google Scholar] [CrossRef]
  23. Young, B.D. Perceiving Smellscapes. Pac. Philos. Q. 2020, 101, 203–223. [Google Scholar] [CrossRef]
  24. Batty, C. Olfactory Experience I: The Content of Olfactory Experience. Philos. Compass 2010, 5, 1137–1146. [Google Scholar] [CrossRef]
  25. Koutsoklenis, A.; Papadopoulos, K. Olfactory Cues Used for Wayfinding in Urban Environments by Individuals with Visual Impairments. J. Vis. Impair. Blind. 2011, 105, 692–702. [Google Scholar] [CrossRef]
  26. Young, B.D. Smelling matter. Philos. Psychol. 2016, 129, 520–534. [Google Scholar] [CrossRef]
  27. Becky, M. Smelling objects. Synthese 2017, 196, 4279–4303. [Google Scholar]
  28. Zardini, M. Sense of the City: An Alternate Approach to Urbanism. J. Soc. Telegr. Eng. 2005, 5, 67. [Google Scholar]
  29. Gloor, P. Inputs and Outputs of the Amygdala: What the Amygdala is Trying to Tell the Rest of the Brain; Springer: Berlin/Heidelberg, Germany, 1978; pp. 189–209. [Google Scholar]
  30. Cabanac, M. What is emotion? Behav. Process. 2002, 60, 69–83. [Google Scholar]
  31. Kabat-Zinn, J. Smellscape. Mindfulness 2014, 1, 100–101. [Google Scholar] [CrossRef]
  32. Willander, J.; Larsson, M. Smell Your Way Back to Childhood: Autobiographical Odor Memory. Psychon. Bull. Rev. 2006, 13, 240–244. [Google Scholar] [CrossRef] [PubMed]
  33. Wilson, D.A.; Stevenson, R.J. The fundamental role of memory in olfactory perception. Trends Neurosci. 2003, 26, 243–247. [Google Scholar] [CrossRef]
  34. Herz, R.S. Are Odors the Best Cues to Memory? A Cross㎝odal Comparison of Associative Memory Stimulia. Ann. N. Y. Acad. Sci. 1998, 855, 670–674. [Google Scholar] [CrossRef]
  35. Schooler, H. A Naturalistic Study of Autobiographical Memories Evoked by Olfactory and Visual Cues: Testing the Proustian Hypothesis. Am. J. Psychol. 2002, 115, 21–32. [Google Scholar]
  36. Engen, T.; Ross, B.M. Long-term memory of odors with and without verbal descriptions. J. Exp. Psychol. 1973, 100, 221. [Google Scholar] [CrossRef]
  37. Chitty, S.L. The Beast and the Monk: A Life of Charles Kingsley; Hodder and Stoughton: London, UK, 1974; pp. 313–314. [Google Scholar]
  38. Antje, H.; Henriette, M.; Ilona, C.; Thomas, H. Influence of room fragrance on attention, anxiety and mood. Flavour Fragr. J. 2017, 32, 24–28. [Google Scholar]
  39. Fletcher, M.L.; Wilson, D.A. Olfactory bulb mitral-tufted cell plasticity: Odorant-specific tuning reflects previous odorant exposure. J. Neurosci. 2003, 23, 6946–6955. [Google Scholar] [CrossRef]
  40. Li, W.; Howard, J.D.; Parrish, T.B.; Gottfried, J.A. Aversive learning enhances perceptual and cortical discrimination of indiscriminable odor cues. Science 2008, 319, 1842–1845. [Google Scholar] [CrossRef]
  41. Otazu, G.H.; Chae, H.; Davis, M.B.; Albeanu, D.F. Cortical feedback decorrelates olfactory bulb output in awake mice. Neuron 2015, 86, 1461–1477. [Google Scholar] [CrossRef]
  42. Distel, H.; Ayabe-Kanamura, S.; Margarita, M.; Ina, S.; Sachiko, S.; Robyn, H. Perception of everyday odors—Correlation between intensity, familiarity and strength of hedonic judgement. Chem. Sens. 1999, 24, 191–199. [Google Scholar] [CrossRef]
  43. Laing, D.G.; Legha, P.K.; Jinks, A.L.; Hutchinson, I. Relationship between molecular structure, concentration and odor qualities of oxygenated aliphatic molecules. Chem. Sens. 2003, 28, 57–69. [Google Scholar] [CrossRef] [PubMed]
  44. Gilbert, A.N. What the Nose Knows: The Science of Scent in Everyday Life; Crown Publishers: New York, NY, USA, 2008; p. 141. [Google Scholar]
  45. Todrank, J. Odors can change preferences for people in photographs: A cross-modal evaluative conditioning study with olfactory USs and visual CSs. Learn. Motiv. 1995, 26, 116–140. [Google Scholar] [CrossRef]
  46. Thomas, H.; Therese, F.; Daniel, B.; Jonathan, W.; Cornelia, B.H.; Valentin, A.S. The Rewarding Effect of Pictures with Positive Emotional Connotation upon Perception and Processing of Pleasant Odors—An FMRI Study. Front. Neuroanat. 2017, 11, 19. [Google Scholar]
  47. Tuan, Y. Topophilia: A Study of Environmental Perception, Attitudes, and Values; Columbia University Press: New York, NY, USA, 1974; pp. 5–11. [Google Scholar]
  48. Chen, W.; Chen, K.; Zhou, B.; Zhou, W. Integration of olfactory and sensory information. Sci. Technol. Rev. 2017, 35, 29–36. [Google Scholar]
  49. Moskowitz, H.R.; Dravnieks, A.; Klarman, L.A. Odor intensity and pleasantness for a diverse set of odorants. Percept. Psychophys. 1976, 19, 122–128. [Google Scholar] [CrossRef]
  50. Thurstone, L.L. A law of comparative judgment. Psychol. Rev. 1927, 34, 273. [Google Scholar] [CrossRef]
  51. Peryam, D.R.; Pilgrim, F.J. Hedonic scale method of measuring food preferences. Food Technol. 1957, 11, 9–14. [Google Scholar]
  52. Stevens, S.S. To honor Fechner and repeal his law. Science 1961, 133, 80–86. [Google Scholar] [CrossRef]
  53. Buettner, A. (Ed.) Springer Handbook of Odor; Springer: Cham, Switzerland, 2017; pp. 101–102. [Google Scholar]
  54. McReynolds, P.; Ludwig, K. On the history of rating scales. Personal. Individ. Differ. 1987, 8, 281–283. [Google Scholar] [CrossRef]
  55. Young, P.T. Constancy of Affective Judgment to Odors. J. Exp. Psychol. 1923, 6, 182. [Google Scholar] [CrossRef]
  56. Henshaw, V. Urban Smellscapes: Understanding and Designing City Smell Environments; Routledge: London, UK, 2013; p. 42. [Google Scholar]
  57. Li, X. The Influence of Garden Plant Color on Human Physiology and Psychology; Beijing Forestry University Article: Beijing, China, 2012; p. 37. [Google Scholar]
  58. McCorry, L.K. Physiology of the autonomic nervous system. Am. J. Pharm. Educ. 2007, 71, 78. [Google Scholar] [CrossRef]
  59. Matsumoto, T. Aromatic effects of a Japanese citrus fruit—Yuzu (Citrus junos Sieb. ex Tanaka)-on psychoemotional states and autonomic nervous system activity during the menstrual cycle: A single-blind randomized controlled crossover study. Jpn. J. Psychosom. Med. 2017, 57, 292. [Google Scholar] [CrossRef] [PubMed]
  60. Benarroch, E.E. Primer on the Autonomic Nervous System, 2nd ed.; Academic Press: Cambridge, MA, USA, 2004; pp. 17–19. [Google Scholar]
  61. Park, B.J.; Tsunetsugu, Y.; Kasetani, T.; Kagawa, T.; Milyazaki, Y. The physiological effects of Shinrin-yoku (taking in the forest atmosphere or forest bathing): Evidence from field experiments in 24 forests across Japan. Environ. Health Prev. Med. 2010, 15, 18–26. [Google Scholar] [CrossRef] [PubMed]
  62. Harumi, I.; Chorong, S.; Miyazaki, Y. Physiological effect of olfactory stimulation by Hinoki cypress (Chamaecyparis obtusa) leaf oil. J. Physiol. Anthropol. 2015, 34, 1–7. [Google Scholar]
  63. Tsunetsugu, Y.; Park, B.J.; Miyazaki, Y. Trends in research related to “Shinrin-yoku” (taking in the forest atmosphere or forest bathing) in Japan. Environ. Health Prev. Med. 2010, 15, 27–37. [Google Scholar] [CrossRef]
  64. Mountz, J.M. Central Nervous System; Springer: New York, NY, USA, 1986; p. 37. [Google Scholar]
  65. Skingsley, D.R. Introduction to the Central Nervous System; Springer: New York, NY, USA, 2008; p. 53. [Google Scholar]
  66. Kim, S.M.; Park, S.; Hong, J.W.; Jang, E.J.; Pak, C.H. Psychophysiological effects of orchid and rose fragrances on humans. Hortic. Sci. Technol. 2016, 34, 472–487. [Google Scholar] [CrossRef]
  67. Sobel, H.N. Prediction Models for the Pleasantness of Binary Mixtures in Olfaction. Chem. Sens. 2008, 33, 599–609. [Google Scholar]
  68. Katata, K.; Sakai, N.; Doi, K.; Kawamitsu, H.; Fuji, M.; Sugimura, K.; Nibu, K. Functional MRI of regional brain responses to ‘pleasant’ and ‘unpleasant’ odors. Acta Otolaryngol. Suppl. 2009, 129, 85–90. [Google Scholar] [CrossRef]
  69. Kermen, F.; Chakirian, A.; Sezille, C.; Joussian, P.; Le, G.; Ziessel, A.; Chastrette, M.; Mandairon, N.; Didier, A.; Rouby, C.; et al. Molecular complexity determines the number of olfactory notes and the pleasantness of smells. Sci. Rep. 2011, 1, 11–32. [Google Scholar] [CrossRef]
  70. Chen, B.; Yu, J.; Tang, Y.; Zhang, C.; Chen, R.; Xu, F. A comparative analysis of electromyography biofeedback electrical stimulation therapy for stroke patients with shoulder joint subluxation at different stimulation sites and directions. Chin. Gener. Pract. 2020, 23, 540–546. [Google Scholar]
  71. Yamaguchi, M.; Kanemori, T.; Kanemaru, M.; Mizuno, Y.; Yoshida, H. Correlation of Stress and Salivary Amylase Activity. Jpn. J. Med. Electron. Biol. Eng. 2001, 39, 234–239. [Google Scholar]
  72. Wang, D.; Wang, X.; Ma, H. Handbook of Psychological Health Assessment (Revised Edition). Beijing Chin. J. Psychol. Health 1999, 2, 77–79. [Google Scholar]
  73. Jo, H.; Rodiek, S.; Fujii, E.; Miyazaki, Y.; Park, B.J. Physiological and Psychological Response to Floral Scent. HortScience 2013, 48, 82–88. [Google Scholar] [CrossRef]
  74. Jo, H.; Fujii, E.; Cho, T. An experimental study on physiological and psychological effects of pine scent. Methods Inform. Med. 2010, 38, 1–10. [Google Scholar]
  75. Morita, E.; Fukuda, S.; Nagano, J.; Hamajima, N.; Yamamoto, H.; Iwai, Y.; Nakashima, T.; Ohira, H.; Shirakawa, T. Psychological effects of forest environments on healthy adults: Shinrinyoku (forest-air bathing, walking) as a possible method of stress reduction. Public Health 2007, 121, 54–63. [Google Scholar] [CrossRef] [PubMed]
  76. Ikei, H.; Song, C.; Miyazaki, Y. Effects of olfactory stimulation by α-pinene on autonomic nervous activity. J. Wood Sci. 2016, 62, 568–572. [Google Scholar] [CrossRef]
  77. Sandusky, A.; Parducci, A. Pleasantness of odors as a function of the immediate stimulus context. Psychon. Sci. 1965, 3, 321–322. [Google Scholar] [CrossRef]
  78. Igarashi, M.; Yamamoto, T.; Lee, J.; Song, C.; Ikei, H.; Miyazaki, Y. Effects of stimulation by three-dimensional natural images on prefrontal cortex and autonomic nerve activity: A comparison with stimulation using two-dimensional images. Cogn. Process. 2014, 15, 551–556. [Google Scholar] [CrossRef]
  79. Song, C.; Ikei, H.; Miyazaki, Y. Physiological effects of forest-related visual, olfactory, and combined stimuli on humans: An additive combined effect. Urban For. Urban Green. 2019, 44, 126437. [Google Scholar] [CrossRef]
  80. Sun, M.; Kim, H. Progress in Research on the Impact of Japanese Plant Odors on Human Health. World For. Res. 2020, 5, 108–112. [Google Scholar]
  81. Huo, X. Analysis of Volatile Components from Four Aromatic Plants and Their Intervention Effects on Human Health. Master’s Thesis, Zhejiang Agriculture and Forestry University, Zhejiang, China, 2019. [Google Scholar]
  82. Fang, M. A Study on the Influence of Floral Fragrance and Environmental Sound on Psychological Well-Being. Ph.D. Thesis, National Taiwan University, Taiwan, China, 2016. [Google Scholar]
  83. Ba, M.; Kang, J. A laboratory study of the sound-odour interaction in urban environments. Build. Environ. 2019, 147, 314–326. [Google Scholar] [CrossRef]
  84. Hozumi, H.; Hasegawa, S.; Tsunenari, T.; Snapei, N.; Arashina, Y.; Takahashi, K.; Konnno, A.; Chida, E.; Tomimatsu, S. Aromatherapies using Osmanthus fragrans oil and grapefruit oil are effective complementary treatments for anxious patients undergoing colonoscopy: A randomized controlled study. Complement. Ther. Med. 2017, 34, 165–169. [Google Scholar] [CrossRef] [PubMed]
  85. Jin, H. Mei, the Cultural Significance of Osmanthus and Magnolia: A Study on their Aroma Substances and Impact on Human Health. PhD Thesis, Beijing Forestry University, Beijing, China, 2003. [Google Scholar]
  86. Jia, M. A Study on Volatile Compounds of Several Fragrant Plants in Rehabilitation Landscape and Their Impact on Human Health. Master’s Thesis, Zhejiang Agriculture and Forestry University, Zhejiang, China, 2017. [Google Scholar]
  87. Sona, B.; Loos, H.M. The smell of wood and its impact on physiological responses. Int. J. Psychophysiol. 2018, 131, S40. [Google Scholar]
  88. Kim, D.S.; Goo, Y.M.; Cho, J.; Lee, J.; Lee, D.Y.; Sin, S.M.; Shin, E.C. Effect of Volatile Organic Chemicals in Chrysanthemum indicum Linné on Blood Pressure and Electroencephalogram. Molecules 2018, 23, 2063. [Google Scholar] [CrossRef]
  89. Xiao, Y.; Li, L.; Xie, Y.; Xu, J.; Liu, Y. The Effects of Aromatherapy and Music Intervention on Pain and Anxiety in Breast Cancer Patients During the Perioperative Period. J. Cent. South Univ. (Med. Ed.) 2018, 43, 656–661. [Google Scholar]
  90. Wang, C.; Wang, Z.; Zhuang, G.; Jin, C. The Effects of Auricular Acupuncture Combined with Aromatherapy on Stress Response in Colorectal Cancer Surgical Patients. Chin. Nurs. J. 2013, 48, 623–625. [Google Scholar]
  91. Biswas, D.; Labrecque, L.I.; Lehmann, D.R. Effects of Sequential Sensory Cues on Food Taste Perception: Cross odal Interplay Between Visual and Olfactory Stimuli. J. Consum. Psychol. 2021, 31, 746–764. [Google Scholar] [CrossRef]
  92. Sabiniewicz, A.; Schaefer, E.; Cagdas, G.; Cedric, M.; Moustafa, B.; Nadejda, K.; Gabriele, N.; Thomas, H. Smells Influence Perceived Pleasantness but Not Memorization of a Visual Virtual Environment. i-Perception 2021, 12, 2041669521989731. [Google Scholar] [CrossRef] [PubMed]
  93. Bhatt, R.R.; Koenig, J.; Wilker, F.W.; Hillecke, T.K.; Thayer, J.F. Event-related response in skin conductance to six musical emotions—A replication study. In Psychophysiology; Wiley: Hoboken, NJ, USA, 2014; pp. 51–57. [Google Scholar]
  94. Fu, H.; Niu, J.; Wu, Z.; Cheng, B.; Guo, X.; Zuo, J. Exploration of public stereotypes of supply-and-demand characteristics of recycled water infrastructure—Evidence from an event-related potential experiment in Xi’an, China. J. Environ. Manag. 2022, 322, 116103. [Google Scholar] [CrossRef] [PubMed]
  95. Kang, N.; Li, S.H.; Li, F.H. Study on the effect of landscape on human psychology. Chin. Landsc. Archit. 2008, 7, 69–72. [Google Scholar]
  96. Du, R.; Mehmood, R.M.; Lee, H.J. Alpha activity during emotional experience revealed by ERSP. J. Internet Technol. 2014, 15, 775–782. [Google Scholar]
  97. Yu, C.; Wang, M. Survey of emotion recognition methods using EEG information. Cogn. Robot 2022, 2, 132–146. [Google Scholar] [CrossRef]
  98. Jin, H.X. The Material Basis of Culture and Fragrance of Prunus mume and Osmanthus fragrans and Its Effect on Human Health. Ph.D. Thesis, Beijing Forestry University, Beijing, China, 2003. [Google Scholar]
  99. Lee, S.J.; Kim, H.; Oh, B.K.; Choi, H.; Lee, J.Y.; Lee, S.H.; Kim, B.J.; Kim, B.S.; Kang, J.H.; Kang, J.; et al. Association of inter-arm systolic blood pressure differences with arteriosclerosis and athero-sclerosis: A cohort study of 117,407 people. Atherosclerosis 2022, 58, 34219–34224. [Google Scholar]
  100. Wen, C.; Jiang, C.; Wu, Y.; Zhou, H. Comparison of the effects of square dancing and brisk walking on cardiovascular function in middle-aged and elderly women. Chin. J. Henan Normal Univ. (Nat. Sci. Ed.) 2019, 48, 109–117. [Google Scholar]
  101. Zheng, H. Environmental Quality Evaluation of Green Olfactory in Beijing. Ph.D. Thesis, Beijing Forestry University, Beijing, China, 2002. [Google Scholar]
  102. Kang, J.; Zhang, M. Semantic differential analysis of the soundscape in urban open public spaces. Build. Environ. 2010, 45, 150–157. [Google Scholar] [CrossRef]
  103. Lee, J.; Park, B.J.; Tsunetsugu, Y.; Ohira, T.; Kagawa, T.; Milyazaki, Y. Effect of forest bathing on physiological and psychological responses in young Japanese male subjects. Public Health 2011, 125, 93–100. [Google Scholar] [CrossRef]
  104. Osgood, C.; Suci, G.; Tannenbaum, P. The Measurement of Meaning; University of Illinois Press: Urbana, IL, USA, 1957; pp. 51–53. [Google Scholar]
  105. Doty, R.L. An examination of relationships between the pleasantness, intensity, and concentration of 10 odorous stimuli. Percept. Psychophys. 1975, 17, 492–496. [Google Scholar] [CrossRef]
  106. Critchley, H.D. Electrodermal responses: What happens in the brain. Neuroscience 2002, 8, 132–142. [Google Scholar]
  107. Baer, T.; Coppin, G.; Porchero, C.; Cayeux, I.; Sander, D.; Delplanque, S. “Dior, J’adore”: The role of contextual information of luxury on emotional responses to perfumes. Food Qual. Prefer 2017, 69, 36–43. [Google Scholar] [CrossRef]
  108. Fan, T.T.; Yao, L.; Li, Y.L.; Pan, X.H.; Li, Y.H. Acute anti-anxiety effects of aroma substances from three species of aromatic plants. Chin. J. Shanghai Jiaotong Univ. (Agric. Sci. Ed.) 2017, 35, 24–30. [Google Scholar]
  109. Lorig, T.S.; Schwartz, G.E. Brain and odor: I. Alteration of human EEG by odor administration. Psychobiology 1988, 16, 281–284. [Google Scholar] [CrossRef]
  110. Kim, Y.; Watanuki, S. Characteristics of electroencephalographic responses induced by a pleasant and an unpleasant odor. J. Physiol. Anthropol. Appl. Hum. Sci. 2003, 22, 285–291. [Google Scholar] [CrossRef] [PubMed]
  111. Wang, Y.; Jiang, M.; Huang, Y.; Sheng, Z.; Huang, X.; Lin, W.; Lv, B. Physiological and psychological effects of watching videos of different durations showing urban bamboo forests with varied structures. Int. J. Environ. Res. Public Health 2020, 17, 3434. [Google Scholar] [CrossRef] [PubMed]
  112. Zhang, X.; Zhang, Q. Effects of garden plant smell on human health. Chin. Sci. Silvae Sin. 2023, 59, 100–116. [Google Scholar]
  113. Tong, N.; Kuang, S. Gender differences in visual system. Prog. Biochem. Biophys. 2021, 48, 779–787. [Google Scholar]
  114. Buettner, A. Springer Handbook of Odor, Middle Section; Science Press: Beijing, China, 2019; pp. 699–700. [Google Scholar]
  115. Zhang, Z.; Li, X.; Pan, H.W. Evaluation of plant landscape in Shenzhen park green space using AHP method and human physiological and psychological indicators. Chin. J. Beijing For. Univ. (Soc. Sci. Ed.) 2011, 10, 30–37. [Google Scholar]
  116. Kritsidima, M.; Newton, T.; Asimakopoulou, K. The effects of lavender scent on dental patient anxiety levels: A cluster randomised-controlled trial. Commun. Dent. Oral Epidemiol. 2010, 38, 83–87. [Google Scholar] [CrossRef]
  117. Karaman, T.; Karaman, S.; Dogru, S.; Tapar, H.; Sahin, A.; Suren, M.; Arici, S.; Kaya, Z. Evaluating the efficacy of lavender aromatherapy on peripheral venous cannulation pain and anxiety: A prospective, randomized study. Complement. Ther. Clin. Pract. 2016, 23, 64–68. [Google Scholar] [CrossRef] [PubMed]
  118. Wohlwill, W.F. The concept of nature: A psychologist’s view. In Human Behavior and the Environment, 6th ed.; Altman, I., Wohlwill, F., Eds.; Behavior and the Natural Environment, Plenum: New York, NY, USA, 1983; pp. 5–37. [Google Scholar]
  119. Shankar, M.U.; Levitan, C.A.; Spence, C. Grape expectations: The role of cognitive influences in color–flavor interactions. Conscious. Cognit. 2010, 19, 380–390. [Google Scholar] [CrossRef]
  120. Gottfried, J.A.; Dolan, R.J. The nose smells what the eye sees: Crossmodal visual facilitation of human olfactory perception. Neuron 2003, 39, 375–386. [Google Scholar] [CrossRef]
  121. Carmichael, S.T.; Price, J.L. Sensory and premotor connections of the orbital and medial prefrontal cortex of macaque monkeys. J. Comp. Neurol. 1995, 363, 642–664. [Google Scholar] [CrossRef]
  122. Rolls, E.T.; Baylis, L.L. Gustatory, olfactory, and visual convergence within the primate orbitofrontal cortex. J. Neurosci. Off. J. Soc. Neurosci. 1994, 14, 5437–5452. [Google Scholar] [CrossRef] [PubMed]
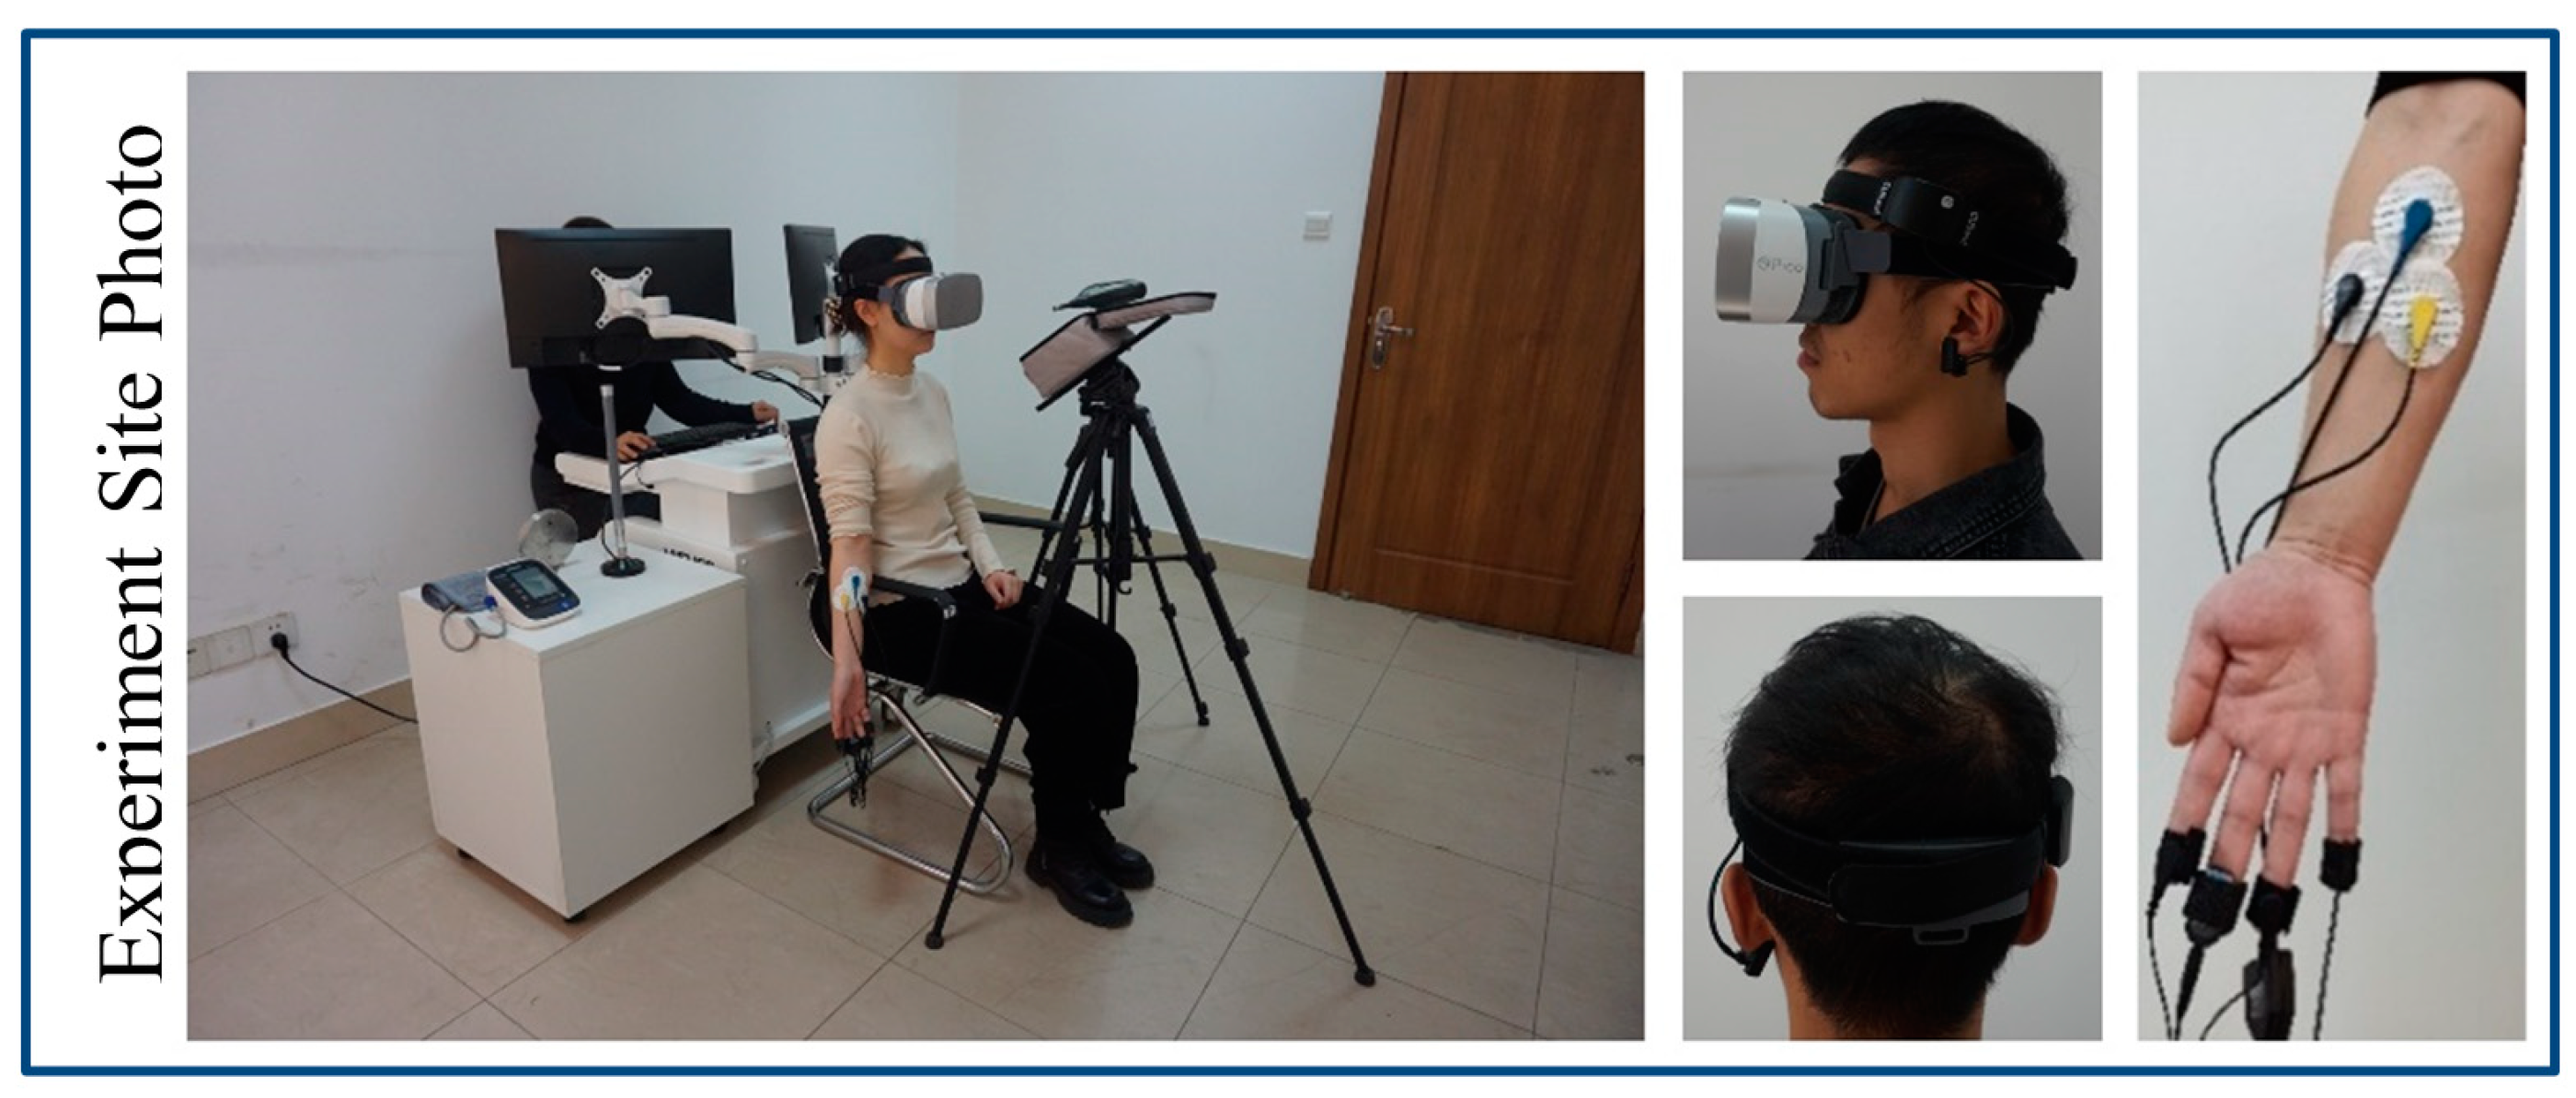
Figure 1. Experiment site photo.
Forests 15 01794 g001
Figure 2. Materials of stimulus.
Forests 15 01794 g002
Figure 3. Experiment procedure.
Forests 15 01794 g003
Figure 4. Impacts of distinct stimulation modalities on systolic blood pressure variations, diastolic blood pressure fluctuations, and the pulse pressure differential in human physiology. (a) ΔSBP. (b) ΔDBP. (c) ΔPP. The asterisk (*) serves as a marker indicating notable disparities between the two entities, 0.01 < p < 0.05.
Forests 15 01794 g004aForests 15 01794 g004b
Figure 5. Impacts of distinct stimulation modalities on human heart rate variability (ΔP).
Forests 15 01794 g005
Figure 6. Impacts of distinct stimulation modalities on human skin conductivity (ΔSC). ** denotes an exceptionally substantial variation between the two, p < 0.01.
Forests 15 01794 g006
Figure 7. Impacts of distinct stimulation modalities on the amplitude variations in brainwave activity. (a) Δα wave. (b) Δβ wave. ** denotes an exceptionally substantial variation between the two, p < 0.01.
Forests 15 01794 g007aForests 15 01794 g007b
Figure 8. Impacts of distinct stimulation modalities on the state anxiety (S-AI).
Forests 15 01794 g008
Figure 9. Emotional changes triggered by odor (SD).
Forests 15 01794 g009
Table 1. Descriptive statistics table for participant profiles.
Basic Information OVO and VC
Quantity
(Pct.)
Quantity
(Pct.)
Quantity
(Pct.)
Quantity
(Pct.)
Gendermale7 (30%)6 (25%)2 (8%)6 (25%)
female16 (70%)18 (75%)22 (92%)18 (75%)
Sample size23242424
Table 2. Physiological changes before and during sensory stimulation: olfactory, visual, and combined olfactory–visual.
Type of Stimulus
(Independent Variable)
Dependent
Variable
(Unit)
BeforeDuringT
MeanSDMeanSD
OSBP (mm Hg)107.7211.89106.0411.661.637
V104.9611.7599.389.922.508 *
O and V106.759.98105.857.980.566
C106.549.15104.947.101.406
ODBP (mm Hg)63.637.2464.357.40−0.895
V60.564.5261.634.21−1.555
O and V63.386.0565.887.03−2.445 *
C61.007.9362.465.85−1.421
OPP (mm Hg)44.098.3641.708.882.597 *
V44.4010.0339.786.433.077 **
O and V43.387.4039.984.402.838 **
C45.546.8442.485.152.899 **
OP (bpm)73.638.9475.487.24−2.116 *
V71.638.8772.608.92−1.074
O and V74.588.1474.359.430.239
C74.3810.4774.407.86−0.21
OSC (µΩ)2.121.461.891.342.241 *
V3.222.452.992.282.757 *
O and V1.721.431.661.280.865
C3.352.052.882.063.284 *
Oα waves (µV)16.498.9611.365.403.521 **
V13.967.1216.138.12−1.912
O and V22.0819.7921.9814.570.059
C19.7817.1614.6010.522.486 *
Oβ waves (µV)11.426.068.475.102.954 **
V9.075.3210.895.14−2.940 **
O and V15.9112.4615.8810.490.033
C13.3712.6510.119.152.537 *
The asterisk (*) serves as a marker indicating notable disparities between the two entities, 0.01 < p < 0.05. ** denotes an exceptionally substantial variation between the two, p < 0.01.
Table 3. A comprehensive examination of the differential impact on skin conductance, alpha waves, and beta waves resulting from various stimulation types.
P (LSD)
OVO and V
SCC----0.009
α wavesO----0.017
C--0.005--
β wavesV0.000--0.031
C--0.002--
Table 4. The alterations in psychological indexes preceding and during exposure to olfactory, visual, and combined olfactory–visual stimuli.
Type of Stimulus
(Independent Variable)
Dependent Variable
(Unit)
BeforeDuringT
MeanSDMeanSD
OS-AI (score)34.097.6833.657.850.270
V36.137.5530.964.593.234 **
O and V34.255.8931.507.961.862
C35.337.1233.217.961.596
** denotes an exceptionally substantial variation between the two, p < 0.01.
Table 5. The difference between the influence of different stimuli methods on the emotional perception of subjects.
Sig.
(Double Tail)
Z
COO and V
“thick–light”C--−3.196−4.073
O and V0.000----
O0.001----
“lazy–exciting”C--−2.383−2.318
O0.017----
O and V0.020----
“no vitality–life vigor”O----−1.973
O and V--0.049--
p < 0.01 indicates a substantial discrepancy; 0.01 < p < 0.05 indicates a discrepancy; p > 0.05 noted that the minor deviation was deemed negligible. All other results were statistically insignificant (p > 0.05). The letter “O” represents olfactory sensation.; the letter “V” represents visual sensation. The letters “O and V“ represent olfactory and visual sensation. The letter “C” represents the control group.
Disclaimer/Publisher’s Note: The statements, opinions and data contained in all publications are solely those of the individual author(s) and contributor(s) and not of MDPI and/or the editor(s). MDPI and/or the editor(s) disclaim responsibility for any injury to people or property resulting from any ideas, methods, instructions or products referred to in the content.