
Effects of the Spatial Pattern of Forest Vegetation on Urban Cooling in Large Metropolitan Areas of China: A Multi-Scale Perspective


Abstract
:1. Introduction
2. Methodology
2.1. Study Area
2.2. Data Sources
2.3. Land Cover Classification and LST Retrieval
2.4. Definition of Cooling Indicators
2.5. Selection and Definition of Landscape Indicators
2.6. Spatial Analysis
2.6.1. Patch Scale Analysis
2.6.2. Rural–Urban Gradient Analysis
2.6.3. Multi-Spatial Extent Analysis
3. Results
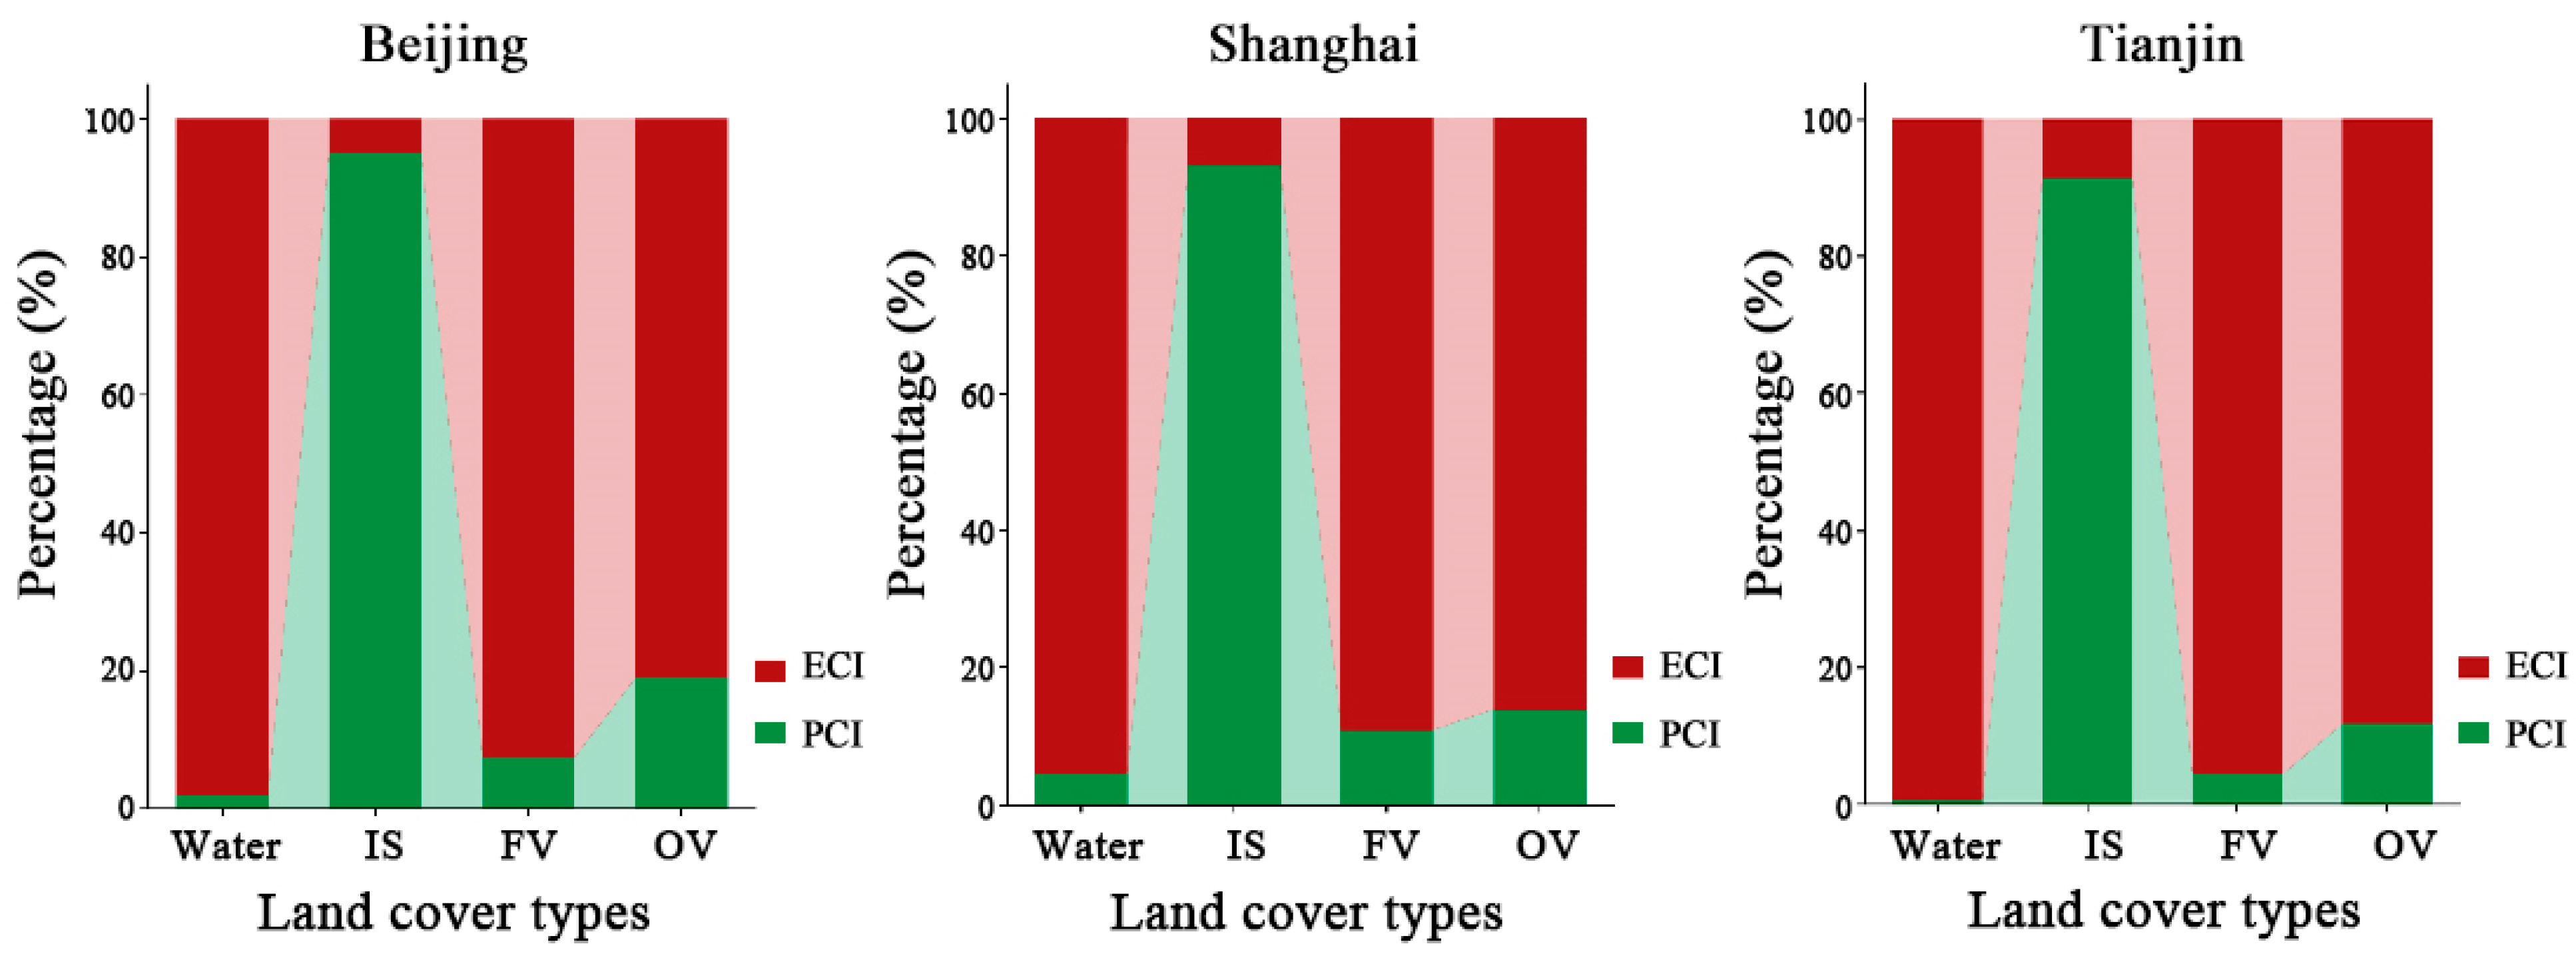
3.1. The Cooling Intensity of Different Land Cover Types
3.2. Modelling the Relationship between Landscape Indicators and CI of Forest Vegetation in Three Cities
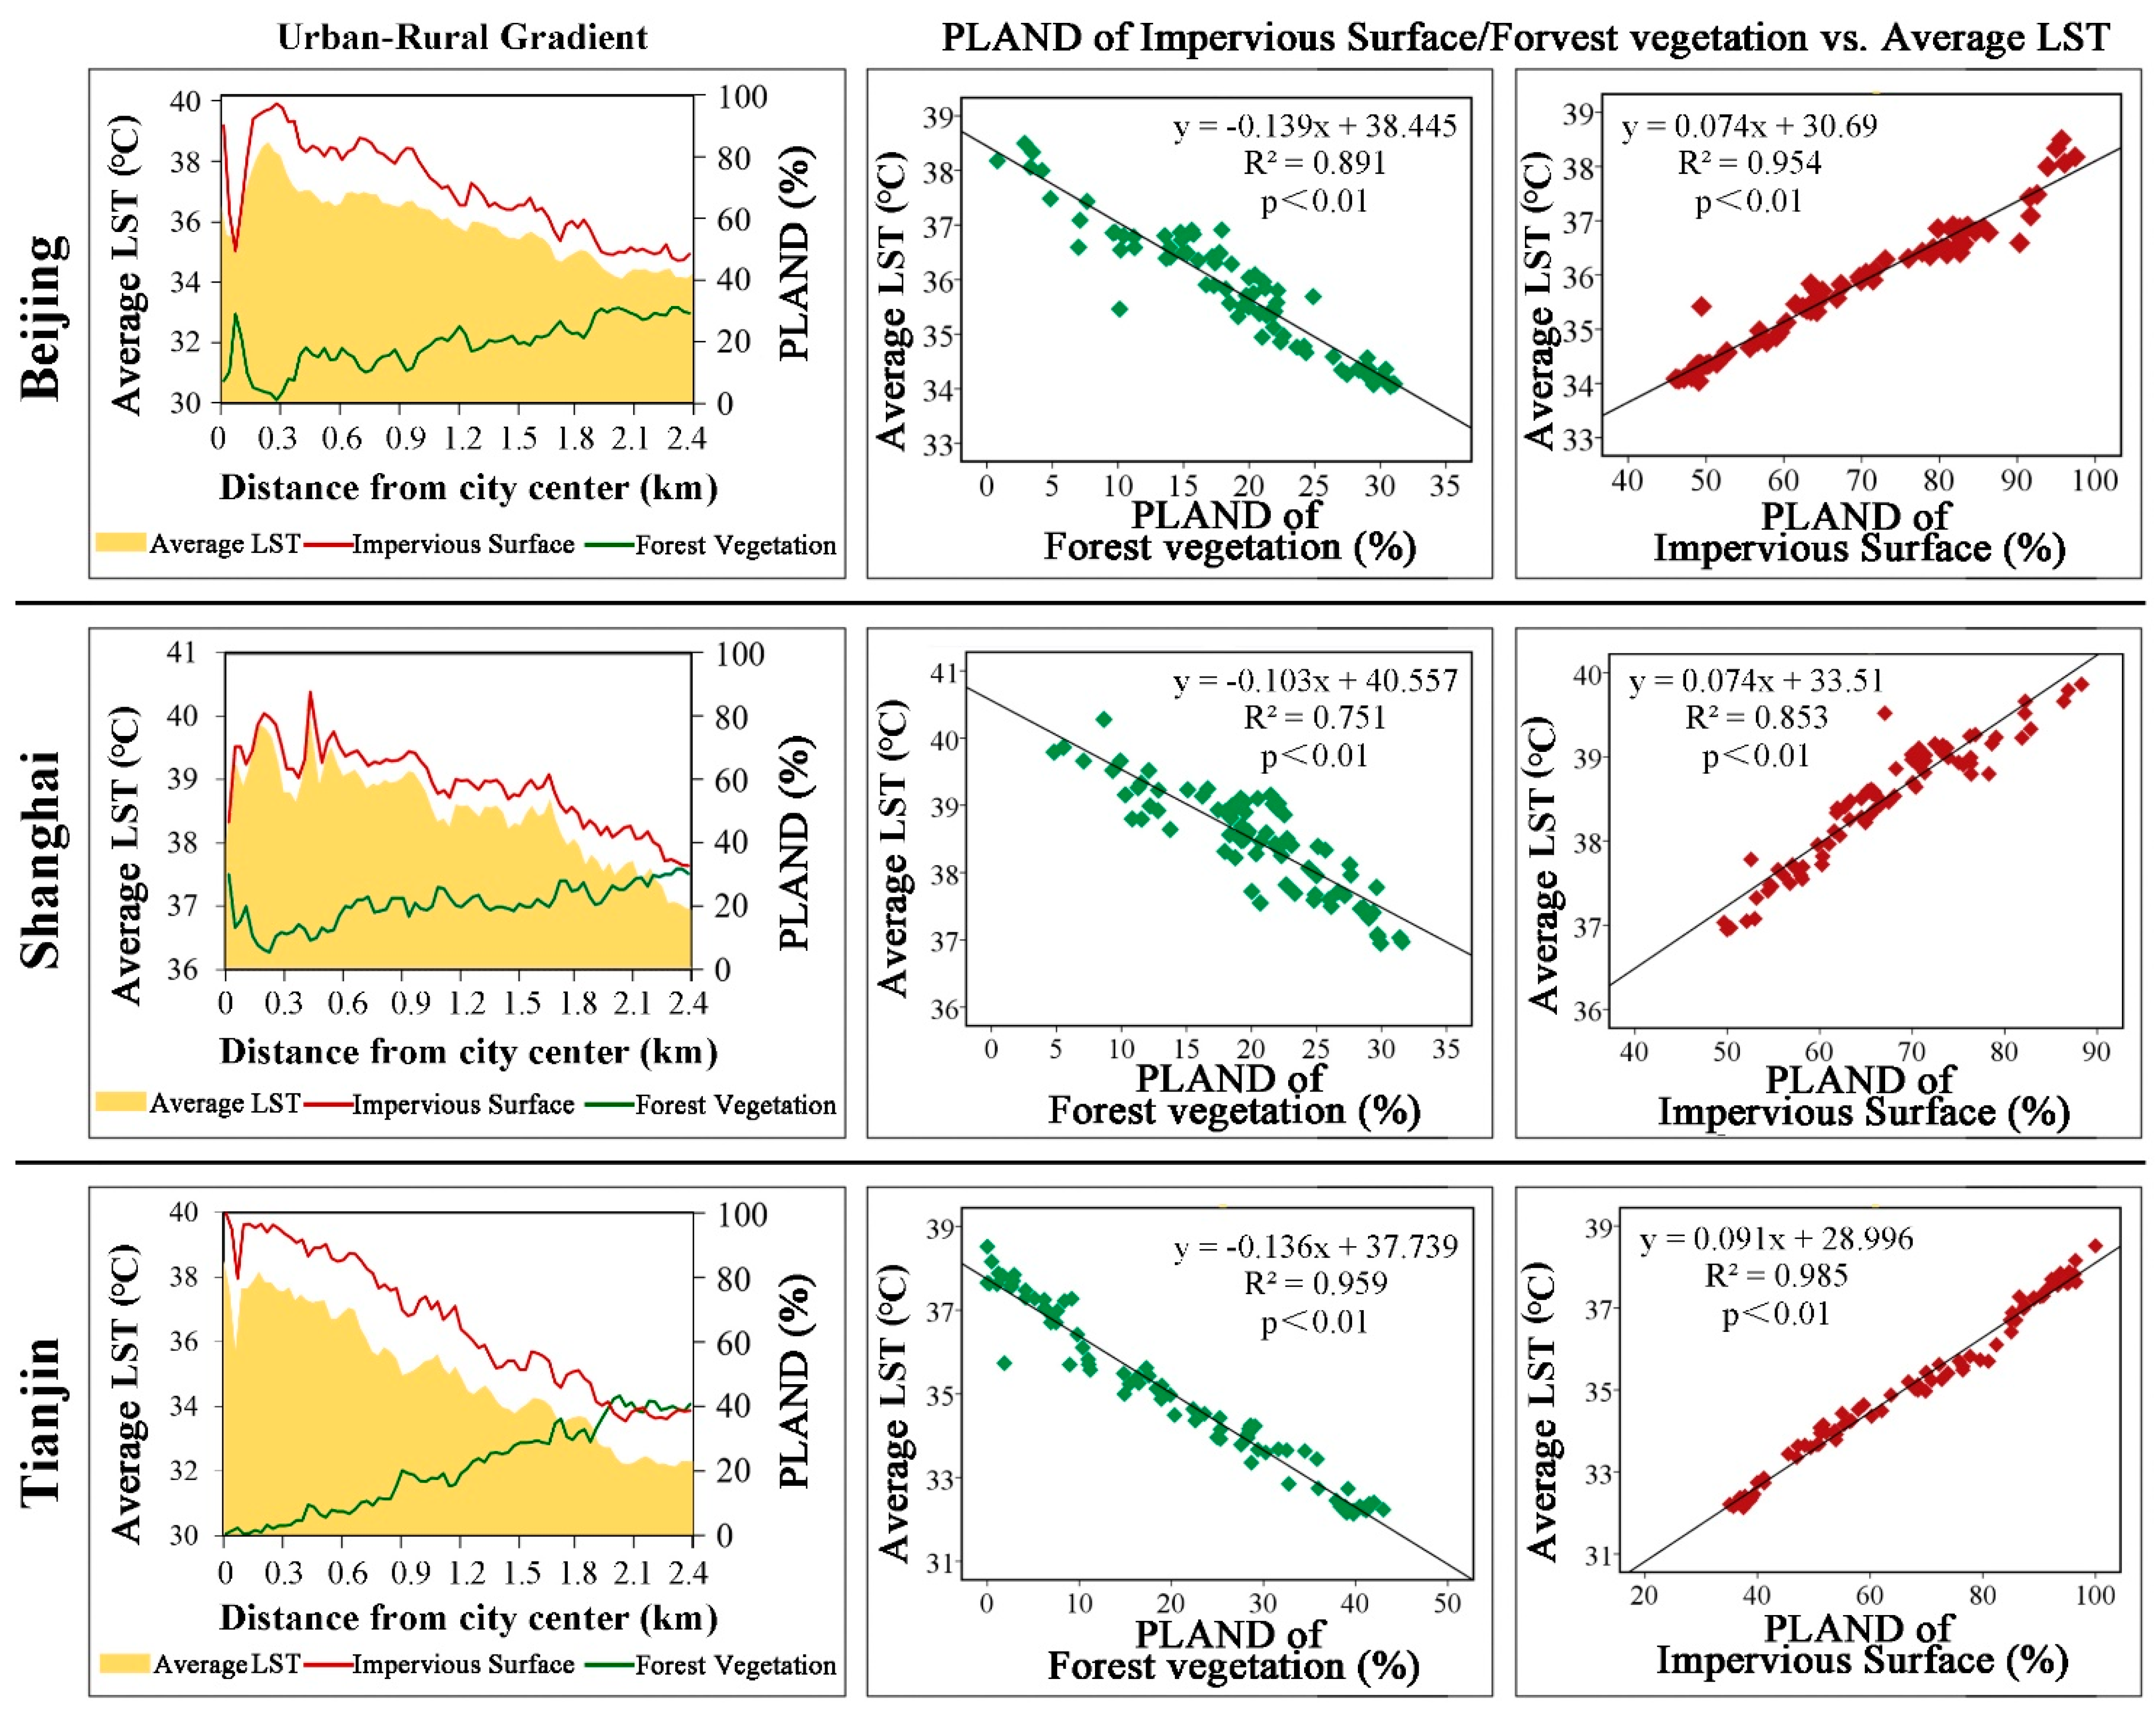
3.3. Impervious Surface and Forest Vegetation vs. LST along Urban–Rural Gradient
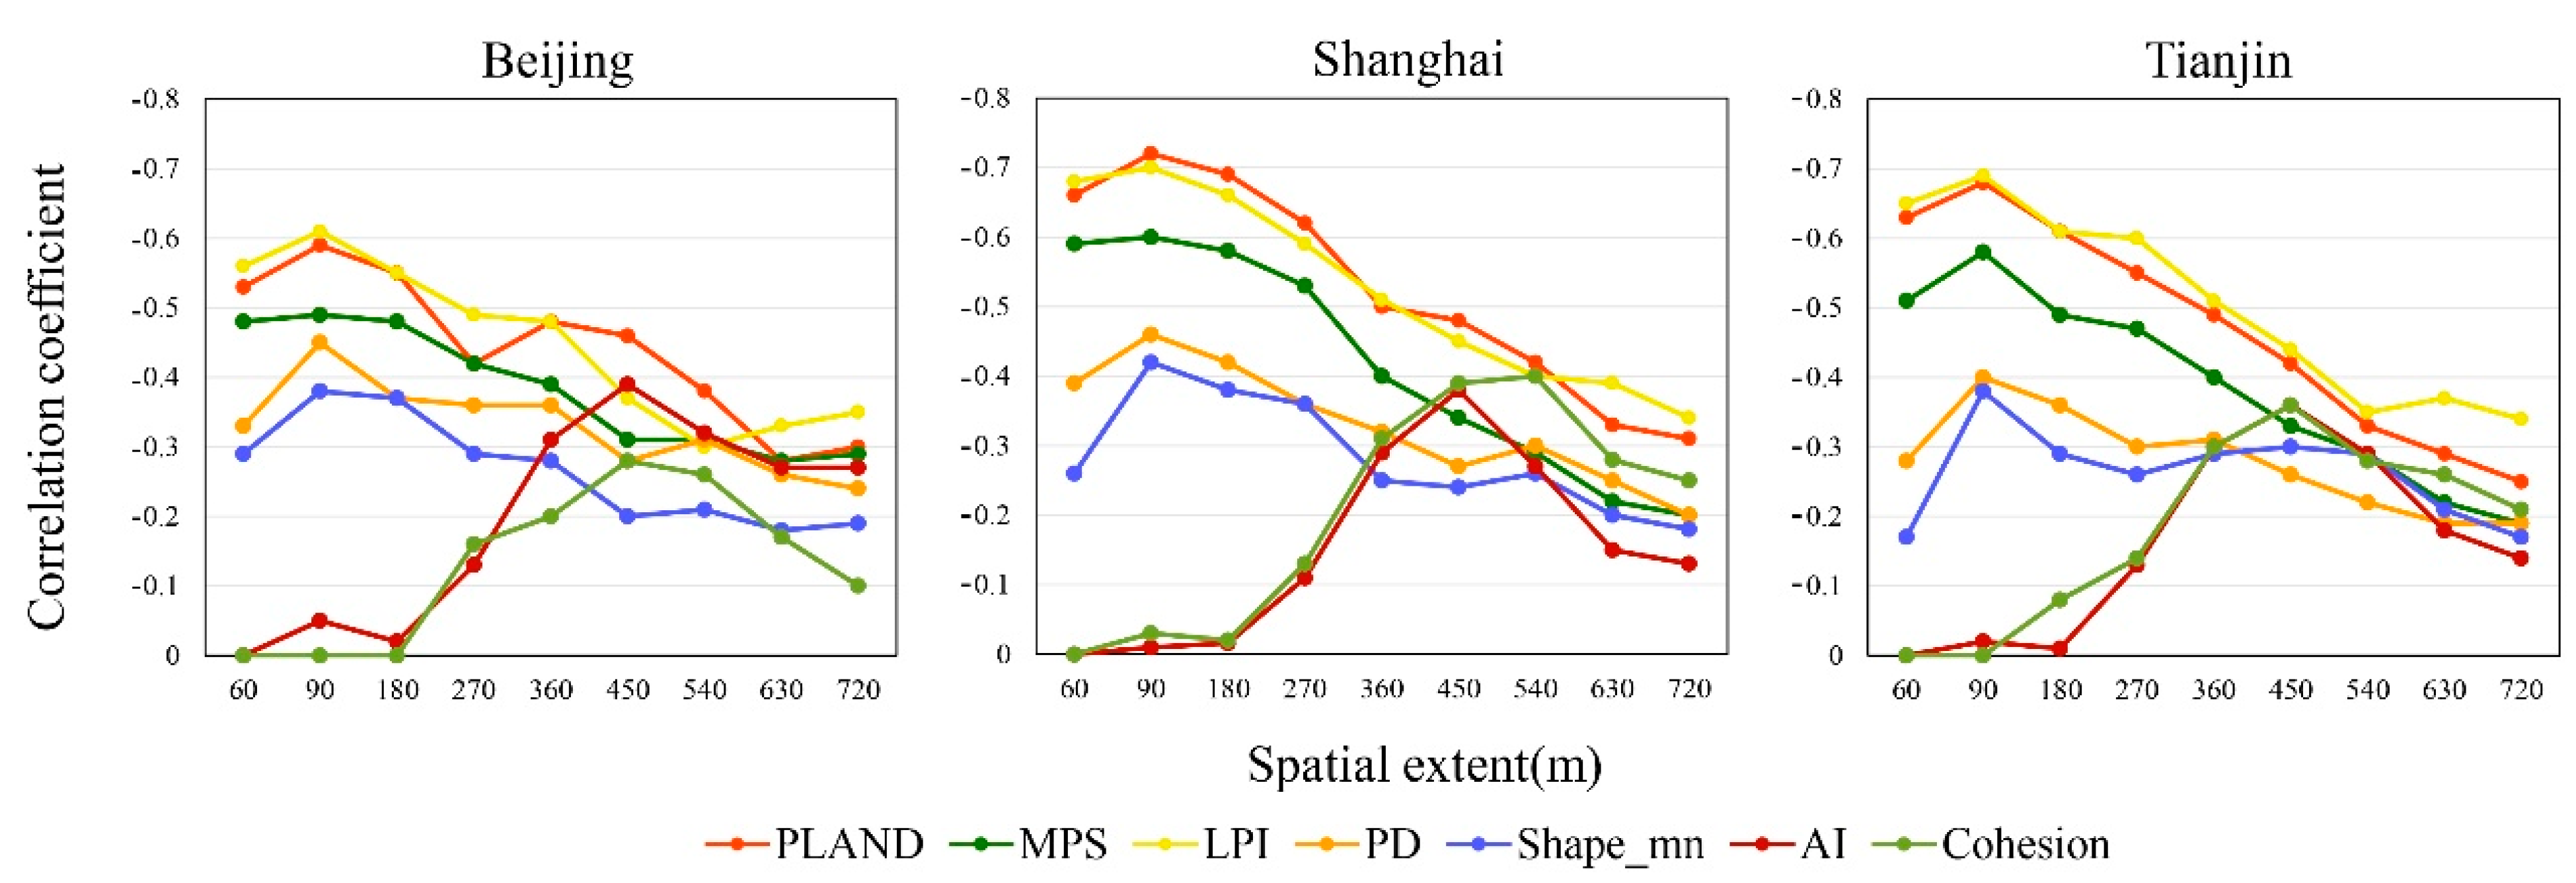
3.4. Effects of Changing Spatial Extent on the Relationship between Urban Forest Patterns and LST
4. Discussion
5. Conclusions
- (1)
- The cooling effect of water bodies was strongest, followed by forest vegetation and grassland. The average cooling effect of forest vegetation was 2.69 °C (Beijing), 3.27 °C (Shanghai), and 3.24 °C (Tianjin). On average, the mean LST of forest vegetation was about 4.39 °C, 4.85 °C, and 5.35 °C lower than that of impervious surfaces in Beijing, Shanghai, and Tianjin, respectively.
- (2)
- The LST variations in urban–rural gradients can be largely explained by the landscape composition, and the proportion of impervious surfaces and forest vegetation played a dominant role. More attention should be paid to those areas between 0.2 km and 0.25 km away from the city center since the average LST was higher there than at other locations, and this was consistent for all three cities.
- (3)
- Combining the Area, NDVI and NGP can explain a significant amount of heterogeneity of the cooling effect of forest vegetation. The patch area was the most important indicator influencing the cooling effect of forest vegetation in Beijing, while the NDVI had the greatest explanatory power in Shanghai and Tianjin. This difference was likely caused by differences in air humidity between the cities.
- (4)
- Changing the spatial extent had a great impact on the relationship between the spatial pattern of forest vegetation and LST, and the effects were basically consistent among the three urban areas in this study. A larger spatial extent (i.e., 450 m grid) was suggested to reveal the relationship between spatial configuration metrics (e.g., Aggregation and Cohesion) and the mean LST; meanwhile, a small spatial extent (i.e., 90 m grid) was recommended to quantify the correlation between the LST and area-, density- and shape-related metrics (e.g., PLAND, LPI, MPS, PD and Shape_mn) in this study.
Supplementary Materials
Author Contributions
Funding
Data Availability Statement
Conflicts of Interest
References
- United Nations Department of Economic and Social Affairs. World Urbanization Prospects: The 2018 Revision; United Nations Publications; United Nations: New York, NY, USA, 2019. [Google Scholar]
- Akbari, H.; Pomerantz, M.; Taha, H.J.P. Cool surfaces and shade trees to reduce energy use and improve air quality in urban areas. Sol. Energy 2001, 70, 295–310. [Google Scholar] [CrossRef]
- Peng, J.; Xie, P.; Liu, Y.X.; Ma, J. Urban thermal environment dynamics and associated landscape pattern factors: A case study in the Beijing metropolitan region. Remote Sens. Environ. 2016, 173, 145–155. [Google Scholar] [CrossRef]
- Sun, R.H.; Lü, Y.H.; Yang, X.J.; Chen, L.D. Understanding the variability of urban heat islands from local background climate and urbanization. J. Clean. Prod. 2019, 208, 743–752. [Google Scholar] [CrossRef]
- Oke, T.R. The energetic basis of the urban heat-island. Q. J. R. Meteorol. Soc. 1982, 108, 1–24. [Google Scholar] [CrossRef]
- Zhou, D.C.; Bonafoni, S.; Zhang, L.X.; Wang, R.H. Remote sensing of the urban heat island effect in a highly populated urban agglomeration area in East China. Sci. Total Environ. 2018, 628–629, 415–429. [Google Scholar] [CrossRef]
- Grimm, N.B.; Faeth, S.H.; Golubiewski, N.E.; Redman, C.L.; Wu, J.G.; Bai, X.M.; Briggs, J.M. Global change and the ecology of cities. Science 2008, 319, 756–760. [Google Scholar] [CrossRef]
- Li, X.M.; Zhou, Y.Y.; Yu, S.; Jia, G.S.; Li, H.D.; Li, W.L. Urban heat island impacts on building energy consumption: A review of approaches and findings. Energy 2019, 174, 407–419. [Google Scholar] [CrossRef]
- Gong, P.; Liang, S.; Carlton, E.J.; Jiang, Q.W.; Wu, J.Y.; Wang, L.; Remais, J.V. Urbanisation and health in China. Lancet 2012, 379, 843–852. [Google Scholar] [CrossRef]
- Zhao, Q.; Guo, Y.M.; Ye, T.T.; Gasparrini, A.; Tong, S.L.; Overcenco, A.; Urban, A.; Schneider, A.; Entezari, A.; Vicedo-Cabrera, A.M.; et al. Global, regional, and national burden of mortality associated with non-optimal ambient temperatures from 2000 to 2019: A three-stage modelling study. Lancet Planet. Health 2021, 5, E415–E425. [Google Scholar] [CrossRef]
- Soydan, O. Effects of landscape composition and patterns on land surface temperature: Urban heat island case study for Nigde, Turkey. Urban Clim. 2020, 34, 100688. [Google Scholar] [CrossRef]
- Li, K.N.; Chen, Y.H.; Wang, M.J.; Gong, A. Spatial-temporal variations of surface urban heat island intensity induced by different definitions of rural extents in China. Sci. Total Environ. 2019, 669, 229–247. [Google Scholar] [CrossRef]
- Manoli, G.; Fatichi, S.; Schläpfer, M.; Yu, K.L.; Crowther, T.W.; Meili, N.; Burlando, P.; Katul, G.G.; Bou-Zeid, E. Magnitude of urban heat islands largely explained by climate and population. Nature 2019, 573, 55–60. [Google Scholar] [CrossRef]
- Zhou, D.C.; Zhao, S.Q.; Liu, S.G.; Zhang, L.X.; Zhu, C. Surface urban heat island in China’s 32 major cities: Spatial patterns and drivers. Remote Sens. Environ. 2014, 152, 51–61. [Google Scholar] [CrossRef]
- Clinton, N.; Gong, P. MODIS detected surface urban heat islands and sinks: Global locations and controls. Remote Sens. Environ. 2013, 134, 294–304. [Google Scholar] [CrossRef]
- Department of Health. Heatwave Plan for England. Protecting Health and Reducing from Extreme Heat and Heatwaves. In NHS Best Practice Guidance; Department of Health: London, UK, 2008; Volume 32. [Google Scholar]
- Gunawardena, K.R.; Wells, M.J.; Kershaw, T. Utilising green and bluespace to mitigate urban heat island intensity. Sci. Total Environ. 2017, 584, 1040–1055. [Google Scholar] [CrossRef]
- Xue, Z.S.; Hou, G.L.; Zhang, Z.S.; Lyu, X.G.; Jiang, M.; Zou, Y.C.; Shen, X.J.; Wang, J.; Liu, X.H. Quantifying the cooling-effects of urban and peri-urban wetlands using remote sensing data: Case study of cities of Northeast China. Landsc. Urban Plan. 2019, 182, 92–100. [Google Scholar] [CrossRef]
- Oke, T.R. City size and urban heat island. Atmos. Environ. 1973, 7, 769–779. [Google Scholar] [CrossRef]
- Peng, J.; Liu, Q.Y.; Xu, Z.H.; Lyu, D.N.; Du, Y.Y.; Qiao, R.L.; Wu, J.S. How to effectively mitigate urban heat island effect? A perspective of waterbody patch size threshold. Landsc. Urban Plan. 2020, 202, 103873. [Google Scholar] [CrossRef]
- Wong, N.H.; Tan, C.L.; Kolokotsa, D.D.; Takebayashi, H. Greenery as a mitigation and adaptation strategy to urban heat. Nat. Rev. Earth Environ. 2021, 2, 166–181. [Google Scholar] [CrossRef]
- Bratman, G.N.; Anderson, C.B.; Berman, M.G.; Cochran, B.; de Vries, S.; Flanders, J.; Folke, C.; Frumkin, H.; Gross, J.J.; Hartig, T.; et al. Nature and mental health: An ecosystem service perspective. Sci. Adv. 2019, 5, eaax0903. [Google Scholar] [CrossRef]
- Spotswood, E.N.; Benjamin, M.; Stoneburner, L.; Wheeler, M.M.; Beller, E.E.; Balk, D.; McPhearson, T.; Kuo, M.; McDonald, R.I. Nature inequity and higher COVID-19 case rates in less-green neighbourhoods in the United States. Nat. Sustain. 2021, 4, 1092–1098. [Google Scholar] [CrossRef]
- Wolch, J.R.; Byrne, J.; Newell, J.P. Urban green space, public health, and environmental justice: The challenge of making cities ‘just green enough’. Landsc. Urban Plan. 2014, 125, 234–244. [Google Scholar] [CrossRef]
- Santamouris, M.; Ban-Weiss, G.; Osmond, P.; Paolini, R.; Synnefa, A.; Cartalis, C.; Muscio, A.; Zinzi, M.; Morakinyo, T.E.; Ng, E.; et al. Progress in urban greenery mitigation science—Assessment methodologies advanced technologies and impact on cities. J. Civ. Eng. Manag. 2018, 24, 638–671. [Google Scholar] [CrossRef]
- Yu, Z.W.; Guo, X.Y.; Zeng, Y.X.; Koga, M.; Vejre, H. Variations in land surface temperature and cooling efficiency of green space in rapid urbanization: The case of Fuzhou city, China. Urban For. Urban Green. 2018, 29, 113–121. [Google Scholar] [CrossRef]
- Zhou, W.Q.; Wang, J.; Cadenasso, M.L. Effects of the spatial configuration of trees on urban heat mitigation: A comparative study. Remote Sens. Environ. 2017, 195, 1–12. [Google Scholar] [CrossRef]
- Zhou, W.; Cao, F.L. Effects of changing spatial extent on the relationship between urban forest patterns and land surface temperature. Ecol. Indic. 2020, 109, 105778. [Google Scholar] [CrossRef]
- Du, H.Y.; Cai, W.B.; Xu, Y.Q.; Wang, Z.B.; Wang, Y.Y.; Cai, Y.L. Quantifying the cool island effects of urban green spaces using remote sensing Data. Urban For. Urban Green. 2017, 27, 24–31. [Google Scholar] [CrossRef]
- Kong, F.H.; Nakagoshi, N. Spatial-temporal gradient analysis of urban green spaces in Jinan, China. Landsc. Urban Plan. 2006, 78, 147–164. [Google Scholar] [CrossRef]
- Guerri, G.; Crisci, A.; Congedo, L.; Munafò, M.; Morabito, M. A functional seasonal thermal hot-spot classification: Focus on industrial sites. Sci. Total Environ. 2022, 806, 151383. [Google Scholar] [CrossRef]
- Kong, F.H.; Yin, H.W.; James, P.; Hutyra, L.R.; He, H.S. Effects of spatial pattern of greenspace on urban cooling in a large metropolitan area of eastern China. Landsc. Urban Plan. 2014, 128, 35–47. [Google Scholar] [CrossRef]
- Marando, F.; Heris, M.P.; Zulian, G.; Udías, A.; Mentaschi, L.; Chrysoulakis, N.; Parastatidis, D.; Maes, J. Urban heat island mitigation by green infrastructure in European Functional Urban Areas. Sustain. Cities Soc. 2022, 77, 103564. [Google Scholar] [CrossRef]
- Zhou, W.; Cao, F.L.; Wang, G.B. Effects of Spatial Pattern of Forest Vegetation on Urban Cooling in a Compact Megacity. Forests 2019, 10, 282. [Google Scholar] [CrossRef]
- Feyisa, G.L.; Dons, K.; Meilby, H. Efficiency of parks in mitigating urban heat island effect: An example from Addis Ababa. Landsc. Urban Plan. 2014, 123, 87–95. [Google Scholar] [CrossRef]
- Yu, Z.W.; Guo, X.Y.; Jorgensen, G.; Vejre, H. How can urban green spaces be planned for climate adaptation in subtropical cities? Ecol. Indic. 2017, 82, 152–162. [Google Scholar] [CrossRef]
- Masoudi, M.; Tan, P.Y. Multi-year comparison of the effects of spatial pattern of urban green spaces on urban land surface temperature. Landsc. Urban Plan. 2019, 184, 44–58. [Google Scholar] [CrossRef]
- Chen, A.L.; Yao, X.A.; Sun, R.H.; Chen, L.D. Effect of urban green patterns on surface urban cool islands and its seasonal variations. Urban For. Urban Green. 2014, 13, 646–654. [Google Scholar] [CrossRef]
- Dugord, P.A.; Lauf, S.; Schuster, C.; Kleinschmit, B. Land use patterns, temperature distribution, and potential heat stress risk—The case study Berlin, Germany. Comput. Environ. Urban Syst. 2014, 48, 86–98. [Google Scholar] [CrossRef]
- Li, J.X.; Song, C.H.; Cao, L.; Zhu, F.G.; Meng, X.L.; Wu, J.G. Impacts of landscape structure on surface urban heat islands: A case study of Shanghai, China. Remote Sens. Environ. 2011, 115, 3249–3263. [Google Scholar] [CrossRef]
- Zhou, W.Q.; Huang, G.L.; Cadenasso, M.L. Does spatial configuration matter? Understanding the effects of land cover pattern on land surface temperature in urban landscapes. Landsc. Urban Plan. 2011, 102, 54–63. [Google Scholar] [CrossRef]
- Li, X.M.; Zhou, W.Q.; Ouyang, Z.Y. Relationship between land surface temperature and spatial pattern of greenspace: What are the effects of spatial resolution? Landsc. Urban Plan. 2013, 114, 1–8. [Google Scholar] [CrossRef]
- Li, X.M.; Zhou, W.Q.; Ouyang, Z.Y.; Xu, W.H.; Zheng, H. Spatial pattern of greenspace affects land surface temperature: Evidence from the heavily urbanized Beijing metropolitan area, China. Landsc. Ecol. 2012, 27, 887–898. [Google Scholar] [CrossRef]
- Estoque, R.C.; Murayama, Y.; Myint, S.W. Effects of landscape composition and pattern on land surface temperature: An urban heat island study in the megacities of Southeast Asia. Sci. Total Environ. 2017, 577, 349–359. [Google Scholar] [CrossRef]
- Fan, H.Y.; Yu, Z.W.; Yang, G.Y.; Liu, T.Y.; Liu, T.Y.; Hung, C.H.; Vejre, H. How to cool hot-humid (Asian) cities with urban trees? An optimal landscape size perspective. Agric. For. Meteorol. 2019, 265, 338–348. [Google Scholar] [CrossRef]
- Jauregui, E. Influence of a large urban park on temperature and convective precipitation in a tropical city. Energy Build. 1990, 15, 457–463. [Google Scholar] [CrossRef]
- Zhou, W.; Yu, W.D.; Zhang, Z.Y.; Cao, W.; Wu, T. How can urban green spaces be planned to mitigate urban heat island effect under different climatic backgrounds? A threshold-based perspective. Sci. Total Environ. 2023, 890, 164422. [Google Scholar] [CrossRef]
- Wu, H.; Ye, L.P.; Shi, W.Z.; Clarke, K.C. Assessing the effects of land use spatial structure on urban heat islands using HJ-1B remote sensing imagery in Wuhan, China. Int. J. Appl. Earth Obs. Geoinf. 2014, 32, 67–78. [Google Scholar] [CrossRef]
- Rhee, J.; Park, S.; Lu, Z.J.G.; Sensing, R. Relationship between land cover patterns and surface temperature in urban areas. GIScience Remote Sens. 2014, 51, 521–536. [Google Scholar] [CrossRef]
- Park, J.; Kim, J.H.; Lee, D.K.; Park, C.Y.; Jeong, S.G. The influence of small green space type and structure at the street level on urban heat island mitigation. Urban For. Urban Green. 2017, 21, 203–212. [Google Scholar] [CrossRef]
- Wu, Q.; Tan, J.X.; Guo, F.X.; Li, H.Q.; Chen, S.B. Multi-Scale Relationship between Land Surface Temperature and Landscape Pattern Based on Wavelet Coherence: The Case of Metropolitan Beijing, China. Remote Sens. 2019, 11, 3021. [Google Scholar] [CrossRef]
- Min, M.; Lin, C.; Duan, X.J.; Jin, Z.F.; Zhang, L.C. Spatial distribution and driving force analysis of urban heat island effect based on raster data: A case study of the Nanjing metropolitan area, China. Sustain. Cities Soc. 2019, 50, 101637. [Google Scholar] [CrossRef]
- State Statistics Bureau. Statistical Chart of Economic and Social Development: Basic Information of the Population of Megacities and Megacities in the Seventh National Population Census. Available online: http://www.qstheory.cn/dukan/qs/2021-09/16/c_1127863567.htm (accessed on 16 September 2021).
- Beijing Municipal Bureau Statistics. Beijing Statistical Yearbook 2023. Available online: https://nj.tjj.beijing.gov.cn/nj/main/2023-tjnj/zk/indexch.htm (accessed on 23 November 2023).
- Shanghai Municipal Bureau Statistics. Shanghai Statistical Yearbook 2023. Available online: https://tjj.sh.gov.cn/tjnj/20240321/5a35a44acace471f87c75393133fa142.html (accessed on 23 November 2023).
- Tianjin Municipal Bureau Statistics. Tianjin Statistical Yearbook 2023. Available online: https://stats.tj.gov.cn/nianjian/2023nj/zk/indexch.htm (accessed on 23 November 2023).
- USGS (United States Geological Survey). Available online: https://earthexplorer.usgs.gov/ (accessed on 10 October 2023).
- Qin, Z.; Karnieli, A.; Berliner, P. A mono-window algorithm for retrieving land surface temperature from Landsat TM data and its application to the Israel-Egypt border region. Int. J. Remote Sens. 2001, 22, 3719–3746. [Google Scholar] [CrossRef]
- Zhou, W.; Yu, W.L.; Wu, T. An alternative method of developing landscape strategies for urban cooling: A threshold-based perspective. Landsc. Urban Plan. 2022, 225, 104449. [Google Scholar] [CrossRef]
- McGarigal, K.; Marks, B.J. FRAGSTATS: Spatial Pattern Analysis Program for Quantifying Landscape Structure; Environmental Science; US Department of Agriculture, Forest Service, Pacific Northwest Research Station: Washington, DC, USA, 1995. [Google Scholar]
- Yuan, F.; Bauer, M.E. Comparison of impervious surface area and normalized difference vegetation index as indicators of surface urban heat island effects in Landsat imagery. Remote Sens. Environ. 2007, 106, 375–386. [Google Scholar] [CrossRef]
- Maimaitiyiming, M.; Ghulam, A.; Tiyip, T.; Pla, F.; Latorre-Carmona, P.; Halik, Ü.; Sawut, M.; Caetano, M. Effects of green space spatial pattern on land surface temperature: Implications for sustainable urban planning and climate change adaptation. ISPRS J. Photogramm. Remote Sens. 2014, 89, 59–66. [Google Scholar] [CrossRef]
- Zhou, W.; Cao, W.; Wu, T.; Zhang, T. The win-win interaction between integrated blue and green space on urban cooling. Sci. Total Environ. 2023, 863, 160712. [Google Scholar] [CrossRef]
- Yang, G.Y.; Yu, Z.W.; Jorgensen, G.; Vejre, H. How can urban blue-green space be planned for climate adaption in high-latitude cities? A seasonal perspective. Sustain. Cities Soc. 2020, 53, 101932. [Google Scholar] [CrossRef]
- Yu, Z.W.; Yao, Y.W.; Yang, G.Y.; Wang, X.R.; Vejre, H. Spatiotemporal patterns and characteristics of remotely sensed region heat islands during the rapid urbanization (1995–2015) of Southern China. Sci. Total Environ. 2019, 674, 242–254. [Google Scholar] [CrossRef]
- Li, X.X.; Li, W.W.; Middel, A.; Harlan, S.L.; Brazel, A.J.; Turner, B.L. Remote sensing of the surface urban heat island and land architecture in Phoenix, Arizona: Combined effects of land composition and configuration and cadastral-demographic-economic factors. Remote Sens. Environ. 2016, 174, 233–243. [Google Scholar] [CrossRef]
- Asgarian, A.; Amiri, B.J.; Sakieh, Y. Assessing the effect of green cover spatial patterns on urban land surface temperature using landscape metrics approach. Urban Ecosyst. 2015, 18, 209–222. [Google Scholar] [CrossRef]
- Bao, T.L.G.; Li, X.M.; Zhang, J.; Zhang, Y.J.; Tian, S.Z. Assessing the Distribution of Urban Green Spaces and its Anisotropic Cooling Distance on Urban Heat Island Pattern in Baotou, China. ISPRS Int. J. Geo-Inf. 2016, 5, 12. [Google Scholar] [CrossRef]
- Xiao, R.B.; Ouyang, Z.Y.; Zheng, H.; Li, W.F.; Schienke, E.W.; Wang, X.K. Spatial pattern of impervious surfaces and their impacts on land surface temperature in Beijing, China. J. Environ. Sci. 2007, 19, 250–256. [Google Scholar] [CrossRef]
- Myint, S.W.; Brazel, A.; Okin, G.; Buyantuyev, A. Combined Effects of Impervious Surface and Vegetation Cover on Air Temperature Variations in a Rapidly Expanding Desert City. Giscience Remote Sens. 2010, 47, 301–320. [Google Scholar] [CrossRef]
- Ma, Q.; Wu, J.G.; He, C.Y. A hierarchical analysis of the relationship between urban impervious surfaces and land surface temperatures: Spatial scale dependence, temporal variations, and bioclimatic modulation. Landsc. Ecol. 2016, 31, 1139–1153. [Google Scholar] [CrossRef]
- Liu, W.R.; Jia, B.Q.; Li, T.; Zhang, Q.M.; Ma, J. Correlation Analysis between Urban Green Space and Land Surface Temperature from the Perspective of Spatial Heterogeneity: A Case Study within the Sixth Ring Road of Beijing. Sustainability 2022, 14, 13492. [Google Scholar] [CrossRef]
- Yuan, S.F.; Xia, H.; Yang, L.X. How changing grain size affects the land surface temperature pattern in rapidly urbanizing area: A case study of the central urban districts of Hangzhou City, China. Environ. Sci. Pollut. Res. 2021, 28, 40060–40074. [Google Scholar] [CrossRef]
- Hou, H.; Estoque, R.C. Detecting Cooling Effect of Landscape from Composition and Configuration: An Urban Heat Island Study on Hangzhou. Urban For. Urban Green. 2020, 53, 126719. [Google Scholar] [CrossRef]
- Song, J.; Du, S.; Feng, X.; Guo, L. The relationships between landscape compositions and land surface temperature: Quantifying their resolution sensitivity with spatial regression models. Landsc. Urban Plan. 2014, 123, 145–157. [Google Scholar] [CrossRef]
- Zhao, J.C.; Zhao, X.; Liang, S.L.; Zhou, T.; Du, X.Z.; Xu, P.P.; Wu, D.H. Assessing the thermal contributions of urban land cover types. Landsc. Urban Plan. 2020, 204, 103927. [Google Scholar] [CrossRef]
- He, M.W.; Yuan, C.; Zhang, X.; Wang, P.C.; Yao, C.H. Impacts of green-blue-grey infrastructures on high-density urban thermal environment at multiple spatial scales: A case study in Wuhan. Urban Clim. 2023, 52, 101714. [Google Scholar] [CrossRef]


| Landscape Metrics | Abbreviation | Description | Range |
|---|---|---|---|
| Percentage of Landscape | PLAND | The proportion of total area occupied by a particular patch type; a measure of landscape composition and dominance of patch types (%) | 0 < PLAND < 100 |
| Mean patch size | MPS | The sum of area across all patches of the corresponding patch type divided by the number of patches of the same type (ha) | MPS > 0 |
| Largest patch index | LPI | The area (m2) of the largest patch of the corresponding patch type divided by total landscape area (m2), multiplied by 100 (to convert to a percentage) (%) | 0 < LPI < 100 |
| Patch density | PD | The number of patches in the landscape for patch type | PD > 0 |
| Mean patch shape index | Shape_mn | Mean value of shape index | Shape_mn > 0 |
| Aggregation index | AI | The number of like adjacencies involving the corresponding class, divided by the maximum possible number of like adjacencies involving the corresponding class, which is achieved when the class is maximally clumped into a single, compact patch; multiplied by 100 (to convert to a percentage) (%) | 0 ≤ AI ≤ 100 |
| Patch cohesion index | Cohesion | 1 minus the sum of patch perimeter (in terms of number of cell surfaces) divided by the sum of patch perimeter times the square root of patch area (in terms of number of cells) for patches of the corresponding patch type, divided by 1 minus 1 over the square root of the total number of cells in the landscape, multiplied by 100 to convert to a percentage | 0 ≤ Cohesion < 100 |
| Patch area | Area | The area of the patch (ha) | Area > 0, no limit |
| City | Land Cover Type | Water | Impervious Surface | Forest Vegetation | Other Vegetation |
|---|---|---|---|---|---|
| Beijing | Mean LST | 30.27 | 36.4 | 32.01 | 33.7 |
| CI | 4.43 | −1.7 | 2.69 | 1 | |
| TD compared with the mean LST of impervious surface | 6.13 | 0 | 4.39 | 2.7 | |
| Shanghai | Mean LST | 31.01 | 39.28 | 34.43 | 36.1 |
| CI | 6.69 | −1.58 | 3.27 | 1.6 | |
| TD compared with the mean LST of impervious surface | 8.27 | 0 | 4.85 | 3.18 | |
| Tianjin | Mean LST | 29.9 | 35.91 | 30.56 | 32 |
| CI | 3.9 | −2.11 | 3.24 | 1.8 | |
| TD compared with the mean LST of impervious surface | 6.01 | 0 | 5.35 | 3.91 |
| Dependent Variable | Variables | Unstandardized Coefficients | Standardized Coefficients (β) | Sig. | VIF | |
|---|---|---|---|---|---|---|
| β | Std. Error | |||||
| Beijing | (Constant) | −3.751 | 1.137 | 0.001 | ||
| Area | 0.026 | 0.007 | 0.376 | 0.000 | 1.280 | |
| NDVI | 11.311 | 3.571 | 0.294 | 0.002 | 1.205 | |
| NGP | 2.452 | 1.150 | 0.203 | 0.036 | 1.269 | |
| R2 = 0.670; Adjusted R2 = 0.450 | ||||||
| Shanghai | (Constant) | −5.562 | 0.558 | 0.000 | ||
| NDVI | 15.769 | 1.709 | 0.488 | 0.000 | 1.086 | |
| Area | 0.026 | 0.005 | 0.284 | 0.000 | 1.223 | |
| NGP | 3.456 | 0.827 | 0.229 | 0.000 | 1.163 | |
| R2 = 0.729; Adjusted R2 = 0531 | ||||||
| Tianjin | (Constant) | −5.863 | 0.579 | 0.000 | ||
| NDVI | 16.622 | 1.780 | 0.500 | 0.000 | 1.092 | |
| Area | 0.025 | 0.005 | 0.278 | 0.000 | 1.225 | |
| NGP | 3.531 | 0.833 | 0.234 | 0.000 | 1.158 | |
| R2 = 0.739; Adjusted R2 = 0.546 | ||||||
Disclaimer/Publisher’s Note: The statements, opinions and data contained in all publications are solely those of the individual author(s) and contributor(s) and not of MDPI and/or the editor(s). MDPI and/or the editor(s) disclaim responsibility for any injury to people or property resulting from any ideas, methods, instructions or products referred to in the content. |
© 2024 by the authors. Licensee MDPI, Basel, Switzerland. This article is an open access article distributed under the terms and conditions of the Creative Commons Attribution (CC BY) license (https://creativecommons.org/licenses/by/4.0/).
Share and Cite
Xu, J.; Yu, Y.; Zhou, W.; Yu, W.; Wu, T. Effects of the Spatial Pattern of Forest Vegetation on Urban Cooling in Large Metropolitan Areas of China: A Multi-Scale Perspective. Forests 2024, 15, 1778. https://doi.org/10.3390/f15101778
Xu J, Yu Y, Zhou W, Yu W, Wu T. Effects of the Spatial Pattern of Forest Vegetation on Urban Cooling in Large Metropolitan Areas of China: A Multi-Scale Perspective. Forests. 2024; 15(10):1778. https://doi.org/10.3390/f15101778
Chicago/Turabian StyleXu, Jie, Yiqi Yu, Wen Zhou, Wendong Yu, and Tao Wu. 2024. "Effects of the Spatial Pattern of Forest Vegetation on Urban Cooling in Large Metropolitan Areas of China: A Multi-Scale Perspective" Forests 15, no. 10: 1778. https://doi.org/10.3390/f15101778
APA StyleXu, J., Yu, Y., Zhou, W., Yu, W., & Wu, T. (2024). Effects of the Spatial Pattern of Forest Vegetation on Urban Cooling in Large Metropolitan Areas of China: A Multi-Scale Perspective. Forests, 15(10), 1778. https://doi.org/10.3390/f15101778