Abstract
The global warming phenomenon caused by greenhouse gas emission leads to the deterioration of the ecological environment. In urban spaces, the selection of garden tree species with high carbon sequestration rates can effectively contribute to carbon neutrality. In this study, we measured the height, diameter at breast height, and crown width of 643 ancient trees around the West Lake Scenic Spot, Hangzhou, China, and recorded their species and ages. By the biomass expansion factor method, the long-term carbon sequestration of the trees was calculated, and the corresponding statistical analysis indicated the following findings: (1) The maximum carbon sequestration of ancient trees varies with the species; the simple rational function has the best fit for the relationship between mean annual carbon sequestration and age. (2) For the five most common species in the Hangzhou area, the total individual amount of carbon sequestration per tree species can be ranked from high to low as follows: Celtis julianae, Cinnamomum camphora, Castanopsis sclerophylla, Liquidambar formosana, and Ginkgo biloba (tree age < 260 years). The ranking for trees aged above 260 years is as follows: Celtis julianae, Cinnamomum camphora, Liquidambar formosana, Castanopsis sclerophylla, and Ginkgo biloba. (3) The transient and mean annual carbon sequestration rate decreases as tree age increases; for most of the ancient trees in this research, the main growing period is 0–300 years. (4) Castanopsis sclerophylla, Liquidambar Formosana, and Osmanthus fragrans are recommended for urban landscape greening as they provide continuous long-term carbon sequestration and special landscape features.
1. Introduction
The escalation of global warming, caused by extensive greenhouse gas emissions, results in the degradation of the ecological environment on a global scale, posing threats to our survival [1,2,3,4,5,6]. Plants play a crucial role in the global carbon cycle. As forest plants grow and eventually decompose, carbon undergoes a continuous cycle of fixation and emission. Due to exceptionally long life cycles, with carbon accumulating over extended periods, ancient trees play a crucial role in long-term carbon sequestration [7,8,9]. In urban spaces, gardening trees serve primary carbon sequestration roles [10,11,12]. The identification of species with robust carbon sequestration capabilities supports the establishment of plant communities with high carbon sequestration in the long term. This can effectively contribute to carbon neutrality targets [13,14,15,16]. Investigating the features of the long-term carbon storage capacity of ancient garden trees is instrumental in devising sustainable development strategies and plans for long-term carbon sequestration.
Currently, research surrounding the carbon sequestration of vegetation covers three main aspects of the process. The first is the research on the carbon sequestration and oxygen emitting ability based on the short-term measurement of photosynthesis [17,18]. Bahtiar et al. [19] use a sinusoidal equation to fit the daily photosynthesis light response curve of Betung Bamboo, and the fitting result was used to estimate the total carbon sequestration over the year. Piper et al. [20] performed measurements for nonstructural leaf carbohydrates and gas exchange parameters to evaluate the carbon sequestration limitations of Kageneckia angustifolia at different altitudes. The results performed well in explaining the tree-line formation in the Mediterranean-type climate zone of central Chile. Gavito et al. [21] led two experiments that were designed to investigate whether the manipulation of arbuscular mycorrhizal carbon sequestration significantly affects the photosynthetic rate of the treated plant. Hussey and Long [22] used a dry matter accumulation method to evaluate the monthly changes in dry and ash-free dry weights per unit area of both the above- and belowground organs of the higher plants of an intertidal salt marsh.
The second aspect covered in the literature is mid-term carbon sequestration analyses based on the biomass of growth across seasons or years [23,24,25]. Through large-scale field investigations, used to approach fundamental datasets, including standing volume datasets, a biomass evaluation model can be applied to estimate the mass of all possible storages in an ecosystem [26]. Fang et al. [27] estimated the terrestrial vegetation carbon sequestration performed for China’s major biomass between 1981 and 2000 using ground observations. It was found that forest biomass carbon stock increased from 4.3 PgC to 5.9 PgC.
The third aspect is the long-term global carbon sequestration and resource supply analyses based on model simulations [23]. The model includes not only a statistical model based on experience data, but the biomass conversion process as well [28]. Hester [29] designed the ORGANON V2.0 software to project the changes that take place in mixed conifers in the young-growth forests stands of southwest Oregon. Cousar et al. [30] reported a policy analysis for the Sierra Nevada ecosystem in central California. The indicator variables include the number of large trees, the basal area, the stand and harvest volume, the present net value, and a fire hazard index based on a forest vegetation simulator.
However, for ancient garden trees (age above 100 years), the carbon sequestration feature remains unclear [31,32,33]. There are conflicting conclusions. Luyssaert et al. [34] reported that unmanaged, old-growth forests continue to sequester atmospheric carbon at a rate of 2.4 Mg C ha−1 year−1 for stand ages exceeding 200 years based on an analysis of net ecosystem productivity and other C flux data from temperate or boreal forest plots compiled from published studies and databases; meanwhile, Gundersen et al. [35] pointed out that the NEP data used in the analysis of Luyssaert, Schulze, Börner, Knohl, Hessenmöller, Law, Ciais, and Grace [34] appeared to contain overestimates and, thus, the quantitative estimates of C sequestration in old-growth forests are suspect.
According to the abovementioned aspects, there is a general lack of data and models for carbon sequestration features of ancient garden trees. It is necessary to carry out basic analysis towards the carbon sequestration features, adding up to the basic data and model sets.
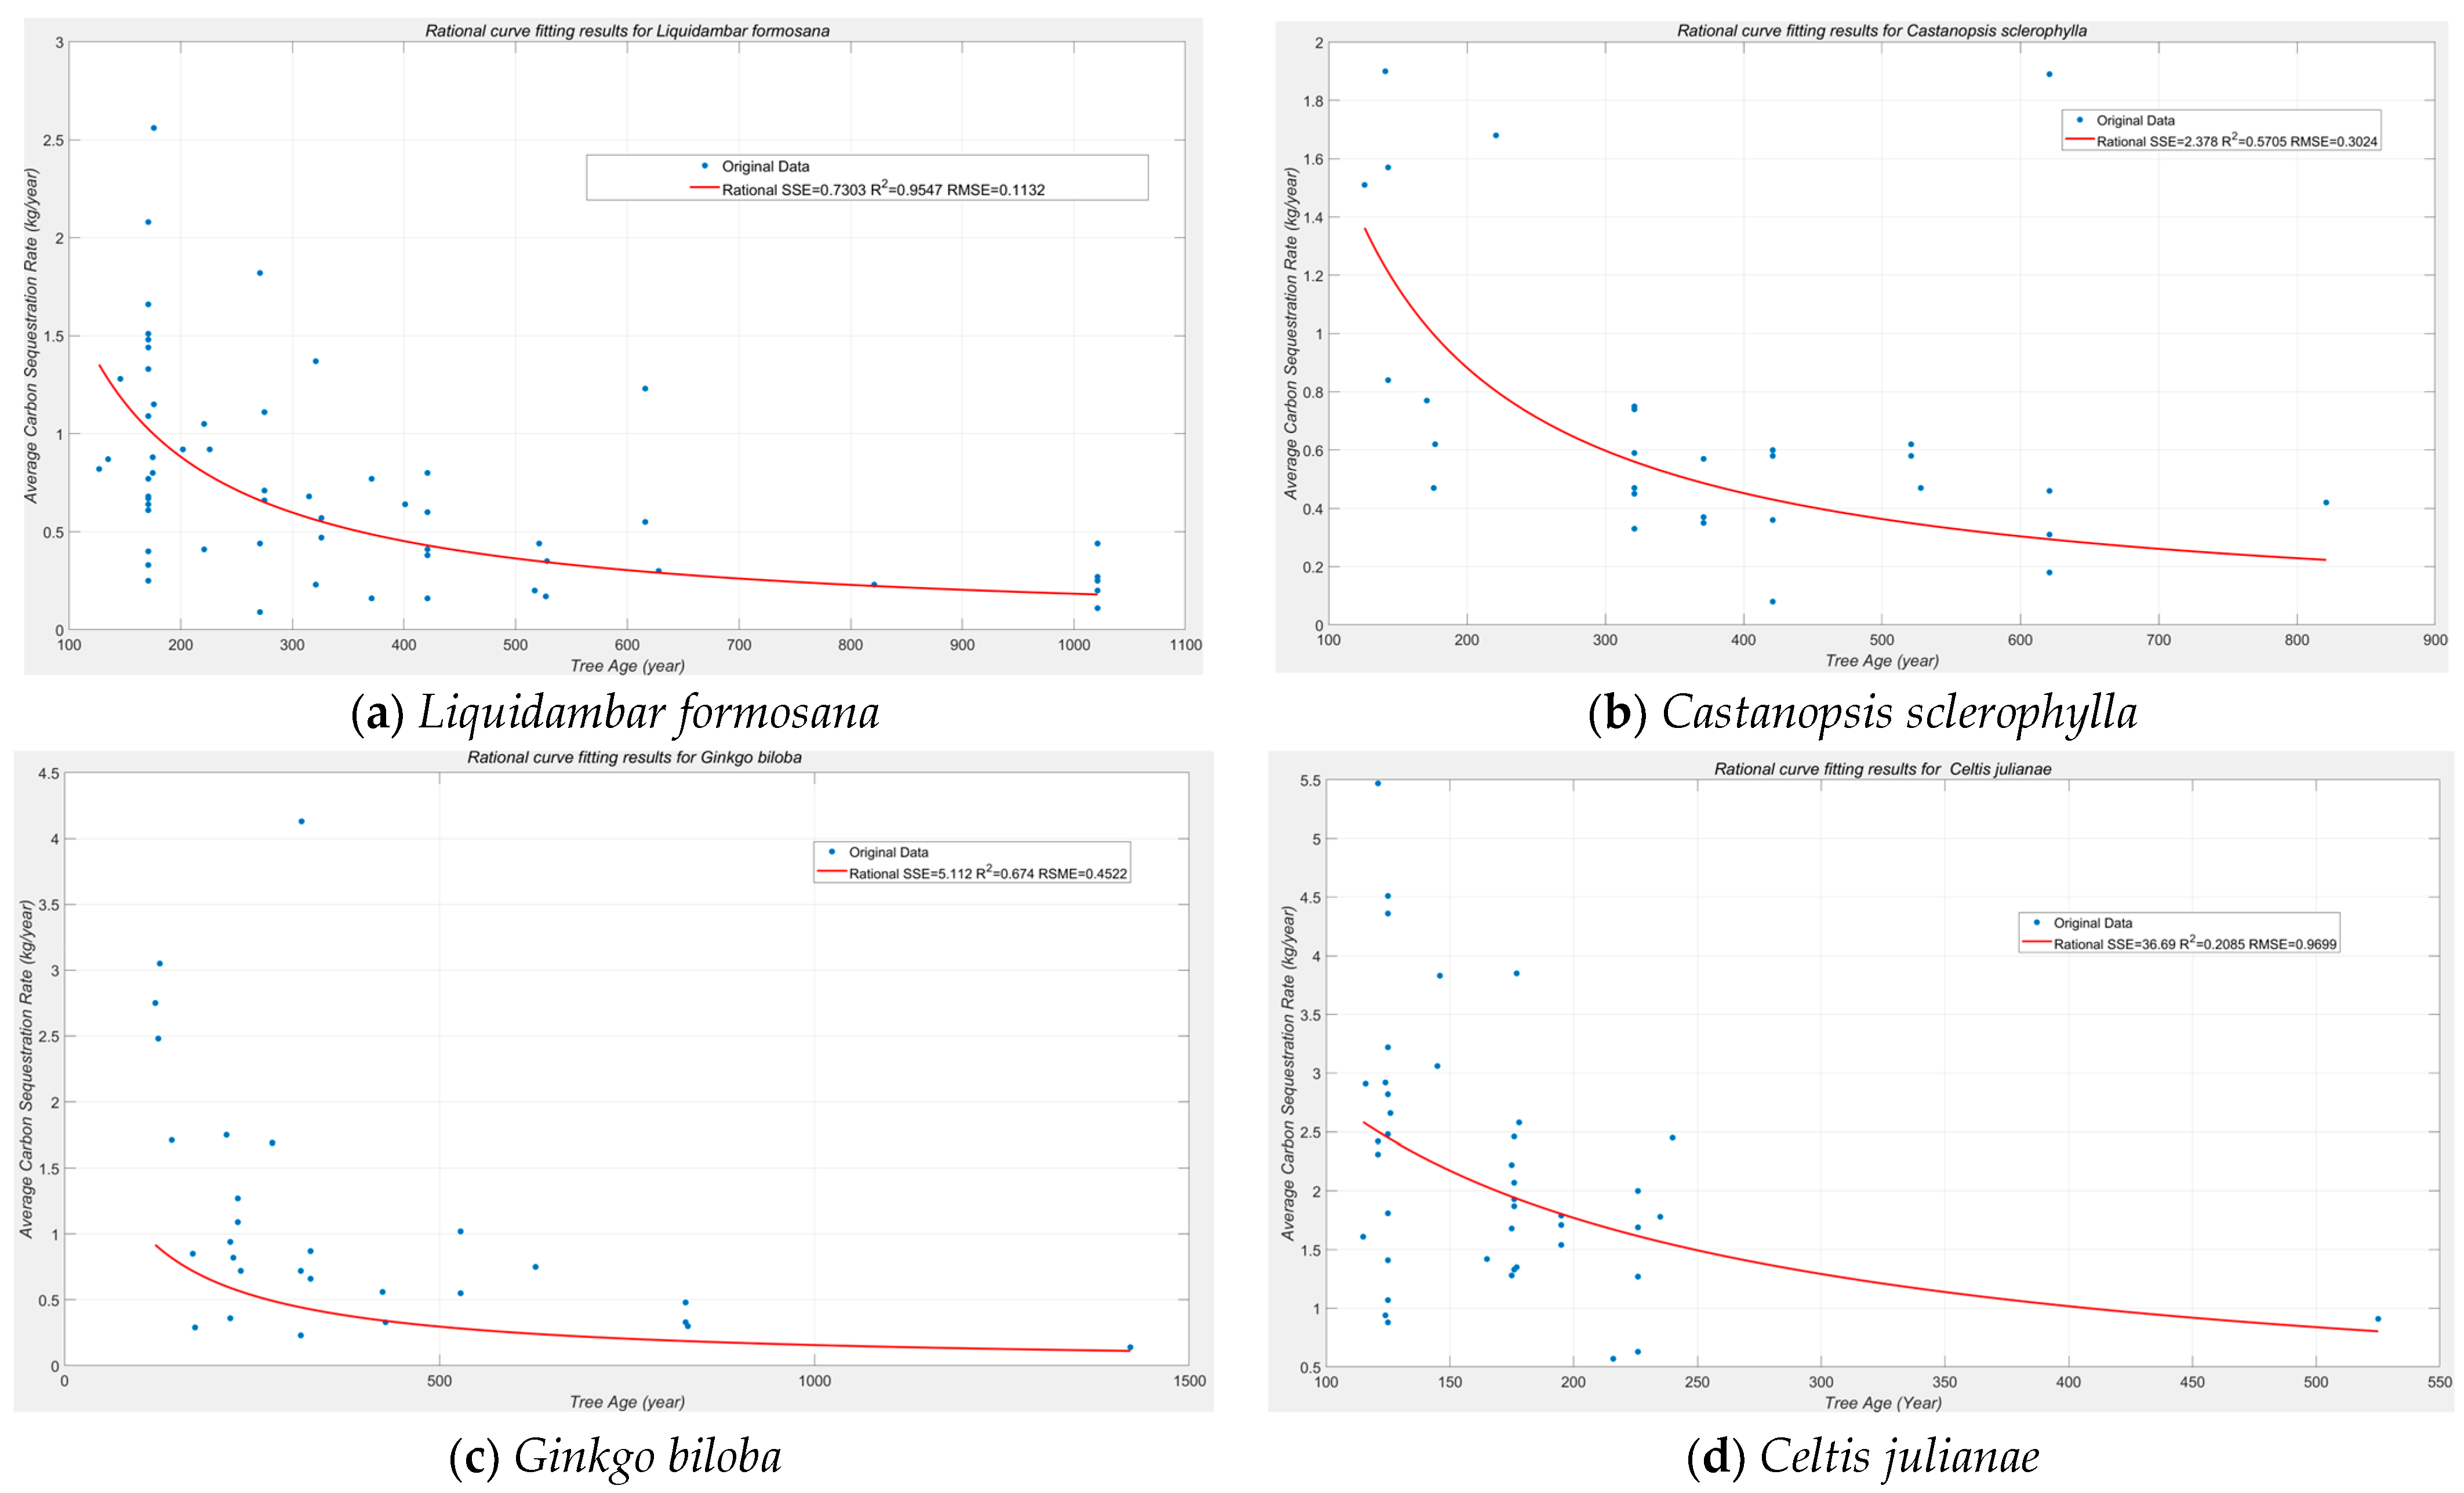
This research focuses on this topic and performs a detailed field investigation of more than 640 ancient individual garden trees that are widely utilized in urban greening with an age span between 100 and 1000 years in the West Lake Scenic Area, Hangzhou, China. Using dimension measurements and biomass calculations, the carbon sequestration data of each ancient tree are calculated. Then, statistical analyses, including regress modeling and normalized comparisons, based on age interval classification, are performed. Finally, ancient tree carbon sequestration models of five common species are built. The carbon sequestration abilities of more than 60 species are presented. The results provide the models of annual carbon sequestration rate and total carbon storage of the ancient trees, reflecting the carbon sequestration abilities of the plants.
2. Materials and Methods
2.1. Study Area
We chose the West Lake scenic and Historic Area in Hangzhou, China, as the designated investigation site (Figure 1). The area is among the first group of national key scenic areas announced by The State Council. Over time, it has evolved into a globally renowned tourist destination and has been honored with designation as a world cultural heritage site. There is a large number of well-preserved ancient and notable trees (Figure 2). Thus, it is an ideal location for ancient tree research. Positioned at 29°11′~30°34′ N, 118°20′~120°37′ E, the area falls within the subtropical monsoon region, with four distinct seasons and abundant rainfall.
Figure 1.
Location of Hangzhou, China.
Figure 2.
Ancient tree in Hangzhou.
With regard to the soil conditions, there are two sedimentary cycles, which can be divided into three groups: lower, middle, and upper. The lower part of the lower group is gray and dark gray silt muddy clay, silty clay (soft soil layer), locally mixed with a thin layer of silt, fluid–soft plastic. The upper group usually consists of the surface of the plain, and the top 0~1.7 m is cultivated soil or artificially filled soil, under which is sandy silt, silt, silty clay, clay, etc., soft plastic–plastic.
2.2. Methods
2.2.1. Sample Selection and Measurement
In order to reveal the carbon sequestration abilities of the ancient garden trees, we performed statistical analysis of the relationship between the carbon contained in the trees and their age. In Hangzhou, there are 1424 ancient trees (age above 100 years); 70% of them are located in the West Lake Scenic Area. All the reachable ancient trees in this area in the field investigation were selected as the samples of this work. The total number of samples was 643.
A detailed list of the 643 ancient trees, including their locations, ages, species, and IDs, was provided by the Greening Administration of Hangzhou. Then, the field investigations proceeded. The diameter at breast height (DBH) and the height of the trees were measured. Meanwhile, the data and photos of the trees were recorded in detail. The tree species and the numbers of samples are listed in Table 1.
Table 1.
The tree species and numbers.
2.2.2. Carbon Sequestration Calculation
This research used the biomass expansion factor method (BEFM) to calculate the carbon sequestration of the ancient trees. It was performed in four steps:
- (1)
- The stem volume calculation
According to the stem form indicator (SFI) method proposed by [36] Lin (1969), the stem volume of trees can be calculated by Equation (1).
V = g1.3(h + 3)fσ
In Equation (1), V (m3) is the stem volume, g1.3 (m2) is the sectional area of the measured tree at the height 1.3 m, h (m) is the height of the tree, and fσ is the experimental form number (constant number, 0.39–0.41).
- (2)
- The aboveground biomass calculation
According to IPCC (2010) [37], the aboveground biomass Bo can be calculated by the BEFM. The equation is (2).
Bo = V × DW × BEF
Bo (kg) is the biomass of stem above the ground. DW (kg/m3) is the density of the stem. BEF is the biomass expansion factor. The stem density and the BEF of common species in China are shown in Table 2.
- (3)
- The belowground biomass calculation
The belowground biomass Bu can be calculated according to the IPCC root–shoot ratio (RSR). The equation is (3).
Bu = Bo × RSR
RSR is the IPCC RSR; normally RSR = 0.26.
- (4)
- The total and mean annual carbon sequestration calculation
The total biomass of tree B (kg) and total carbon sequestration CS (kg) can be calculated by (4) and (5).
B = Bo + Bu
CS = B × CF
CF is the IPCC carbon content rate. The number used in this research is shown in Table 3. The mean annual carbon sequestration rate vCF (kg/year) can be calculated by (6).
vCF = CS/t
t (year) is the age of the tree.
Table 2.
The stem density and BEF of common tree species in China.
Table 2.
The stem density and BEF of common tree species in China.
| Species | Stem Density (t.m−3) | BEF | Species | Stem Density (t.m−3) | BEF |
|---|---|---|---|---|---|
| Pinus koraiensis | 0.396 | 1.45 | Quercus acutissima | 0.676 | 1.56 |
| Abies fabri | 0.366 | 1.72 | Betula platyphylla | 0.541 | 1.37 |
| Picea asperata | 0.342 | 1.72 | Tilia tuan | 0.420 | 1.41 |
| Cupressus funebris | 0.478 | 1.80 | Sassafras tzumu | 0.477 | 1.70 |
| Larix gmelinii | 0.490 | 1.40 | hardwood species | 0.598 | 1.79 |
| Pinus sylvestris | 0.375 | 1.88 | Eucalyptus | 0.578 | 1.48 |
| Pinus tabuliformis | 0.360 | 1.59 | Populus | 0.378 | 1.59 |
| Pinus armandii | 0.396 | 1.96 | Vernicia fordii | 0.239 | 3.27 |
| Pinus massoniana | 0.380 | 1.46 | Miscellaneous wood | 0.515 | 1.30 |
| Pinus yunnanensis | 0.483 | 1.74 | softwood species | 0.443 | 1.54 |
| Tsuga chinensis | 0.442 | 1.84 | Cunninghamia lanceolata | 0.307 | 1.53 |
| Pinus densiflora | 0.414 | 1.68 | Cryptomeria japonica | 0.294 | 1.55 |
| Pinus thunbergii | 0.493 | - | Metasequoia glyptostroboides | 0.278 | 1.49 |
| Keteleeria fortunei | 0.448 | - | Fraxinus mandshurica Juglans mandshurica Phellodendron amurense | 0.464 | 1.29 |
| Pinus kesiya | 0.454 | 1.58 | Camphora officinarum | 0.460 | 1.42 |
| Pinus densata | 0.413 | - | Phoebe zhennan | 0.477 | 1.42 |
Table 3.
The IPCC carbon content rate factors.
Table 3.
The IPCC carbon content rate factors.
| Climate Zone | Species | Carbon Content Rate | |
|---|---|---|---|
| Average Value | Range | ||
| Tropics and subtropics | All species | 0.47 | 0.44–0.49 |
| Temperature and cold temperature zone | Broad-leaved species | 0.48 | 0.46–0.50 |
| Conifer species | 0.51 | 0.47–0.55 | |
Note: Data from 2006 IPCC guide for national greenhouse gas list: agriculture, forestry and other land use.
2.2.3. Tree Age Data Acquisition
The ages of the trees were all acquired from The Greening Administration of Hangzhou. The measurement methods vary with the standing environments. Most of them were from complete historical records. For the rest ones without records, synthetic measurements were applied, including the growth cone, needle measurement, CT scanning, C14 analysis, and regression analysis towards the DBH [38,39,40,41].
2.2.4. Regression Model of Carbon Sequestration Abilities Provided by the Ancient Trees
The regression analysis was applied to set up the model of CF(t) and vCF(t), which were dependent on the tree ages. To accomplish this, the number of the trees within each age interval should be statistically effective. As Cinnamomum camphora took up to 46.8% of the samples, we used the species to evaluate several math structures that potentially fit the carbon sequestration abilities. For the other species with moderate quantities and age ranges, the regression expressions of Cinnamomum camphora were inherited. The species were Celtis julianae, Liquidambar formosana, Ginkgo biloba, and Castanopsis sclerophylla. By selecting the most significant regression, the best math structure was finally determined.
2.2.5. The Normalized Statistical Comparison Based on the Age Interval Classification
Except for the abovementioned five species, the other species did not have sufficient sample numbers for regression analysis. To evaluate their carbon sequestration abilities, normalized statistical comparison based on the age interval classification was conducted.
First, the ages of the ancient trees were classified into several age intervals. The span of each interval was decided by the following two principles:
(1) The spans of intervals should not exceed 20% of the average ages within the intervals. The start boundaries of the intervals were calculated using (7).
An+1 = floor (An × 11/9) + 1
(2) If two trees of the same species and similar ages were classified into different age intervals by chance, an additional interval containing both trees was additionally analyzed. Then, the average CS of each species within each age interval was normalized by the average CS of Cinnamomum camphora.
2.2.6. Model Structure Selection
For all Cinnamomum camphora samples, the scatter plot of the total CS versus age is shown in Figure 3. By observation, the CS-age data did not show obvious trends. Other species show similar results (Figure 4).
Figure 3.
Scatter plot of Cinnamonum camphora: total CS versus age.
Figure 4.
Scatter plot of Liquidambar formosana, Castanopsis sclerophylla, Ginkgo biloba, and Celtis julianae: total CS versus age.
The scatter plot of vCF versus age (Figure 5)was further analyzed. Figure 5 indicates an obvious monotonic decreasing trend. Such a trend was also shown in the vCF-age scatter plots of the other species (Figure 6). Then, this monotonic decreasing feature of vCF-age was the modeling focus in this research.
Figure 5.
Scatter plot of Cinnamonum camphora: vCF versus age.
Figure 6.
Scatter plot of Liquidambar formosana, Castanopsis sclerophylla, Ginkgo biloba, and Celtis julianae: vCF versus age.
Therefore, it is a common regularity that the mean annual carbon sequestration rate vCF decreases as the age of tree increases. Such a monotonic decreasing feature is a common regularity across the species. Several typical math expressions (model structures) that can indicate such a trend are listed in Table 4.
Table 4.
Typical possible math expressions that fit the trend of vCF(t).
3. Results
3.1. Long-Term Carbon Sequestration by Trees
Based on the aforementioned calculations and comparisons, it can be inferred that studying the long-term carbon sequestration patterns of ancient trees is imperative. These patterns manifest over hundreds to thousands of years, indicating a universal trend wherein the average carbon sequestration rate decreases with tree age. The findings from this study demonstrate a consistent pattern across all analyzed trees.
3.2. Regress Analysis of Carbon Sequestration Models
Based on the data of Cinnamomum camphora, regression analysis based on the model structures listed in Table 4 was performed. The significance indicators of the results were compared, then the best model structures were selected. The fitting curves together with scatter plots are shown in Figure 7. The regression performances are listed in the figure legends, and the corresponding regression factors are listed in Table 5. For polynomial models, the third-order model better fitted the sample data than the second order. As for the rational model, the simpler structure obtains smaller SSE and higher R-square indicators, presenting a more significant result. The exponential and monomial models achieved similar performances to the rational models. The rational model with higher order on the numerator and the monomial model with constant item both resulted in low significance. Therefore, the three models best describing the vCF(t) are listed in Table 6. The three models were then applied to fit the carbon sequestration abilities of the other three species with moderate sample numbers; the results are listed in Table 7.
Figure 7.
The regression curves of the possible model types together with the scatter plots for Cinnamomum camphora. The horizontal axis is tree age in years, and the vertical axis is the in kg/year.
Table 5.
The regression factors of the potential model structures and regression quality indicators.
Table 6.
The three models that best describe the vCF(t) of Cinnamomum camphora.
Table 7.
The regression model factors and quality indicators for Liquidambar formosana, Castanopsis sclerophylla, Ginkgo biloba, and Celtis julianae.
According to Table 7, the performance stability of the rational model persists among species. The fitting curves are shown in Figure 8. Then, it was selected as the model that describes the vCF(t); see (8).
Figure 8.
The rational model fitting curves for Liquidambar formosana, Castanopsis sclerophylla, Ginkgo biloba, and Celtis julianae. The horizontal axis is tree age (years), and the vertical axis is (kg/year).
b0 and a0 are the model factors. They vary with the species of the trees. Based on (6), the total carbon sequestration model CS(t) can be calculated by (9).
The transient carbon sequestration vTCS(t) in each year can be calculated by the derivative of CS(t) (Equation (10)).
3.3. Carbon Sequestration Features of the Five Common Ancient Trees
According to the results of Section 3.2, the carbon sequestration model factors of the five major species are listed in Table 8. The vTCS(t) and CS(t) curves and the corresponding fitting indicators are shown in Figure 9 and Figure 10, respectively.
Table 8.
The rational model fitting factors for the five major species.
Figure 9.
vTCS(t) curve.
Figure 10.
The CS(t) curves.
Figure 9 indicates that the vTCS(t) per tree species ranking from high to low is Celtis julianae, Liquidambar formosana, Cinnamomum camphora, Ginkgo biloba, and Castanopsis sclerophylla. Figure 10 shows that the CS(t) per tree species ranking from high to low is Celtis julianae, Cinnamomum camphora, Castanopsis sclerophylla, Liquidambar formosana, and Ginkgo biloba in the first 260 years. After 260 years, the ranking is Celtis julianae, Cinnamomum camphora, Liquidambar formosana, Castanopsis sclerophylla, and Ginkgo biloba.
3.4. Carbon Sequestration Features of Other Ancient Trees
Celtis julianae, Liquidambar formosana, Cinnamomum camphora, Ginkgo biloba, and Castanopsis sclerophylla comprise the majority of the 643 ancient trees. For the species that are few in number or small in age spans, regression analysis would be insufficient. The general comparisons based on the direct measured data were performed as described in Section 2.2.4. The age interval classification is shown in Table 9. In this research, A1 = 100. The total carbon sequestrations of each class were normalized by the average carbon sequestration of Cinnamomum camphora within the same age interval. The CS of Cinnamomum camphora was calculated according to (11). The standard CSs of each age interval are listed in Table 9. Within the same age interval, the normalized CS results are shown in Table 10.
CSStandard = 263 × (An + An + 1 − 1)/[(An + An + 1 − 1) + 104.02]
Table 9.
The age interval classifications and the standard CS.
Table 10.
The CS results of the different species within the classified age intervals (tree age 279–938 years).
Table 10, Table 11 and Table 12 indicate that ancient Quercus glauca provides ideal carbon sequestration over a long time. The total carbon sequestration of Quercus glauca is around double that of Cinnamomum camphora. Machilus japonica has similar abilities, but the number of samples is too small. Other high-carbon-sequestration species include Celtis sinensis, Juniperus chinensis, Osmanthus, and Aphananthe aspera.
Table 11.
The CS results of the different species within the classified age intervals (tree age 152–278 years).
Table 12.
The CS results of the different species within the classified age interval (tree age 101–151 years).
4. Discussion
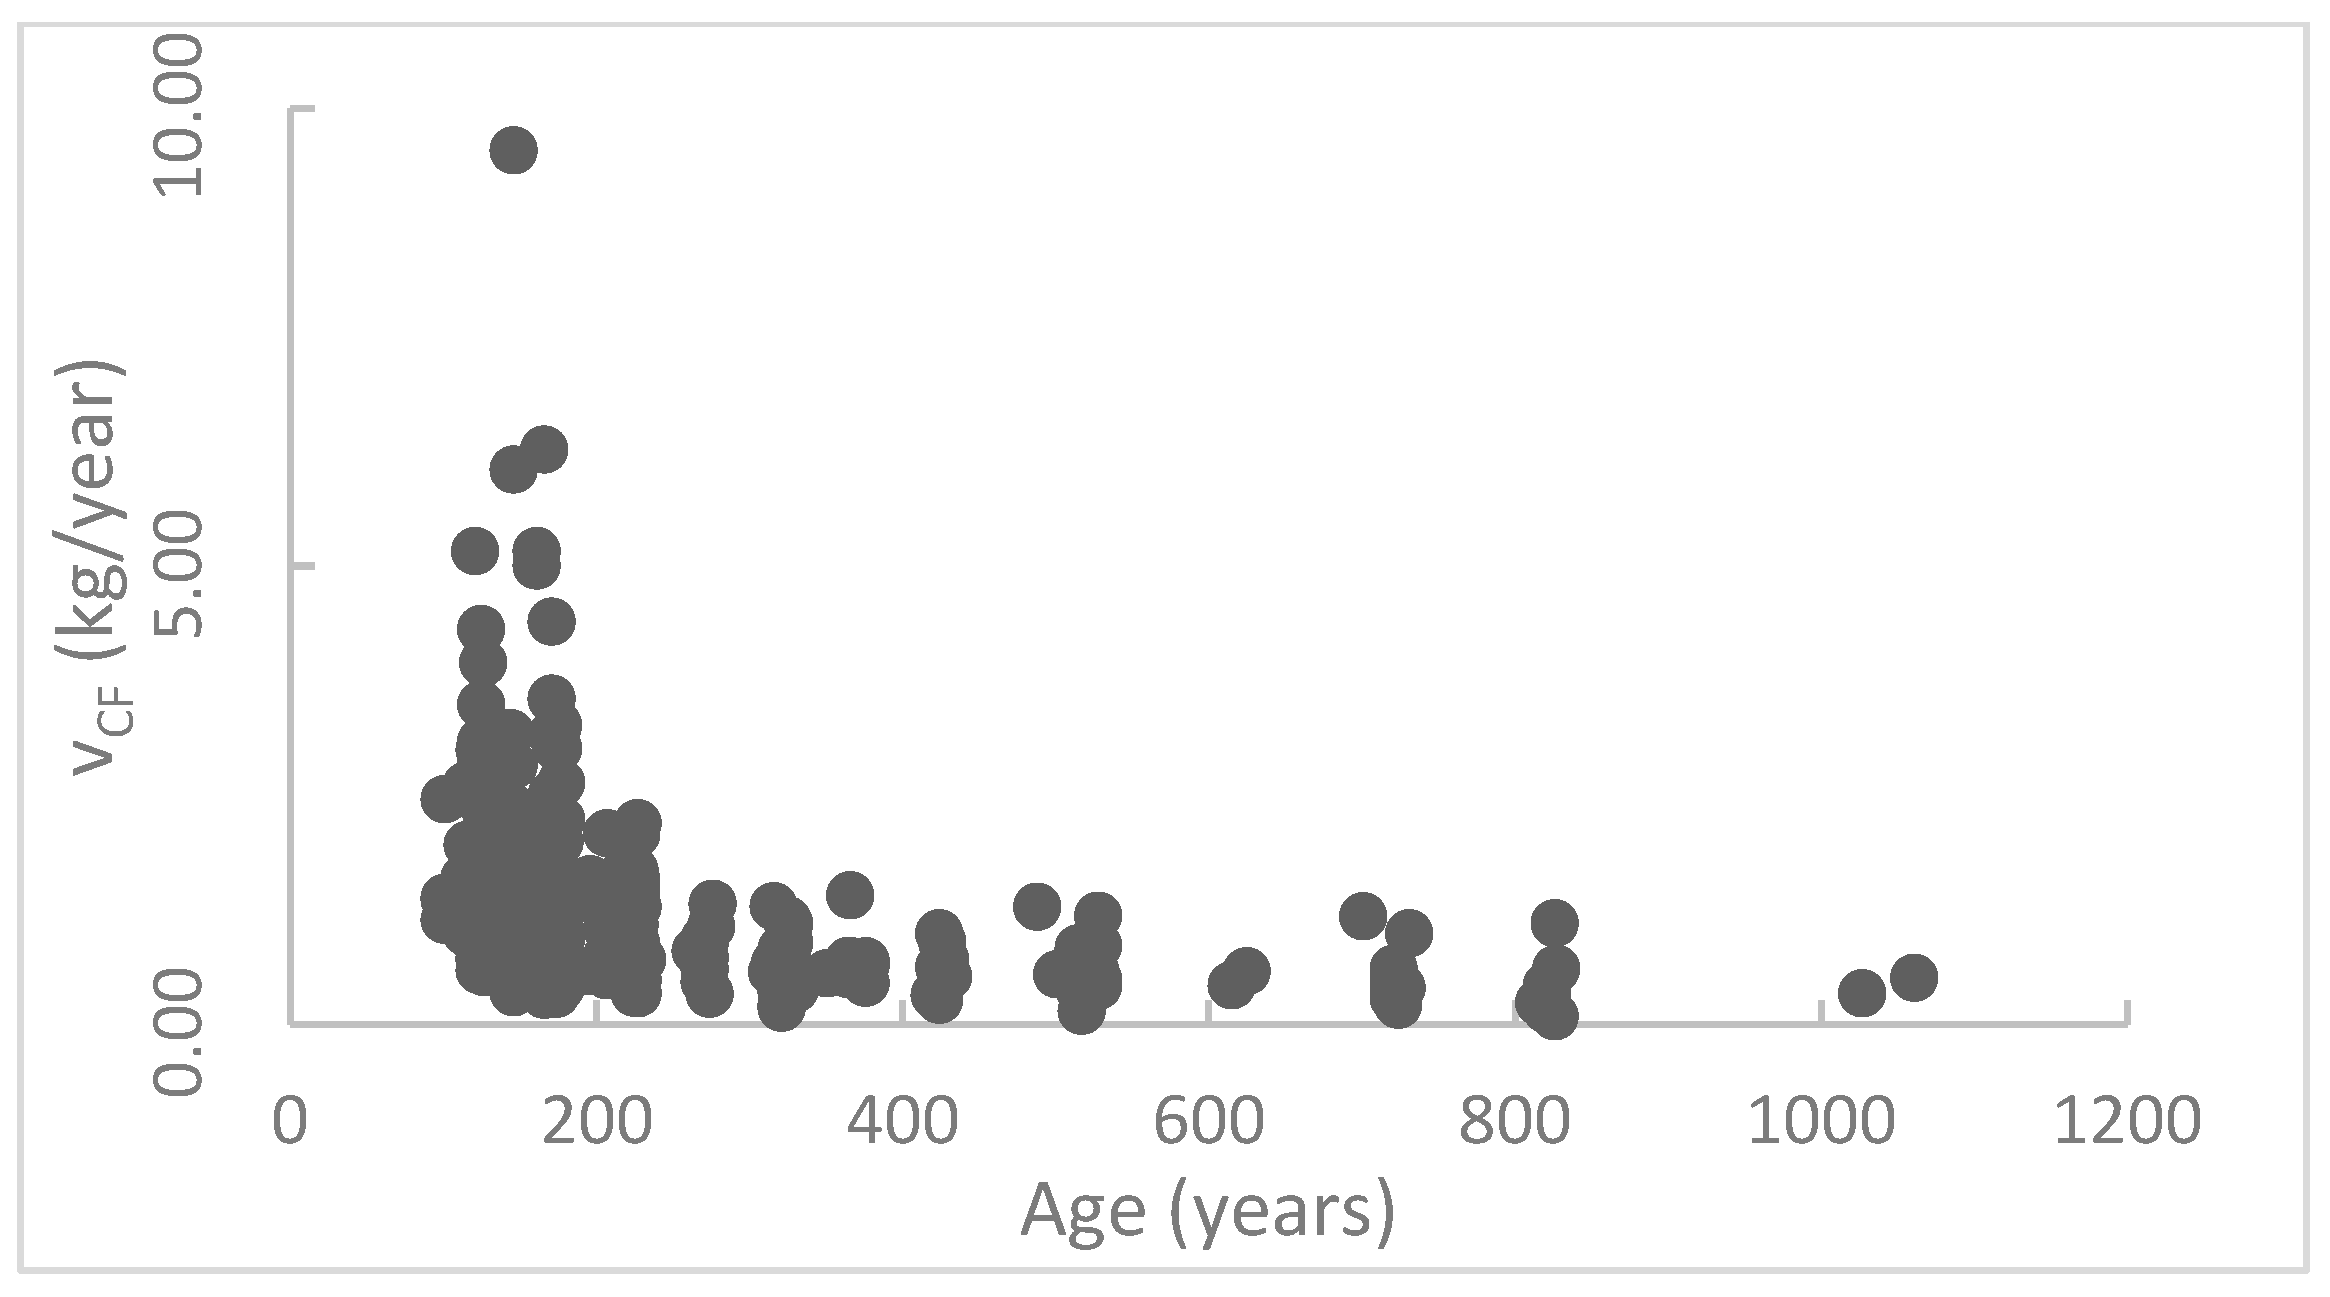
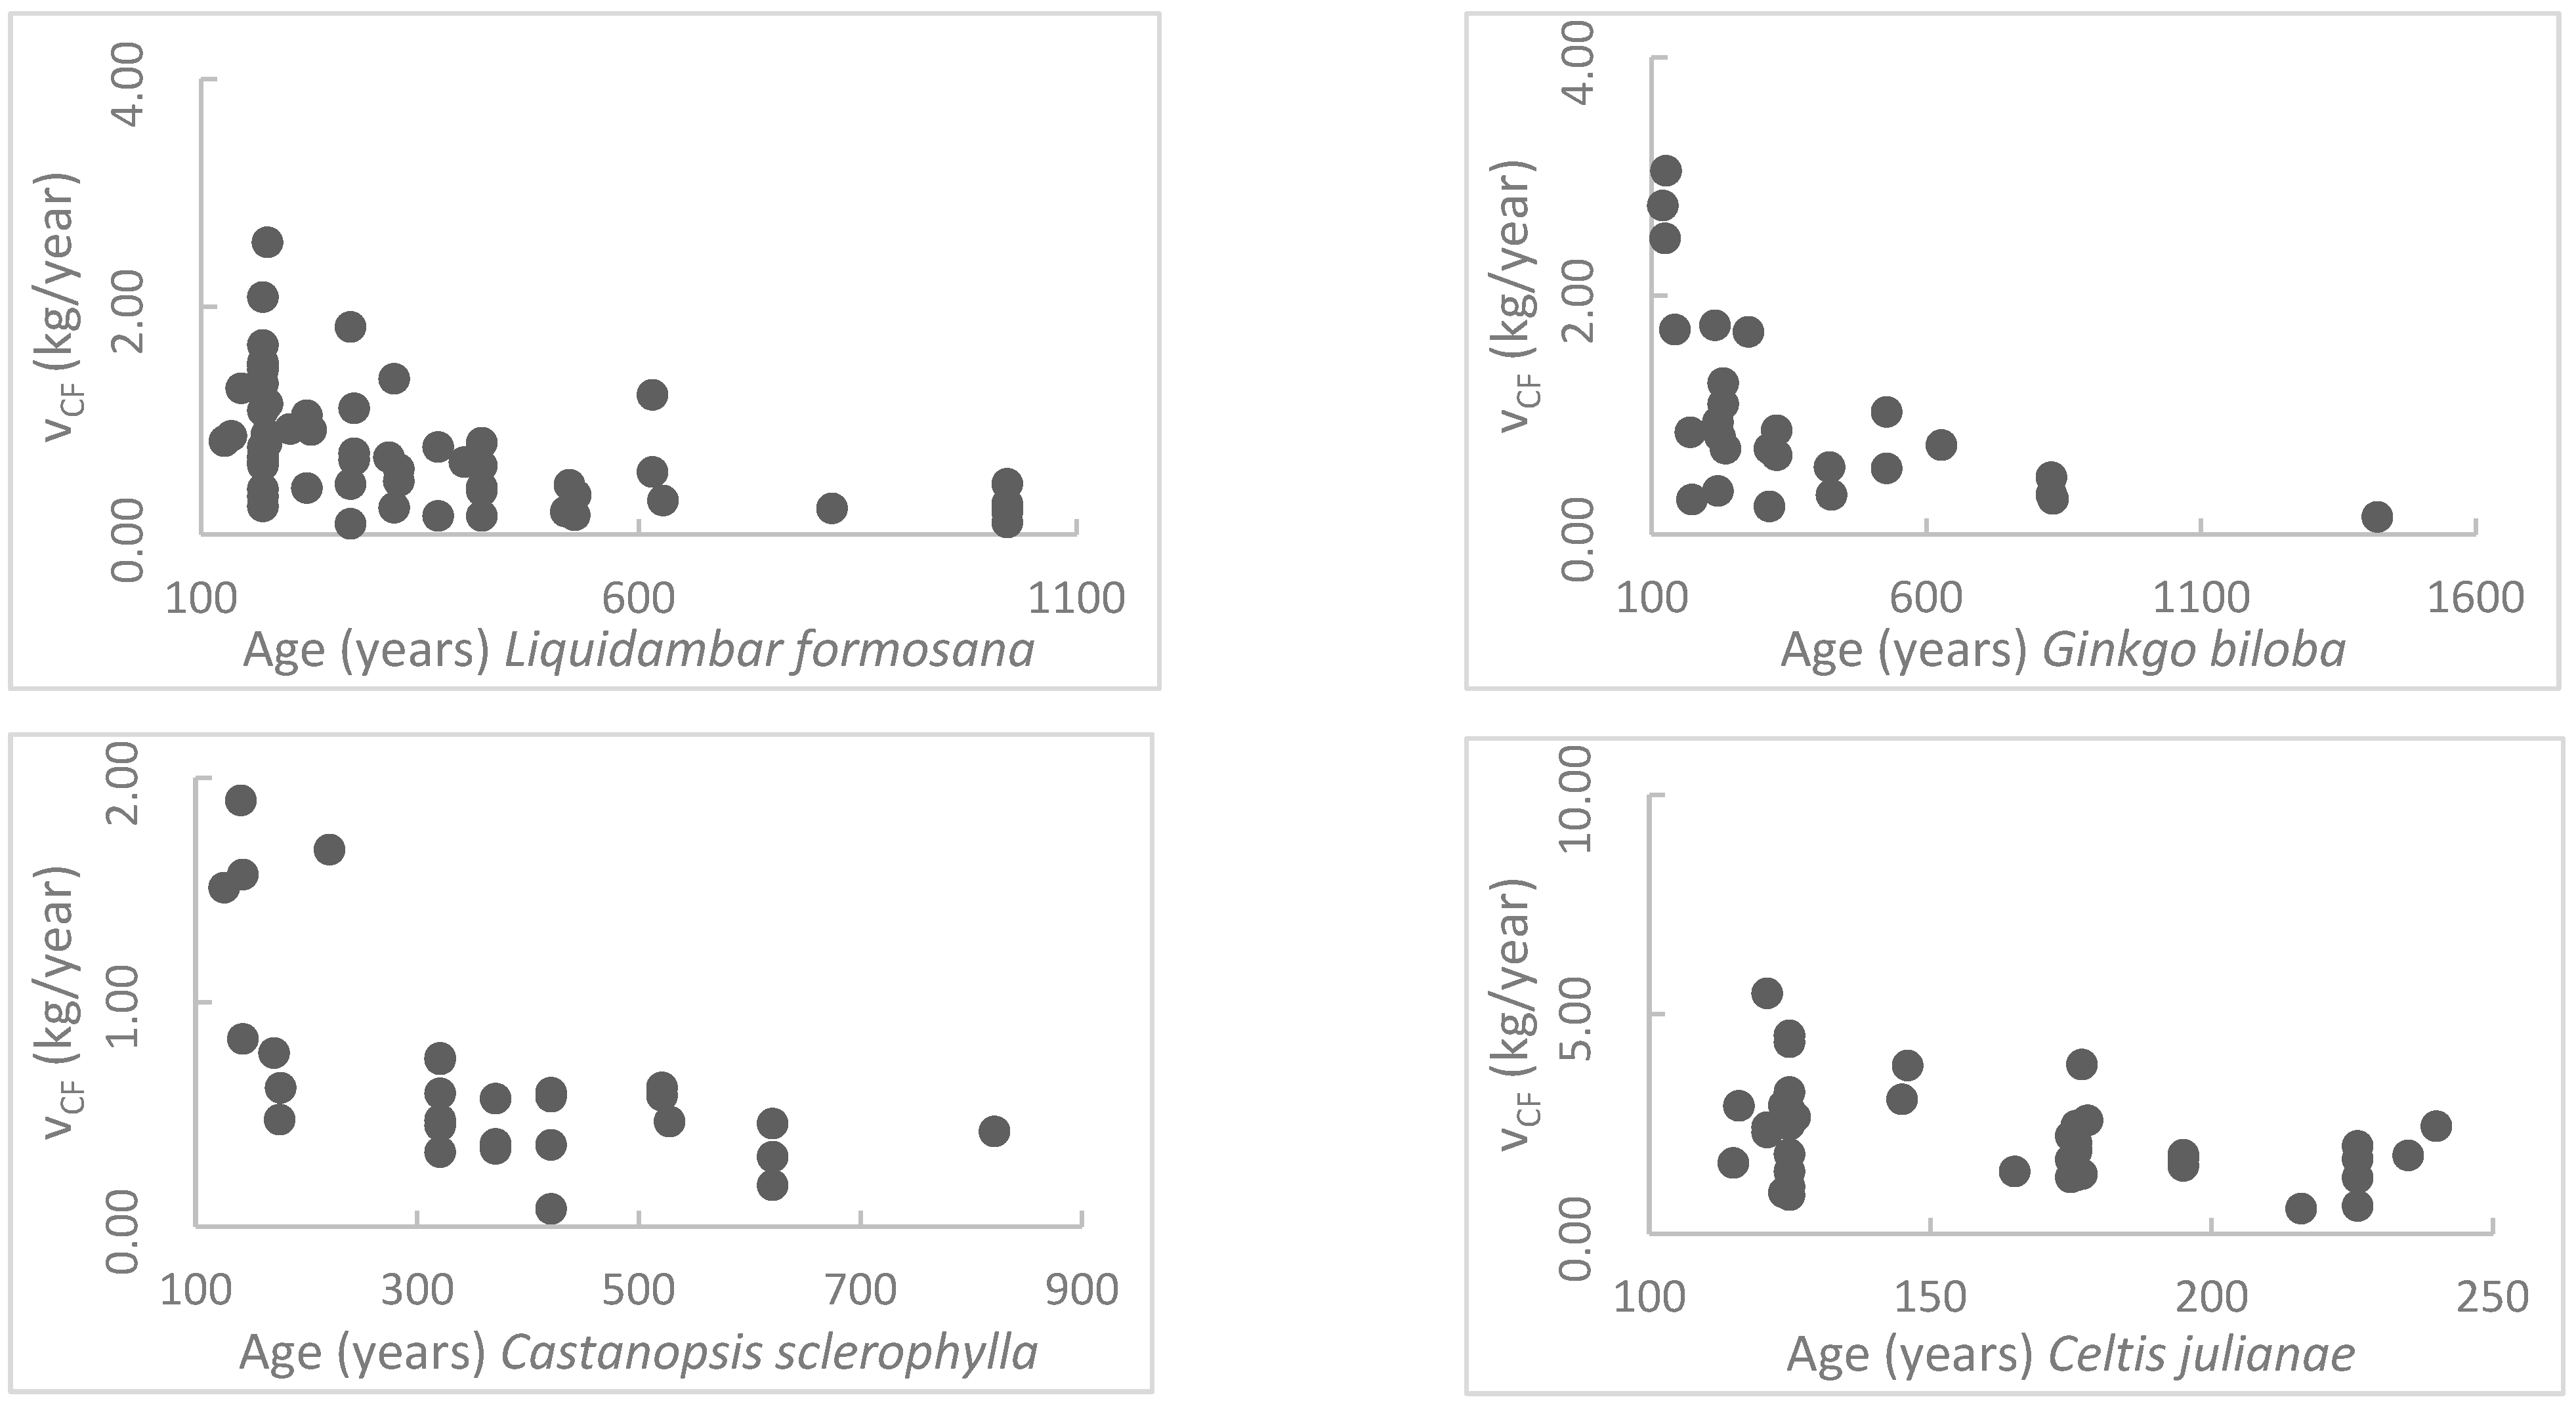
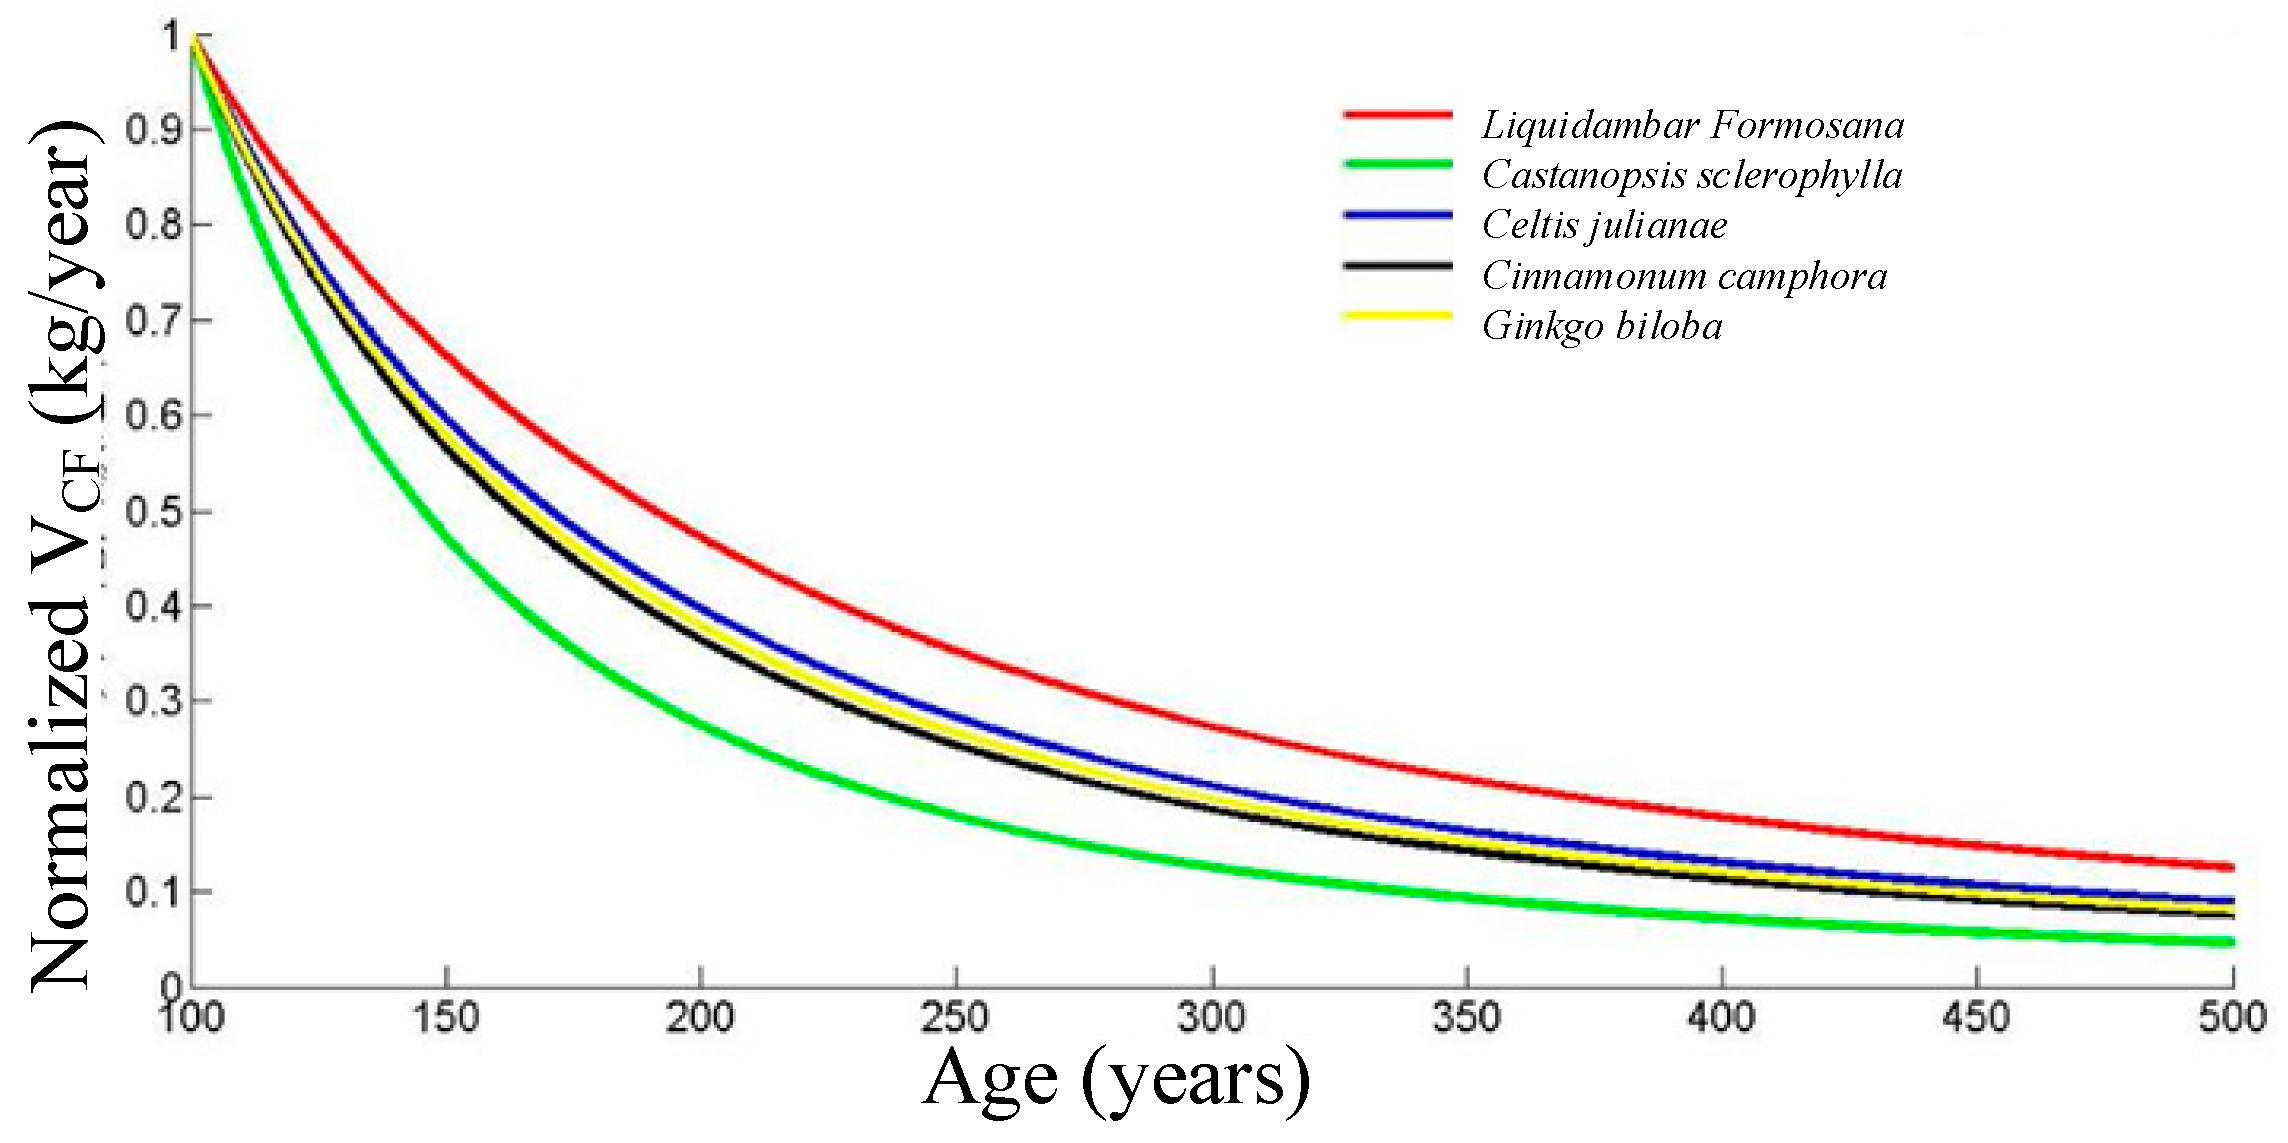
The results in this research reflect that the annual carbon sequestration rates of the ancient trees reduce with their ages. This is similar to the common regularities of most creatures [42,43]. Limited by the ability of self-weight bearing, resistance of natural disasters, and disease fighting, the total size of the ancient trees cannot increase linearly [44]. Thus, the carbon sequestration rate decreases. The CS model in this research is different from the logistic model for forests within 5–10 years. The model proposed in this research is more appropriate for trees aged 100–1000 years, living in an environment with more human activity.
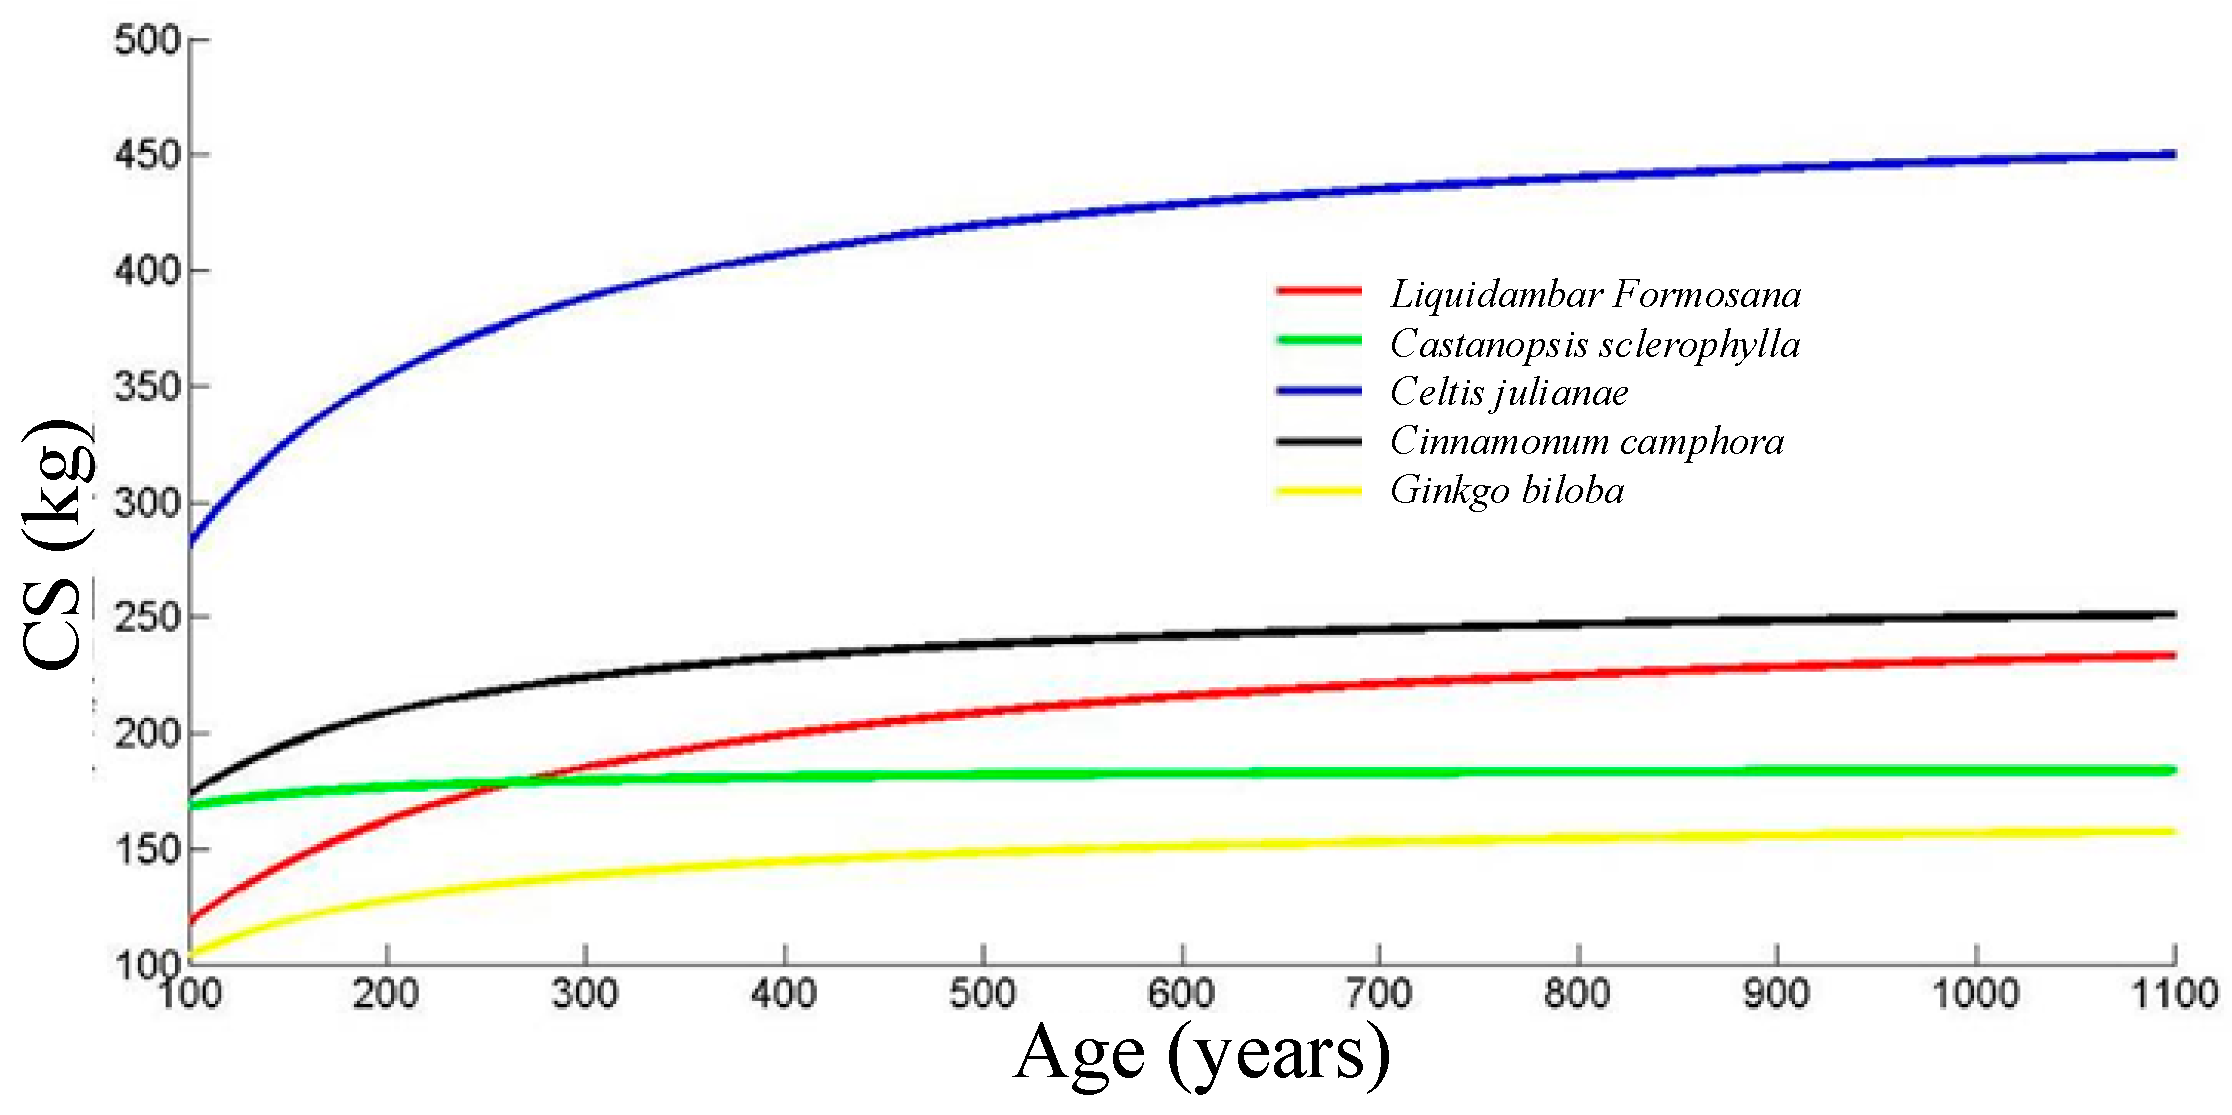
According to the expression of CS(t), the total carbon sequestration of the ancient trees has an upper limit. The limitation can be calculated by (11), and the result is b0. Over a long span of time, the ancient trees are always carbon sequesters rather than sources. The ancient trees can well limit the carbon captured and serve as stable holds. Continuous protection of the ancient trees is important and necessary to prevent reemission. The results also comply with the research of Brienen et al. [45], who pointed out that there is an upper limitation of carbon sequestration. It was concluded in their research that although extant models predict that the density of carbon dioxide in the atmosphere and global warming will continue to cause a net carbon uptake this century, there are indications that increased growth rates may shorten the lifespan, and, thus, recent increases in forest carbon stocks may be transient due to lagged increases in mortality.
For different tree species, the time (in year) to reach half of such a limitation can be calculated by (12); the result is parameter a0. In long-term carbon sequestration planning, the species with high b0 and low a0 are recommended. For mature trees, the rate of carbon sequestration decreases with the year. Especially, the rate of carbon sequestration is low. Although the trees need protection, low-emission maintenance technologies are recommended. A reconsideration of forest development and use according to such a feature can be further set up to increase the efficiency of resource application [46].
Although the biomasses of the ancient trees in this research were measured and calculated, the research still has some limitations. Within such a long period of time, many of the samples in this research experienced thunder, storms, and illness. The biomasses of fallen stem and leaves through years were huge. Although part of that was emitted back into the atmosphere, massive carbon was still fixed in the soils around the trees. Mixed with the biomasses from the surrounding trees, such carbon sequestration cannot be accurately calculated. It can be deducted that the ancient trees bring more carbon sequestration on Earth than the normal trees, as they live longer and accumulate more. The model deviation features in other regions than Hangzhou are still unknown. This can be carried out in future research.
5. Conclusions
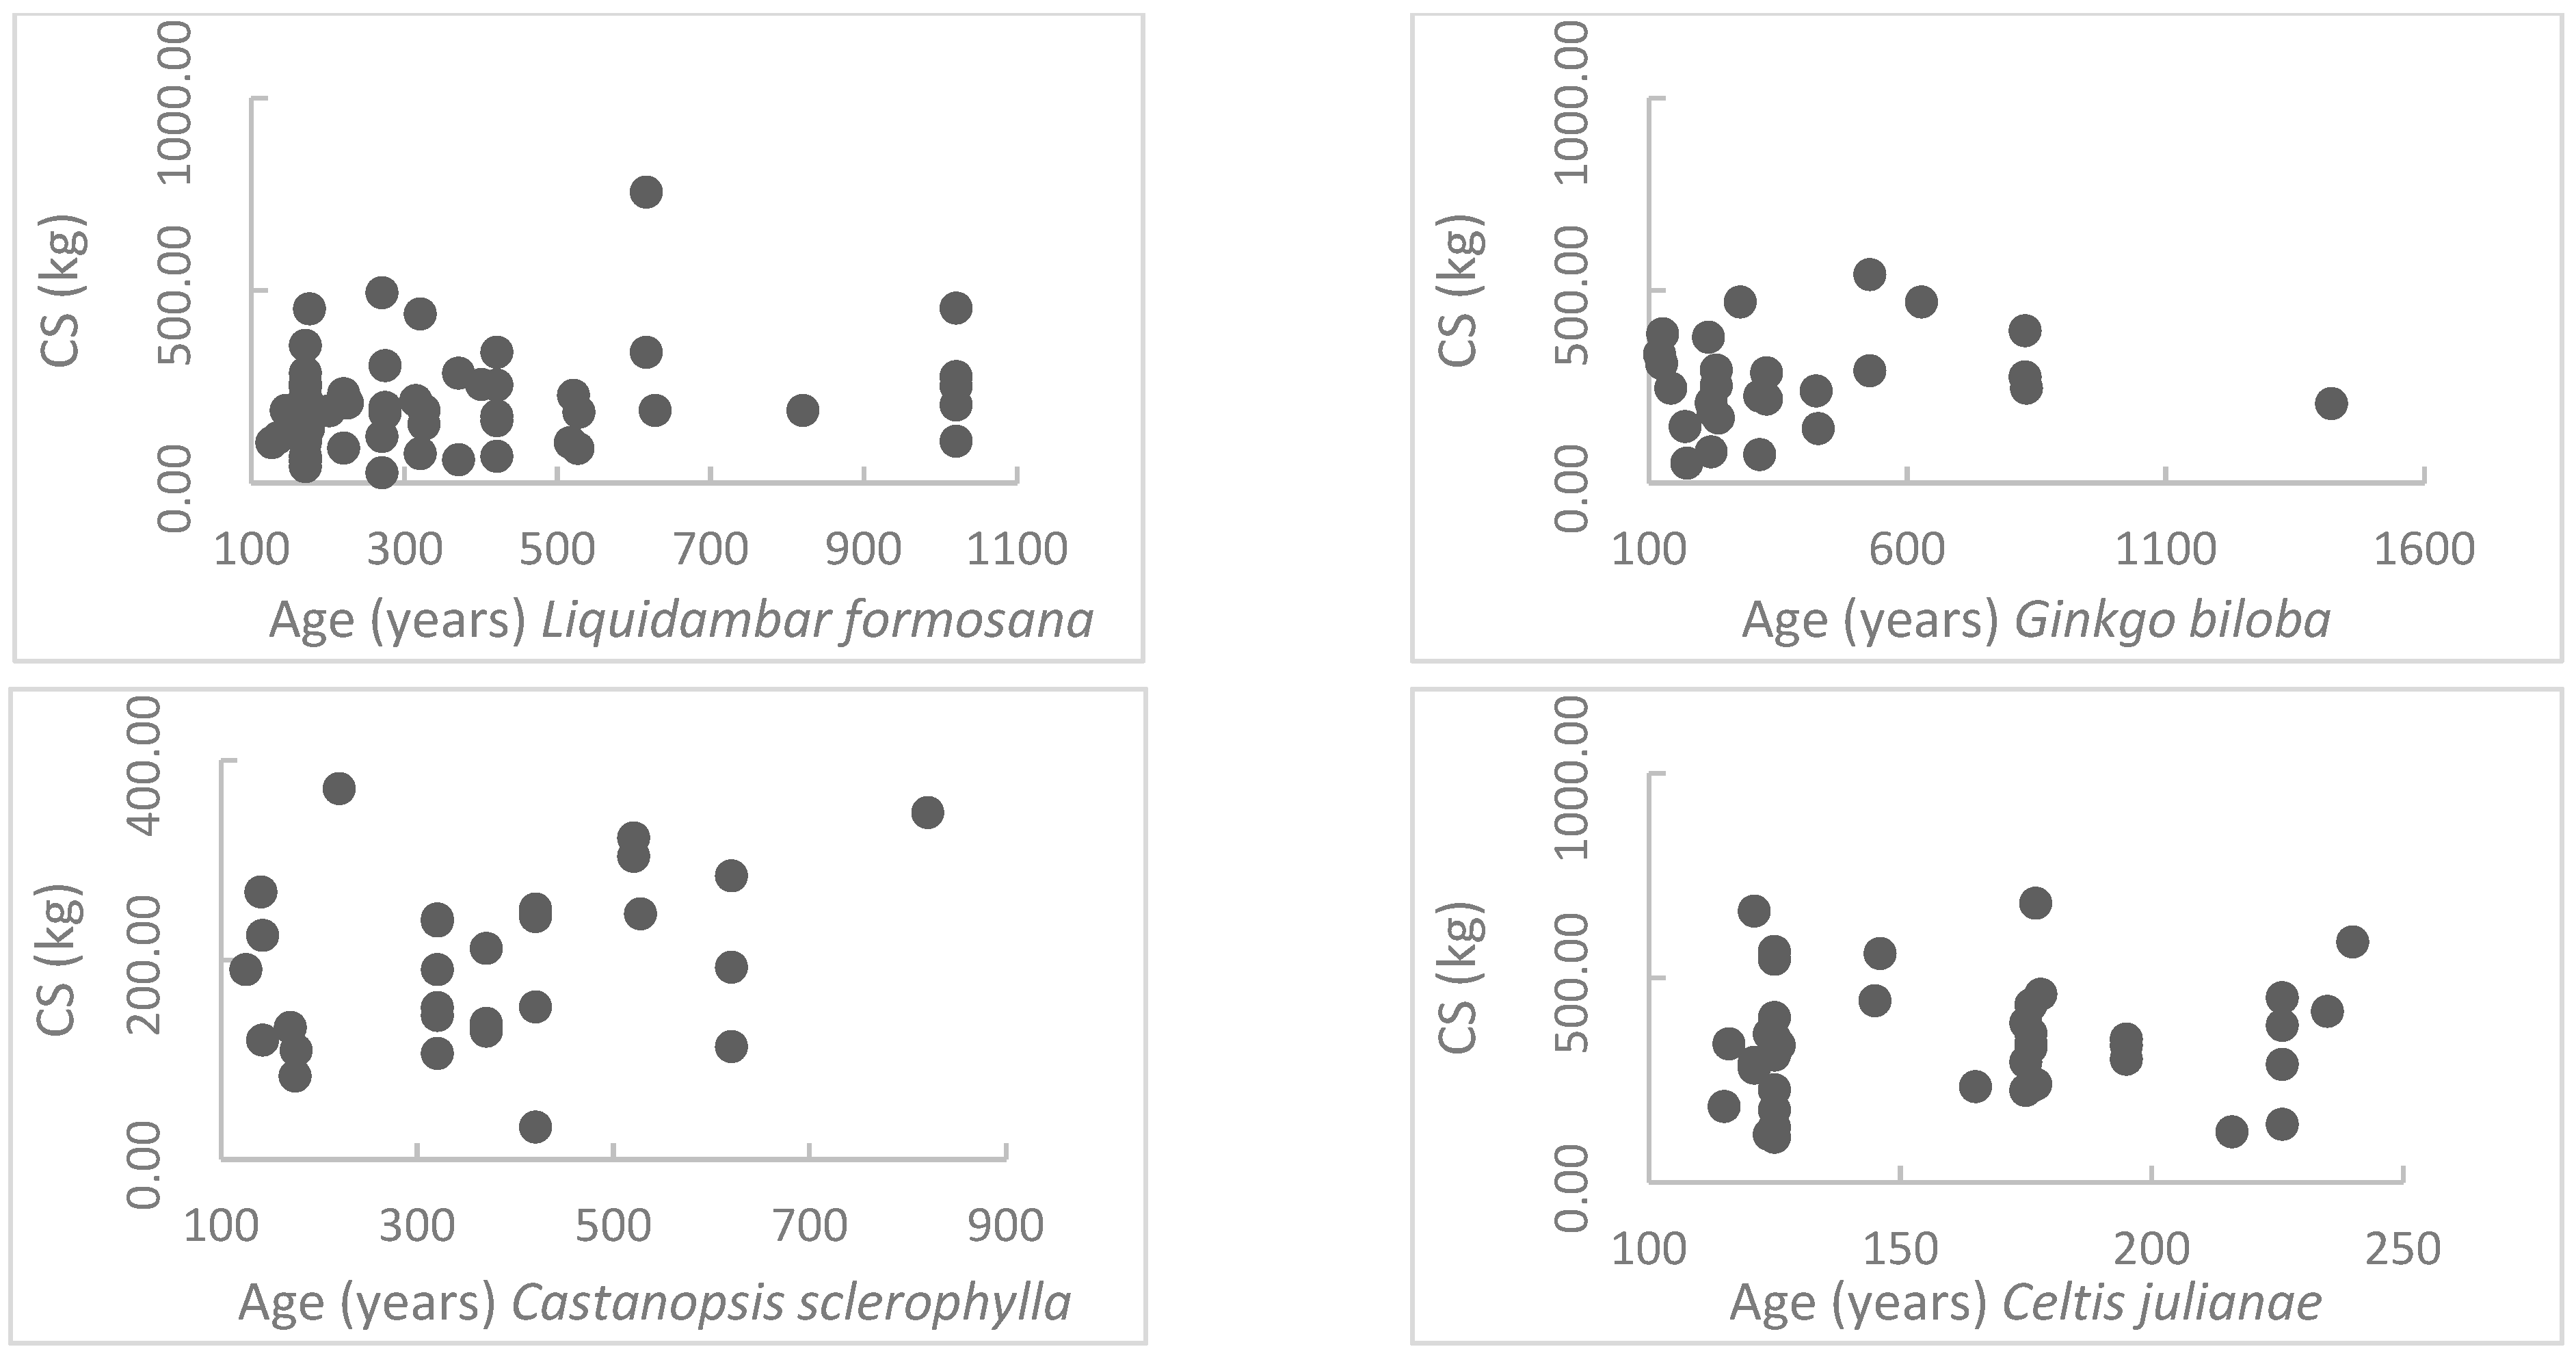
Targeting at evaluating the carbon sequestration abilities of the ancient garden trees, the carbon sequestration data of 643 ancient trees were calculated using comprehensive field surveys. By statistical analysis, the long-term carbon sequestration ability ranking (from high to low) of the five most common garden tree species in Hangzhou area is Celtis julianae, Cinnamomum camphora, Castanopsis sclerophylla, Liquidambar formosana, and Ginkgo biloba (100 < age < 260 years). After 260 years, the ranking is Celtis julianae, Cinnamomum camphora, Liquidambar formosana, Castanopsis sclerophylla, and Ginkgo biloba.
For the tree species with limited sample numbers, the total carbon sequestration model of Cinnamomum camphora was used as a reference to conduct a comparative analysis across species. The findings indicate that the long-term carbon sequestration capacities of six species exceed that of Cinnamomum camphora; they are Quercus glauca, Machilus japonica, Celtis sinensis, Juniperus chinensis, Osmanthus, and Aphananthe aspera. The long-term carbon sequestration capacities of the other 49 species were lower than that of Cinnamomum camphor. According to the conclusions, in future urban space greening, Castanopsis sclerophylla, Liquidambar Formosana, and Osmanthus fragrans are recommended as they can better fix carbon in the long term. Especially, Castanopsis sclerophylla stores almost twice the carbon of Cinnamonum camphora. Meanwhile Liquidambar Formosana and Osmanthus fragrans provide special landscape features of colorful leaves and floral scent with relatively high carbon sequestration as well.
Author Contributions
Conceptualization, H.D.; methodology, H.D.; validation, H.D.; formal analysis, H.D.; resources, Z.B.; writing—original draft preparation, H.D.; writing—review and editing, H.D.; supervision, F.Z.; project administration, Z.B.; funding acquisition, H.D. All authors have read and agreed to the published version of the manuscript.
Funding
This research received no external funding.
Data Availability Statement
Data are contained within the article.
Conflicts of Interest
The authors declare no conflicts of interest. The authors declare that they have no known competing financial interests or personal relationships that could have appeared to influence the work reported in this paper.
References
- Pan, Y.; Birdsey, R.A.; Fang, J.; Houghton, R.; Kauppi, P.E.; Kurz, W.A.; Phillips, O.L.; Shvidenko, A.; Lewis, S.L.; Canadell, J.G.; et al. A Large and Persistent Carbon Sink in the World’s Forests. Science 2011, 333, 988–993. [Google Scholar] [CrossRef] [PubMed]
- Keenan, T.F.; Williams, C.A. The Terrestrial Carbon Sink. Annu. Rev. Environ. Resour. 2018, 43, 219–243. [Google Scholar] [CrossRef]
- Mitchard, E.T.A. The tropical forest carbon cycle and climate change. Nature 2018, 559, 527–534. [Google Scholar] [CrossRef] [PubMed]
- Becker, S.; Bouzdine-Chameeva, T.; Jaegler, A. The carbon neutrality principle: A case study in the French spirits sector. J. Clean. Prod. 2020, 274, 122739. [Google Scholar] [CrossRef]
- Fankhauser, S.; Smith, S.M.; Allen, M.; Axelsson, K.; Hale, T.; Hepburn, C.; Kendall, J.M.; Khosla, R.; Lezaun, J.; Mitchell-Larson, E.; et al. The meaning of net zero and how to get it right. Nat. Clim. Chang. 2022, 12, 15–21. [Google Scholar] [CrossRef]
- Zheng, Y.; Li, Z.; Chai, J. Progress and prospects of international carbon peaking and carbon neutral research–based on bibliometric analysis (1991–2022). Front. Energy Res. 2023, 11, 1121639. [Google Scholar] [CrossRef]
- Tan, Z.-H.; Zhang, Y.-P.; Schaefer, D.; Yu, G.-R.; Liang, N.; Song, Q.-H. An old-growth subtropical Asian evergreen forest as a large carbon sink. Atmos. Environ. 2011, 45, 1548–1554. [Google Scholar] [CrossRef]
- McGarvey, J.C.; Thompson, J.R.; Epstein, H.E.; Shugart, H.H. Carbon storage in old-growth forests of the Mid-Atlantic: Toward better understanding the eastern forest carbon sink. Ecology 2015, 96, 311–317. [Google Scholar] [CrossRef]
- Liu, H.; Zhang, L.; Ma, Q.; Zhao, W.; Chen, Y. From tree to forest: Multiple carbon sink constraints. Innovation 2023, 4, 100463. [Google Scholar] [CrossRef]
- Zhu, K.; Zhang, J.; Niu, S.; Chu, C.; Luo, Y. Limits to growth of forest biomass carbon sink under climate change. Nat. Commun. 2018, 9, 2709. [Google Scholar] [CrossRef]
- Shu, S.-m.; Zhu, W.-z.; Wang, W.-z.; Jia, M.; Zhang, Y.-y.; Sheng, Z.-l. Effects of tree size heterogeneity on carbon sink in old forests. For. Ecol. Manag. 2019, 432, 637–648. [Google Scholar] [CrossRef]
- Qie, L.; Lewis, S.L.; Sullivan, M.J.P.; Lopez-Gonzalez, G.; Pickavance, G.C.; Sunderland, T.; Ashton, P.; Hubau, W.; Abu Salim, K.; Aiba, S.-I.; et al. Long-term carbon sink in Borneo’s forests halted by drought and vulnerable to edge effects. Nat. Commun. 2017, 8, 1966. [Google Scholar] [CrossRef] [PubMed]
- Liski, J.; Perruchoud, D.; Karjalainen, T. Increasing carbon stocks in the forest soils of western Europe. For. Ecol. Manag. 2002, 169, 159–175. [Google Scholar] [CrossRef]
- Whitehead, D. Forests as carbon sinks—Benefits and consequences. Tree Physiol. 2011, 31, 893–902. [Google Scholar] [CrossRef]
- Liu, X.; Trogisch, S.; He, J.-S.; Niklaus, P.A.; Bruelheide, H.; Tang, Z.; Erfmeier, A.; Scherer-Lorenzen, M.; Pietsch, K.A.; Yang, B.; et al. Tree species richness increases ecosystem carbon storage in subtropical forests. Proc. R. Soc. B Biol. Sci. 2018, 285, 20181240. [Google Scholar] [CrossRef]
- Schulte-Uebbing, L.; De Vries, W. Global-scale impacts of nitrogen deposition on tree carbon sequestration in tropical, temperate, and boreal forests: A meta-analysis. Glob. Chang. Biol. 2018, 24, e416–e431. [Google Scholar] [CrossRef]
- Millan-Almaraz, J.R.; Guevara-Gonzalez, R.G.; Romero-Troncoso, R.; Osornio-Rios, R.A.; Torres-Pacheco, I. Advantages and disadvantages on photosynthesis measurement techniques: A review. Afr. J. Biotechnol. 2009, 8, 7340–7349. [Google Scholar]
- Zhang, S.; Zhang, L. Using an IR camera to improve leaf area and temperature measurements: A new method for increasing the accuracy of photosynthesis-related parameters. Agric. For. Meteorol. 2022, 322, 109005. [Google Scholar] [CrossRef]
- Bahtiar, E.T.; Nugroho, N.; Anne, C.; Maulana, A. Measuring Carbon Dioxide Sink of Betung Bamboo (Dendrocallamus asper (Schult f.) Backer ex Heyne) by Sinusoidal Curves Fitting on Its Daily Photosynthesis Light Response. J. Agric. Sci. Technol. B 2012, 2, 780–788. [Google Scholar]
- Piper, F.I.; Cavieres, L.A.; Reyes-Díaz, M.; Corcuera, L.J. Carbon sink limitation and frost tolerance control performance of the tree Kageneckia angustifolia D. Don (Rosaceae) at the treeline in central Chile. Plant Ecol. 2006, 185, 29–39. [Google Scholar] [CrossRef]
- Gavito, M.E.; Jakobsen, I.; Mikkelsen, T.N.; Mora, F. Direct evidence for modulation of photosynthesis by an arbuscular mycorrhiza-induced carbon sink strength. New Phytol. 2019, 223, 896–907. [Google Scholar] [CrossRef]
- Hussey, A.; Long, S.P. Seasonal Changes in Weight of Above- and Below-Ground Vegetation and Dead Plant Material in a Salt Marsh at Colne Point, Essex. J. Ecol. 1982, 70, 757–771. [Google Scholar] [CrossRef]
- Fatichi, S.; Pappas, C.; Zscheischler, J.; Leuzinger, S. Modelling carbon sources and sinks in terrestrial vegetation. New Phytol. 2019, 221, 652–668. [Google Scholar] [CrossRef]
- Gao, M.; Xu, R.; Huang, J.; Su, B.; Jiang, S.; Shi, P.; Yang, H.; Xing, Y.; Wang, D.; Jiang, H.; et al. Increase of carbon storage in the Qinghai-Tibet Plateau: Perspective from land-use change under global warming. J. Clean. Prod. 2023, 414, 137540. [Google Scholar] [CrossRef]
- Shen, Z.; Hamelin, L.; Tiruta-Barna, L. Converting carbon vulnerable lands to wood plantations for use as building materials: Overall environmental performance and time-dependent assessment of carbon dioxide removals. J. Clean. Prod. 2023, 388, 136040. [Google Scholar] [CrossRef]
- Fu, Y.; Tian, D.; Hou, Z.; Wang, M.; Zhang, N. Review on the evaluation of global forest carbon sink function. J. Beijing For. Univ. 2022, 44, 1–10. (In Chinese) [Google Scholar] [CrossRef]
- Fang, J.; Guo, Z.; Piao, S.; Chen, A. Terrestrial vegetation carbon sinks in China, 1981–2000. Sci. China Ser. D Earth Sci. 2007, 50, 1341–1350. [Google Scholar] [CrossRef]
- Crookston, N.L.; Dixon, G.E. The forest vegetation simulator: A review of its structure, content, and applications. Comput. Electron. Agric. 2005, 49, 60–80. [Google Scholar] [CrossRef]
- Hester, A.S.; Hann, D.W.; Larsen, D.R. ORGANON: Southwest Oregon Growth and Yield Model User Manual: Version 2.0; Forestry Publications Office, Oregon State University, Forest Research Laboratory: Corvallis, OR, USA, 1989. [Google Scholar]
- Cousar, P.; Sessions, J.; Johnson, K.N. Inidividual standard projection under different goals to suppor policy analysis for the sierra nevada ecosystem project. In Proceedings of the Forest Vegetation Simulator Conference, Fort Collins, CO, USA; 1997; pp. 98–104. [Google Scholar]
- Yu, Z.; You, W.; Agathokleous, E.; Zhou, G.; Liu, S. Forest management required for consistent carbon sink in China’s forest plantations. For. Ecosyst. 2021, 8, 54. [Google Scholar] [CrossRef]
- Yao, Y.; Piao, S.; Wang, T. Future biomass carbon sequestration capacity of Chinese forests. Sci. Bull. 2018, 63, 1108–1117. [Google Scholar] [CrossRef]
- Wang, J.; Feng, L.; Palmer, P.I.; Liu, Y.; Fang, S.; Bösch, H.; O’Dell, C.W.; Tang, X.; Yang, D.; Liu, L.; et al. Large Chinese land carbon sink estimated from atmospheric carbon dioxide data. Nature 2020, 586, 720–723. [Google Scholar] [CrossRef]
- Luyssaert, S.; Schulze, E.D.; Börner, A.; Knohl, A.; Hessenmöller, D.; Law, B.E.; Ciais, P.; Grace, J. Old-growth forests as global carbon sinks. Nature 2008, 455, 213–215. [Google Scholar] [CrossRef]
- Gundersen, P.; Thybring, E.E.; Nord-Larsen, T.; Vesterdal, L.; Nadelhoffer, K.J.; Johannsen, V.K. Old-growth forest carbon sinks overestimated. Nature 2021, 591, E21–E23. [Google Scholar] [CrossRef]
- Lin, C. The problem of dry shape control in the technology of measuring forest stock. Sci. Silvae Sin. 1964, 9, 365–375. [Google Scholar]
- Pyper, W. IPCC Fifth Report. Ecos 2010, 7. [Google Scholar]
- Gutsell, S.L.; Johnson, E.A. Accurately ageing trees and examining their height-growth rates: Implications for interpreting forest dynamics. J. Ecol. 2002, 90, 153–166. [Google Scholar] [CrossRef]
- Rohner, B.; Bugmann, H.; Bigler, C. Towards non-destructive estimation of tree age. For. Ecol. Manag. 2013, 304, 286–295. [Google Scholar] [CrossRef]
- Cain, W.F.; Suess, H.E. Carbon 14 in tree rings. J. Geophys. Res. 1976, 81, 3688–3694. [Google Scholar] [CrossRef]
- Nath, C.D.; Boura, A.; De Franceschi, D.; Pélissier, R. Assessing the utility of direct and indirect methods for estimating tropical tree age in the Western Ghats, India. Trees 2012, 26, 1017–1029. [Google Scholar] [CrossRef]
- Mattos, P.P.d.; Curto, R.D.A.; Braz, E.M.; Netto, S.P. How do Araucaria angustifolia trees grow in overstocked stands? Dendrochronologia 2022, 74, 125976. [Google Scholar] [CrossRef]
- Hökkä, H. Height-diameter curves with random intercepts and slopes for trees growing on drained peatlands. For. Ecol. Manag. 1997, 97, 63–72. [Google Scholar] [CrossRef]
- Budzyńska, S.; Budka, A.; Roszyk, E.; Niedzielski, P.; Mleczek, M. Trace of negative changes in environment recorded in cores of trees growing near busy city roads in Poznań, Poland—dendromonitoring of urban pollution. Ecol. Indic. 2023, 149, 110198. [Google Scholar] [CrossRef]
- Brienen, R.J.W.; Caldwell, L.; Duchesne, L.; Voelker, S.; Barichivich, J.; Baliva, M.; Ceccantini, G.; Di Filippo, A.; Helama, S.; Locosselli, G.M.; et al. Forest carbon sink neutralized by pervasive growth-lifespan trade-offs. Nat. Commun. 2020, 11, 4241. [Google Scholar] [CrossRef] [PubMed]
- Zhu, K.; Song, Y.; Qin, C. Forest age improves understanding of the global carbon sink. Proc. Natl. Acad. Sci. USA 2019, 116, 3962–3964. [Google Scholar] [CrossRef]
Disclaimer/Publisher’s Note: The statements, opinions and data contained in all publications are solely those of the individual author(s) and contributor(s) and not of MDPI and/or the editor(s). MDPI and/or the editor(s) disclaim responsibility for any injury to people or property resulting from any ideas, methods, instructions or products referred to in the content. |
© 2024 by the authors. Licensee MDPI, Basel, Switzerland. This article is an open access article distributed under the terms and conditions of the Creative Commons Attribution (CC BY) license (https://creativecommons.org/licenses/by/4.0/).