
Predicting Wood Density Using Resistance Drilling: The Effect of Instrument and Operator

 , , , ,
Abstract
1. Introduction
- Do recently serviced Resi instruments have statistically different slopes in the relationship between Resi values and basic density?
- Is there an effect of operator and instrument type on Resi-predicted basic density?
2. Materials and Methods
2.1. Resi Instruments
2.2. Site Selection
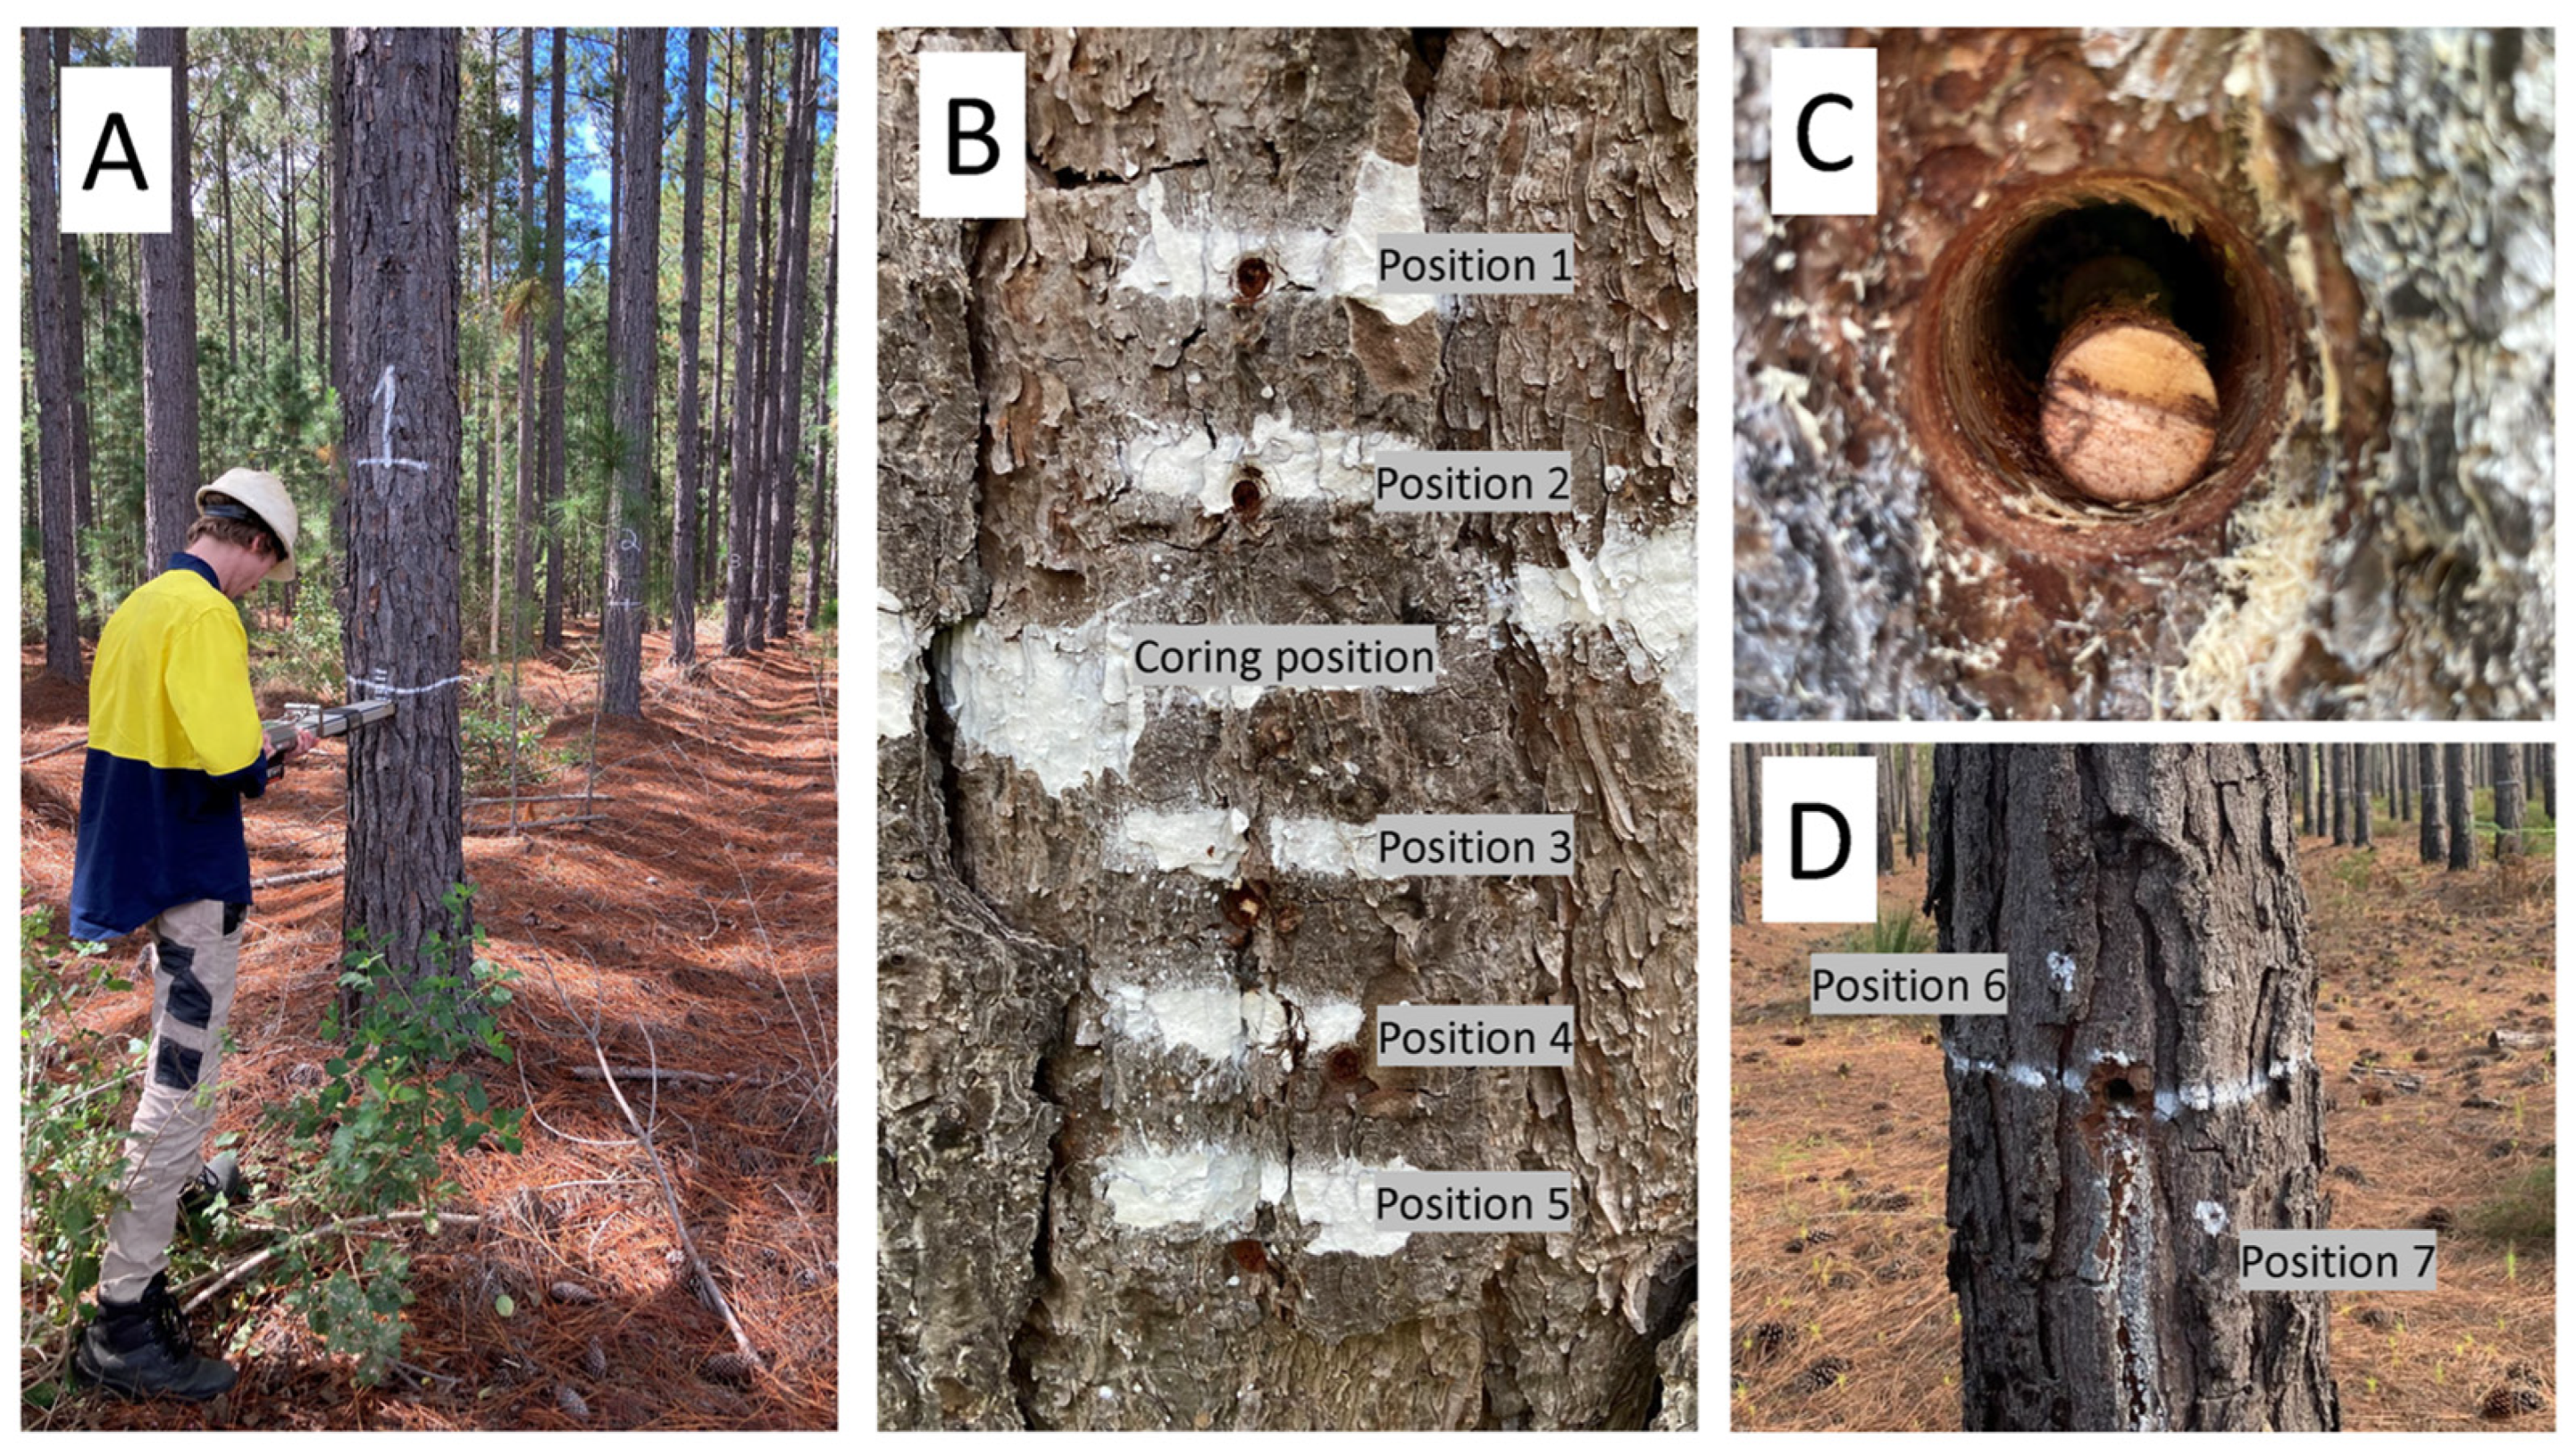
2.3. Tree Selection and Sampling Positions and Coring
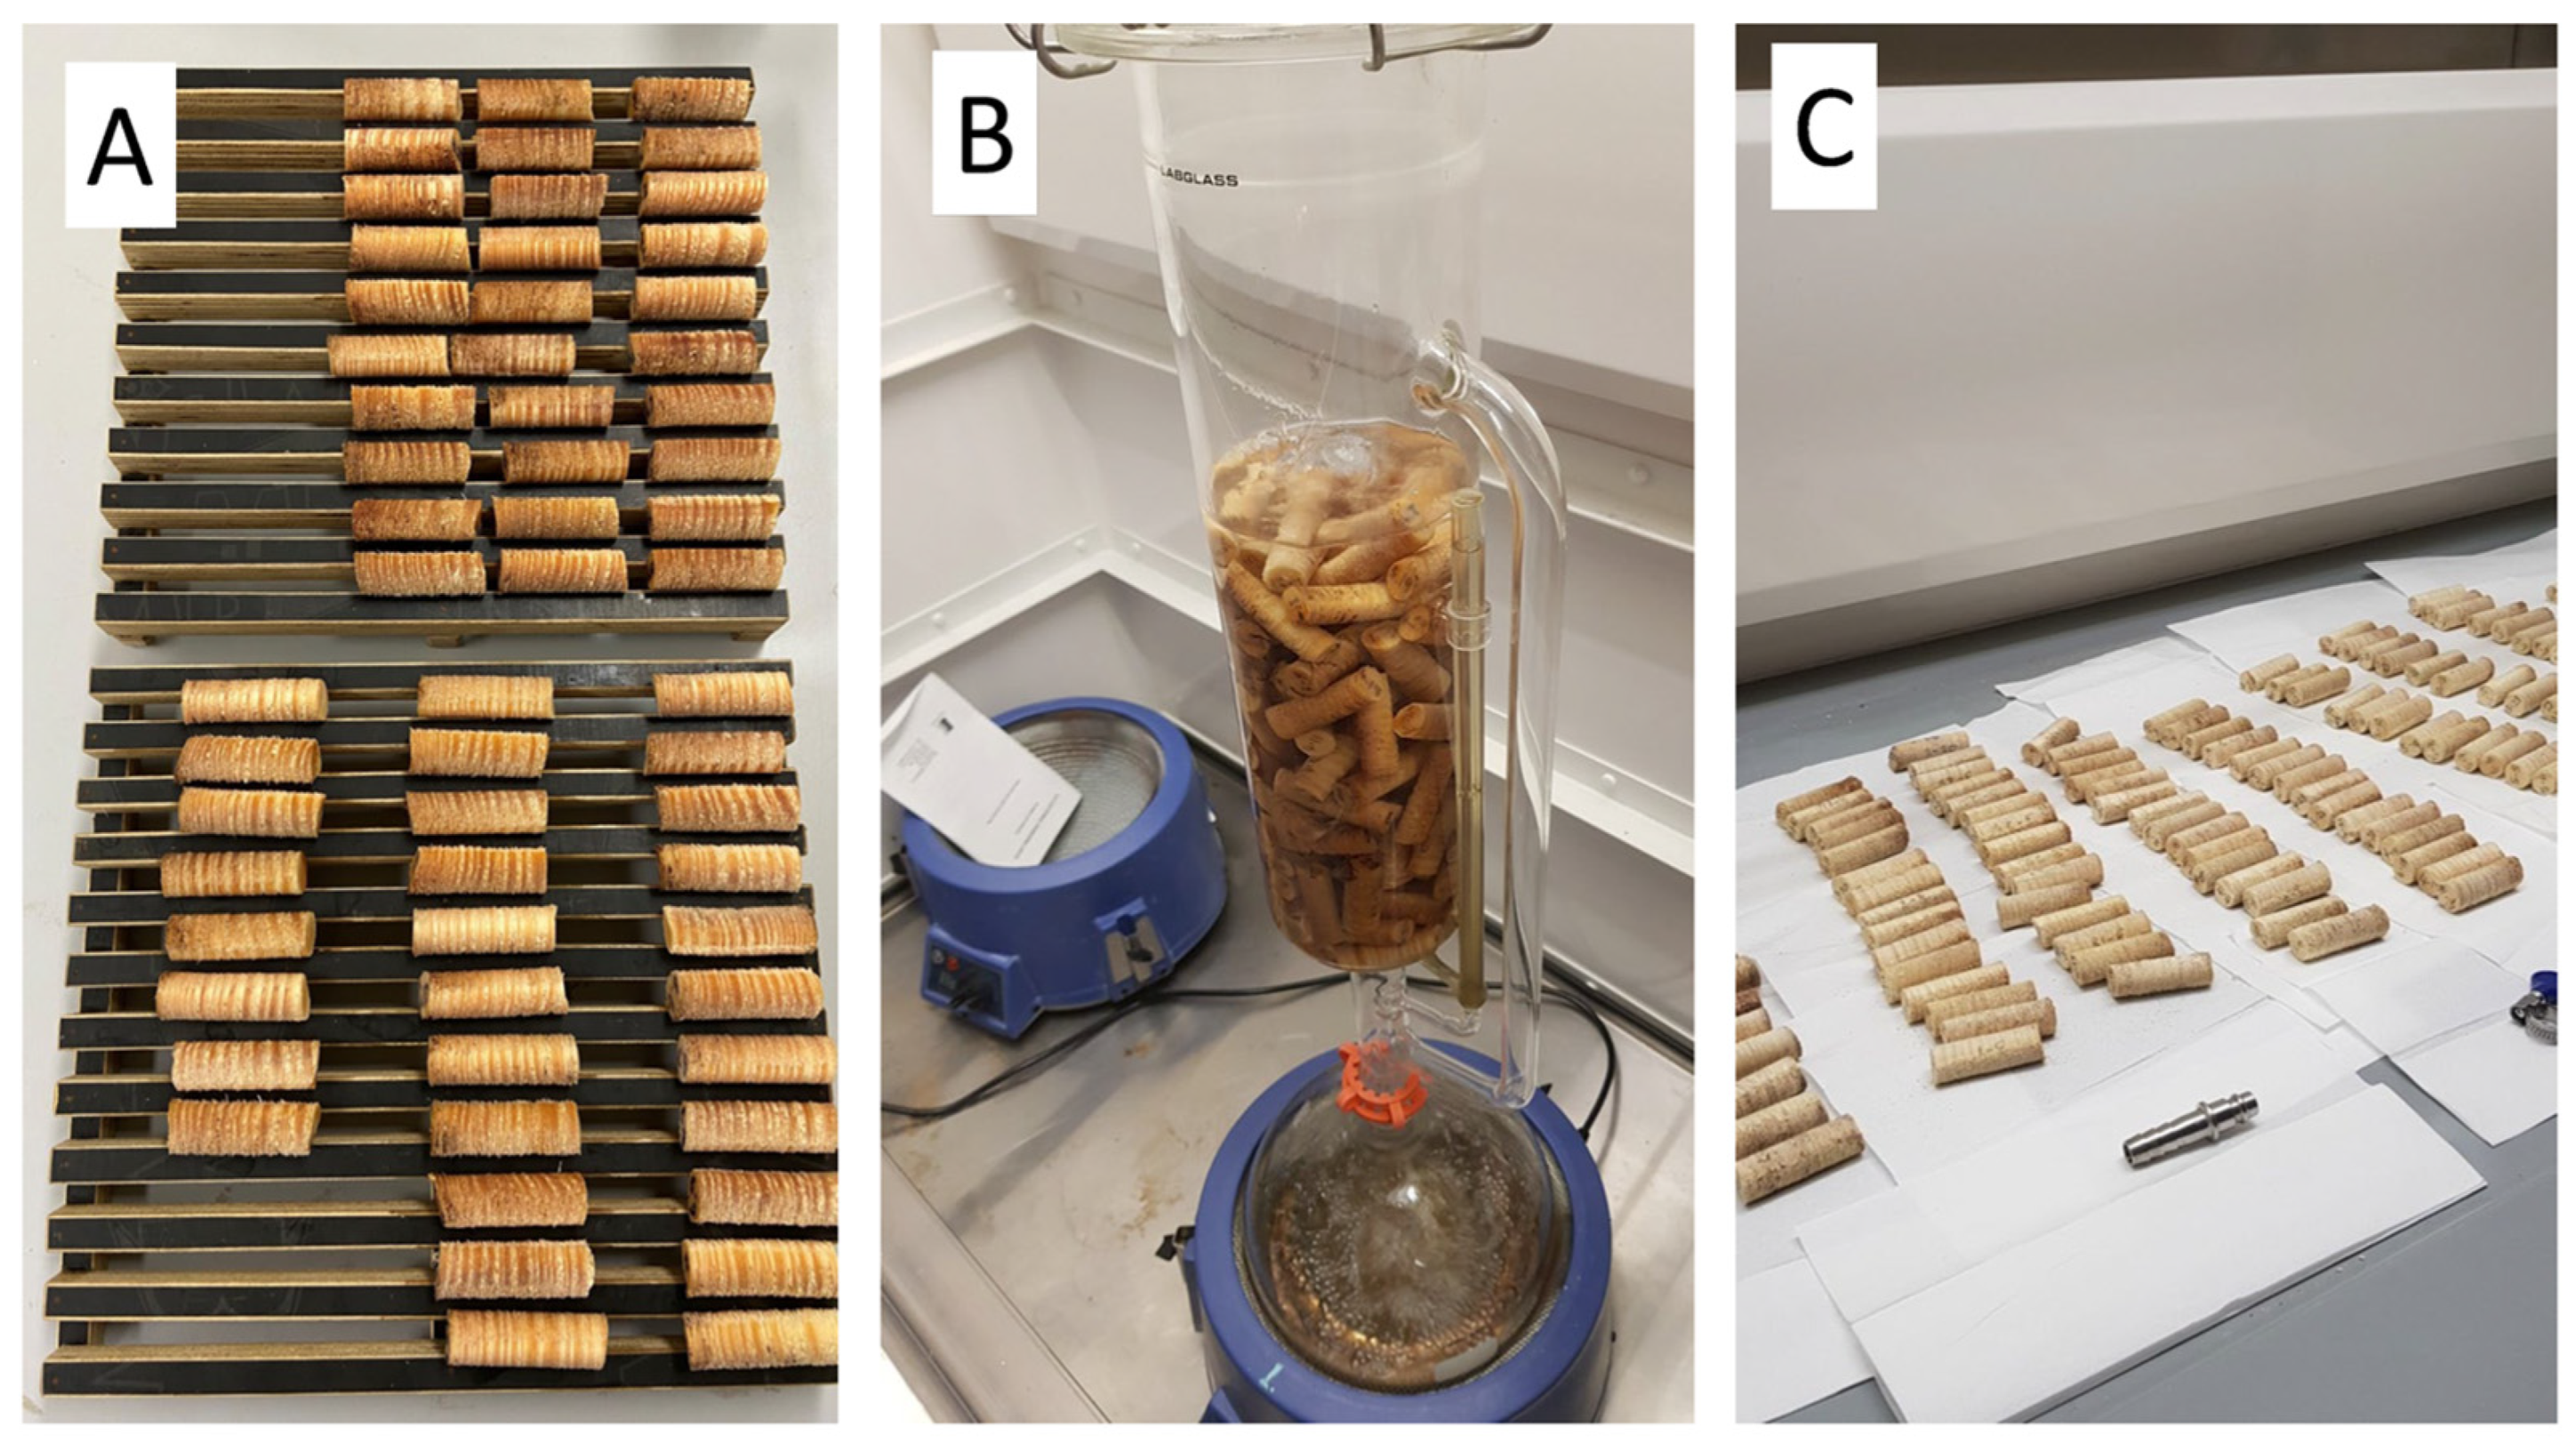
2.4. Core Extractives Removal and Basic Density Measurements
2.5. Data Analysis
- (1)
- Y = µ + Operator + Resi instrument number + Plot:Tree + error;
- (2)
- Y = µ + Instrument type + Resi instrument number + Plot:Tree + error;
- (3)
- Y = µ + Resi instrument number + Plot:Tree + error.
3. Results
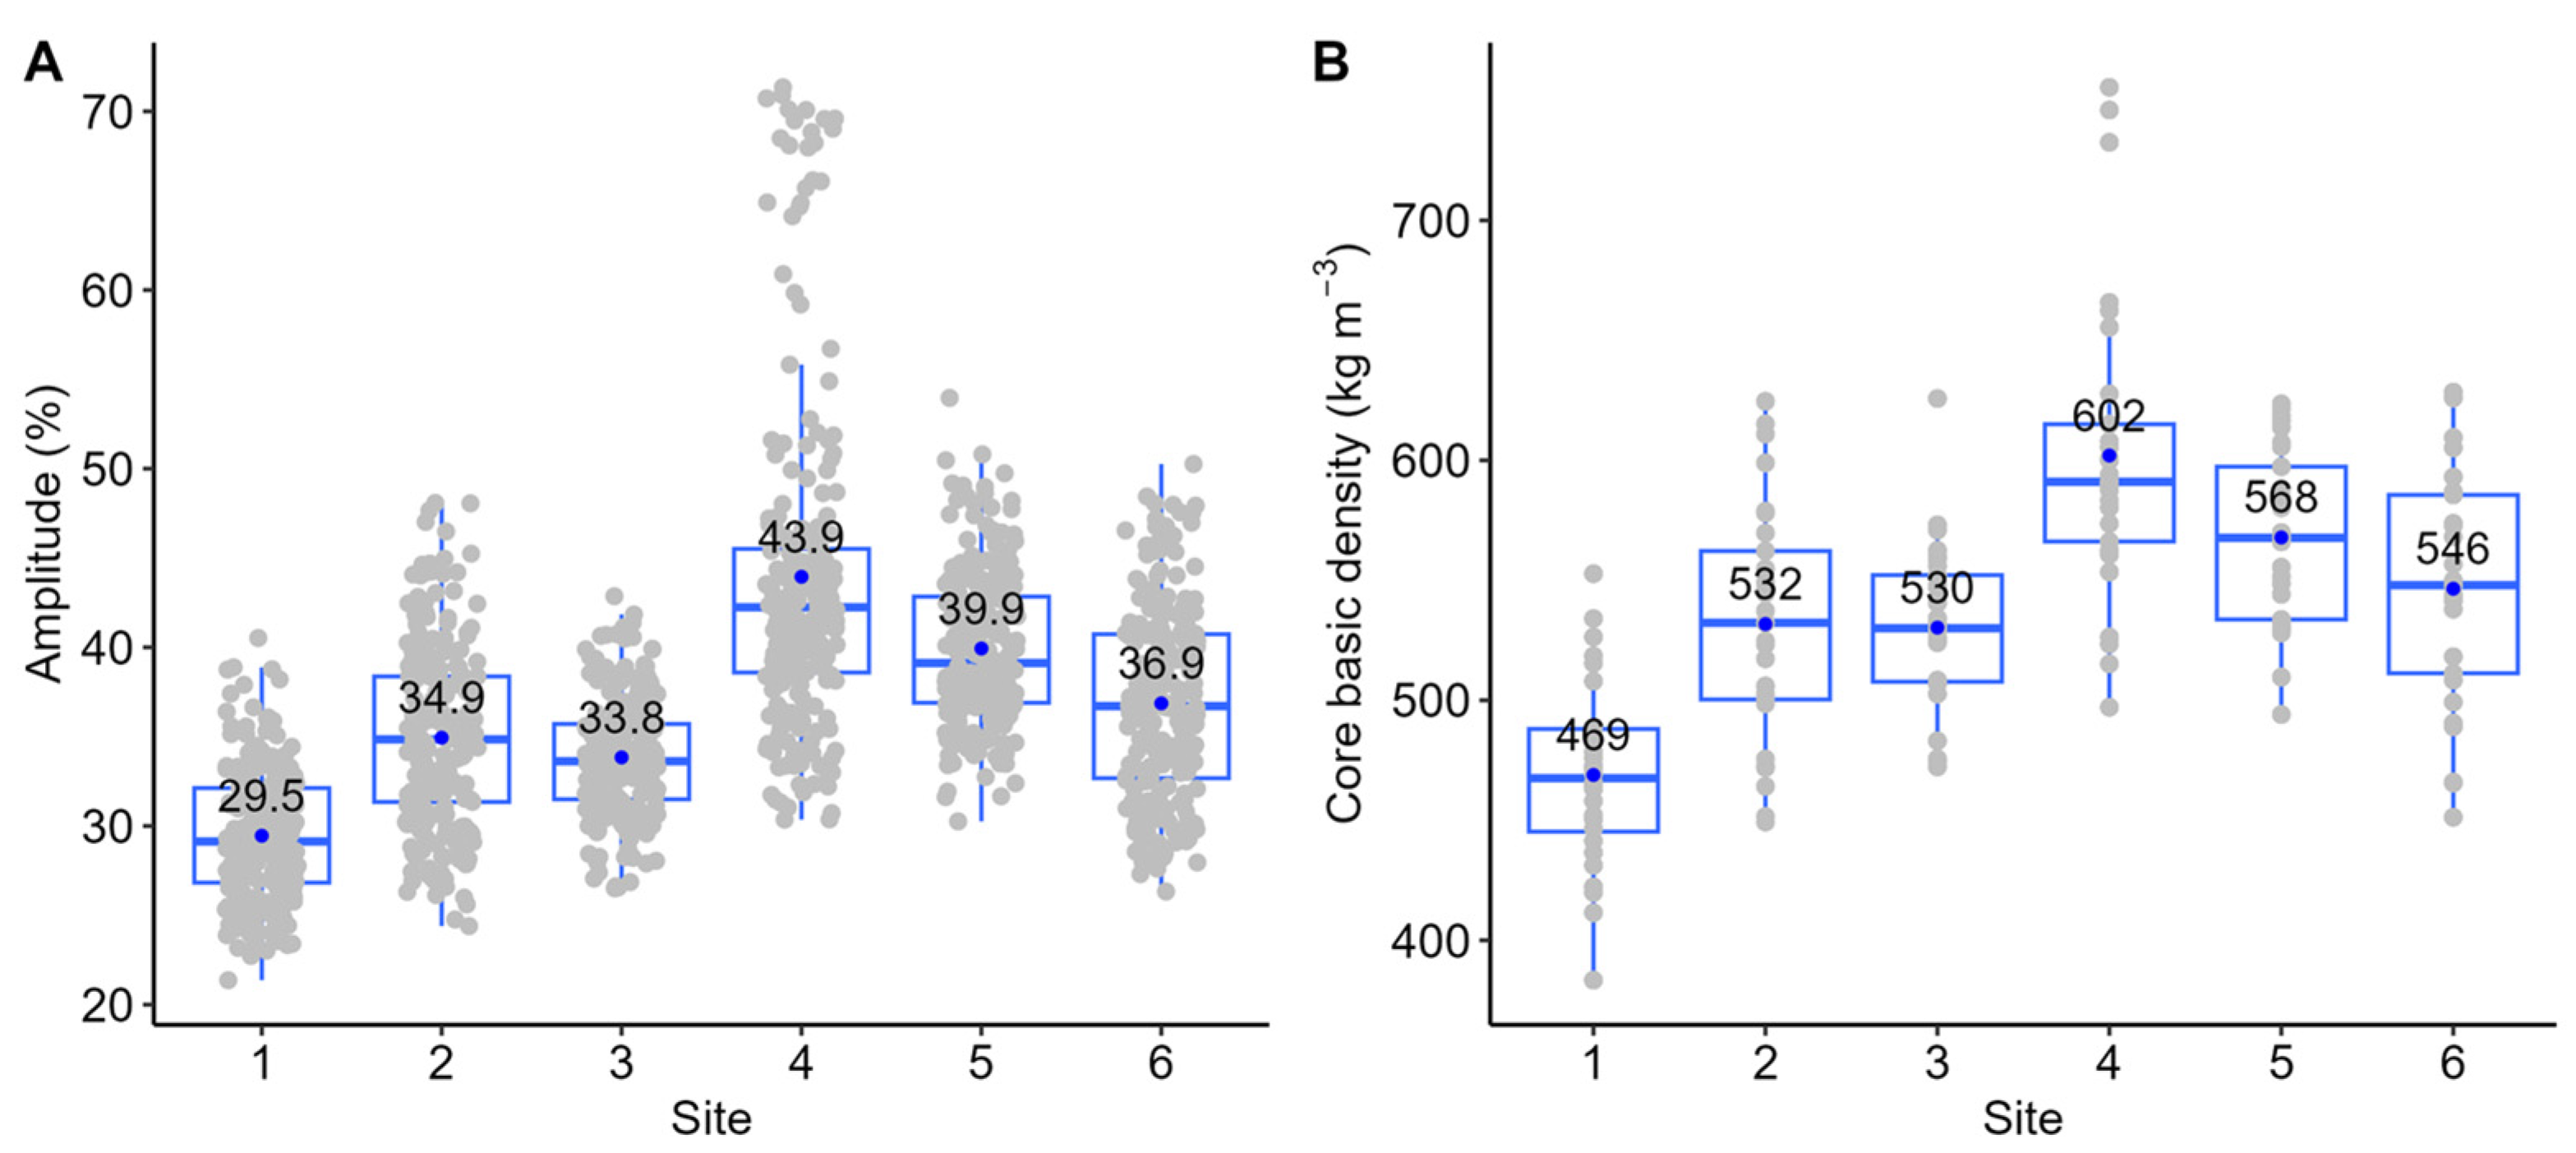
3.1. Sites
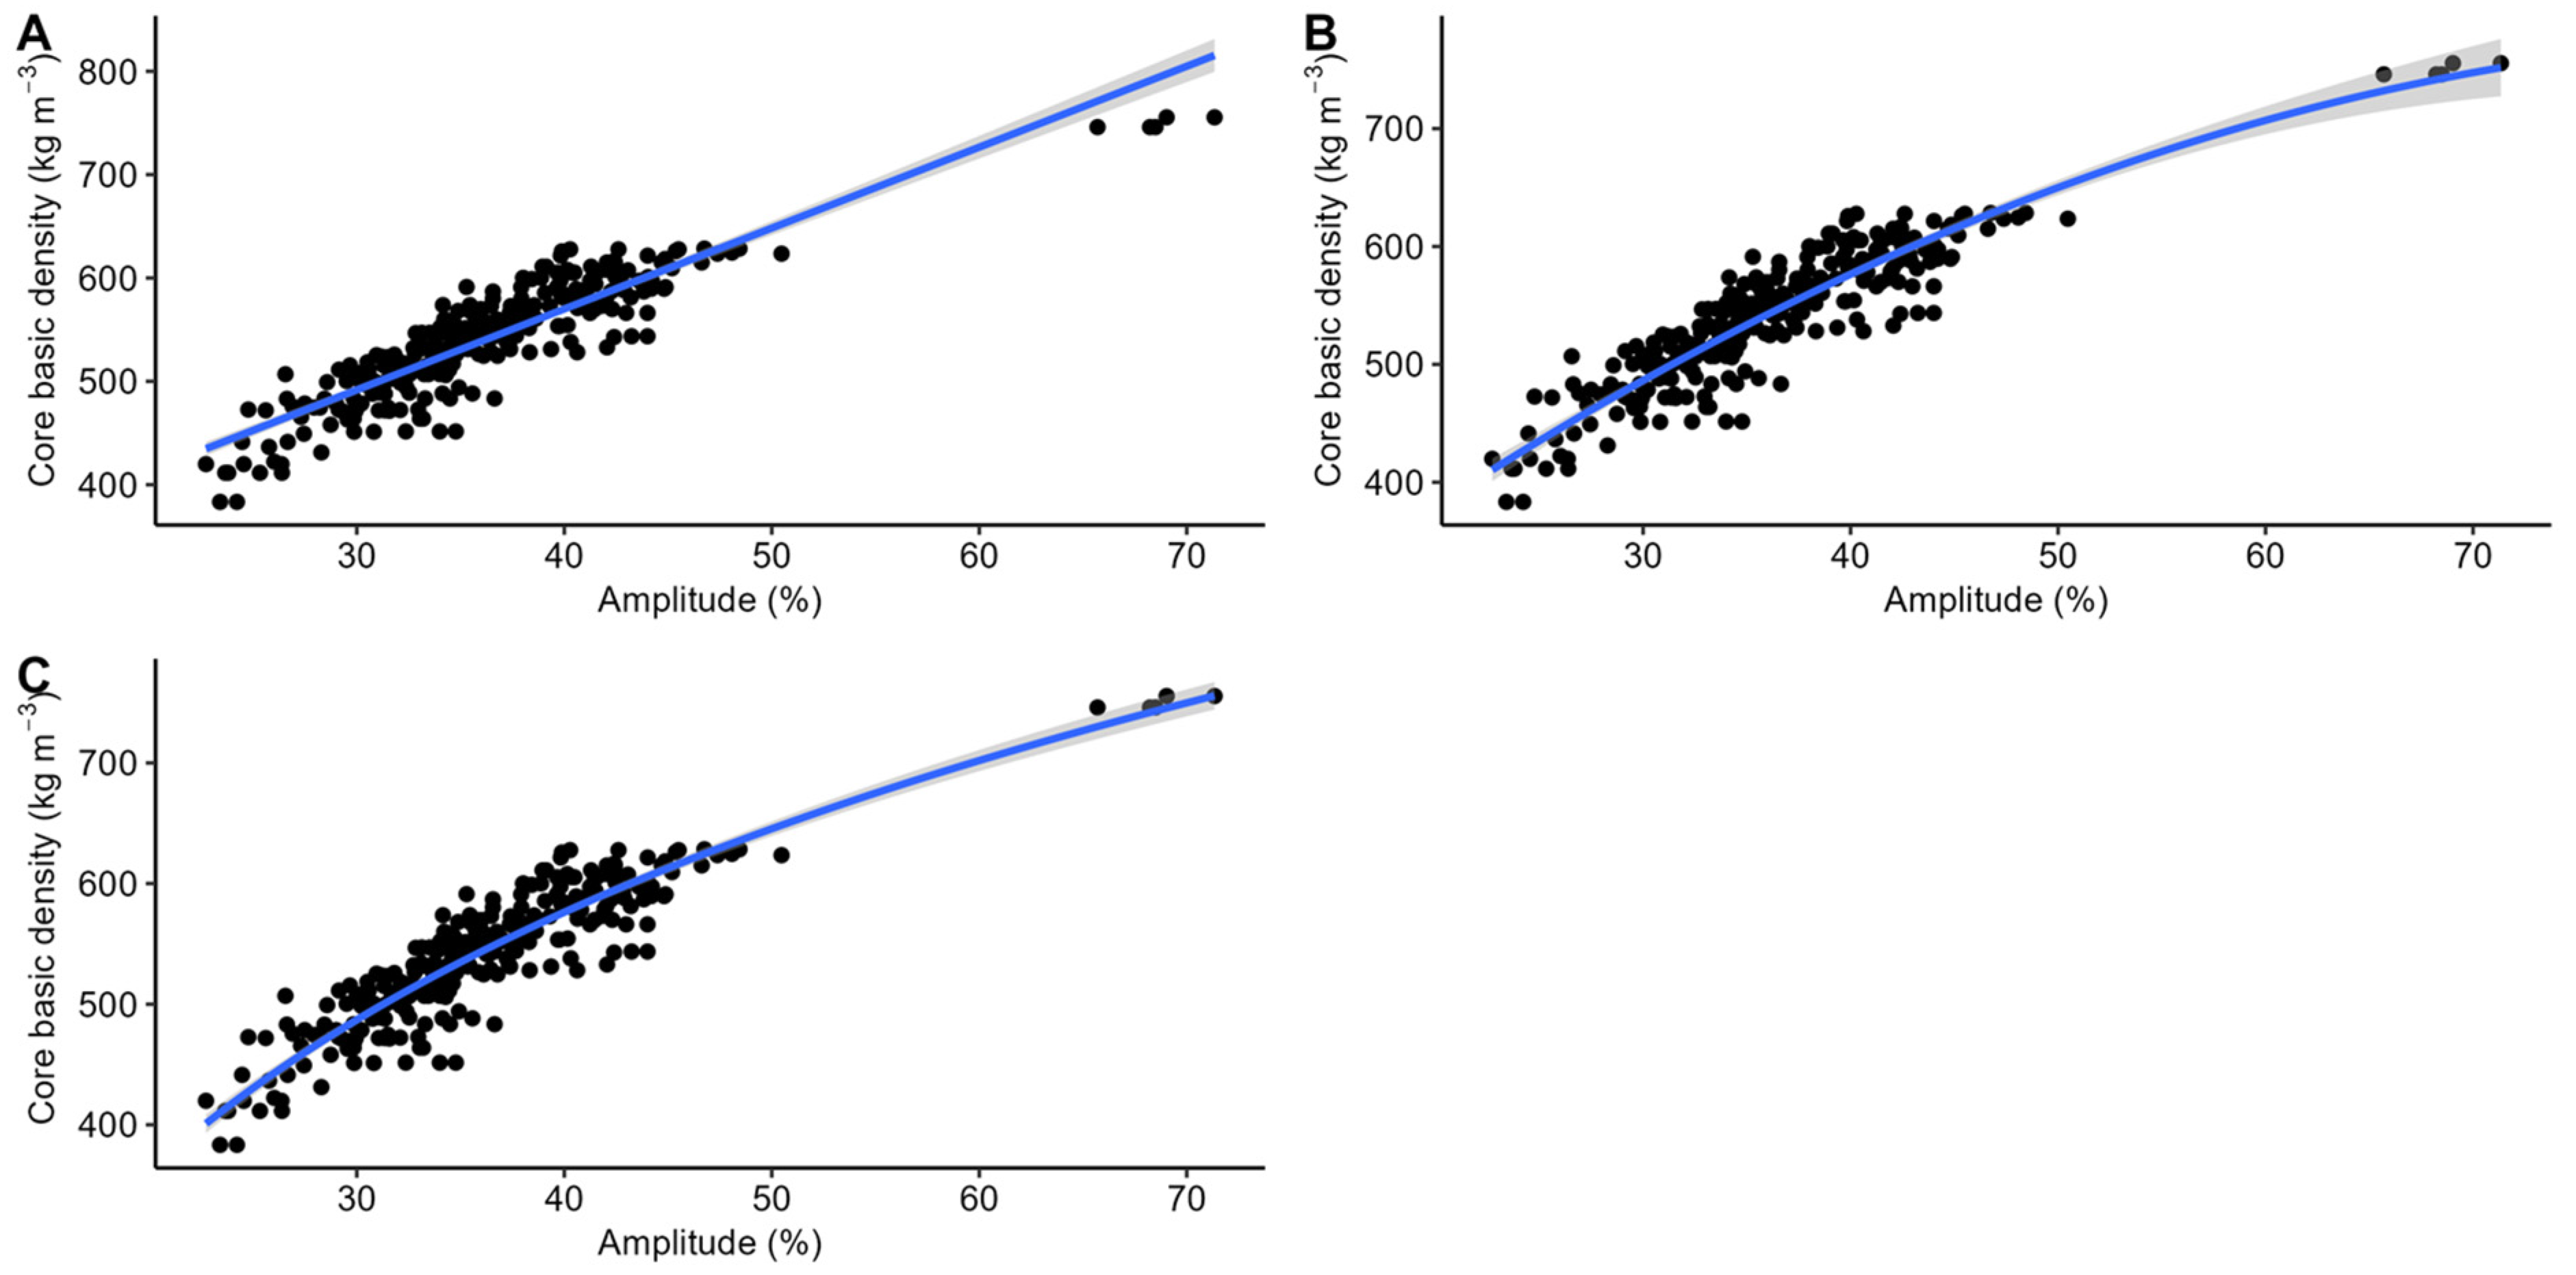
3.2. Relationship between Basic Density and Amplitude
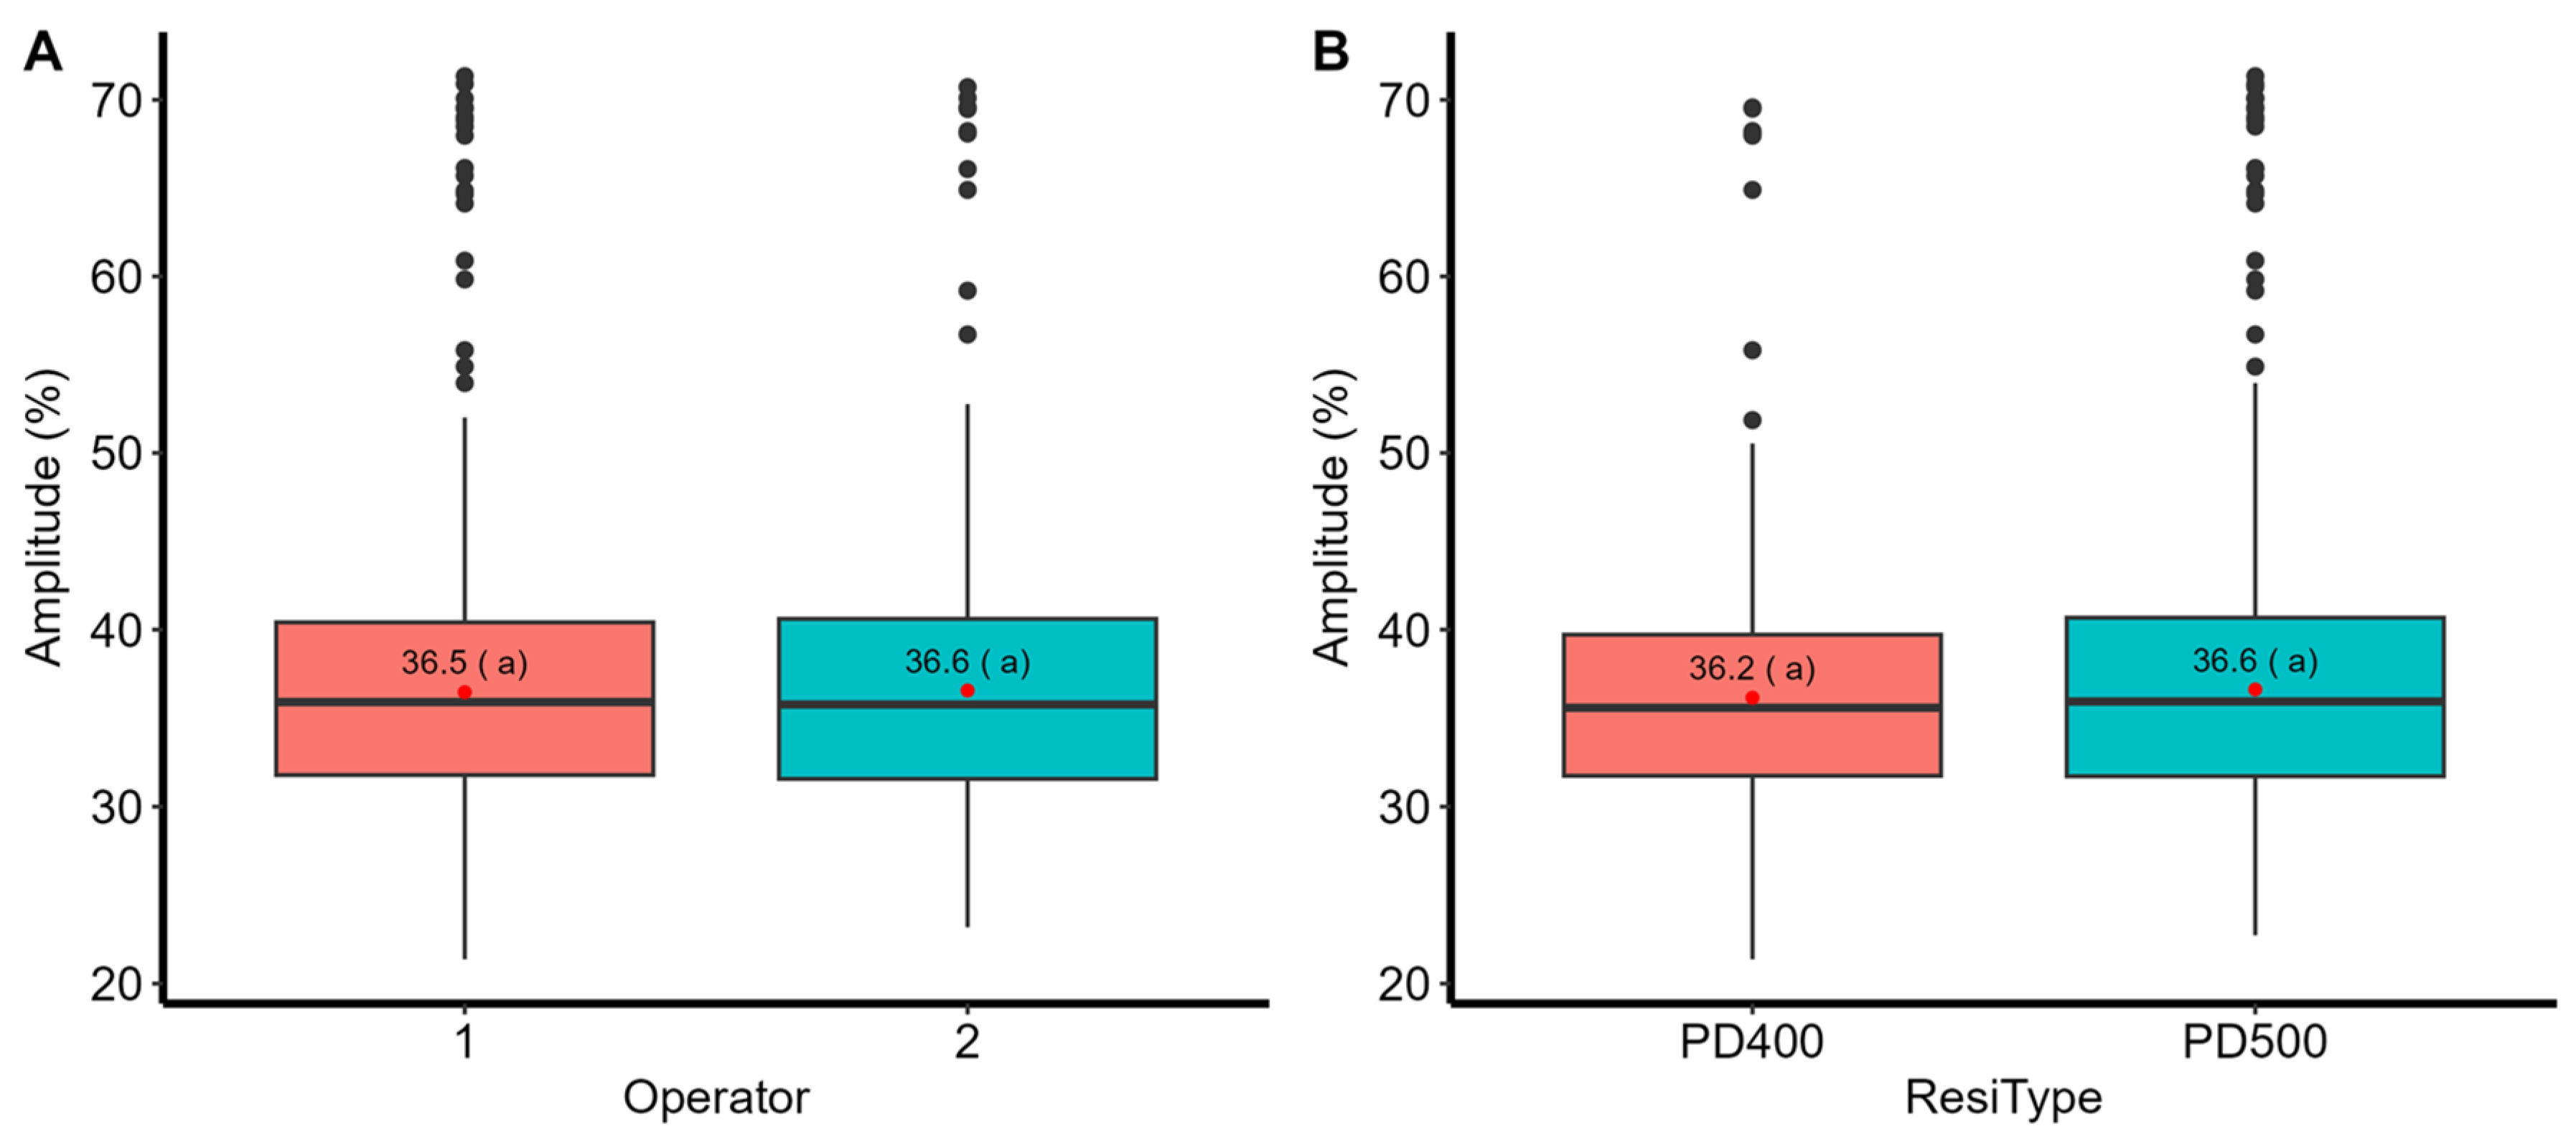
3.3. Operator, Machine Type
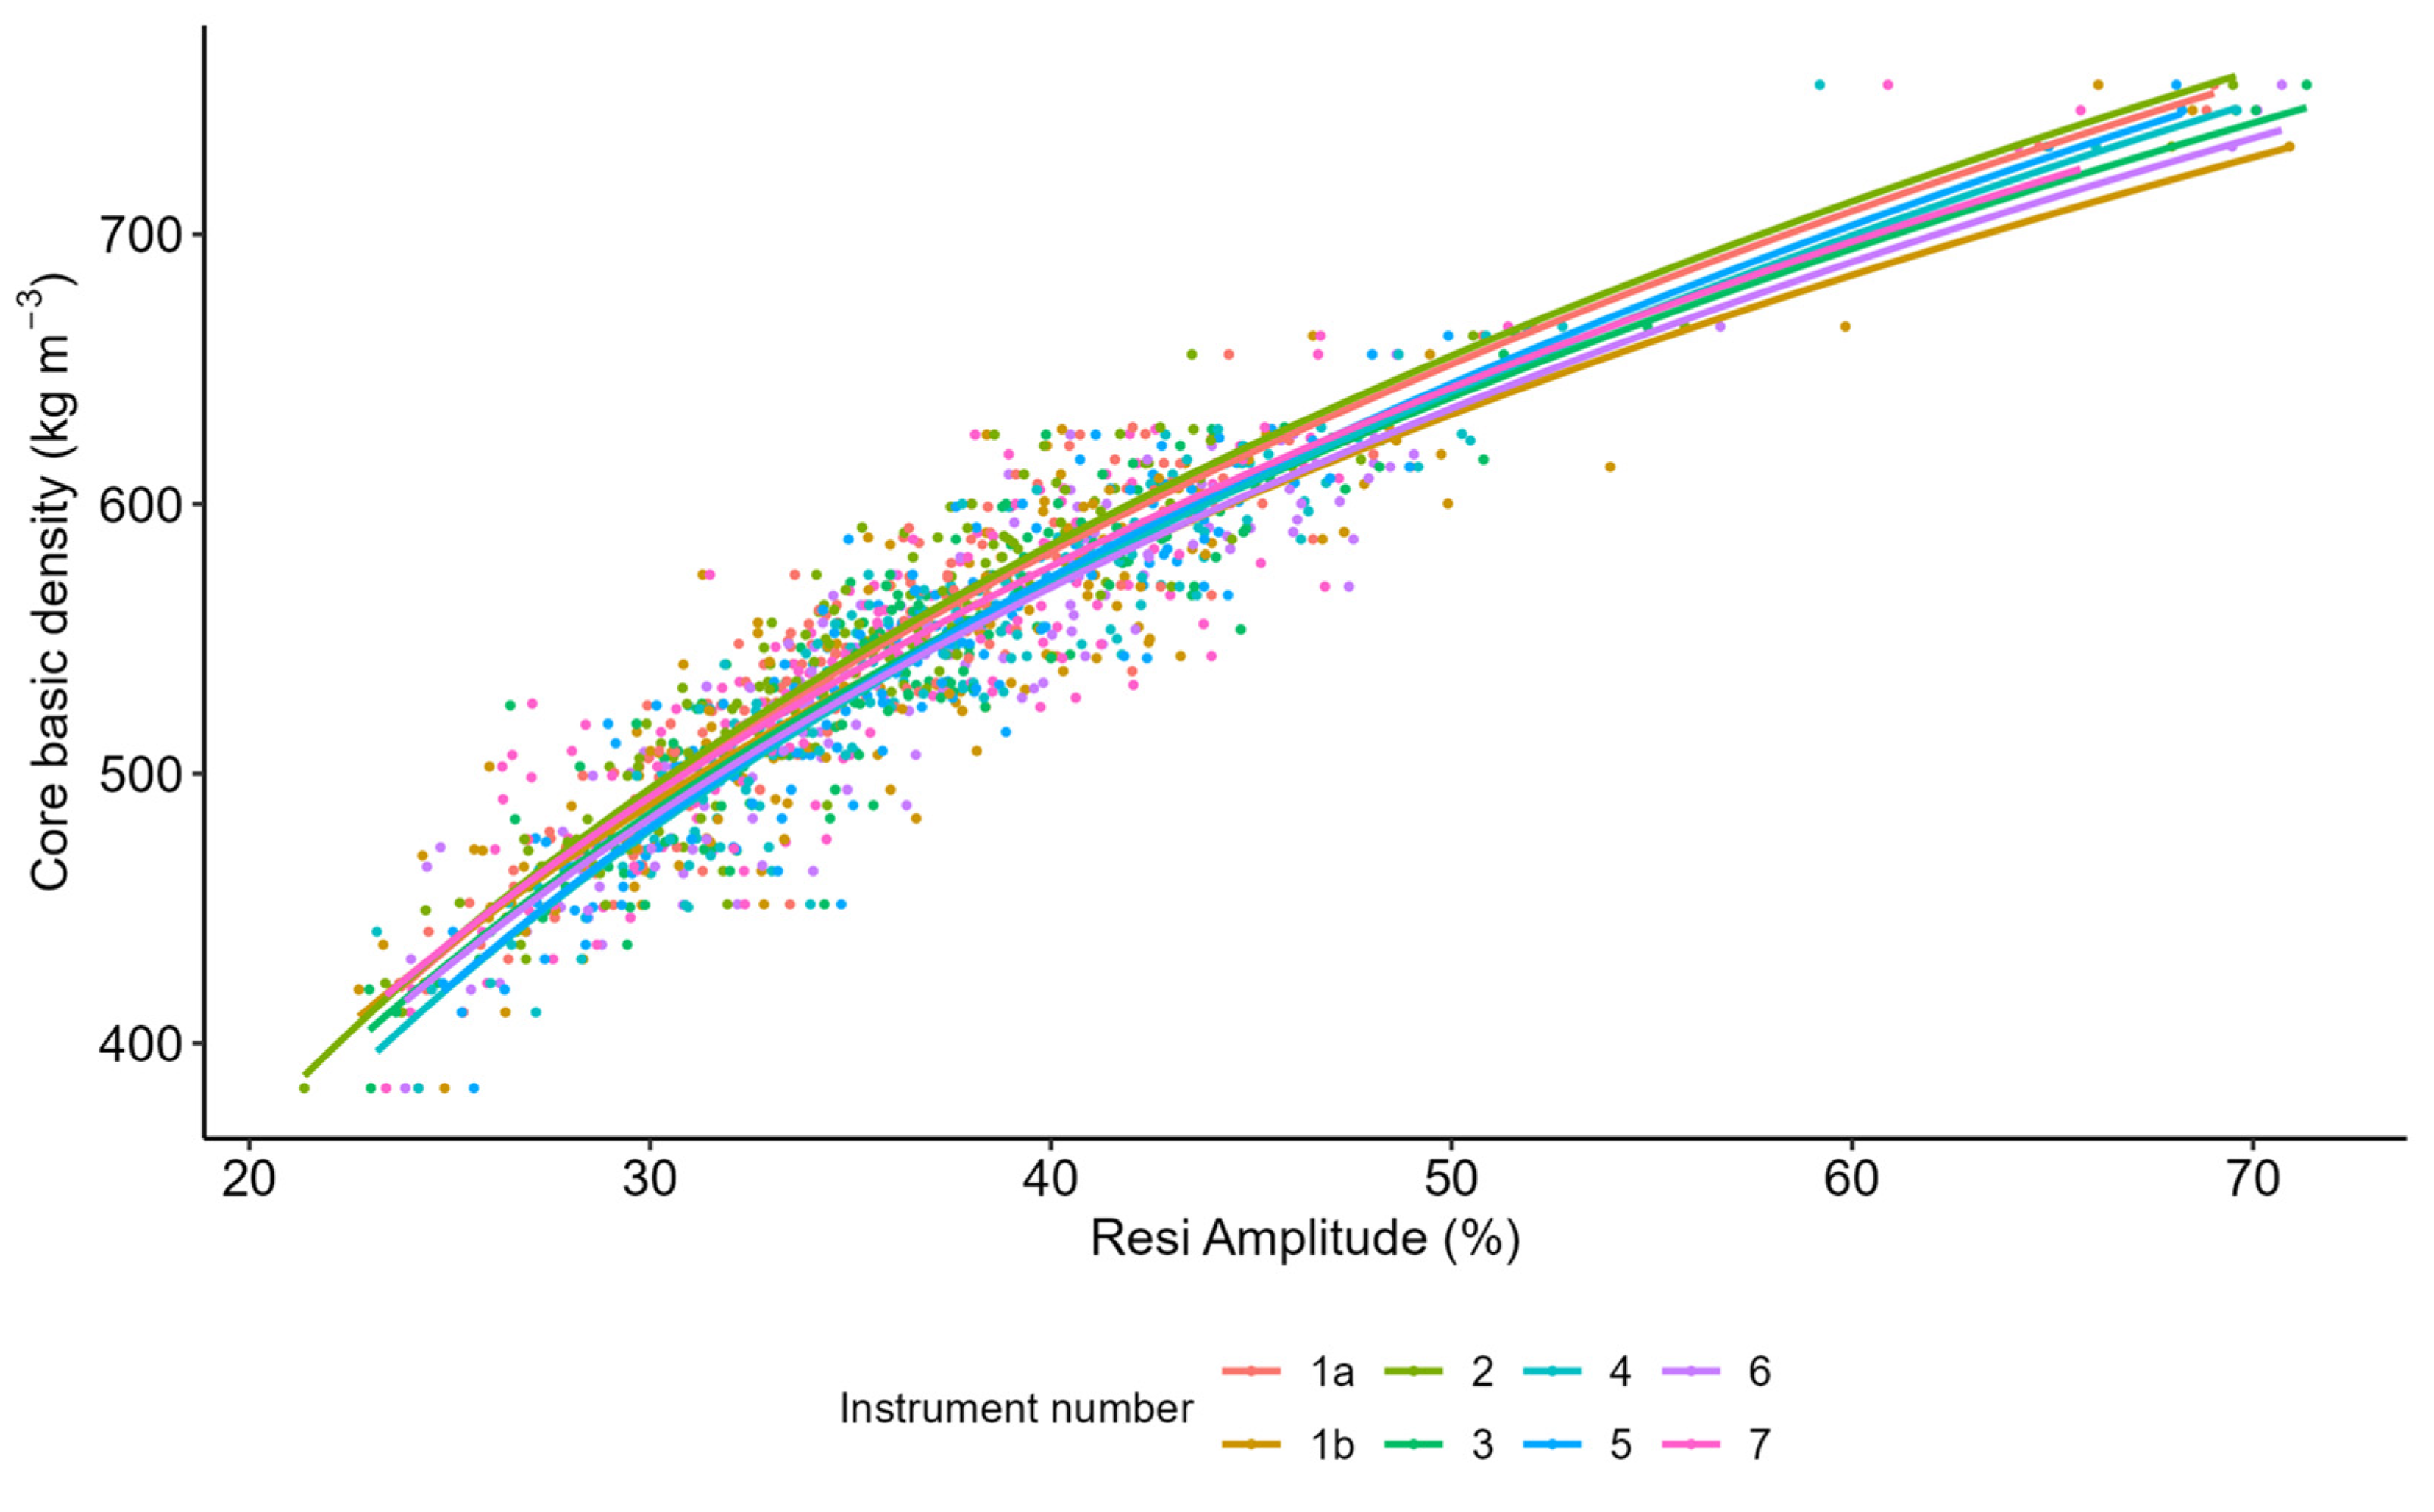
3.4. Regression between Density and Amplitude for Each Instrument
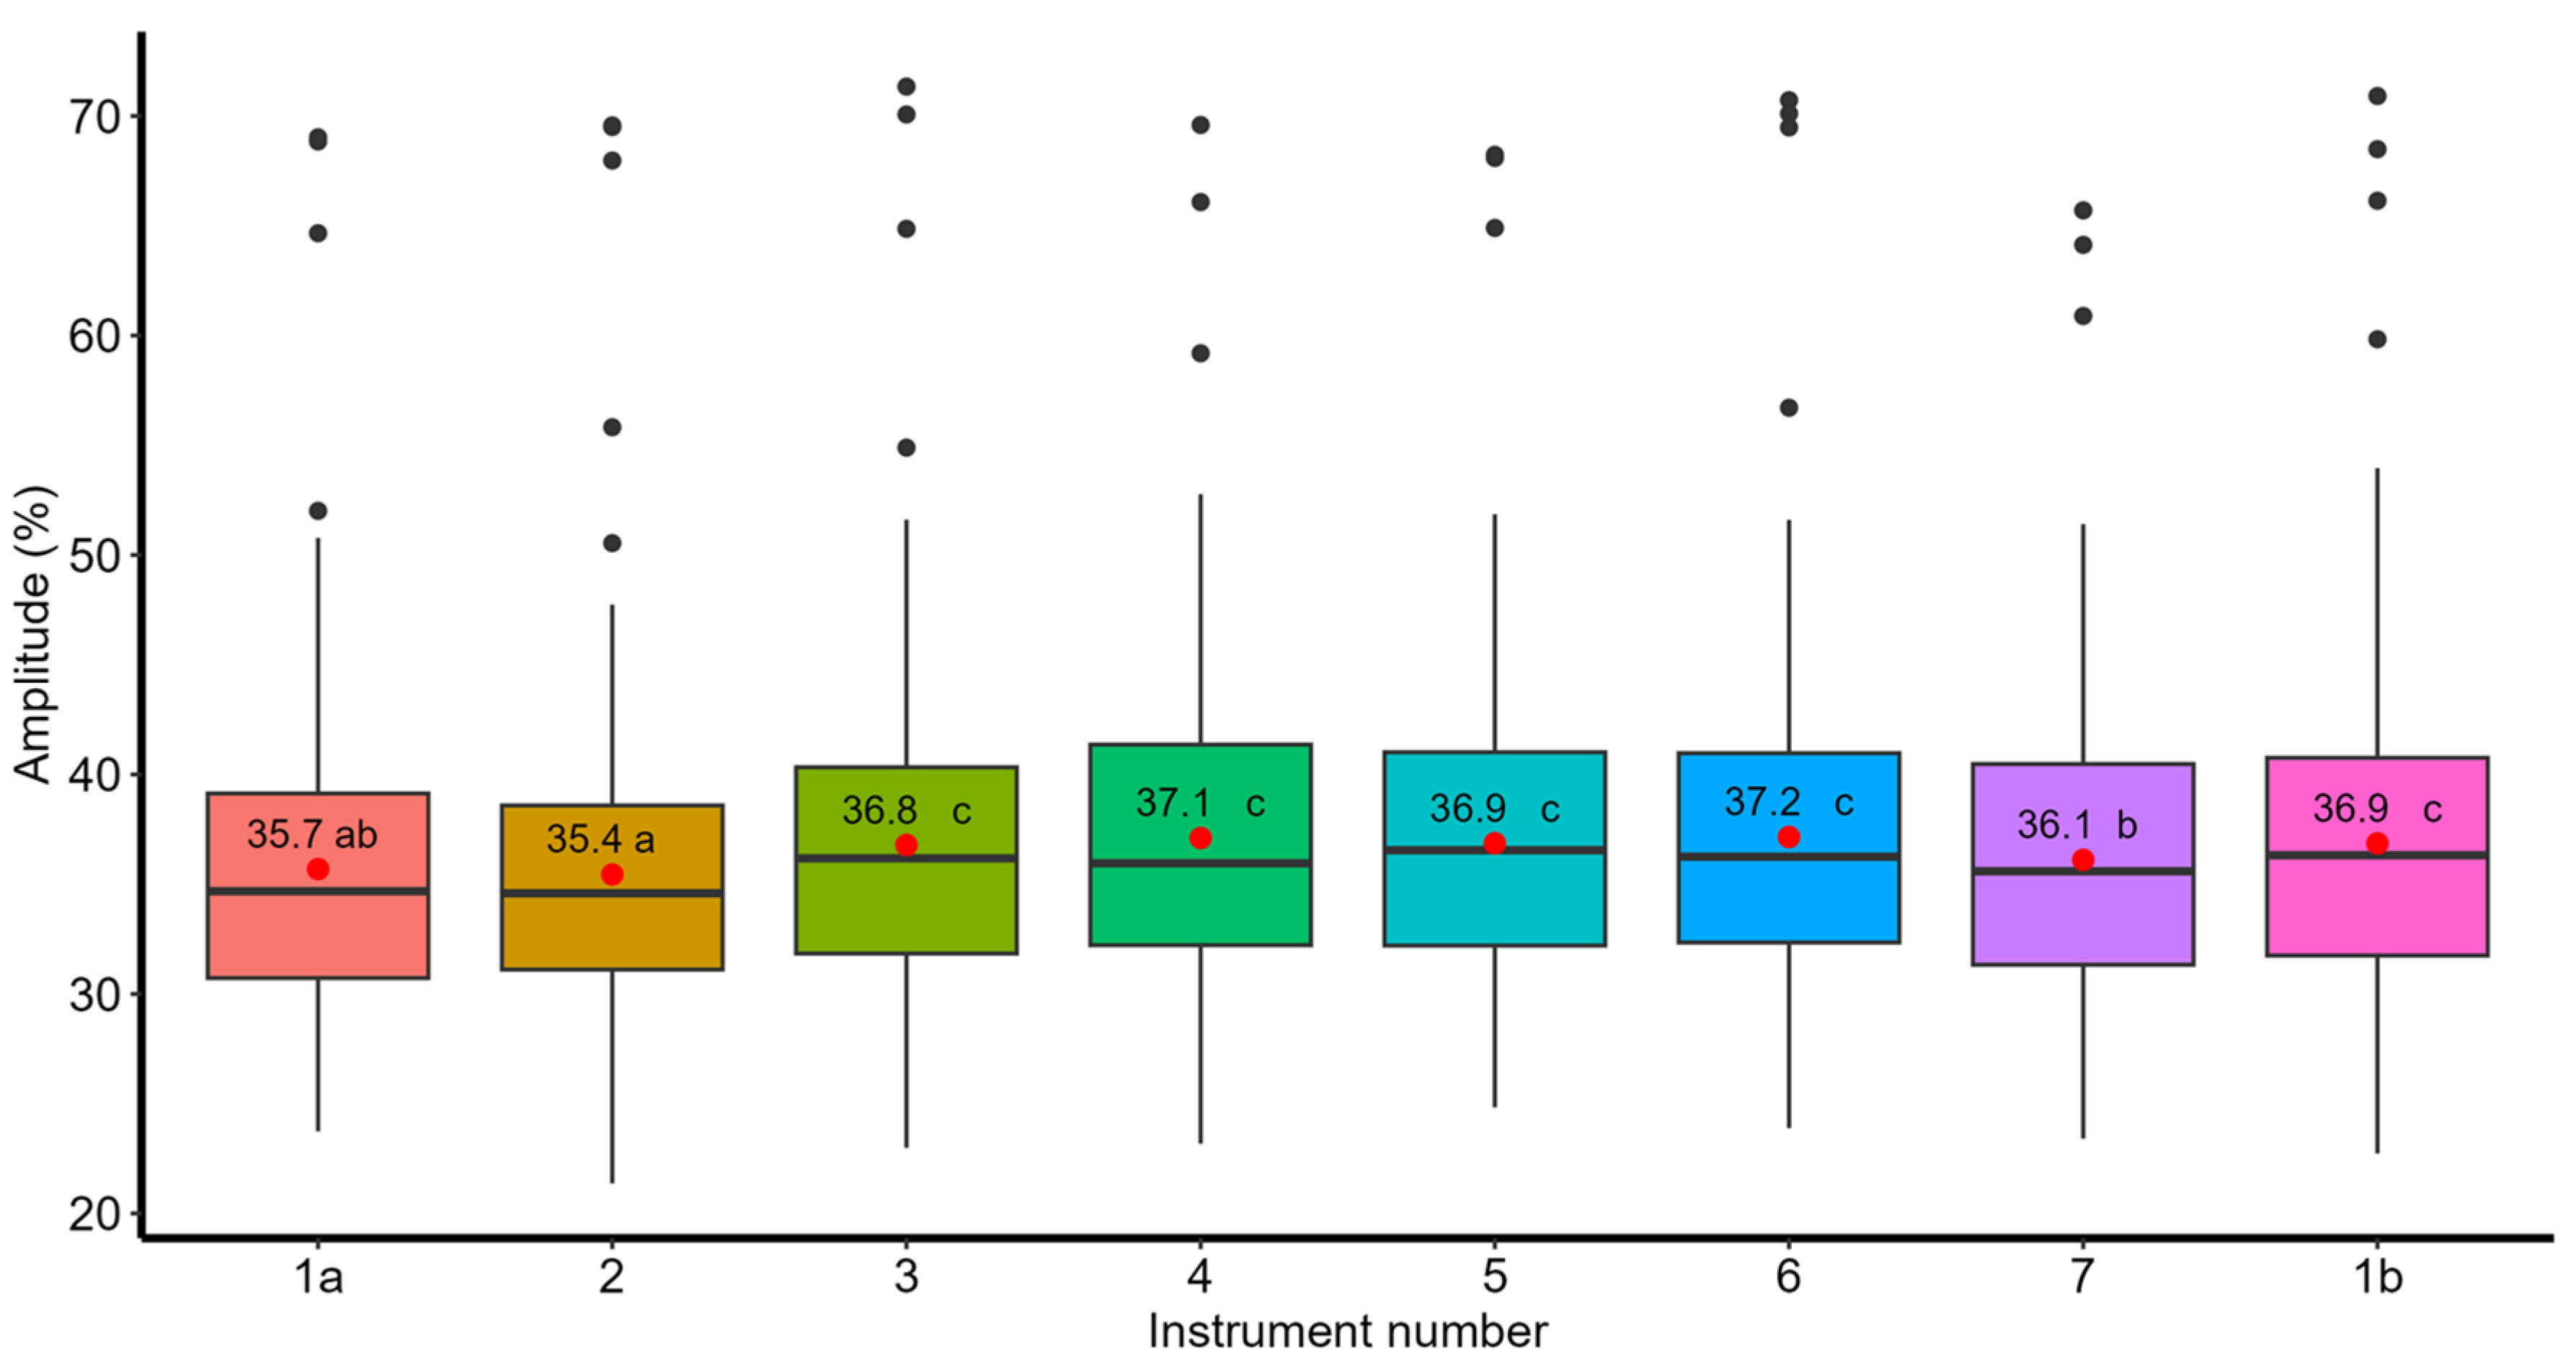
3.5. Amplitude Variation among Instruments
3.6. Resi Basic Density Prediction Using the Same Conversion Parameters
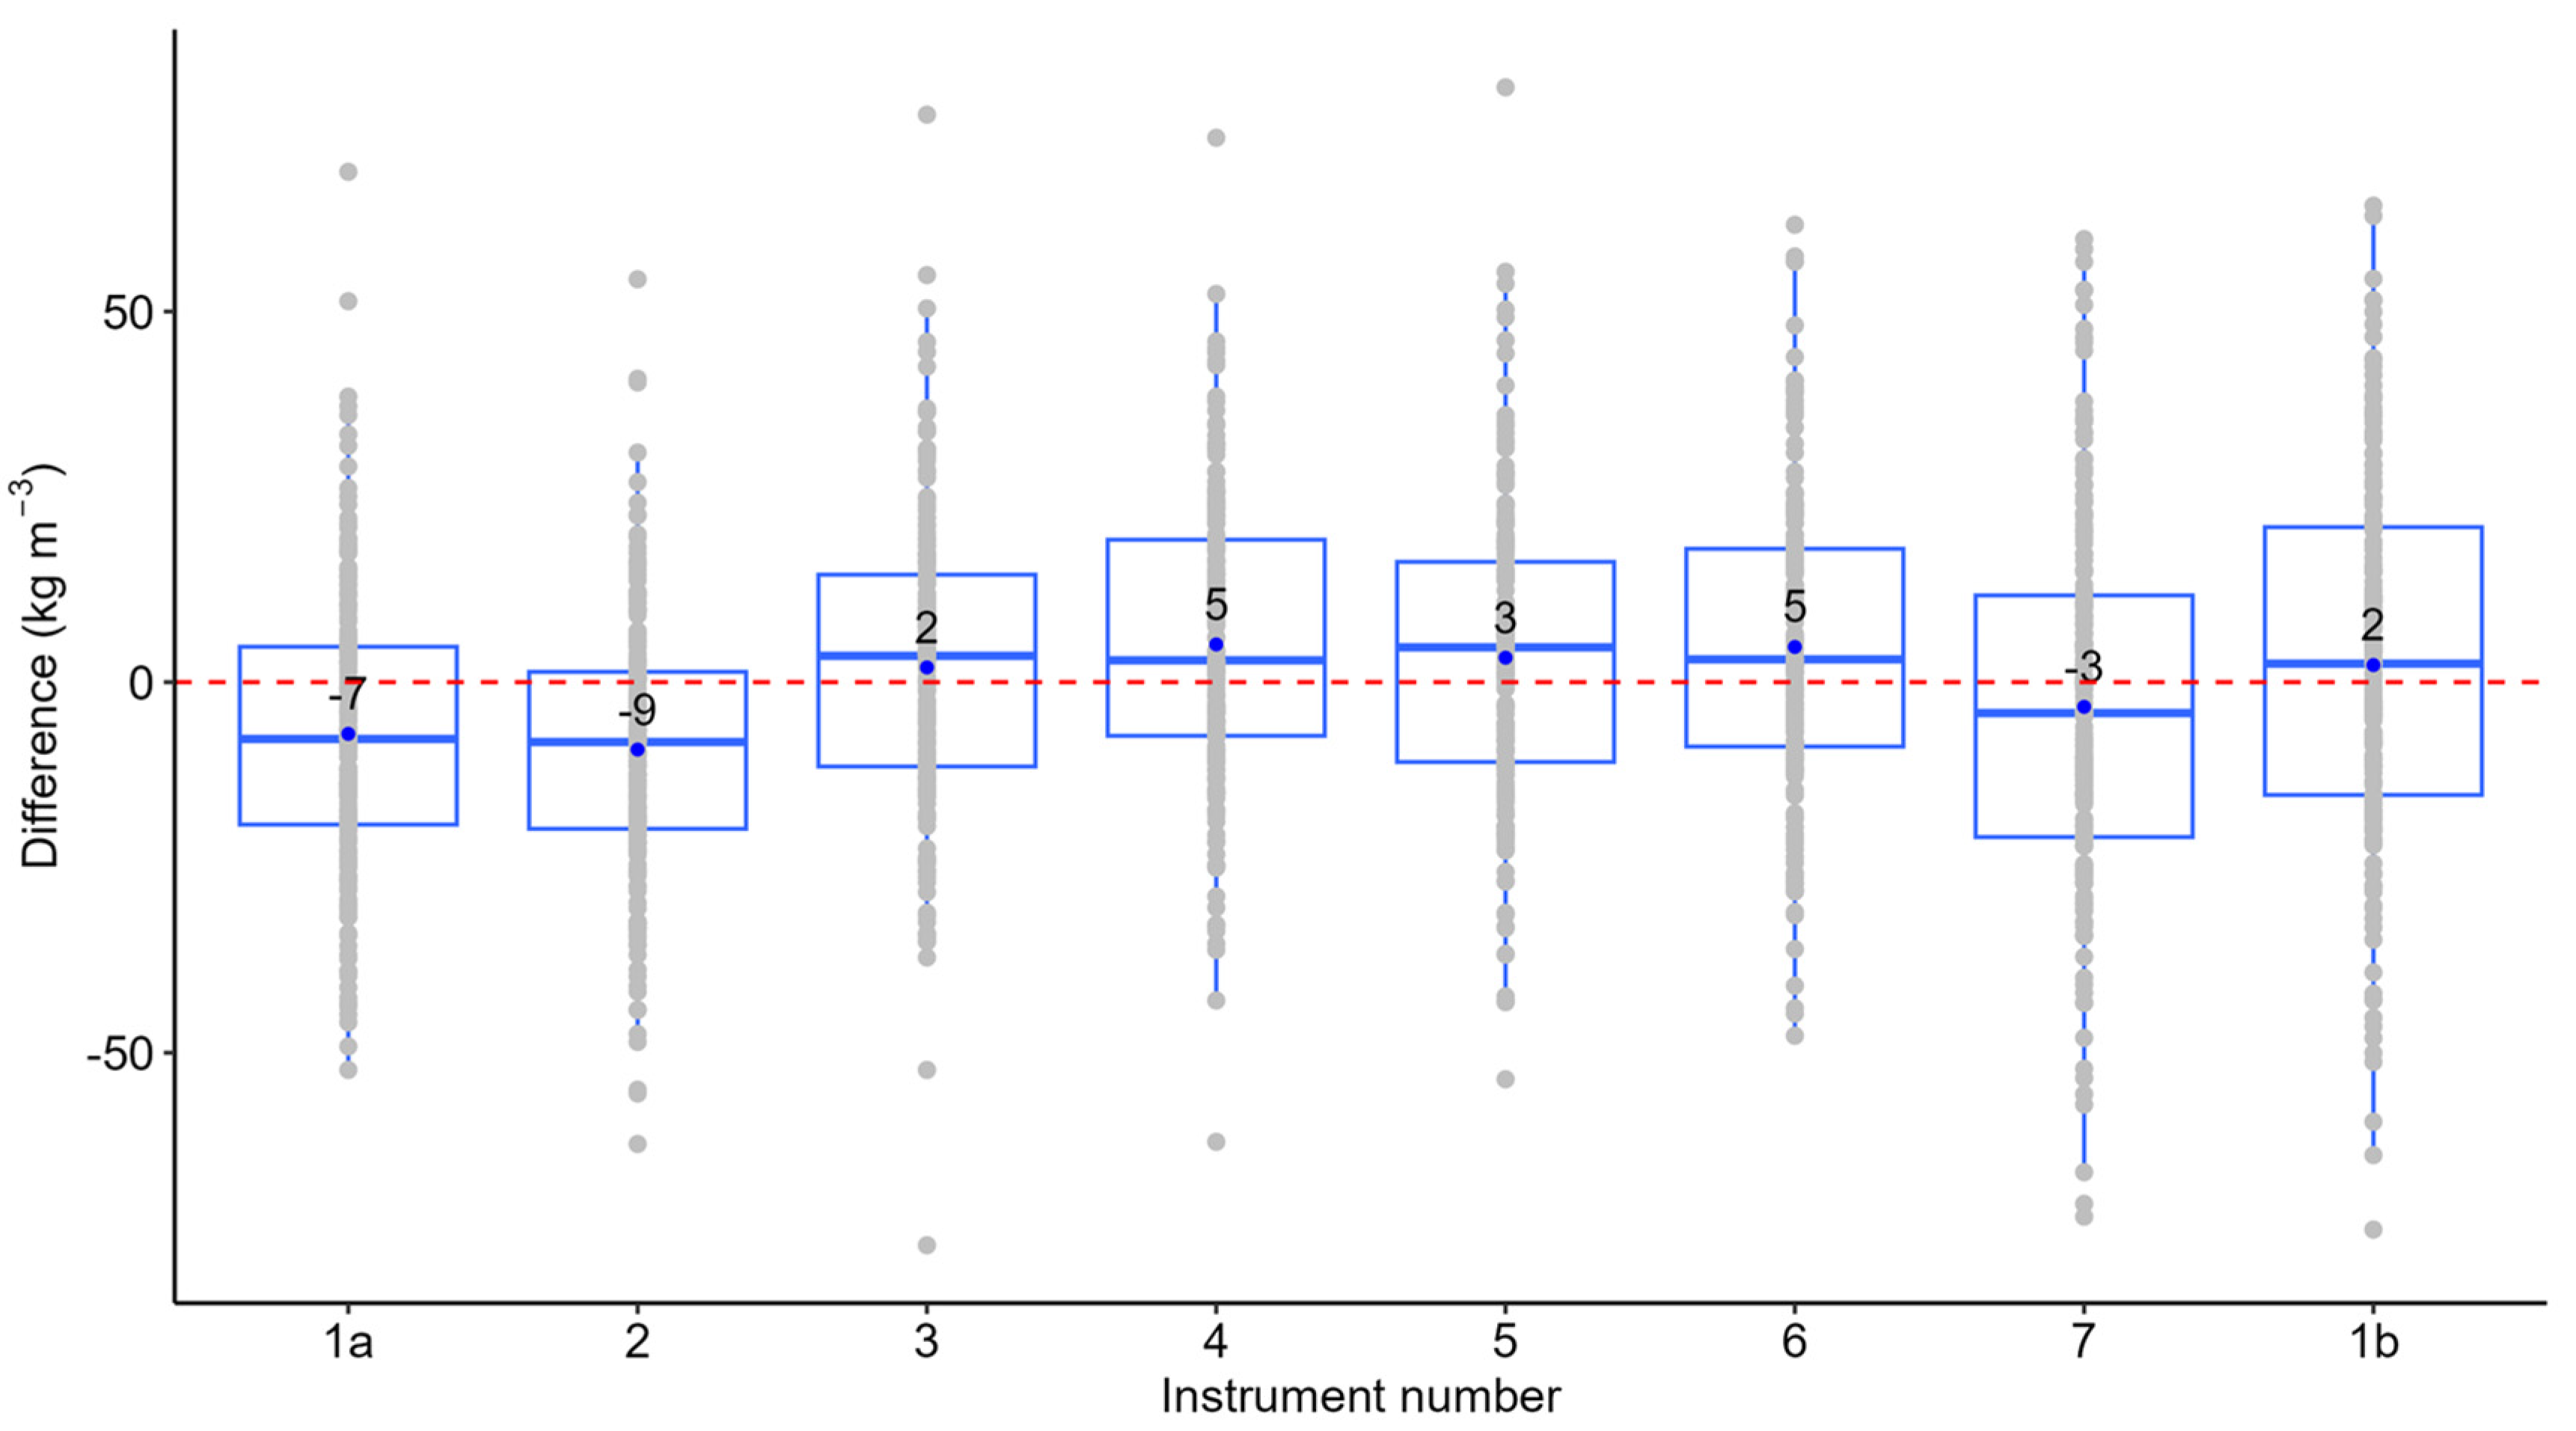
3.7. Amplitude Effect on Basic Density Predicted by Different Resi Instruments
4. Discussion
5. Conclusions
Author Contributions
Funding
Data Availability Statement
Acknowledgments
Conflicts of Interest
References
- Rinn, F. Basics of micro-resistance drilling for timber inspection. Holztechnologie 2012, 53, 24–29. [Google Scholar]
- Rinn, F.; Schweingruber, F.-H.; Schär, E. Resistograph and X-ray density charts of wood. Comparative evaluation of drill resistance profiles and X-ray density charts of different wood species. Holzforsch. Int. J. Biol. Chem. Phys. Technol. Wood 1996, 50, 303–311. [Google Scholar] [CrossRef]
- Kamm, W.; Voss, S. Process and Device for Determining the Internal Condition of Trees or Wooden Components. US Patent No 4671105, 9 June 1987. [Google Scholar]
- Rinn, F. Device for Material Testing, Especially Wood Inspection by Drill Resistance Measurements. German Patent DE 412 24 94 B4, 11 March 2004. [Google Scholar]
- Schimleck, L.; Dahlen, J.; Apiolaza, L.A.; Downes, G.; Emms, G.; Evans, R.; Moore, J.; Pâques, L.; Van den Bulcke, J.; Wang, X. Non-destructive evaluation techniques and what they tell us about wood property variation. Forests 2019, 10, 728. [Google Scholar] [CrossRef]
- Downes, G.M.; Lausberg, M.; Potts, B.; Pilbeam, D.; Bird, M.; Bradshaw, B. Application of the IML Resistograph to the infield assessment of basic density in plantation eucalypts. Aust. For. 2018, 81, 177–185. [Google Scholar] [CrossRef]
- Gao, S.; Wang, X.; Brashaw, B.K.; Ross, R.J.; Wang, L. Rapid assessment of wood density of standing tree with nondestructive methods—A review. In Proceedings of the 2012 International Conference on Biobase Material Science and Engineering, Changsha, China, 21–23 October 2012. [Google Scholar]
- Downes, G.; Lausberg, M. Evaluation of the RESI software tool for the prediction of HM200 within pine logs sourced from multiple sites across New Zealand and Australia. NZ Solid Wood Innov. 2016, 15, 1. [Google Scholar]
- Walker, T.D.; Isik, F.; McKeand, S.E. Genetic Variation in Acoustic Time of Flight and Drill Resistance of Juvenile Wood in a Large Loblolly Pine Breeding Population. For. Sci. 2019, 65, 469–482. [Google Scholar] [CrossRef]
- Fundova, I.; Funda, T.; Wu, H.X. Non-destructive wood density assessment of Scots pine (Pinus sylvestris L.) using Resistograph and Pilodyn. PLoS ONE 2018, 13, 16. [Google Scholar] [CrossRef]
- Eckard, J.T.; Isik, F.; Bullock, B.; Li, B.; Gumpertz, M. Selection Efficiency for Solid Wood Traits in Pinus taeda using Time-of-Flight Acoustic and Micro-Drill Resistance Methods. For. Sci. 2010, 56, 233–241. [Google Scholar]
- Isik, F.; Li, B. Rapid assessment of wood density of live trees using the Resistograph for selection in tree improvement programs. Can. J. For. Res. 2003, 33, 2426–2435. [Google Scholar] [CrossRef]
- Krajnc, L.; Gričar, J.; Jevšenak, J.; Hafner, P.; Brus, R. Tree rings, wood density and climate–growth relationships of four Douglas-fir provenances in sub-Mediterranean Slovenia. Trees 2023, 37, 449–465. [Google Scholar] [CrossRef]
- Nickolas, H.; Williams, D.; Downes, G.; Harrison, P.; Vaillancourt, R.; Potts, B. Application of resistance drilling to genetic studies of growth, wood basic density and bark thickness in Eucalyptus globulus. Aust. For. 2020, 83, 172–179. [Google Scholar] [CrossRef]
- Singh, K.P.; Siregar, I.Z.; Abad, J.I.M.; Karlinasari, L. Non-destructive modeling using a drilling resistance tool to predict wood basic density of standing trees in a eucalypts plantation in North Sumatra, Indonesia. Biodiversitas 2022, 23, 6218–6226. [Google Scholar] [CrossRef]
- Downes, G.M.; Harrington, J.J.; Drew, D.M.; Lausberg, M.; Muyambo, P.; Watt, D.; Lee, D.J. A Comparison of Radial Wood Property Variation on Pinus radiata between an IML PD-400 ‘Resi’ Instrument and Increment Cores Analysed by SilviScan. Forests 2022, 13, 751. [Google Scholar] [CrossRef]
- Rocha-Sepúlveda, M.F.; Vega, M.; Harrison, P.A.; Joyce, K.; Vaillancourt, R.E.; Potts, B.M. Using ensemble learning to model climate associated variation in wood properties of planted Eucalyptus nitens in north-western Tasmania. New For. 2022, 54, 867–895. [Google Scholar] [CrossRef]
- Vlad, R.; Ispravnic, A.; Dinca, L.; Sidor, C.; Cuciurean, C.; Stefan, G. Influence of Planting Scheme on Some Physical Properties of Norway Spruce (Picea abies (L.) H. Karst) Wood. Forests 2022, 13, 540. [Google Scholar] [CrossRef]
- Orozco-Aguilar, L.; Nitschke, C.R.; Livesley, S.J.; Brack, C.; Johnstone, D. Testing the accuracy of resistance drilling to assess tree growth rate and the relationship to past climatic conditions. Urban For. Urban Green. 2018, 36, 1–12. [Google Scholar] [CrossRef]
- Downes, G.; Drew, D.; Lee, D. Validated Softwood Stiffness Predictions Using IML-Resistograph and eCambium; Forest and Wood Products Australia: Melbourne, Australia, 2020; Available online: https://fwpa.com.au/validated-softwood-stiffness-predictions-using-iml-resistograph-and-ecambium/ (accessed on 1 January 2020).
- Downes, G.M.; Drew, D.; Moore, J.; Lausberg, M.; Harrington, J.; Elms, S.; Watt, D.; Holtorf, S. Evaluating and Modeling Radiata Pine Wood Quality in the Murray Valley Region; FWPA Project PNC325-1314; Forest and Wood Products Australia: Melbourne, Australia, 2016; Available online: https://fwpa.com.au/wp-content/uploads/2021/09/Final_Report__eCambium__PNC325-1314.pdf (accessed on 10 December 2023).
- Downes, G.M.; Lee, D.; Bailleres, H.; Hopewell, G.; Hogg, B. Predicting log quality properties using the IML-Resistograph traces. In FWPA PNC361-1415: Improving Returns from Southern Pine Plantations through Innovative Resource Characterisation; University of the Sunshine Coast: Maroochydore, QLD, Australia, 2018; pp. 1–15. [Google Scholar]
- Heinrichs, J.F.; Lassen, L. Improved technique for determining the volume of irregularly shaped wood blocks. For. Prod. J. 1970, 20, 24. [Google Scholar]
- Browning, B.L. Methods of Wood Chemistry; John Wiley Sons: New York, NY, USA, 1967; Volumes I and II. [Google Scholar]
- AS/NZ 1080.3:2000; Timber—Method of Test—Method 3: Density. Standards Australia: Sydney, Australia. Standards New Zealand: Wellington, New Zealand, 2000.
- Downes, G.M. User Guide to the FWPA ResiProcessor Web Platform; Version 4.3.0; Forest Quality Pty Ltd.: Huonville, TAS, Australia, 2023. [Google Scholar]
- R Core Team. R: A Language and Environment for Statistical Computing; R Foundation for Statistical Computing: Vienna, Austria, 2022. [Google Scholar]
- Allaire, J.; Xie, Y.; Dervieux, C.; McPherson, J.; Luraschi, J.; Ushey, K.; Atkins, A. Rmarkdown: Dynamic Documents for R. 2023. Available online: https://CRAN.R-project.org/package=rmarkdown (accessed on 10 December 2023).
- R Core Team. RStudio: Integrated Development for R; Computer Program; RStudio, PBC: Boston, MA, USA, 2022. [Google Scholar]
- Bates, D.; Mächler, M.; Bolker, B.; Walker, S. Fitting linear mixed-effects models using lme4. J. Stat. Softw. 2015, 67, 1–48. [Google Scholar] [CrossRef]
- Pinheiro, J.; Bates, D. Mixed-Effects Models in S and S-PLUS; Springer Science & Business Media: Berlin/Heidelberg, Germany, 2006. [Google Scholar]
- Russell, L. Emmeans: Estimated Marginal Means, Aka Least-Squares Means, R Package Version 1.5.0. The Comprahensive R Archive Network (CRAN). 2020. Available online: https://CRAN.R-project.org/package=emmeans (accessed on 10 December 2023).
- Pei, G.; Vlad, R.; Sidor, C.G.; Ispravnic, A. Quality assessment of Norway spruce standing trees through non-destructive methods and techniques. Rev. Silvic. Cineg. 2018, 23, 28–33. [Google Scholar]
- Todoroki, C.L.; Lowell, E.C.; Filipescu, C.N. Wood density estimates of standing trees by microdrilling and other non-destructive measures. N. Zealand J. For. Sci. 2021, 51, 1–14. [Google Scholar] [CrossRef]
- Ukrainetz, N.K.; O’Neill, G.A. An analysis of sensitivities contributing measurement error to Resistograph values. Can. J. For. Res. 2010, 40, 806–811. [Google Scholar] [CrossRef]
- Rinntech. Technology and Know-How for Inspecting Trees and Forests, Timber and Structures, Wood and Tree-Rings. RESISTOGRAPH® 6th Generation of Our Portable Resistance Drills since 1986. Available online: http://www.rinntech.de/images/stories/PDF/RINNTECH_RESISTOGRAPH_650_Info.pdf (accessed on 22 September 2023).
- IML—Instrumenta Mechanik Labor System GmbH. Measured Variables of the IML-RESI PowerDrill®Drill Resistance and Feed Force Measurement; IML—Instrumenta Mechanik Labor System GmbH: Wiesloch, Germany, 2022. [Google Scholar]
- Johnstone, D.; Ades, P.; Moore, G.M.; Smith, I.W. Using an IML-Resi drill to assess wood density in Eucalyptus globulus subsp. pseudoglobulus. Aust. For. 2011, 74, 190–196. [Google Scholar] [CrossRef]
- Bailleres, H.; Lee, D.J.; Kumar, C.; Psaltis, S.; Hopewell, G.; Brancheriau, L. Improving Returns from Southern Pine Plantations through Innovative Resource Characterisation; Project Report; Forest & Wood Products Australia: Melbourne, VIC, Australia, 2019; Available online: https://fwpa.com.au/wp-content/uploads/2019/04/Final_Report_Southern_Pines_PNC361-1416.pdf (accessed on 10 December 2023).
- Harris, J.M. Shrinkage and density of radiata pine compression wood in relation to its anatomy and mode of formation. N. Zealand J. For. Sci. 1977, 7, 91–106. [Google Scholar]
- Gendvilas, V.; Neyland, M.; Rocha-Sepúlveda, M.F.; Downes, G.M.; Hunt, M.; Jacobs, A.; Williams, D.; Vega, M.; O’Reilly-Wapstra, J. Effects of thinning on the longitudinal and radial variation in wood properties of Eucalyptus nitens. For. Int. J. For. Res. 2022, 95, 504–517. [Google Scholar] [CrossRef]
- Sharapov, E.; Wang, X.; Smirnova, E.; Wacker, J.P. Wear behavior of drill bits in wood drilling resistance measurements. Wood Fiber Sci. 2018, 50, 154–166. [Google Scholar] [CrossRef]
- Sharapov, E.; Brischke, C.; Militz, H.; Toropov, A. Impact of drill bit feed rate and rotational frequency on the evaluation of wood properties by drilling resistance measurements. Int. Wood Prod. J. 2019, 10, 128–138. [Google Scholar] [CrossRef]
- Sharapov, E.; Brischke, C.; Militz, H. Effect of Grain Direction on Drilling Resistance Measurements in Wood. Int. J. Archit. Herit. 2021, 15, 250–258. [Google Scholar] [CrossRef]
- Sharapov, E.; Brischke, C.; Militz, H.; Smirnova, E. Combined effect of wood moisture content, drill bit rotational speed and feed rate on drilling resistance measurements in Norway spruce (Picea abies (L.) Karst.). Wood Mater. Sci. Eng. 2020, 15, 198–204. [Google Scholar] [CrossRef]
- Gendvilas, V.; Downes, G.M.; Lausberg, M.; Harrington, J.; Lee, D. Predicting wood density using resistance drilling: The effect of varying feed speed and RPM. 2023; Unpublished. [Google Scholar]


| Instrument Number | Instrument Serial Number | Status | Instrument Owner | Test Done |
|---|---|---|---|---|
| 1a | PD500-1023 | New | University Sunshine Coast | April 2022 |
| 2 | PD400-0468 | Serviced | Forest Quality | April 2022 |
| 3 | PD500-0755 | Serviced | HQPlantations | April 2022 |
| 4 | PD500-1099 | Serviced | HQPlantations | April 2022 |
| 5 | PD400-0893 | Serviced | HQPlantations | April 2022 |
| 6 | PD500-1154 | New | Queensland Dept. Agriculture and Fisheries | June 2022 |
| 7 | PD500-1234 | New | HQPlantations | November 2022 |
| 1b * | PD500-1023 | Serviced | University Sunshine Coast | November 2022 |
| Site Number | Site Location | Age | Taxon |
|---|---|---|---|
| 1 | Cpt. 12 Red Ridge LA | 33.9 | PCH * |
| 2 | Cpt. 11 Taurus LA | 32.8 | Hybrid (F1) * |
| 3 | Cpt. 203A Swampy LA | 29 | Hybrid (F1) * |
| 4 | Cpt. 201 Swampy LA | 28.5 | Hybrid (F1) * |
| 5 | Cpt. 215A Kelly LA | 26 | Hybrid (F1) * |
| 6 | Cpt. 215A Elliot LA | 27 | Hybrid (F2) * |
| Model Type | Adjusted R2 | RMSE | Model for Outerwood Basic Density |
|---|---|---|---|
| Linear | 0.836 | 23.72 | BD = 256.2 + 7.81 (AMP) |
| Power | 0.856 | 23.72 | BD = 128.2 + 14.3 (AMP) − 0.0795 (AMP)2 |
| Natural Log | 0.858 | 21.74 | BD = −546.75 + 303.9Ln (AMP) |
| Sampling Time | Resi Number | Adjusted R2 | RMSE | AIC | Model for Outerwood Basic Density |
|---|---|---|---|---|---|
| 1 | 1a | 0.891 | 19.98 | 1551 | BD = −567.0 + 311.6 Ln(AMP) |
| 1 | 2 | 0.906 | 18.57 | 1525 | BD = −574.0 + 314.1 Ln(AMP) |
| 1 | 3 | 0.881 | 20.80 | 1565 | BD = −542.5 + 302.2 Ln(AMP) |
| 1 | 4 | 0.890 | 20.03 | 1543 | BD = −603.6 + 318.3 Ln(AMP) |
| 1 | 5 | 0.884 | 20.54 | 1561 | BD = −615.3 + 322.1 Ln(AMP) |
| 2 | 6 | 0.881 | 20.88 | 1557 | BD = −529.3 + 297.7 Ln(AMP) |
| 3 | 7 | 0.816 | 25.91 | 1642 | BD = −518.9 + 297.0 Ln(AMP) |
| 3 | 1b | 0.823 | 25.44 | 1635 | BD = −475.3 + 283.4 Ln(AMP) |
| Amplitude (%) | RESI Number | |||||||||||
|---|---|---|---|---|---|---|---|---|---|---|---|---|
| 1a | 2 | 3 | 4 | 5 | 6 | 7 | 1b | Cross Validated Model from All Resi Tools | Max | Min | Difference kg/m3 | |
| 10 | 150 | 149 | 153 | 129 | 126 | 156 | 165 | 177 | 153 | 177 | 126 | 51 |
| 20 | 366 | 367 | 363 | 350 | 350 | 363 | 371 | 374 | 364 | 374 | 350 | 24 |
| 30 | 493 | 494 | 485 | 479 | 480 | 483 | 491 | 489 | 487 | 494 | 479 | 15 |
| 40 | 582 | 585 | 572 | 571 | 573 | 569 | 577 | 570 | 574 | 585 | 569 | 16 |
| 50 | 652 | 655 | 640 | 642 | 645 | 635 | 643 | 633 | 642 | 655 | 633 | 21 |
| 60 | 709 | 712 | 695 | 700 | 703 | 690 | 697 | 685 | 698 | 712 | 685 | 27 |
| 70 | 757 | 760 | 741 | 749 | 753 | 735 | 743 | 729 | 744 | 760 | 729 | 32 |
Disclaimer/Publisher’s Note: The statements, opinions and data contained in all publications are solely those of the individual author(s) and contributor(s) and not of MDPI and/or the editor(s). MDPI and/or the editor(s) disclaim responsibility for any injury to people or property resulting from any ideas, methods, instructions or products referred to in the content. |
© 2024 by the authors. Licensee MDPI, Basel, Switzerland. This article is an open access article distributed under the terms and conditions of the Creative Commons Attribution (CC BY) license (https://creativecommons.org/licenses/by/4.0/).
Share and Cite
Gendvilas, V.; Lee, D.J.; Kain, D.P.; Kumar, C.; Downes, G.M.; Lausberg, M.; Harrington, J.J. Predicting Wood Density Using Resistance Drilling: The Effect of Instrument and Operator. Forests 2024, 15, 157. https://doi.org/10.3390/f15010157
Gendvilas V, Lee DJ, Kain DP, Kumar C, Downes GM, Lausberg M, Harrington JJ. Predicting Wood Density Using Resistance Drilling: The Effect of Instrument and Operator. Forests. 2024; 15(1):157. https://doi.org/10.3390/f15010157
Chicago/Turabian StyleGendvilas, Vilius, David J. Lee, Dominic P. Kain, Chandan Kumar, Geoff M. Downes, Marco Lausberg, and Jonathan J. Harrington. 2024. "Predicting Wood Density Using Resistance Drilling: The Effect of Instrument and Operator" Forests 15, no. 1: 157. https://doi.org/10.3390/f15010157
APA StyleGendvilas, V., Lee, D. J., Kain, D. P., Kumar, C., Downes, G. M., Lausberg, M., & Harrington, J. J. (2024). Predicting Wood Density Using Resistance Drilling: The Effect of Instrument and Operator. Forests, 15(1), 157. https://doi.org/10.3390/f15010157