Article

Evolutionary Characteristics and Driving Forces of Green Space in Guangzhou from a Zoning Perspective

1
College of Urban and Rural Construction, Zhongkai University of Agriculture and Engineering, Guangzhou 510225, China
2
Institute of Sustainable Building and Energy Conservation, Zhongkai University of Agriculture and Engineering, Guangzhou 510225, China
3
Guangdong Lingnan Township Green Building Industrialization Engineering Technology Research Center, Guangzhou 510225, China
4
School of Surveying and Geoinformation Engineering, East China University of Technology, Nanchang 330013, China
*
Author to whom correspondence should be addressed.
Forests 2024, 15(1), 135; https://doi.org/10.3390/f15010135
Submission received: 13 December 2023 / Revised: 27 December 2023 / Accepted: 2 January 2024 / Published: 9 January 2024
(This article belongs to the Section Urban Forestry)

Abstract

:
Urban green spaces provide very important environmental and social services. Their dynamic changes are driven by a combination of natural and socioeconomic factors. However, the coupling mechanism of these factors has not been systematically studied. In this study, we examined dynamic characteristics of green space in Guangzhou from different zoning perspectives and explored the regional heterogeneity of the individual and interactive effects of driving factors using the geographic detector. The results showed that (1) from 2000 to 2020, the annual change rate of green space area in the central area was more apparent than that in the suburban areas. The fragmentation of green space in the near suburbs had increased. (2) Changes in green space were influenced by the combination of topography, climate, and socioeconomic development. From 2010 to 2020, the expansion of built-up land and GDP growth gradually had a substantial effect on the change in green space in the central area and the near suburbs. (3) The q-values of the interaction detections of the geodetector showed that the explanatory power of most factor interactions exceeded that of individual factors. Green space in the central area was primarily influenced by the interaction of economic and built-up land expansion. In contrast, green space in the near suburbs was mainly influenced by the interaction of urban expansion and topography and climate. Green space in the far suburbs was mainly affected by climate factors and human activity intensity. The results and methods of this study can provide decision support for the zoning planning of urban green space system in other cities or regions.

1. Introduction

Urban green space is the area covered by vegetation in cities. As an important public space and ecological land, it helps reduce the heat island effect [1,2], improve the quality of the ecological environment [3], support social and community well-being [4,5], and enhance urban resilience [6]. According to statistics, the current global urbanization rate has exceeded 50%, and more than 67.2% of the global population will live in cities by 2050 [7]. With the increasing urban population, construction land gradually spreads outward and land use intensity increases [8], which may lead to the degradation, loss, and fragmentation of some urban green spaces. This development, in turn, leads to a series of urban environmental and social equity problems, such as the heat island effect, soil erosion, flooding, air environment degradation, and inequitable green space services. Changes in urban green spaces and their functions and protection have become a key topic of concern for government authorities [9]. To reduce or avoid the negative effects of green space loss and structural changes, city managers need to monitor the dynamics of urban green space in a timely manner and take effective control measures and manage long-term planning to realize sustainable urban development. Therefore, how to quantify the change dynamics of urban green space rationally and identify relevant driving factors to assist management and prediction has become an urgent issue.
Because green space changes are spatially heterogeneous, maintaining and increasing green space effectively requires an understanding of its spatial distribution characteristics and related factors. Various data and quantitative methods are employed in researching the spatial and temporal trends in urban green spaces, including remote sensing, land use data, statistical datasets, drones, and other applications of modern technology. Because remote sensing and land use data are characterized by long time series and high resolution, they are often used as basic data. Statistical datasets, such as GDP and population, are often used to analyze the correlation with green space change. Quantitative analysis is conducted based on changes in area, transfers of land use types, and analysis of landscape patterns and morphology. However, most of the research studying or comparing the characteristics of green space change in different cities is based on the city scale, and few studies systematically analyze the differences in green space change in subregions within a city. The regional heterogeneity of urban green space changes needs attention because it is the basis for subregional planning and management. The spatial and temporal dynamics of green space varies from one subregion to another. The study shows the green space changes in the city center and peripheral sections are not consistent [10]. In addition, green space in the suburbs is very dynamic [11]. Moreover, quality and changes in green space are associated with different levels of cities and stages of urbanization [12]. Compared with percent coverage, green space configuration may be more influenced by development stage [11]. For example, Wu found a difference in the trend in green space change in the center, suburbs, and islands of Shanghai. This variation is correlated with parameters such as population density, stage of development, time of construction of residential areas, and socioeconomic status of the residents [9]. Differences have also been observed in greening trends between long-term-built-up, non-built-up, and new-build areas [13].
Change in green space is driven by three main categories: natural environment, socioeconomics, and policies [14]. Specifically, the natural environment includes altitude, slope, rainfall, temperature, and soil type. Because vegetation cover is a typical characteristic of green space, temperature, precipitation, and soil properties drive green space changes by influencing vegetation growth conditions, biomass, and photosynthetic intensity [15,16,17]. Topography is linked to the level of human disturbance, and hilly areas with complex topography and low development intensity have higher green cover and ecological service values [18]. In general, plain areas are more convenient for development and utilization. Within the context of rapid urbanization, green spaces in flat regions are more vulnerable to encroachment and destruction. Other socioeconomic considerations are primarily population migration, economic growth, and urban expansion [19]. Population migration often results in an increased demand for building land, and when land resources are limited, green spaces are vulnerable to encroachment. However, Liu argues that when population densities are low, population growth favors vegetation greening [15]. When population density rises to high levels, such increases begin to prohibit vegetation greening. Compared with the population factor, the economic role is more complex, which is related to economic growth patterns and ecological policies in different study areas [16]. Although economic growth causes environmental losses in terms of resource utilization, it can also provide monetary and technological support for environmental improvement [19]. For example, in the southwest, economic growth has hindered vegetation greening [15]. By contrast, in the Pearl River Delta of China, the increase in GDP promoted urban greening [20]. In addition, building pressure and greening policy are considered the main drivers of urban green space recovery [9,21,22,23]. Due to the complexity of the above factors on the change in green space, more studies have begun to explore the related driving mechanisms. Quantitative analysis methods for drivers include mathematical statistics and spatial statistical models [3], such as correlation analysis [24], stepwise regression analysis [25], random forest analysis [26], geodetector [27], and geographically weighted regression [28]. However, correlation analysis and geographically weighted regression have concentrated on the strength of separate factors, with limited investigation into the effects of combined factors in different regions. This interaction is tested in the multiple regression model by adding the multiplication of the two factors. However, the interaction between two factors is not necessarily a multiplicative relationship. By calculating and comparing the q-value of each single factor and the q-value of the superposition of the two factors, the geodetector can determine whether there is an interaction between the two factors, and whether the interaction is strong, weak, directional, linear or nonlinear, and so on [29]. Therefore, the geodetector method is more widely used in interaction detection.
From 2000 to 2020, Guangzhou City experienced rapid urbanization, with a substantial increase in resident population and GDP [2,30]. To improve the overall quality of the city’s environment and maintain ecological security, Guangzhou proposed the goal of building a “beautiful and livable city of flowers”. During this period, how the urban green space has changed and what the driving factors for these changes are remain unclear. Therefore, this study summarizes the regional heterogeneity by comparing the green space changes in the whole study area and those in different subareas. Because the geodetector is based on the assumption of spatial stratified heterogeneity, makes no assumption regarding linearity, and has the ability to detect interactions, this model was chosen to reveal the complex mechanism of influence of the independent variable on the dependent variable. It also further explores the main driving factors and their interaction forces in different subzones based on the geodetector model. This paper focuses on three questions: (1) How does the green space change in Guangzhou during urbanization? (2) What are the characteristics of green space changes in different subdistricts, and do they have differences? (3) What factors drive the green space changes in each subdistrict? Do they have any interaction between them? (4) Based on the results of the above analysis, what are the implications for green space research and management in regions or cities undergoing urbanization? Exploring the above questions can deepen the understanding of green space changes and driving mechanisms in different zones, thus providing methodological and theoretical references for the management of green space systems in similar cities or regions.

2. Materials and Methods
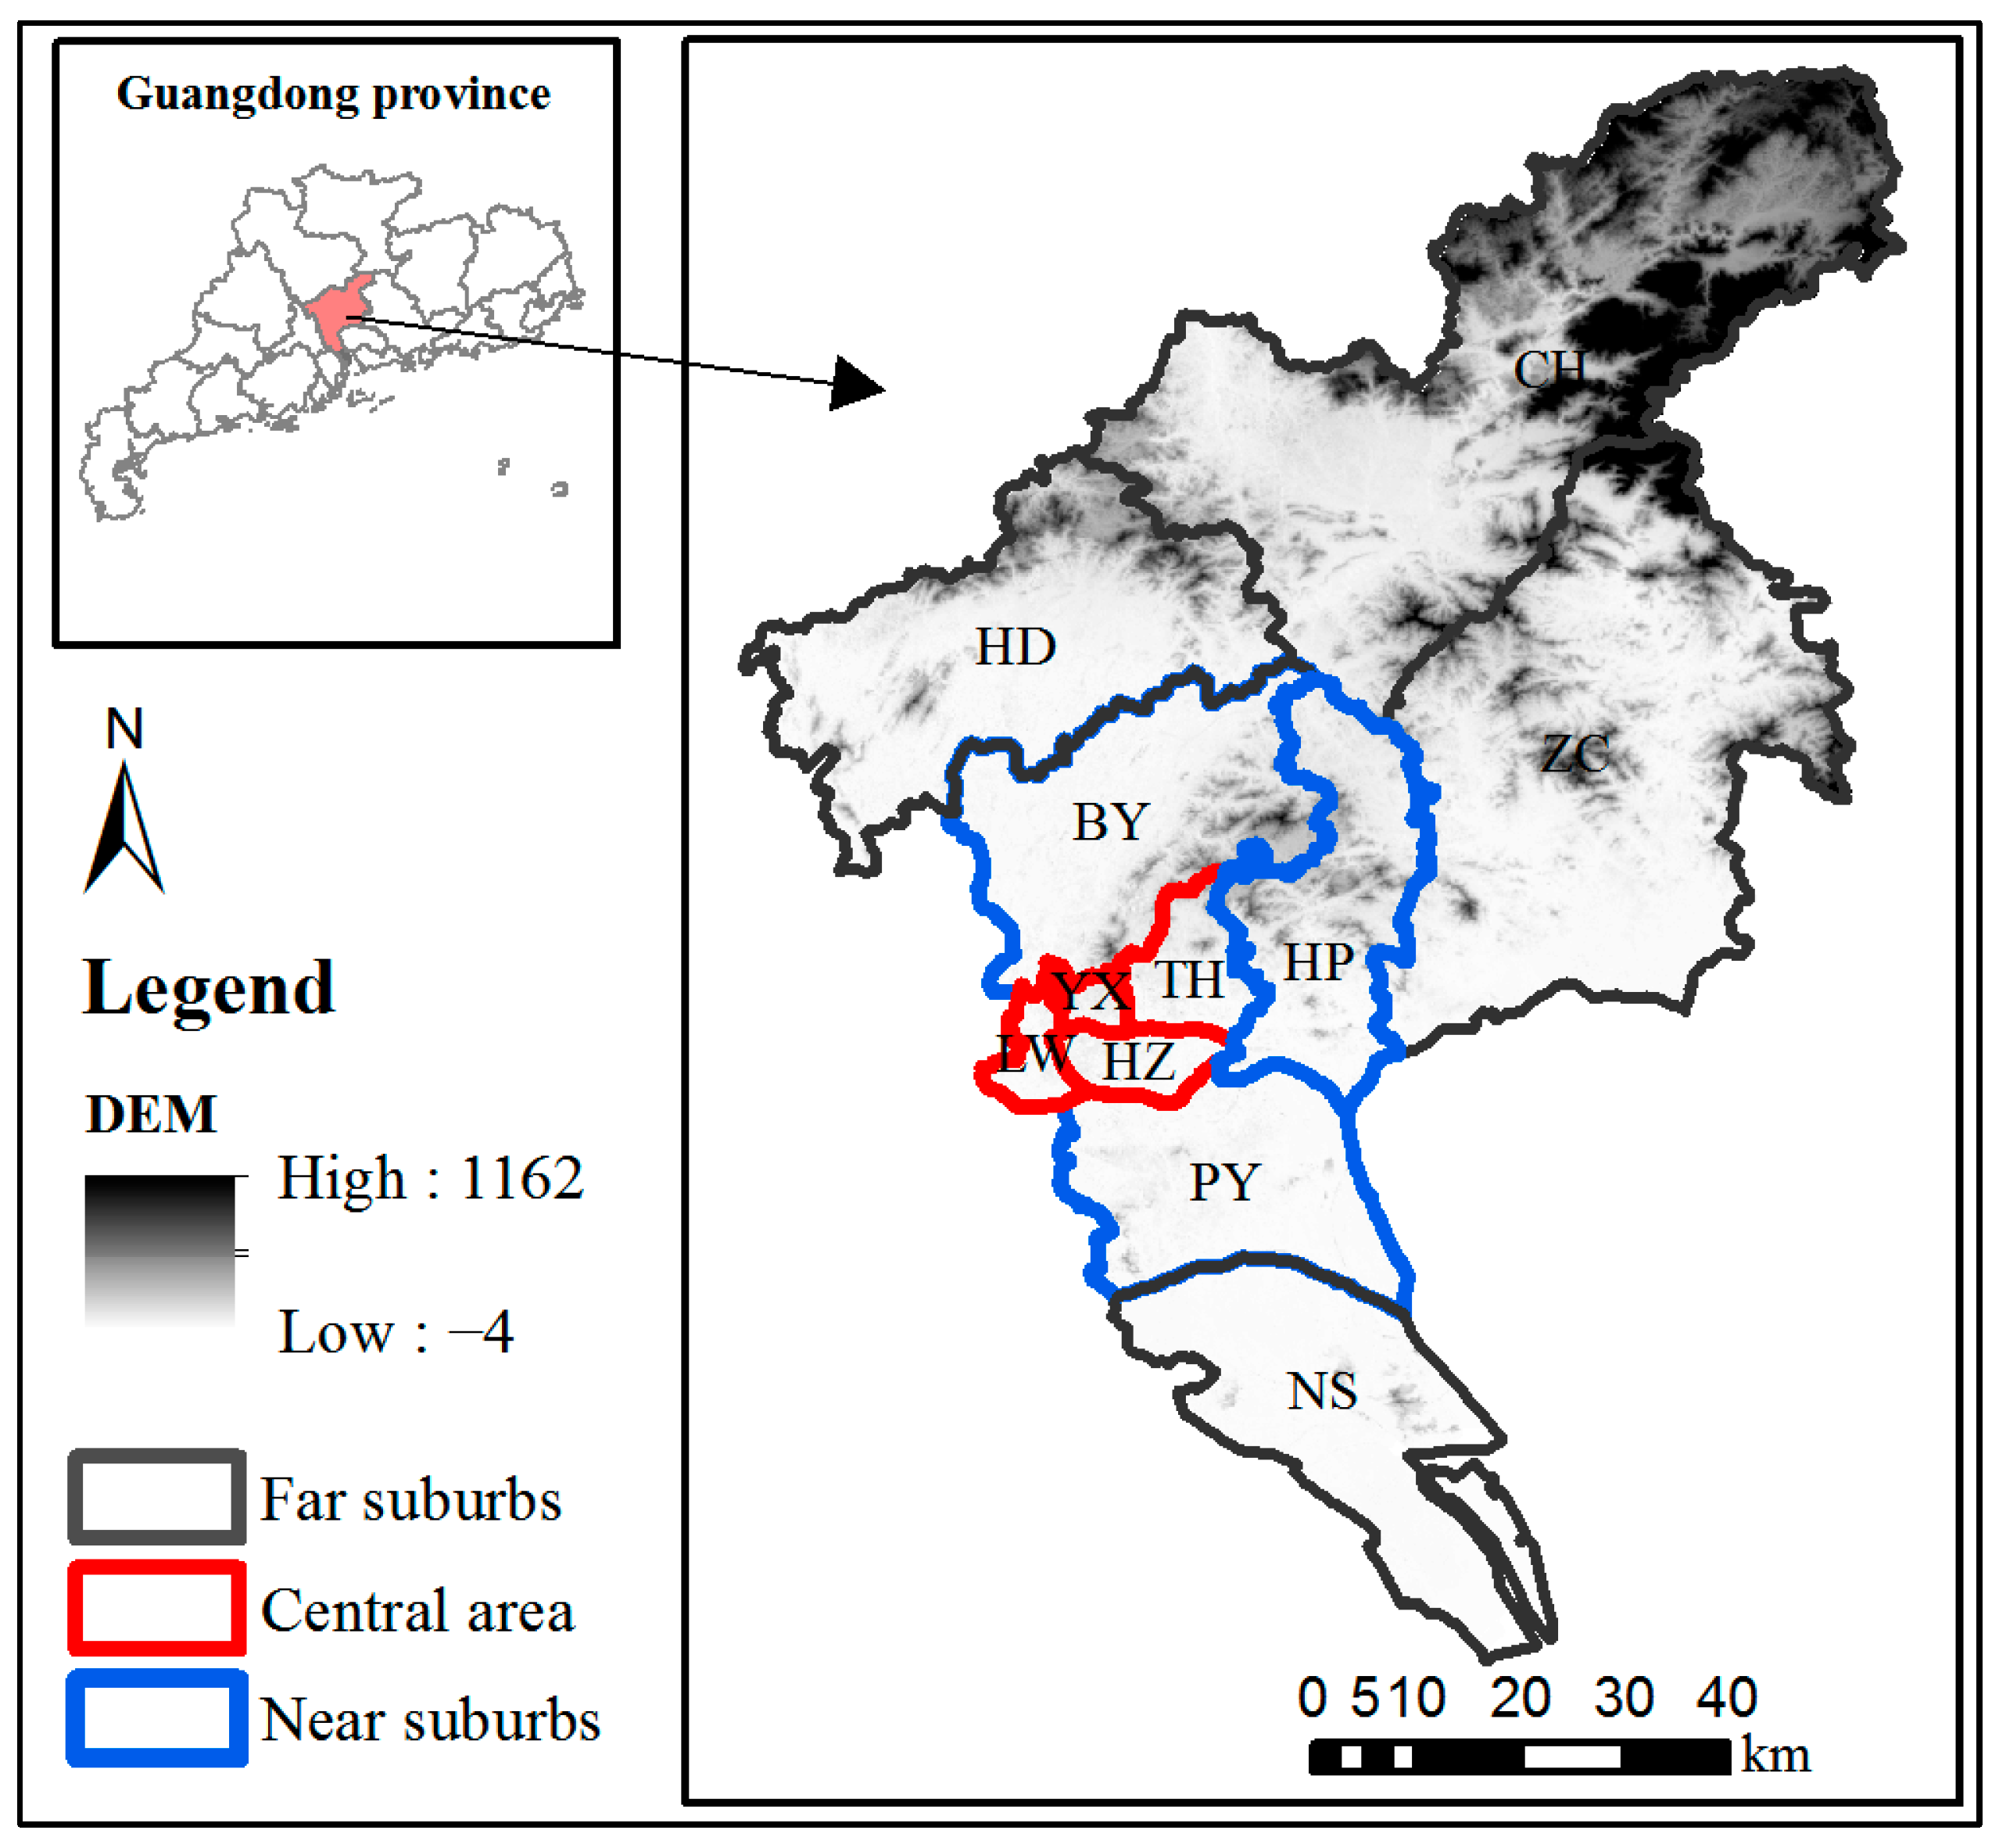
2.1. Study Area

Guangzhou is located in the south–central part of Guangdong Province, with a total area of 7434.4 square kilometers and a population of 18,676,600 (Figure 1). It is divided into three subdistricts, namely the central area, near suburbs, and far suburbs, according to its administrative division and relevant studies [31,32]. The central area is composed of four districts, which are Liwan (LW), Yuexiu (YX), Haizhu (HZ), and Tianhe (TH). The near suburbs comprise three districts: Huangpu (HP), Panyu (PY), and Baiyun (BY). The far suburbs comprise four districts: Nansha (NS), Huadu (HD), Conghua (CH), and Zengcheng (ZC). The annual average temperature of Guangzhou ranges from 21.5 °C to 22.2 °C, and it boasts abundant green space resources. Guangzhou is one of the most economically developed large cities in China. The population growth rate from 2010 to 2020 was 47.05%. The rapid urbanization process has profoundly changed the spatial pattern of the city, and it leads to consistency and conflict between green space construction and urban development. In addition, Guangzhou City is surrounded by mountains in the north and plains in the south, rich in water resources. The government aims to achieve the “Global Livable Flower City and Vibrant Park City” green construction goal (Guangzhou Green Space System Planning (2020–2035) (public draft) and special planning of park construction and protection in Guangzhou (2017–2035) (Draft for Comment) issued by the Guangzhou Forestry and Landscape Bureau). In the context of rapid urbanization, protecting and optimizing green space to achieve economic and ecological sustainability is imperative. The combination of complex natural patterns and rapid urbanization makes it a typical area to study the impact of natural socioeconomic factors on green space dynamics. The relevant results and methods can provide a reference for green space management and planning in other economically developed cities or small and medium-sized cities.

2.2. Data Source and Processing

Data for the study consisted mainly of land cover data and topographic climate and socioeconomic statistics. The land cover data were obtained from the GlobeLand30 platform, with a resolution of 30 m (https://www.webmap.cn/, accessed on 2 January 2023). The land use types were divided into five categories: cultivated land, green space, built-up land, water bodies, and unutilized land. Green space includes forests, grasslands, and shrublands. Built-up land is defined as the surface formed by human-made construction activities, including the residential land in towns and cities, industries and mining, transportation facilities, etc. It does not include internal green spaces and water bodies. Climate data were obtained from the spatially interpolated dataset of average conditions of meteorological elements in China released by the China resource and environment science and data center, with a spatial resolution of 1 km (https://www.resdc.cn/, accessed on 2 February 2023). DEM data were provided by the Geospatial data cloud with a resolution of 30 m (https://www.gscloud.cn/, accessed on 10 February 2023). The night-time light data were obtained from the improved time-series DMSP-OLS-like data (1992–2022) in China published by Harvard Dataverse (https://dataverse.harvard.edu/, accessed on 11 February 2023). The same projected coordinates, WGS 1984 UTM 49N, were used for these data. Township-scale data were obtained using administrative district vector boundary cropping statistics.

2.3. Methods

2.3.1. Dynamic Degree of Green Space Change

According to the land use dynamic degree model, the annual rate of change in green space area was calculated [33,34]. The higher the value, the faster the green space changes [25,26]. The formula is as follows:
K = S i S j S j × 1 T × 100 % ,
In Formula (1), Si and Sj represent the green space area at the end and the beginning of the study, respectively. T denotes the number of years between the study periods.

2.3.2. Landscape Metrics

Landscape metrics reflect the characteristics of landscape change at both overall and patch scales, and have been widely used in landscape ecology research [35,36,37]. This study employed landscape metrics to analyze the spatial and temporal pattern characteristics of green space change. In terms of green landscape domination, shape complexity, aggregation, and diversity, we chose four indices to compare and analyze the landscape fragmentation and the intensity of human activities in each subarea. They are the largest path index (LPI), landscape shape index (LSI), aggregation index (AI), and Shannon diversity index (SHDI). Fragstats 4.2 was used to calculate the landscape metrics.

2.3.3. Land Use Transfer Matrix

The land use transfer matrix represents the direction and amount of change in transfers between different land use types [38]. Table 1 displays the representation of the land use transfer matrix. Ai denotes land use type i. The sum of the row elements represents the total land area before the transfer, while the sum of the column elements represents the area of the land after the transfer. i and j denote the land types before and after the transfer, respectively. Sij indicates the land area transferred from type i to type j.

2.3.4. Geodetector

The geodetector is based on the idea of spatial stratified heterogeneity, which means that if an independent variable has an important effect on a dependent variable, then the spatial distributions of the independent and dependent variables should be similar [39,40,41]. This is used to identify the driving factors of geographic phenomena [28]. It includes four modules: factor detection, interaction detection, ecological detection, and risk detection. Among them, factor detection is used to estimate the spatial heterogeneity of the dependent variable and quantify the explanatory power of the influencing factors. When the partition is generated by the independent variable X, a larger q value indicates that the spatial distribution of X and Y is more consistent, the explanatory power of the independent variable X on the attribute Y is stronger, and vice versa. Interaction detection can identify the explanatory power of the interaction between different factors on the dependent variable. Due to the complexity of the urban green space system, there may be some covariance in the influencing factors, but the model has no linearity assumption, so it is generalizable. In this study, factor detection and interaction detection were mainly applied to reveal the main driving forces and their interaction types that affect the spatial distribution of green space according to the magnitude of explanatory power. The specific formulas for the geographic detectors are as follows:
q = 1 1 N σ 2   h = 1 L N h σ h 2 .  
where q is the explanatory power of the influencing factor of the spatial distribution of green space, with a value between 0 and 1. The higher the value of q, the more consistent the influencing factor is with the spatial distribution of urban green space, and the stronger the corresponding explanatory power. The independent variable X is a type variable, and X and variable Y are partitioned according to the corresponding level. h = 1, …, L is the partition of variable Y or factor X. Nh and N are the number of cells in the subarea h and the whole area, respectively. σ h 2 and σ 2 are the variance of the values of Y in the subregion h and the whole region, respectively.
Interaction detectors can quantitatively characterize whether two factors have a stronger or weaker effect on spatial patterns than a single factor. Interactions include five relationships: nonlinearly weakened, single-factor nonlinearly weakened, two-factor enhanced, independent, and nonlinearly enhanced. This study is based on the “GD” package version 1.10 in the R Studio (4.0.5) software for classification and calculation [42].

2.3.5. Driving Factor Selection

Relevant studies have found that socioeconomic and natural ecological conditions are the main driving factors influencing the development of urban green spaces [15,16,30,33,43,44,45,46]. The influencing factors in this study were selected from the aspects of topographic climate (mean annual temperature (TEM), annual precipitation (PRE), and DEM) and socioeconomics (GDP, built-up land area (BLA), population density (POD), and night-time light (NTL)) (Table 2). In contrast to related studies [33,47], we synthesized topographic climate factors and included a night-time light representing the intensity of human activity. The dynamic intensity of green space change in each street and township is considered the dependent variable.

3. Results

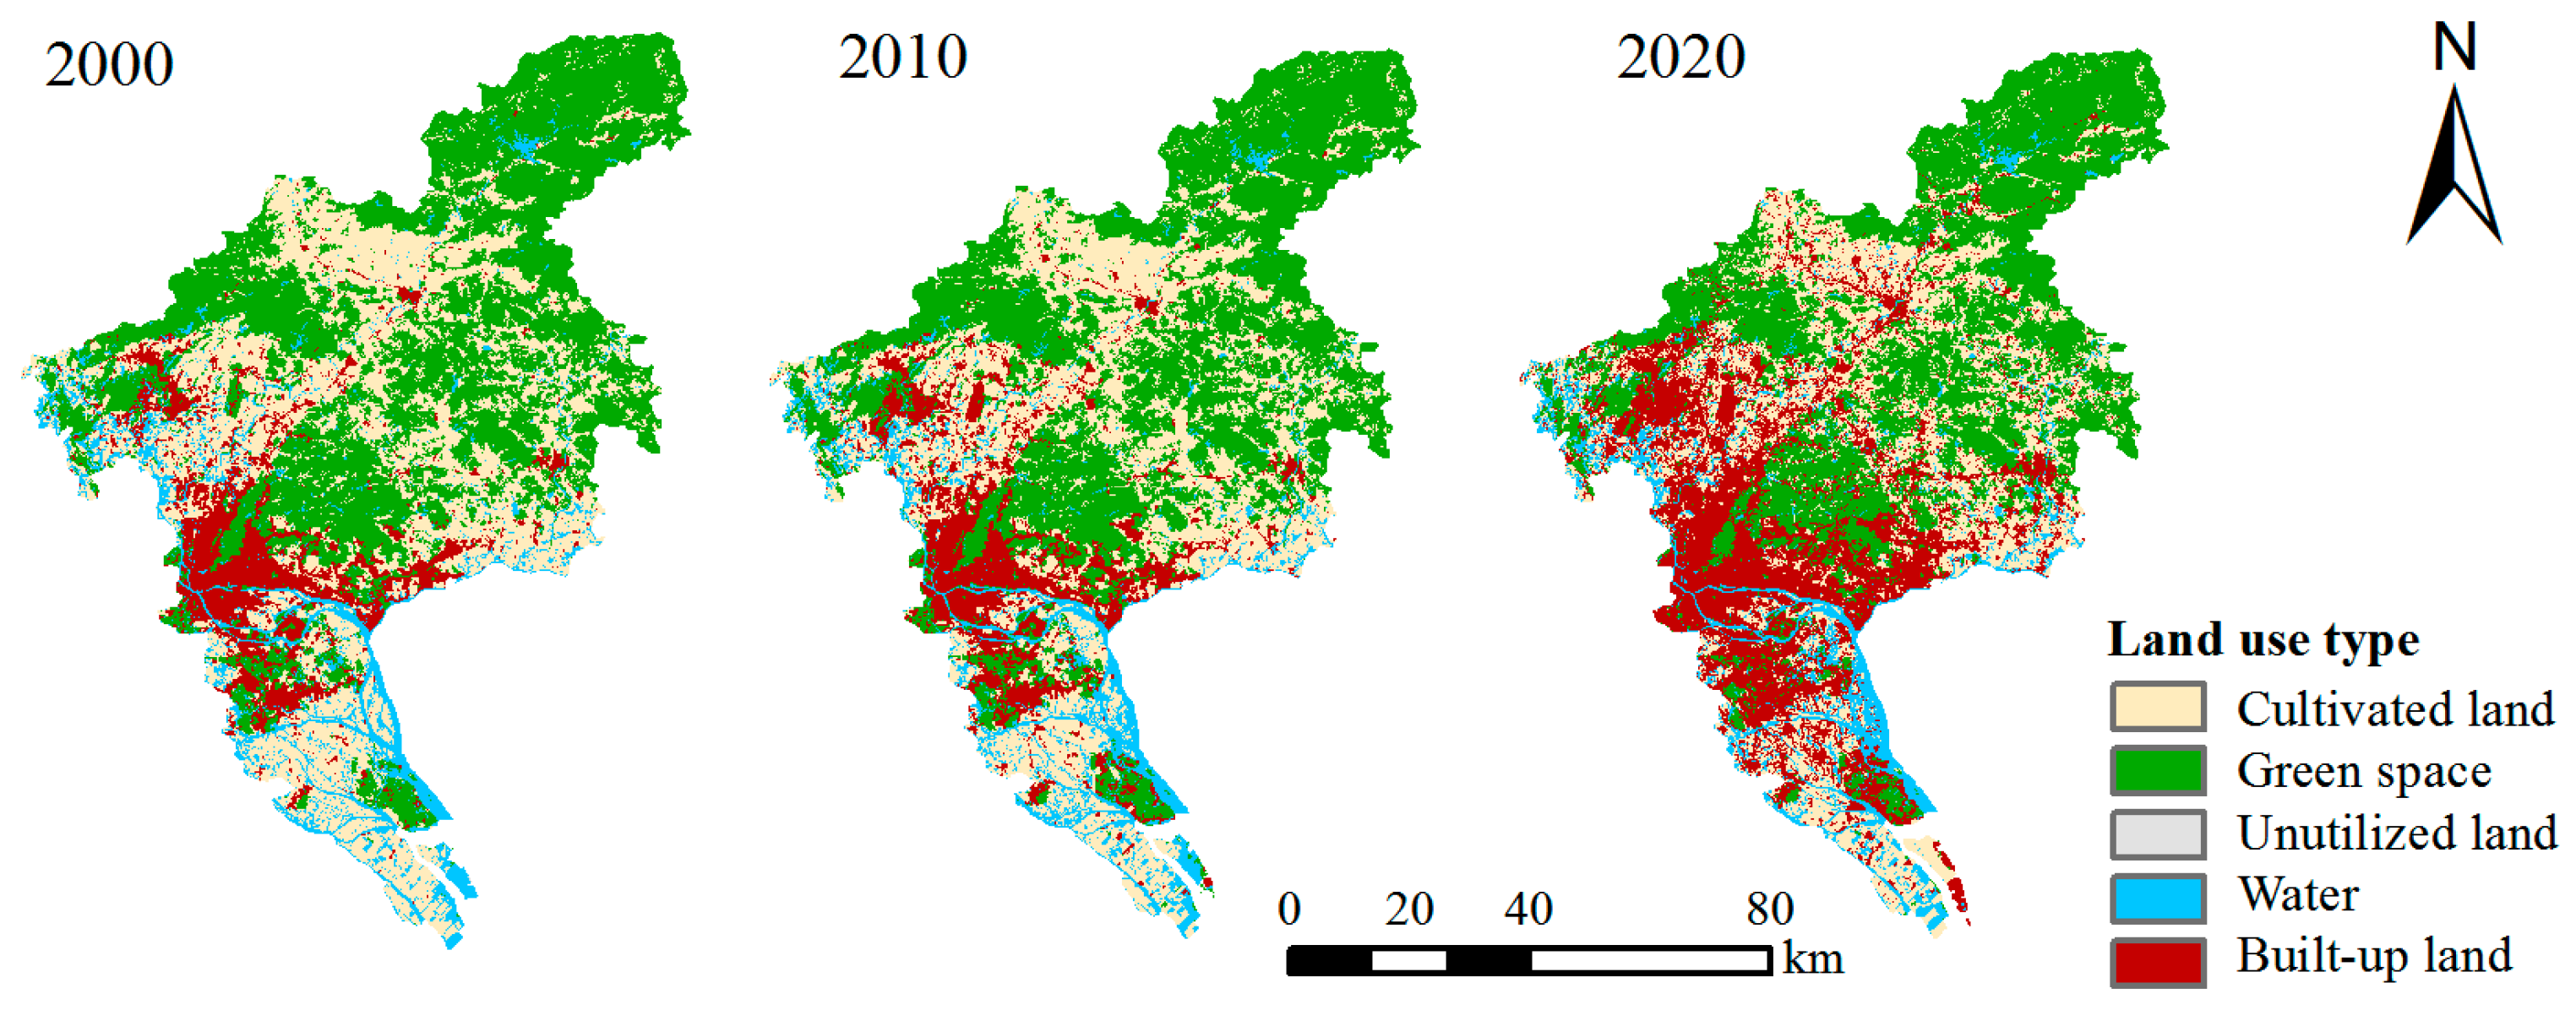
3.1. Spatiotemporal Change in Green Space Pattern

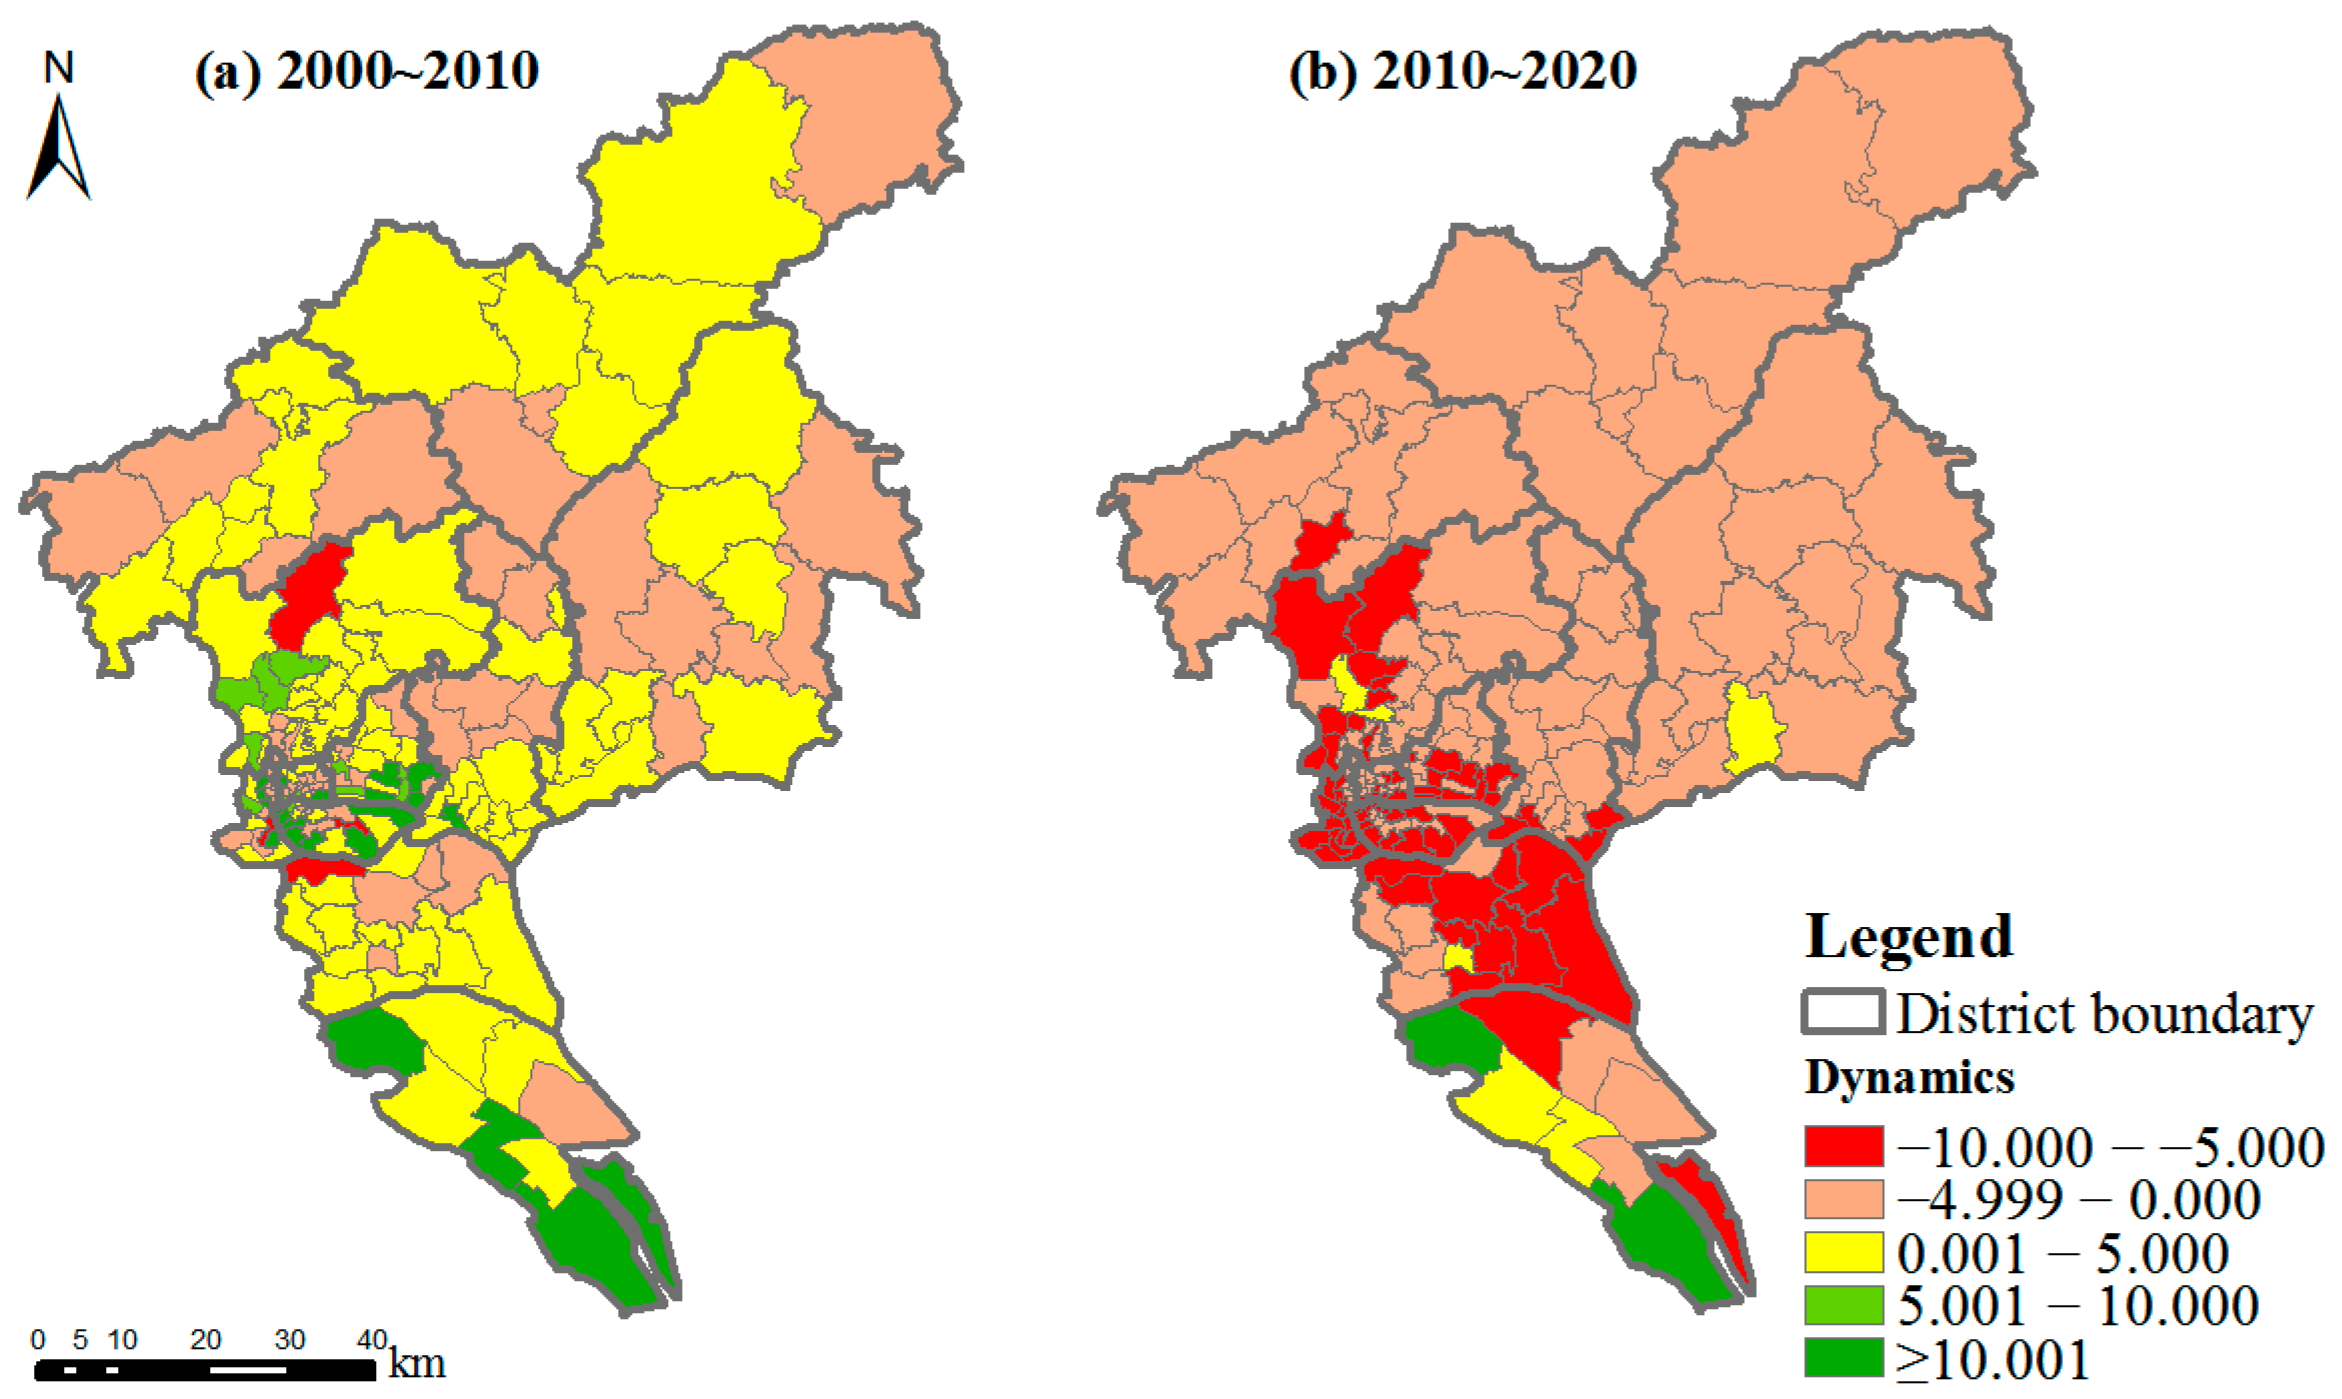
3.1.1. Green Space Dynamics Intensity

The distribution pattern and dynamics of green space in Guangzhou are shown in Figure 2 and Figure 3, respectively. The changes in green space across the city showed a slight increase followed by a gradual decrease, and the dynamics of change differed among subdistricts. The green space in the central area increased between 2000 and 2010 but decreased between 2010 and 2020 (Table 3). The green space in the near suburbs gradually decreased. The green space in the far suburbs was stable between 2000 and 2010, and then decreased slightly between 2010 and 2020. Overall, the intensity of change was more pronounced for green space in the central area, followed by green space in the near suburbs, and finally green space in the far suburbs.
In terms of the spatial distribution of green space dynamics at the township scale, most regions showed an increasing trend from 2000 to 2010 (Figure 3). Among them, the green space of some streets and townships in Nansha, Haizhu, Tianhe, and Baiyun districts increased significantly. In contrast, in 2010–2020, the trend in green space change was the opposite. The green space in the central area decreased rapidly. Only the green space in the western coastal townships of Nansha District increased substantially.

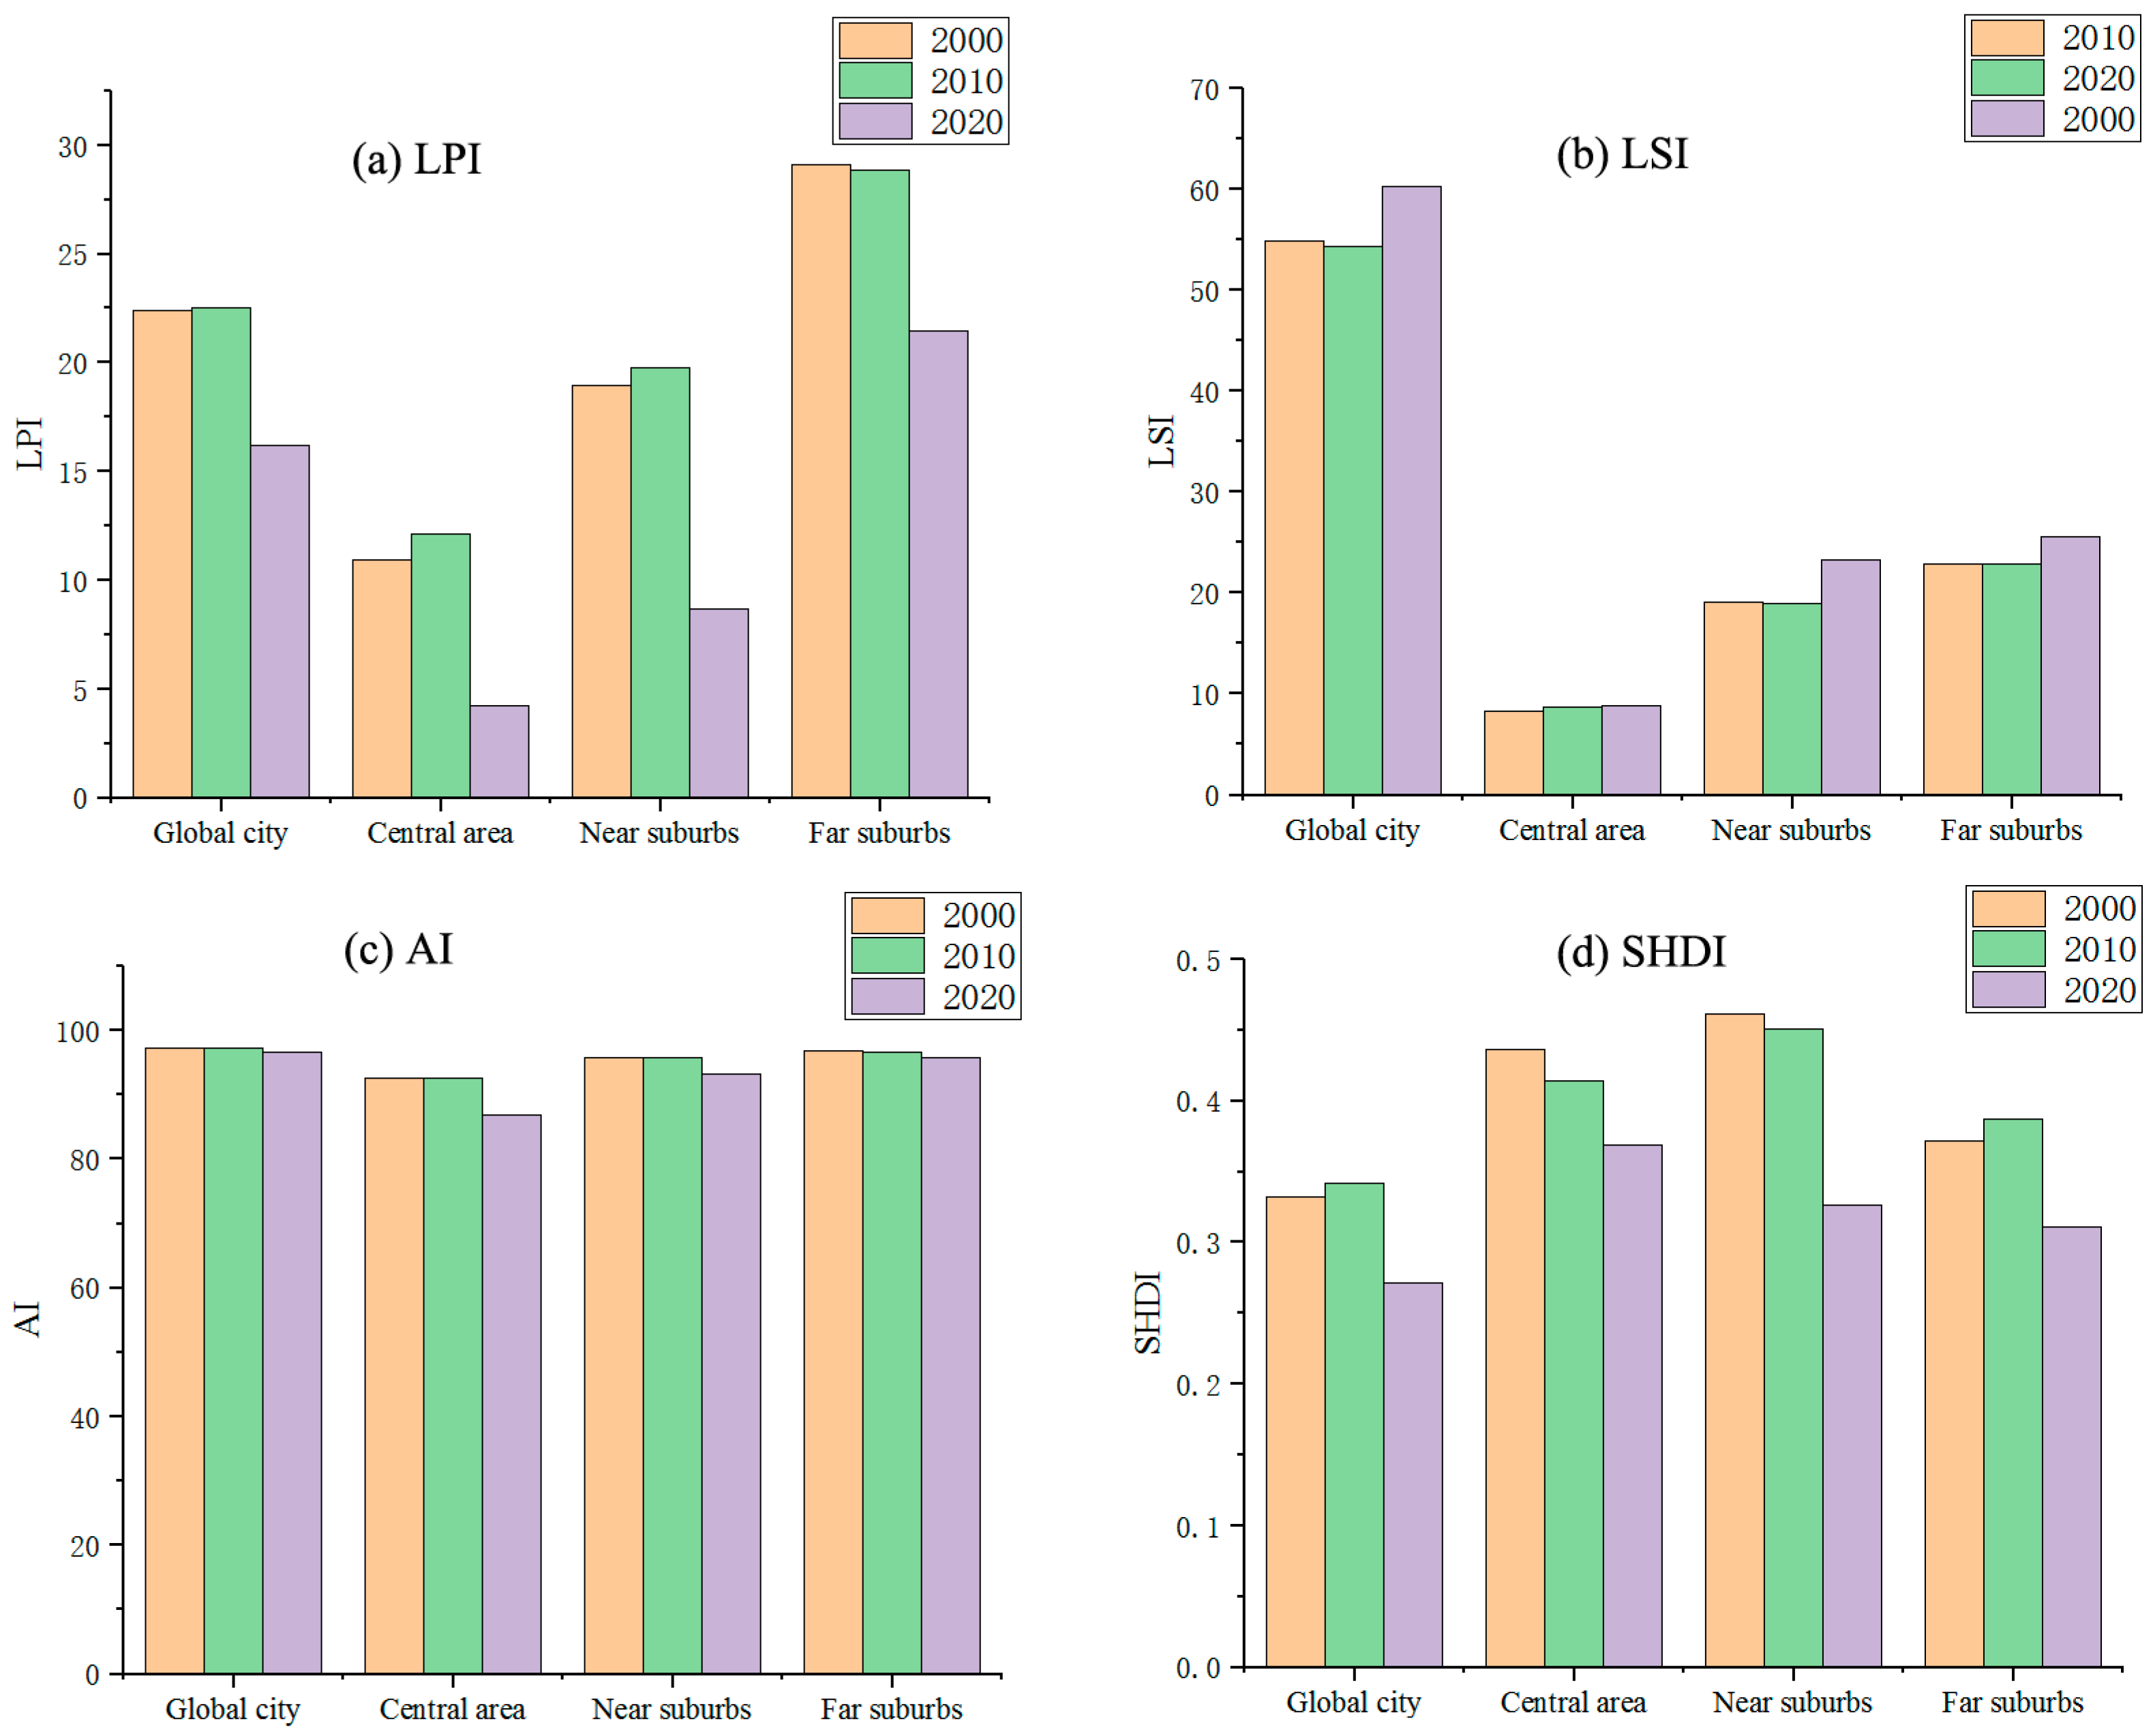
3.1.2. Green Space Landscape Change

The landscape pattern of green spaces in Guangzhou has undergone considerable changes over the past 20 years due to the intensification of human activities (Figure 4). In terms of LPI, the dominance of green space in the whole city increased slightly and then gradually decreased. The dominance of green space in the central and near suburbs areas increased slightly between 2000 and 2010, and then decreased substantially between 2010 and 2020. The degree of green dominance in the far suburbs gradually decreased. Between 2010 and 2020, the complexity of green space patterns (LSI) in the near suburbs and far suburbs increased, whereas the patterns in the central area remained stable. In terms of AI, the overall green space agglomeration did not change much, decreasing slightly in the 2010–2020 phase. The AI values of green space in the central area from 2000 to 2020 were 92.504, 92.646, and 86.81, respectively. The AI values of green space in the near suburbs from 2000 to 2020 were 95.679, 95.760, and 93.160, respectively, and the AI values of green space in the far suburbs from 2000 to 2020 were 96.823, 96.705, and 95.834, respectively. The decrease in green space aggregation in the central area was slightly greater than that of green space in the near suburbs and far suburbs. In terms of SHDI, the diversity of green space in the city increased slightly and then decreased considerably. The green space diversity in the central and suburban areas gradually decreased, whereas the green space diversity in the far suburban areas showed a trend of increasing and then decreasing.
Overall, the city’s green landscape was optimized between 2000 and 2010, but the degree of fragmentation increased between 2010 and 2020, and the shape of patches was more complex. Between 2010 and 2020, the fragmentation of green landscapes in the central and near suburbs areas increased substantially. The LPI, LSI, and SHDI of green landscapes in the near suburbs changed more than those in the central and far suburbs areas between 2010 and 2020.

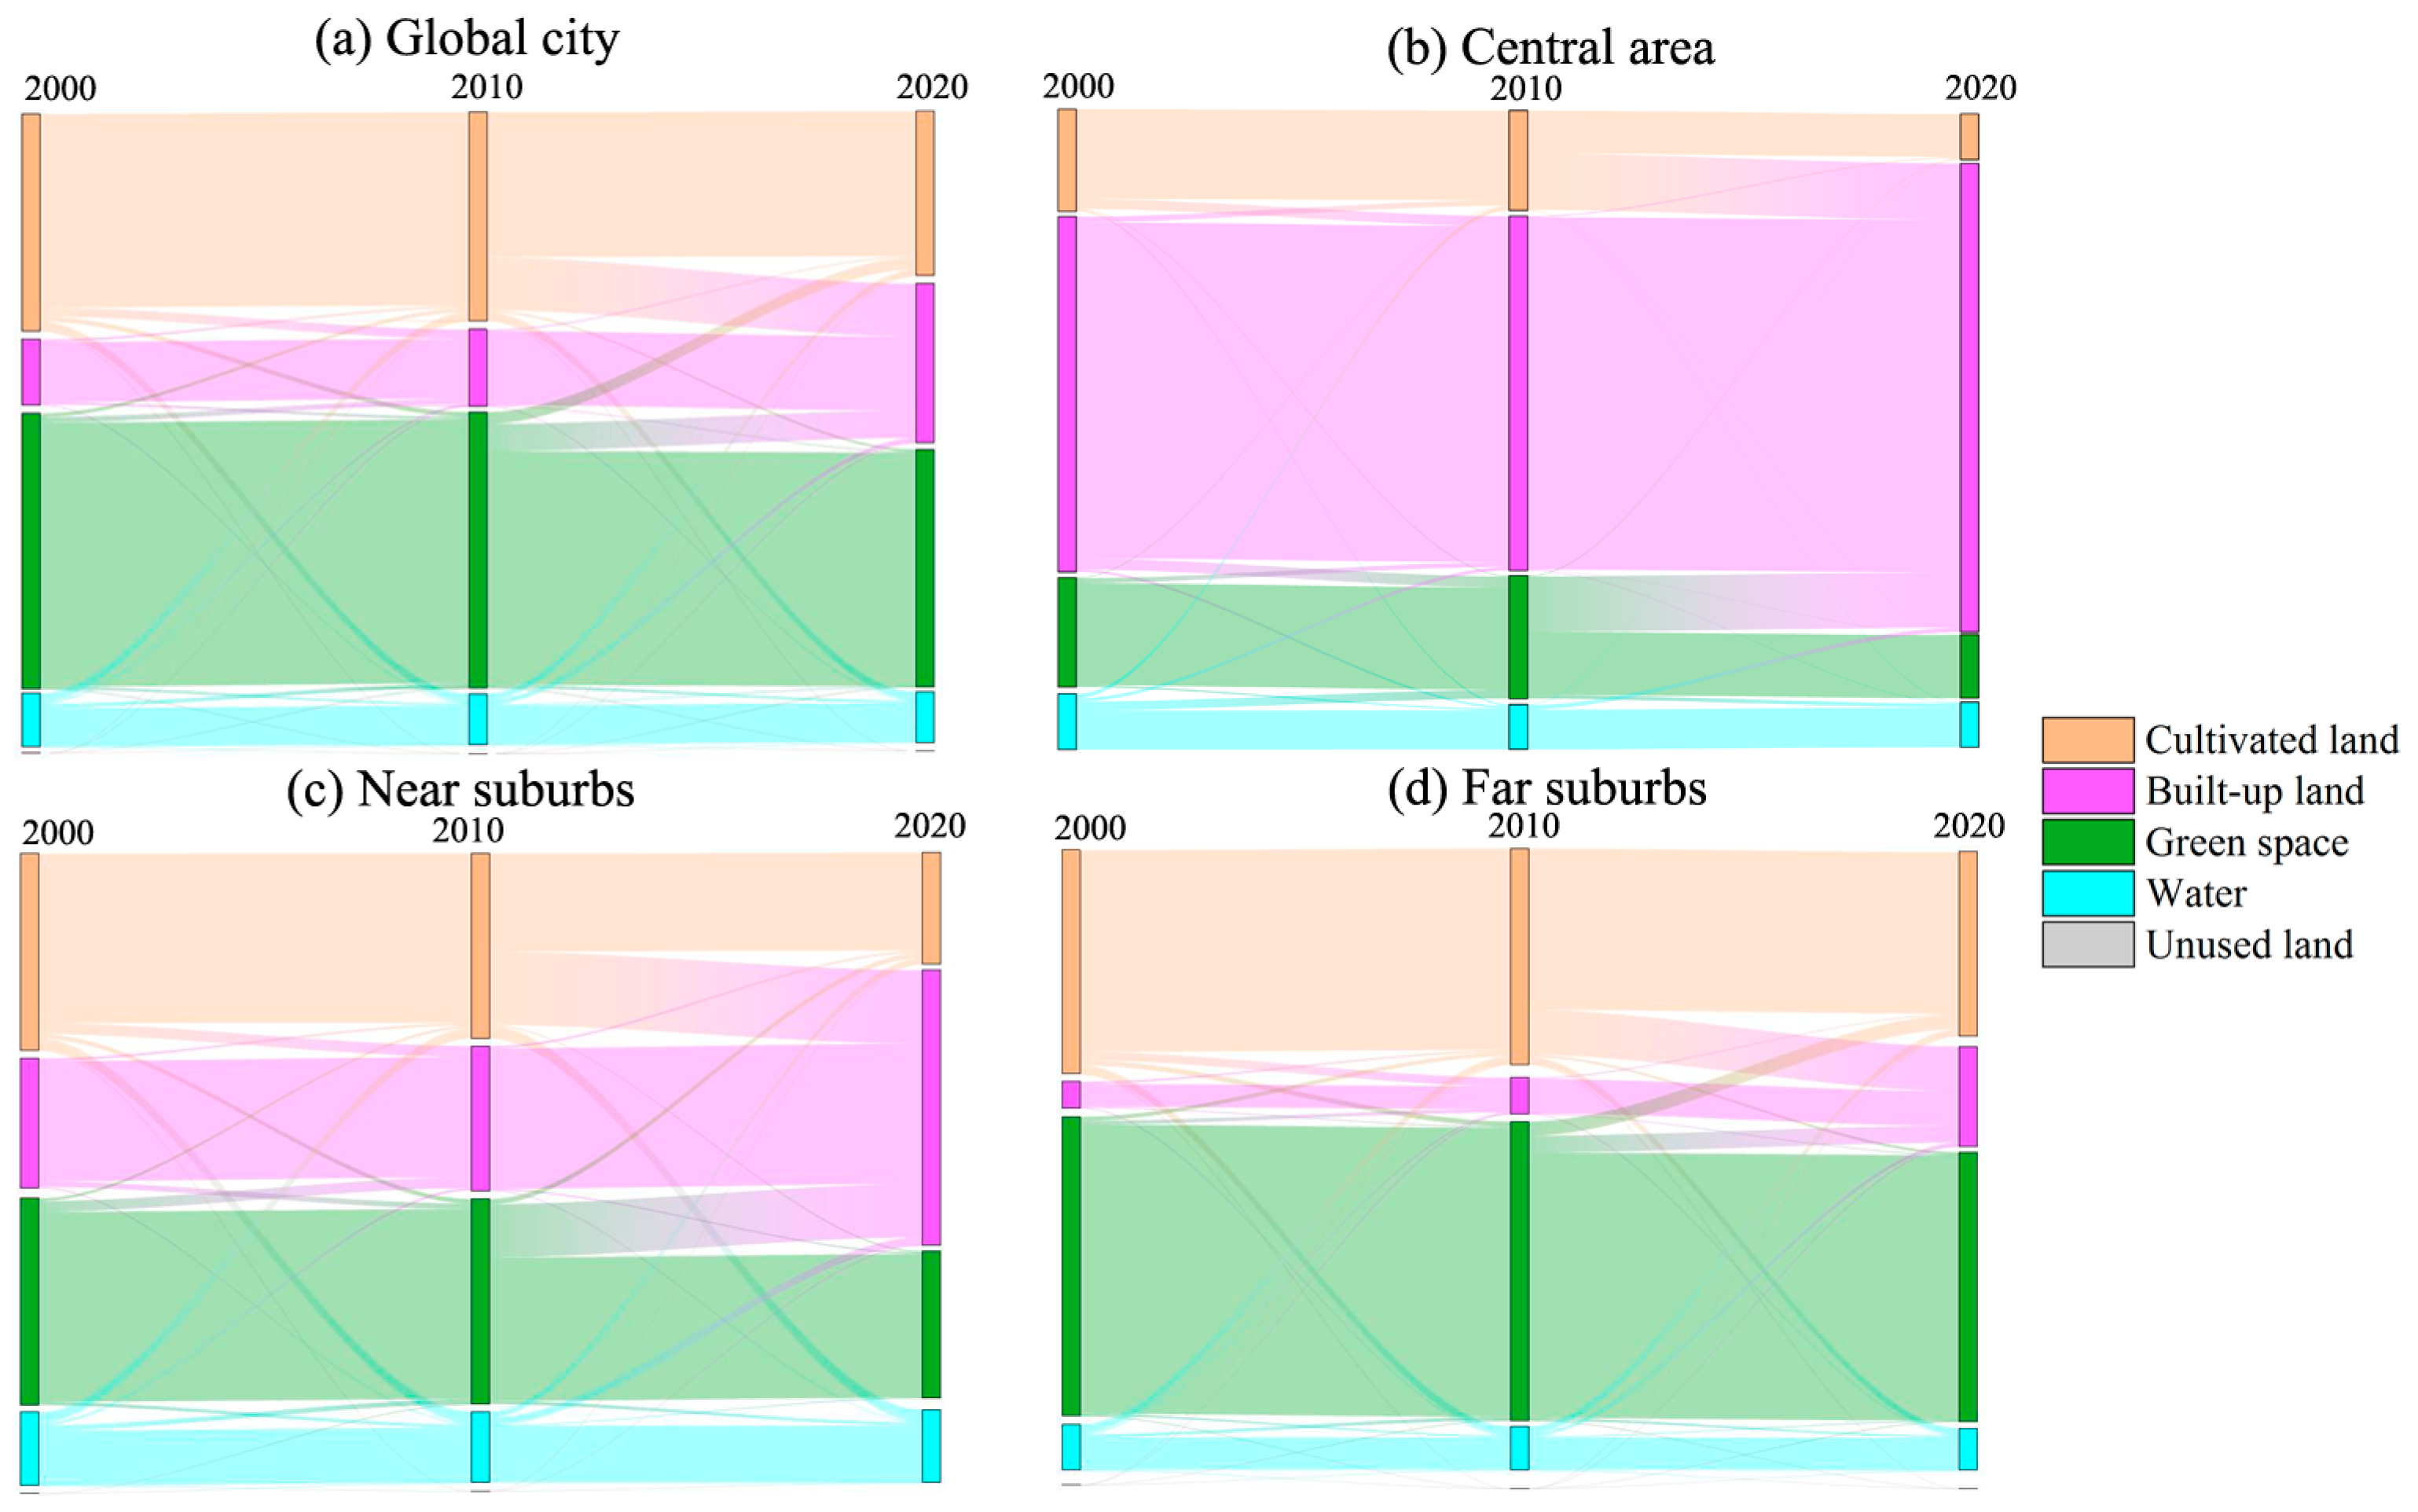
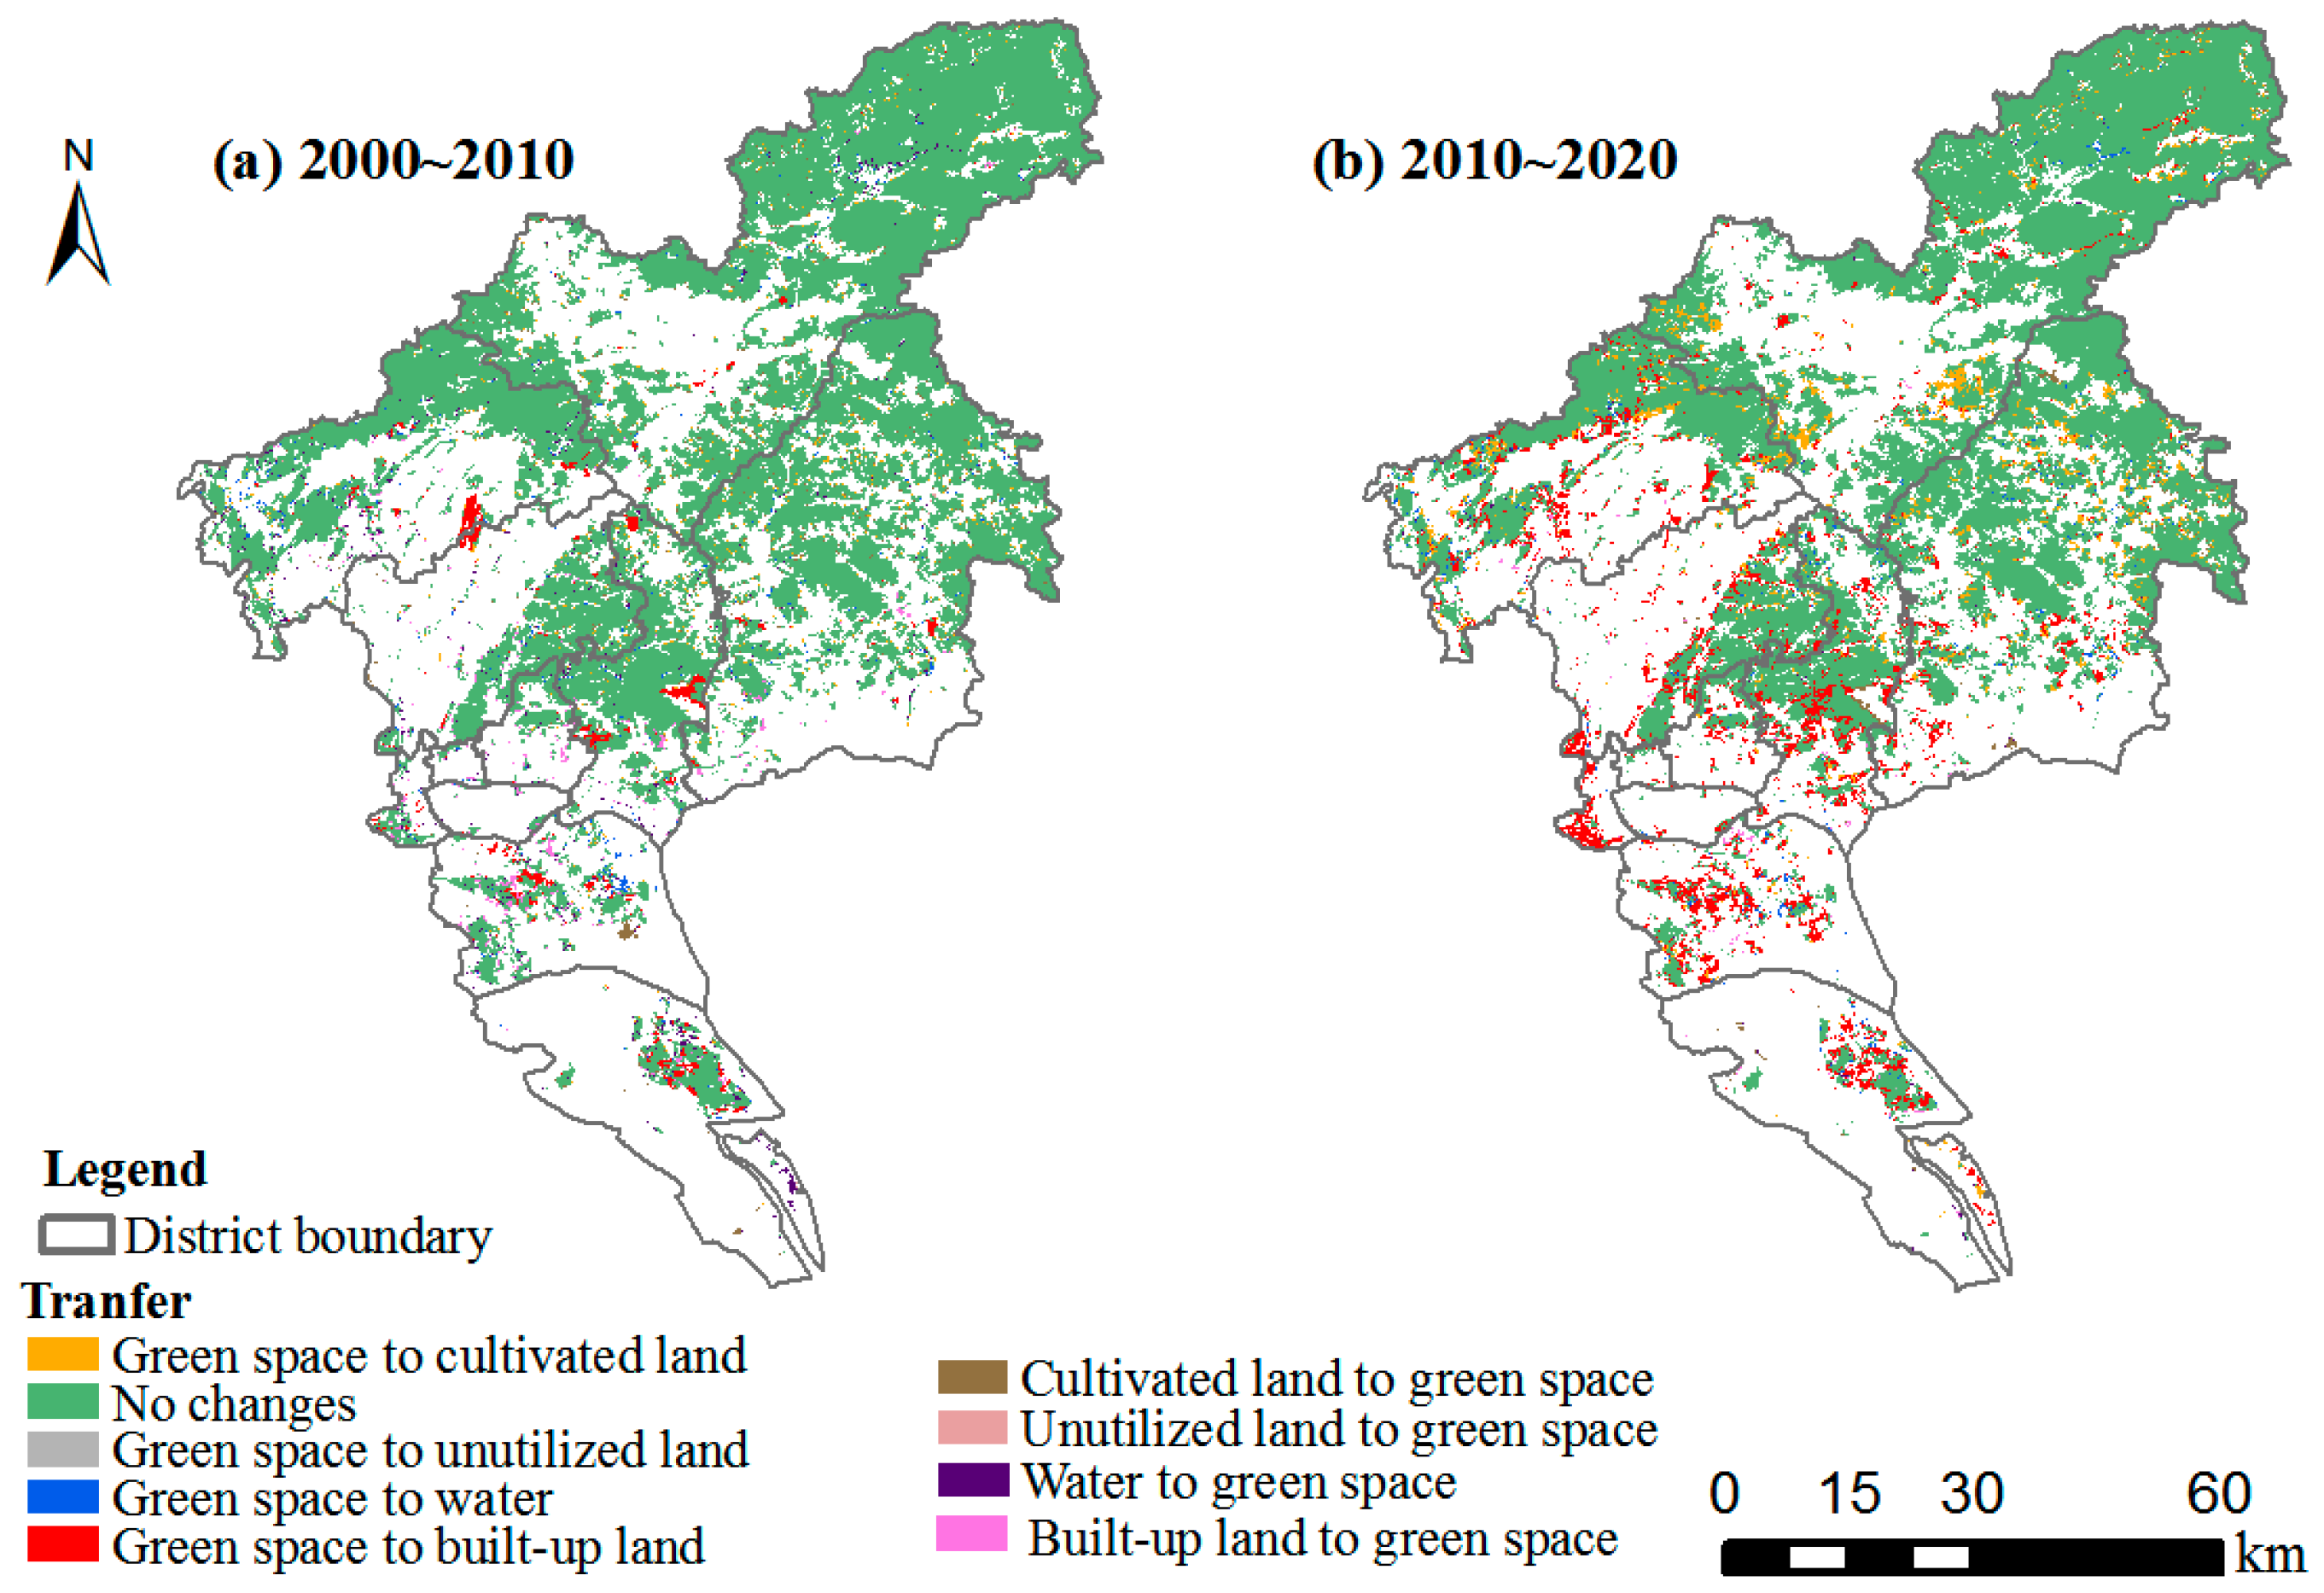
3.2. Green Space Transfer Change

The transfer direction and spatial distribution between urban green space and other land types are shown in Figure 5 and Figure 6, respectively. In the two periods of 2000–2010 and 2010–2020, the main change in green space in Guangzhou was that green space transferred to built-up land, and cultivated land transferred to green space. Among them, the phenomenon of green space being occupied by construction land was more apparent during the period of 2010–2020. It was mainly distributed in the southern region of Guangzhou. Additionally, the transfer of some cultivated land into green space was mainly distributed in the northern region.
A difference was noted in the transfer direction of green space between the central area and the suburbs. In the central area, the main change was the transfer between green space and built-up land. Some of the green space transferred to the built-up area, and then some of the built-up area transferred to the green space.
In the near suburbs, from 2000 to 2010, the main outflow of green space was to built-up land, and part of the built-up land, water bodies, and cultivated land flowed back into green space. From 2010 to 2020, the main outflow of green space was to built-up land, and part of built-up land and cultivated land flowed back into green space. The total area of green space decreased because the large outflow of green space to built-up land was not replenished in time.
In the far suburbs, from 2000 to 2010, green space flowed out to cultivated land and built-up land, and then part of cultivated land and water bodies flowed into green space, so the area of green space remained stable. From 2010 to 2020, green space flowed out to cultivated land and built-up land, and then a small part of cultivated land flowed into green space, so the area of green space decreased slightly.

3.3. Driving Factors of Green Space Change

3.3.1. Driving Factor Detection

The statistical table of q values (Table 4) shows that in the whole city, the change intensity of green space was mainly influenced by elevation, precipitation, and temperature from 2000 to 2010. From 2010 to 2020, in addition to topographic climate factors, the influence of built-up land expansion and changes in nighttime light became remarkable.
Green space changes in the central area were mainly influenced by built-up land expansion, precipitation, and population changes between 2000 and 2010. From 2010 to 2020, dominant factors were building land expansion and GDP growth. In the near suburbs, green space changes were weakly linked to related factors from 2000 to 2010 and later were mainly influenced by precipitation changes and elevation values. In the far suburbs, changes in green space were initially influenced by elevation and subsequently by economic factors.
Generally, changes in green space were influenced by a combination of topographic climate and socioeconomic development. Specifically, between 2010 and 2020, the expansion of construction land and GDP growth gradually had a substantial effect on green space changes in the central and far suburbs areas.

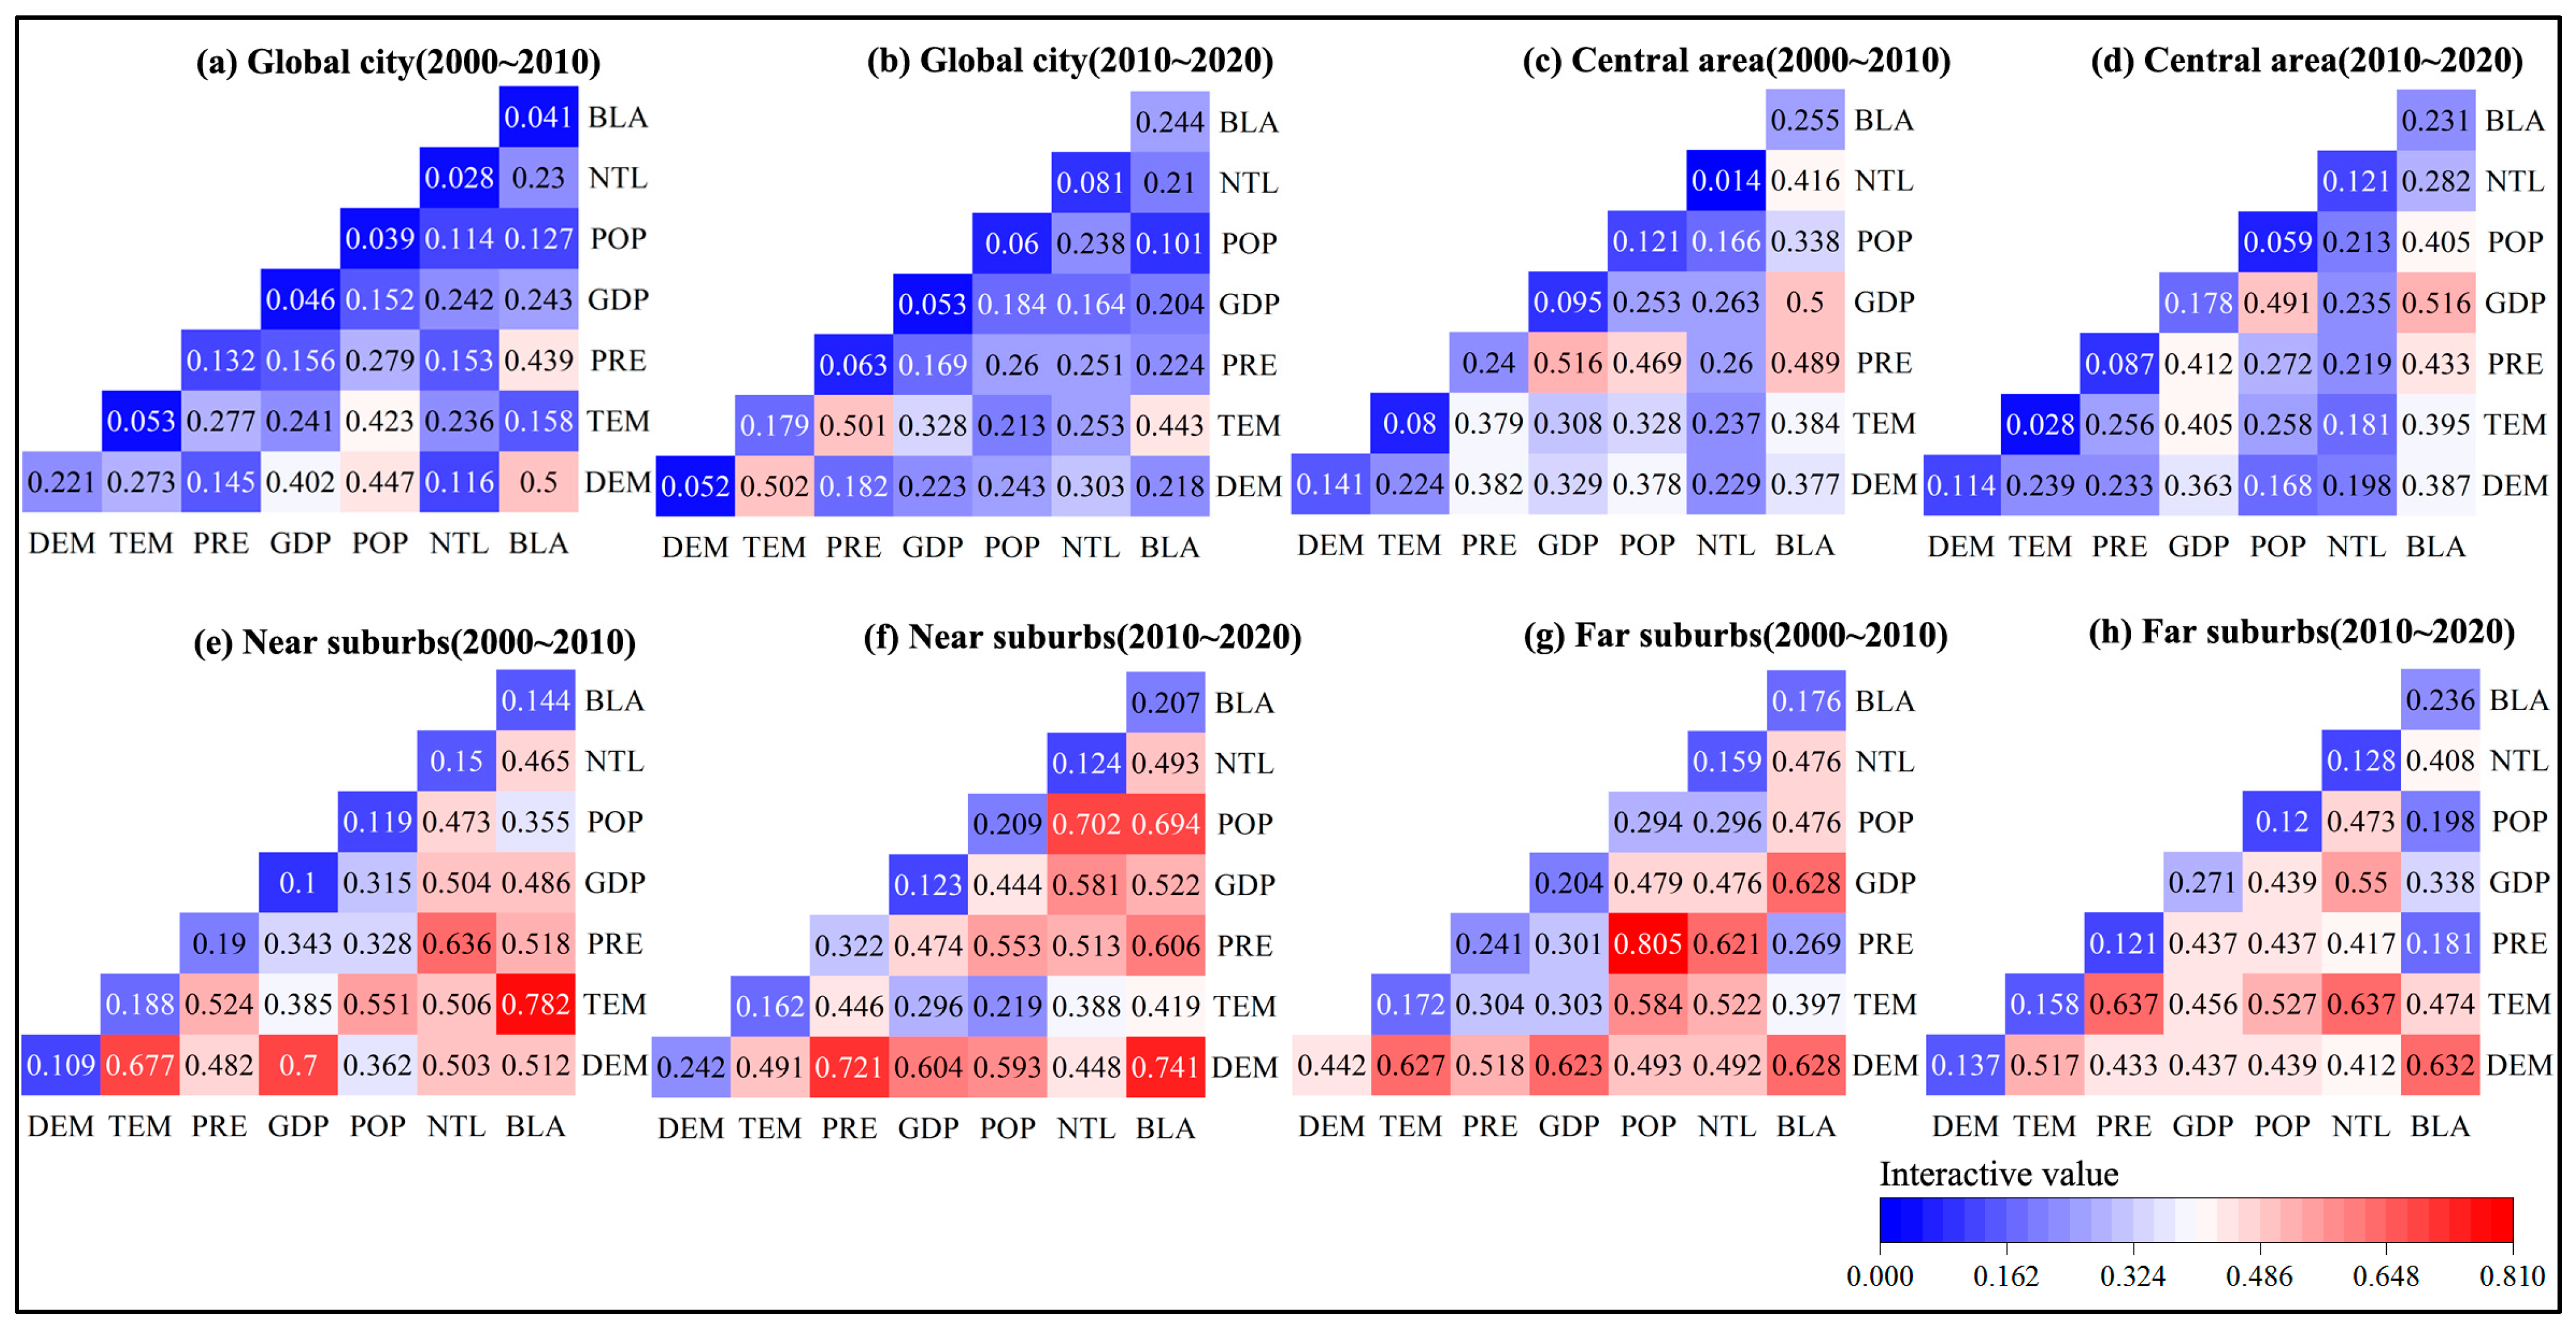
3.3.2. Interactive Detection

The results of the interaction analysis show that the explanatory power of most of the factor interactions was greater than that of a single factor, exhibiting two-factor enhancement and nonlinear enhancement (Figure 7). These findings suggest that changes in green space were jointly influenced by multiple factors.
In the whole city, from 2000 to 2010, the key interaction factors of green space change were DEM∩BLA, DEM∩POP, and PRE∩BLA, indicating that the interaction of population and building land expansion with topography had the greatest explanatory power for green space change. During 2010–2020, the key interactions were TEM∩DEM, TEM∩PRE, and TEM∩BLA, indicating that the interaction of climate and topography, as well as the interaction of temperature change and building land expansion, was more considerable in influencing green space change.
In the center area, from 2000 to 2010, the key interaction factors affecting the green space change were PRE∩GDP, GDP∩BLA, and PRE∩BLA, indicating that the interaction between precipitation and GDP and the interaction between GDP and the expansion of built-up land had a strong influence on the green space change. From 2010 to 2020, the interaction between socioeconomic factors became the dominant factor. The key interaction factors were GDP∩BLA and GDP∩POP.
In the near suburbs, from 2000 to 2010, the key interaction factors were TEM∩BLA, DEM∩GDP, DEM∩TEM, and PRE∩NTL, which indicated that the interaction between climatic terrain factors and socioeconomic factors greatly affected the green space changes. From 2010 to 2020, the main interaction factors were DEM∩BLA, DEM∩PRE, POP∩NTL, and POP∩BLA. Overall, the interaction between the expansion of building land and the climatic terrain factors was more evident.
In the far suburbs, the key interaction factors were PRE∩POP, BLA∩GDP, and BLA∩DEM for the period 2000 to 2010. From 2010 to 2020, the most important interactions were TEM∩PRE, TEM∩NTL, and DEM∩BLA. This outcome indicated that, in addition to the combined effect of temperature and precipitation, it was influenced by climate factors and the intensity of human activities. Overall, the effect of climate, topography, and socioeconomic factors on green space change was more pronounced in the near suburbs and the far suburbs than in the central area.

4. Discussion

This study focused on the regional heterogeneity of green space changes and the coupling mechanism of driving factors. First, the spatial and temporal change characteristics of green space patterns were analyzed using the land dynamic change intensity and landscape indicators. Then, the main transfer direction of green space in different regions was examined using the land transfer matrix. Finally, the geographic detector model was used to identify the main factors of different subregions and their interaction effects.

4.1. Regional Heterogeneity in the Change and Drivers of Green Space

The results show that the intensity of change in the area of green space was more pronounced in the central area than in the suburban and remote areas. The main reason for this is the concentration of population and high building density in the central area, and the conflict between the expansion of construction land and the protection of green space, which has led to the degradation or encroachment of part of the green space [44,45]. In terms of changes in landscape patterns, the temporal variation in AI values was not noticeable. The reason may lie in the fact that the green space was mainly contracted on the edge, and the green space structure did not change much, so the degree of aggregation and connectivity was more stable. In addition, the increasing fragmentation of green spaces in the near suburbs was of concern. As the urban core area was limited in size, outward expansion was mostly used to relieve land use pressure, making other land use types in periurban areas extremely vulnerable [46]. This outcome is also related to the city’s development policy: In 2000, Guangzhou’s “Overall Urban Development Strategic Plan” proposed for the first time the development strategy of “advancing to the east, expanding to the south, connecting to the west, and optimizing to the north [51]”. As a result, the built-up land in the east and south of Guangzhou has expanded remarkably over the past 20 years. The multicenter development structure made the green landscape at the edge of each region discrete and irregular [2]. For example, between 2010 and 2020, the conversion of green space into built-up land was mainly concentrated in the eastern part of Panyu, Huangpu, and Nansha districts.
Green space changes were driven by a combination of topographic, climate, and socioeconomic factors, and there are different mechanisms by which they affect green space within each subregion [52]. Existing studies show that socioeconomic determinants play an important role in the spatial and temporal changes in green space. For example, urban sprawl is the main reason for the decrease in urban green space [11,46]. The effect of GDP on green space is related to the economic growth mode and ecological policies in different study areas [16]. We also found the important role of socioeconomic factors, both in the city and in the central area. The difference was that from the factor detection results, in the near suburbs, the green space changes were mainly influenced by precipitation changes and elevation values from 2010 to 2020. In contrast, from the interaction detection results, the interaction between urban expansion and topography and climate there was obvious. Therefore, the influence of socioeconomic factors was spatially heterogeneous and their interaction with the natural environment had a greater effect on green space dynamics than single factors. Green space in the central area was mainly affected by the expansion of built-up land. Green space in the near suburbs was mainly influenced by rainfall and topographic factors in 2010–2020. In the far suburbs, the changes in green space were first influenced by topography and then gradually by GDP. Wu found that the dominant factors driving green space change relate to regional heterogeneity [13]. Our results are generally consistent with this, but it is worth noting the time variation in the influence of socioeconomic factors. In 2010–2020, the expansion of construction land and GDP growth gradually had a substantial effect on green space changes in the central and far suburbs areas. The main reason is that the central area has flat terrain, high building density, and green space, mostly in the form of parks and green space, which are less affected by natural climate. The main land use contradiction is the conflict between the lack of land resources and the protection of urban green spaces. Green spaces in the far suburbs are mostly in the form of forests, grasslands, shrublands, and natural vegetation, with topographical factors influencing their distribution and growth. In the later period of 2010–2020, as part of the population moved to the far suburbs and the economy developed rapidly, economic factors gradually became a crucial factor of the change in green space [53].
The direct explanatory power of individual factors was weaker than the explanatory power of factor interactions, implying that multiple factors collectively trigger variations in green space. Thus, green space transformation is a consequence of nature–socioeconomic interaction [54,55]. Natural factors such as temperature, precipitation, topography, etc., provide the basic guarantee for the growth of urban green space, while socioeconomic factors, such as the level of economic development, population distribution, and urban scale, affect the level of urban green space construction. For example, the green coverage rate grows faster in areas with good climatic conditions and higher GDP, while it may be slower in areas with good climate but lower GDP. This could be due to a lower green space construction level for the limited government investment. The green space in the central area was primarily affected by the combination of economic and built-up land expansion, indicating human activities were the primary cause of the green space changes there [56]. However, the near suburbs and far suburbs were mainly affected by the interaction of climatic terrain factors and socioeconomic factors due to more natural vegetation. Specifically, green spaces in the near suburbs were primarily affected by the expansion of built-up land interacting with topography and temperature. Additionally, green spaces in the far suburbs were influenced by climate factors and human activity intensity, in addition to the combined effects of temperature and precipitation. For instance, in 2000–2010, the dominant interaction factor was PRE∩POP, and in 2010–2020, the dominant interaction factors were TEM∩NTL and TEM∩PRE. With the increase in human activity intensity, the building density gradually increased and the land resources became scarce, which may lead to the conversion of some green spaces into built-up land. Nevertheless, the growth in socioeconomic activities did not invariably produce adverse effects. For instance, between 2010 and 2020, Wanhaisha Town and Hengli Town in Nansha district experienced a substantial growth in population as well as an increase in green space area. Along with GDP growth, Lanhe Town in Nansha district and Xiancun Town in Zengcheng district exhibited a rapid increase in the amount of green space. With the increase in GDP per capita, the public’s demand for green space for ecological services gradually increased. Moreover, government investment directly influenced the area of urban green space [47,57]. As the city’s scale and economic development level off, the quality of the urban environment is becoming a critical factor in attracting populations [47].

4.2. Application and Future Research Directions

In managing and optimizing urban green spaces, it is important to consider the mutually reinforcing effects of economic development, population movement, industrial structure, infrastructure, and the natural environment. To achieve this, subregional land use planning and management are recommended. At the city level, systematically considering the effects of topography, climatic factors, and development on green space changes is advisable. In the central region, focusing on the interrelation between socioeconomic aspects and the optimization of land utilization arrangement is advisable. Due to limited space for urban spatial expansion, the quality of green space services can be improved by increasing public investment.
In the near suburbs, considering the effect of topography and climate on the expansion of construction land, optimizing land use structure, and preventing urban sprawl are crucial. Green resources can be integrated to create a network of green recreational spaces with the main parks in the central area, which can help alleviate the issue of insufficient green space in that area. Moreover, the government can increase investment to improve the quality and quantity of green space.
In the far suburbs, attention must be paid to the comprehensive influence of climatic factors and the intensity of human activities on the change of green space to improve the utilization of the ecological barrier function of regional green space, such as the feedback effect of the heat island effect on the growth of vegetation caused by the increase in urban temperature. Moreover, stimulating the synergy of multiple factors is necessary to enhance the transformation and utilization of green resources [32]. This approach will improve GDP and increase attractiveness to the population, and realize the sustainable, coordinated development of the urban environment and economic development.
Because this paper primarily explores the driving mechanisms of quantitative natural environmental and socioeconomic factors, the effects of greening policies in each subregion were not extensively examined. To gain a more comprehensive understanding of green space change, further research is necessary in the future.

5. Conclusions

Urban green space can improve the urban ecological environment and maintain the health of urban residents. However, the protection and optimization of these spaces are under severe pressure and challenge due to the increasing demand for land resulting from rapid urbanization and continuous population growth. Therefore, the spatial and temporal change in green space and related driving factors needs be examined to protect and enhance the existing urban green space.
This paper analyzed the spatial change pattern of green space in Guangzhou at four scales, namely, global city, central area, near suburbs, and far suburbs, based on the perspective of zoning, and explored the effects and interactions of natural and socioeconomic factors on the change in green space in different regions with the help of a geodetic detector model. The results showed that from 2000 to 2020, the intensity of green space change in the central area was more apparent than that in the suburban areas. In terms of landscape pattern change, the intensification of green space fragmentation in the near suburbs area needed to be considered. In terms of the transfer direction, green space mainly flowed out to built-up land, and its transfer direction varied in different subzones. Second, the intensity of green space change was influenced by the combination of topography, climate, and socioeconomic development. Especially in 2010–2020, the expansion of built-up land and GDP growth gradually had a substantial effect on green space changes in the central and far suburban areas. Third, the interaction of natural, social, and economic factors drove green space changes. The explanatory power of most factor interactions was greater than the direct explanatory power of individual factors. The driving mechanism of the interactions varied in different subareas. Specifically, green space in the central area was mainly influenced by the interaction of economic and construction land expansion, indicating that human activities dominated green space changes in the central area. The near suburbs area was mainly affected by the interaction of built-up land expansion and topographic climate. The far suburbs were affected by not only the combination of temperature and precipitation but also climatic factors and the intensity of human activities. Based on the spatial distribution characteristics of urban green space and its driving mechanism, the central area needs focus on improving the quality and optimizing the landscape pattern in case of shortage of green space resources. Periurban areas need to optimize the land use structure, control the uncontrolled expansion of construction land, and improve the quality while increasing the area of green space. The far suburbs need to focus on the transformation and utilization of green resources to enhance the attractiveness for external population and increase the GDP to achieve green, high-quality development.
This study analyzed the dynamic characteristics and factors of green space in different districts, which helps systematically reveal the regional heterogeneity of urban green space changes and driving mechanisms. The relevant conclusions can support subdivision management and planning of urban green space systems. The results suggested that researchers and managers in similar cities or regions need to consider the regional heterogeneity of green space changes, and then formulate green space management policies according to local conditions. In addition, the geodetector used in this study not only has no linear assumptions but also can detect interactions; thus, it can reveal the complex influence mechanisms of independent variables on dependent variables. It can provide methodological support for the comparative study of green space change mechanisms in different zones. However, the geodetector is not yet able to quantify the explanatory power of the drivers at specific locations. Therefore, it is necessary to combine the geographically weighted regression model to further analyze the spatial heterogeneity characterizing the driving mechanisms.

Author Contributions

Conceptualization, H.W.; methodology, H.W., C.L. and X.W.; software, H.W. and C.L.; formal analysis, H.W.; data curation, H.W., S.O. and Q.F.; writing—original draft preparation, H.W.; writing—review and editing, H.W.; visualization, H.W., C.L., K.G. and J.X. All authors have read and agreed to the published version of the manuscript.

Funding

This research was funded by the Guangdong Philosophy and Social Science Planning 2023 Annual Discipline Co-construction Project (GD23XGL127), Guangzhou Philosophy and Social Science Planning 2022 Annual Project (2022GZQN18), Guangdong General University Young Innovative Talents Project (2022WQNCX028), Guangdong Students’ Innovation and Entrepreneurship Training Program Project (S202311347011), Higher Education Teaching Reform Project of Zhongkai College of Agricultural Engineering (KA220160198), and the National Natural Science Fund Project of China (52168010).

Data Availability Statement

The data presented in this study are available upon reasonable request from the corresponding author. The data are not publicly available due to privacy restrictions.

Conflicts of Interest

The authors declare no conflicts of interest.

References

  1. Lin, J.; Qiu, S.; Tan, X.; Zhuang, Y. Measuring the Relationship between Morphological Spatial Pattern of Green Space and Urban Heat Island Using Machine Learning Methods. Build. Environ. 2023, 228, 109910. [Google Scholar] [CrossRef]
  2. Xu, J.; Zhao, Y.; Sun, C.; Liang, H.; Yang, J.; Zhong, K.; Li, Y.; Liu, X. Exploring the Variation Trend of Urban Expansion, Land Surface Temperature, and Ecological Quality and Their Interrelationships in Guangzhou, China, from 1987 to 2019. Remote Sens. 2021, 13, 1019. [Google Scholar] [CrossRef]
  3. Hu, Y.; Zhang, Y. Spatial–Temporal Dynamics and Driving Factor Analysis of Urban Ecological Land in Zhuhai City, China. Sci. Rep. 2020, 10, 16174. [Google Scholar] [CrossRef] [PubMed]
  4. Collins, R.M.; Spake, R.; Brown, K.A.; Ogutu, B.O.; Smith, D.; Eigenbrod, F. A Systematic Map of Research Exploring the Effect of Greenspace on Mental Health. Landsc. Urban Plan. 2020, 201, 103823. [Google Scholar] [CrossRef]
  5. Houlden, V.; de Albuquerque, J.P.; Weich, S.; Jarvis, S. A Spatial Analysis of Proximate Greenspace and Mental Wellbeing in London. Appl. Geogr. 2019, 109, 102036. [Google Scholar] [CrossRef]
  6. Kajosaari, A.; Hasanzadeh, K.; Fagerholm, N.; Nummi, P.; Kuusisto-Hjort, P.; Kyttä, M. Predicting Context-Sensitive Urban Green Space Quality to Support Urban Green Infrastructure Planning. Landsc. Urban Plan. 2024, 242, 104952. [Google Scholar] [CrossRef]
  7. Stasi, R.; Ruggiero, F.; Berardi, U. Influence of Cross-Ventilation Cooling Potential on Thermal Comfort in High-Rise Buildings in a Hot and Humid Climate. Build. Environ. 2023, 248, 111096. [Google Scholar] [CrossRef]
  8. Hu, T.; Peng, J.; Liu, Y.; Wu, J.; Li, W.; Zhou, B. Evidence of Green Space Sparing to Ecosystem Service Improvement in Urban Regions: A Case Study of China’s Ecological Red Line Policy. J. Clean. Prod. 2020, 251, 119678. [Google Scholar] [CrossRef]
  9. Wu, Z.; Chen, R.; Meadows, M.E.; Sengupta, D.; Xu, D. Changing Urban Green Spaces in Shanghai: Trends, Drivers and Policy Implications. Land Use Policy 2019, 87, 104080. [Google Scholar] [CrossRef]
  10. Jaworek-Jakubska, J.; Filipiak, M.; Michalski, A.; Napierała-Filipiak, A. Spatio-Temporal Changes of Urban Forests and Planning Evolution in a Highly Dynamical Urban Area: The Case Study of Wrocław, Poland. Forests 2020, 11, 17. [Google Scholar] [CrossRef]
  11. Qian, Y.; Zhou, W.; Li, W.; Han, L. Understanding the Dynamic of Greenspace in the Urbanized Area of Beijing Based on High Resolution Satellite Images. Urban For. Urban Green. 2015, 14, 39–47. [Google Scholar] [CrossRef]
  12. Yang, Z.; Fang, C.; Mu, X.; Li, G.; Xu, G. Urban Green Space Quality in China: Quality Measurement, Spatial Heterogeneity Pattern and Influencing Factor. Urban For. Urban Green. 2021, 66, 127381. [Google Scholar] [CrossRef]
  13. Wu, W.-B.; Ma, J.; Meadows, M.E.; Banzhaf, E.; Huang, T.-Y.; Liu, Y.-F.; Zhao, B. Spatio-Temporal Changes in Urban Green Space in 107 Chinese Cities (1990–2019): The Role of Economic Drivers and Policy. Int. J. Appl. Earth Obs. Geoinf. 2021, 103, 102525. [Google Scholar] [CrossRef]
  14. Xu, Z.; Zhang, Z.; Li, C. Exploring Urban Green Spaces in China: Spatial Patterns, Driving Factors and Policy Implications. Land Use Policy 2019, 89, 104249. [Google Scholar] [CrossRef]
  15. Liu, H.; Jiao, F.; Yin, J.; Li, T.; Gong, H.; Wang, Z.; Lin, Z. Nonlinear Relationship of Vegetation Greening with Nature and Human Factors and Its Forecast—A Case Study of Southwest China. Ecol. Indic. 2020, 111, 106009. [Google Scholar] [CrossRef]
  16. Liu, W.; Li, H.; Xu, H.; Zhang, X.; Xie, Y. Spatiotemporal Distribution and Driving Factors of Regional Green Spaces during Rapid Urbanization in Nanjing Metropolitan Area, China. Ecol. Indic. 2023, 148, 110058. [Google Scholar] [CrossRef]
  17. Tao, J.; Xu, T.; Dong, J.; Yu, X.; Jiang, Y.; Zhang, Y.; Huang, K.; Zhu, J.; Dong, J.; Xu, Y.; et al. Elevation-Dependent Effects of Climate Change on Vegetation Greenness in the High Mountains of Southwest China during 1982–2013. Int. J. Climatol. 2018, 38, 2029–2038. [Google Scholar] [CrossRef]
  18. Yang, G.; Jialin, L.; Ruiqing, L.; Zhongyi, W.; Haifeng, W.; Yongqiang, L. Temporal and Spatial Evolution of Greenspace System and Evaluation of Ecosystem Services in the Core Area of the Yangtze River Delta. Chin. J. Ecol. 2020, 39, 956. [Google Scholar]
  19. Wang, J.; Zhang, Y.; Zhang, X.; Song, M.; Ye, J. The Spatio-Temporal Trends of Urban Green Space and Its Interactions with Urban Growth: Evidence from the Yangtze River Delta Region, China. Land Use Policy 2023, 128, 106598. [Google Scholar] [CrossRef]
  20. Hu, M.; Xia, B. A Significant Increase in the Normalized Difference Vegetation Index during the Rapid Economic Development in the Pearl River Delta of China. Land Degrad. Dev. 2019, 30, 359–370. [Google Scholar] [CrossRef]
  21. Yang, J.; Huang, C.; Zhang, Z.; Wang, L. The Temporal Trend of Urban Green Coverage in Major Chinese Cities between 1990 and 2010. Urban For. Urban Green. 2014, 13, 19–27. [Google Scholar] [CrossRef]
  22. Li, Y.; Zhang, X.; Xia, C. Towards a Greening City: How Does Regional Cooperation Promote Urban Green Space in the Guangdong-Hong Kong-Macau Greater Bay Area? Urban For. Urban Green. 2023, 86, 128033. [Google Scholar] [CrossRef]
  23. Garcia-Garcia, M.J.; Christien, L.; García-Escalona, E.; González-García, C. Sensitivity of Green Spaces to the Process of Urban Planning. Three Case Studies of Madrid (Spain). Cities 2020, 100, 102655. [Google Scholar] [CrossRef]
  24. Zhu, Z.; Li, J.; Chen, Z. Green Space Equity: Spatial Distribution of Urban Green Spaces and Correlation with Urbanization in Xiamen, China. Environ. Dev. Sustain. 2023, 25, 423–443. [Google Scholar] [CrossRef]
  25. You, H. Characterizing the Inequalities in Urban Public Green Space Provision in Shenzhen, China. Habitat Int. 2016, 56, 176–180. [Google Scholar] [CrossRef]
  26. Li, W.; Dai, F.; Diehl, J.A.; Chen, M.; Bai, J. Exploring the Spatial Pattern of Community Urban Green Spaces and COVID-19 Risk in Wuhan Based on a Random Forest Model. Heliyon 2023, 9, e19773. [Google Scholar] [CrossRef]
  27. Zheng, X.; Zhu, M.; Shi, Y.; Pei, H.; Nie, W.; Nan, X.; Zhu, X.; Yang, G.; Bao, Z. Equity Analysis of the Green Space Allocation in China’s Eight Urban Agglomerations Based on the Theil Index and GeoDetector. Land 2023, 12, 795. [Google Scholar] [CrossRef]
  28. Yang, C.; Li, R.; Sha, Z. Exploring the Dynamics of Urban Greenness Space and Their Driving Factors Using Geographically Weighted Regression: A Case Study in Wuhan Metropolis, China. Land 2020, 9, 500. [Google Scholar] [CrossRef]
  29. Wang, J.; Xu, C. Geodetector: Principle and prospective. Acta Geogr. Sin. 2017, 72, 116–134. [Google Scholar]
  30. Guo, L.; Xi, X.; Yang, W.; Liang, L. Monitoring Land Use/Cover Change Using Remotely Sensed Data in Guangzhou of China. Sustainability 2021, 13, 2944. [Google Scholar] [CrossRef]
  31. Lin, Y.; Chen, H.; Yang, J.; Huang, H.; Lin, X. Research on the spatial correlation between the high-quality basic education resources and housing prices to pursuing a balanced development: A case study of Guangzhou. World Reg. Stud. 2022, 1–11. [Google Scholar]
  32. Deng, Q.; Xue, D.; Gong, J. Influencing factors of online shopping frequency of residents and spatial differences of these factors in Guangzhou City. Sci. Geogr. Sin. 2020, 40, 928–938. [Google Scholar] [CrossRef]
  33. Wu, S.; Wang, D.; Yan, Z.; Wang, X.; Han, J. Spatiotemporal Dynamics of Urban Green Space in Changchun: Changes, Transformations, Landscape Patterns, and Drivers. Ecol. Indic. 2023, 147, 109958. [Google Scholar] [CrossRef]
  34. Jianshe, X.; Bin, Q.; Guoqian, C.; Feifei, S.; Xiaoyun, C.; Cunxiong, Z. Land Use Change and Evolution of Ecosystem Service Value in Maduo County of Source Region of the Yellow River. Acta Ecol. Sin. 2020, 40, 510–521. [Google Scholar]
  35. Zhao, F.; Li, H.; Li, C.; Cai, Y.; Wang, X.; Liu, Q. Analyzing the Influence of Landscape Pattern Change on Ecological Water Requirements in an Arid/Semiarid Region of China. J. Hydrol. 2019, 578, 124098. [Google Scholar] [CrossRef]
  36. Ding, N.; Zhang, Y.; Wang, Y.; Chen, L.; Qin, K.; Yang, X. Effect of Landscape Pattern of Urban Surface Evapotranspiration on Land Surface Temperature. Urban Clim. 2023, 49, 101540. [Google Scholar] [CrossRef]
  37. Wen, D.; Liu, M.; Yu, Z. Quantifying Ecological Landscape Quality of Urban Street by Open Street View Images: A Case Study of Xiamen Island, China. Remote Sens. 2022, 14, 3360. [Google Scholar] [CrossRef]
  38. He, N.; Guo, W.; Wang, H.; Yu, L.; Cheng, S.; Huang, L.; Jiao, X.; Chen, W.; Zhou, H. Temporal and Spatial Variations in Landscape Habitat Quality under Multiple Land-Use/Land-Cover Scenarios Based on the PLUS-InVEST Model in the Yangtze River Basin, China. Land 2023, 12, 1338. [Google Scholar] [CrossRef]
  39. Wang, H.; Xu, Y.; Wei, X. Rural Resilience Evaluation and Influencing Factor Analysis Based on Geographical Detector Method and Multiscale Geographically Weighted Regression. Land 2023, 12, 1270. [Google Scholar] [CrossRef]
  40. Zhang, Y.; Zhang, L.; Wang, J.; Dong, G.; Wei, Y. Quantitative Analysis of NDVI Driving Factors Based on the Geographical Detector Model in the Chengdu-Chongqing Region, China. Ecol. Indic. 2023, 155, 110978. [Google Scholar] [CrossRef]
  41. Nor, A.N.M.; Corstanje, R.; Harris, J.A.; Brewer, T. Impact of Rapid Urban Expansion on Green Space Structure. Ecol. Indic. 2017, 81, 274–284. [Google Scholar] [CrossRef]
  42. Song, Y.; Wang, J.; Ge, Y.; Xu, C. An Optimal Parameters-Based Geographical Detector Model Enhances Geographic Characteristics of Explanatory Variables for Spatial Heterogeneity Analysis: Cases with Different Types of Spatial Data. GIScience Remote Sens. 2020, 57, 593–610. [Google Scholar] [CrossRef]
  43. Soltanifard, H.; Roshandel, T.; Ghodrati, S. Assessment and Ranking of Influencing Factors in the Relationship between Spatial Patterns of Urban Green Spaces and Socioeconomic Indices in Mashhad Urban Districts, Iran. Model. Earth Syst. Environ. 2020, 6, 1589–1605. [Google Scholar] [CrossRef]
  44. Liu, S.; Zhang, X.; Feng, Y.; Xie, H.; Jiang, L.; Lei, Z. Spatiotemporal Dynamics of Urban Green Space Influenced by Rapid Urbanization and Land Use Policies in Shanghai. Forests 2021, 12, 476. [Google Scholar] [CrossRef]
  45. Spyra, M.; Kleemann, J.; Calò, N.C.; Schürmann, A.; Fürst, C. Protection of Peri-Urban Open Spaces at the Level of Regional Policy-Making: Examples from Six European Regions. Land Use Policy 2021, 107, 105480. [Google Scholar] [CrossRef]
  46. Li, F.; Zheng, W.; Wang, Y.; Liang, J.; Xie, S.; Guo, S.; Li, X.; Yu, C. Urban Green Space Fragmentation and Urbanization: A Spatiotemporal Perspective. Forests 2019, 10, 333. [Google Scholar] [CrossRef]
  47. Chen, C.; Bi, L.; Zhu, K. Study on Spatial-Temporal Change of Urban Green Space in Yangtze River Economic Belt and Its Driving Mechanism. Int. J. Environ. Res. Public Health 2021, 18, 12498. [Google Scholar] [CrossRef]
  48. Richards, D.R.; Passy, P.; Oh, R.R.Y. Impacts of Population Density and Wealth on the Quantity and Structure of Urban Green Space in Tropical Southeast Asia. Landsc. Urban Plan. 2017, 157, 553–560. [Google Scholar] [CrossRef]
  49. Zhou, Y.; Lu, Y. Spatiotemporal Evolution and Determinants of Urban Land Use Efficiency under Green Development Orientation: Insights from 284 Cities and Eight Economic Zones in China, 2005–2019. Appl. Geogr. 2023, 161, 103117. [Google Scholar] [CrossRef]
  50. Wang, Z.; Wang, X.; Xie, X.; Xiao, M.; Wu, Y.; Liu, X. Evolution of Landscape Pattern of Green Space in Fujian Province: Influencing Factors and Spatial Differences Based on GWR Model. J. Northwest For. Univ. 2022, 37, 242–250. [Google Scholar]
  51. Liu, G.; Li, J.; Nie, P. Tracking the History of Urban Expansion in Guangzhou (China) during 1665–2017: Evidence from Historical Maps and Remote Sensing Images. Land Use Policy 2022, 112, 105773. [Google Scholar] [CrossRef]
  52. Guo, H.; Sun, Y.; Wang, Q.; Wang, X.; Zhang, L. Construction of Greenspace Landscape Ecological Network Based on Resistance Analysis of GeoDetector in Jinan. Stoch. Environ. Res. Risk Assess. 2023, 37, 651–663. [Google Scholar] [CrossRef]
  53. Feng, R.; Wang, F.; Wang, K. Spatial-Temporal Patterns and Influencing Factors of Ecological Land Degradation-Restoration in Guangdong-Hong Kong-Macao Greater Bay Area. Sci. Total Environ. 2021, 794, 148671. [Google Scholar] [CrossRef]
  54. Gao, M.; Li, C. Law and Mechanism of Spatio-Temporal Evolution of Urban Greenspace in the Lower Reaches of the Yellow River. J. Beijing For. Univ. 2023, 45, 113–126. [Google Scholar]
  55. Yang, Y.; Ma, J.; Liu, H.; Song, L.; Cao, W.; Ren, Y. Spatial Heterogeneity Analysis of Urban Forest Ecosystem Services in Zhengzhou City. PLoS ONE 2023, 18, e0286800. [Google Scholar] [CrossRef] [PubMed]
  56. Wang, Y.; Zhang, Z.; Chen, X. Quantifying Influences of Natural and Anthropogenic Factors on Vegetation Changes Based on Geodetector: A Case Study in the Poyang Lake Basin, China. Remote Sens. 2021, 13, 5081. [Google Scholar] [CrossRef]
  57. Wilkerson, M.L.; Mitchell, M.G.; Shanahan, D.; Wilson, K.A.; Ives, C.D.; Lovelock, C.E.; Rhodes, J.R. The Role of Socio-Economic Factors in Planning and Managing Urban Ecosystem Services. Ecosyst. Serv. 2018, 31, 102–110. [Google Scholar] [CrossRef]
Figure 1. Scope of the study area.
Forests 15 00135 g001
Figure 2. Land cover distribution in Guangzhou City from 2000 to 2020.
Forests 15 00135 g002
Figure 3. Dynamics intensity of urban green space in Guangzhou from 2000 to 2020.
Forests 15 00135 g003
Figure 4. Statistics on green space landscape metrics in Guangzhou subregions.
Forests 15 00135 g004
Figure 5. Green space transfers in Guangzhou from 2000 to 2020.
Forests 15 00135 g005
Figure 6. Shifting direction of green space in different periods.
Forests 15 00135 g006
Figure 7. Interactive detection statistics.
Forests 15 00135 g007
Table 1. Display of the land use transfer matrix.
A1A2Aj
A1S11S12S1j
A2S12S22S2j
AiSi1Si2Sij
Table 2. Influence factors associated with green space landscapes.
VariableDimensionSubcategoryIndicatorAbbreviationReference
Dependent variableDynamics intensity of green space changeY
Economic developmentGDPGDP[16,33]
Independent variableSocial and economicUrban expansionBuilt-up land areaBLA[33,48]
Human activity intensityPopulation densityPOD[33,43]
Nighttime lightNTL[46,49]
Nature and environmentClimaticAverage annual
temperature
TEM[50]
Annual precipitationPRE
TopographyDEMDEM[50]
Table 3. Statistics of green space change in zoning.
IndicatorUGS Area (km2)UGS Area Change Intensity (%)
2000201020202000–20102010–2020
Central area57.002 64.052 33.090 1.237 −4.834
Near suburbs567.926 563.409 403.512 −0.080 −2.838
Far suburbs2616.733 2616.862 2357.744 0.000 −0.990
Table 4. Statistics of q-values of driving factors.
Global CityCentral AreaNear SuburbsFar Suburbs
2000–20102010–20202000–20102010–20202000–20102010–20202000–20102010–2020
qpqpqpqpqpqpqpqp
TEM0.053 * 0.064 0.179 *** 0.001 0.080 0.463 0.028 0.927 0.188 0.183 0.162 0.272 0.172 0.224 0.158 0.525
PRE0.132 *** 0.006 0.063 ** 0.034 0.240 *** 0.009 0.087 0.399 0.190 0.166 0.322 ** 0.016 0.241 0.277 0.121 0.690
GDP0.046 0.284 0.053 0.190 0.095 0.351 0.178 ** 0.031 0.100 0.550 0.123 0.198 0.204 0.243 0.271 * 0.098
POP0.039 0.309 0.060 0.164 0.121 * 0.065 0.059 0.367 0.119 0.438 0.209 0.124 0.294 0.184 0.120 0.430
NTL0.028 0.350 0.081 ** 0.032 0.014 0.987 0.121 0.489 0.150 0.201 0.124 0.420 0.159 0.541 0.128 0.535
BLA0.041 0.321 0.244 *** 0.000 0.255 *** 0.001 0.231 *** 0.009 0.144 0.222 0.207 0.142 0.176 0.455 0.236 0.324
DEM0.221 *** 0.000 0.052 0.201 0.141 0.140 0.114 0.300 0.109 0.368 0.242 ** 0.019 0.442 ** 0.014 0.137 0.475
Abbreviations: * p-value < 0.1; ** p-value < 0.05; *** p-value < 0.01.
Disclaimer/Publisher’s Note: The statements, opinions and data contained in all publications are solely those of the individual author(s) and contributor(s) and not of MDPI and/or the editor(s). MDPI and/or the editor(s) disclaim responsibility for any injury to people or property resulting from any ideas, methods, instructions or products referred to in the content.

