Article

Harmonization Approach to Spatial and Social Techniques to Define Landscape Restoration Areas in a Colombian Andes Complex Landscape

by
Carlos Barrera-Causil
1,* and
Jose González-Montañez
2
1
Davinci Research Group, Facultad de Ciencias Exactas y Aplicadas, Instituto Tecnológico Metropolitano, Medellín 050034, Colombia
2
South Pole Carbon Asset Management SAS, Medellín 050021, Colombia
*
Author to whom correspondence should be addressed.
Forests 2023, 14(9), 1913; https://doi.org/10.3390/f14091913
Submission received: 27 July 2023 / Revised: 12 September 2023 / Accepted: 15 September 2023 / Published: 20 September 2023
(This article belongs to the Section Forest Soil)

Abstract

:
Landscape restoration activities must be conducted through a transdisciplinary process, integrating social, economic, environmental, and governance aspects. Combining visions from the natural and social sciences is a challenge in highly complex territories, where unique ecosystem characteristics, economic processes, stakeholders of diverse nature, and different normativity converge. The harmonization of multiple techniques, such as multicriteria spatial analysis, expert knowledge elicitation, and social mapping, allows for an approach to defining landscape restoration areas in complex regions. This paper employs multiple techniques to define ecosystem restoration areas in a complex Colombian Andes landscape, integrating ecological and social components for sustainable development. We observed that areas of high and very high feasibility for ecological restoration, encompassing 179.5 hectares (4.84% of the study area), are predominantly located near primary forests. Although some areas have a low feasibility for conservation processes, they should not be disregarded as they still require protection. Landowners prioritize watershed and soil restoration as the most important landscape restoration activity due to their interest in improving water-related ecosystem services. This proposal enables the identification of areas with a higher restoration potential at the property level, facilitating prioritization and investment allocation for future implementation.

1. Introduction

Restoring degraded ecosystems is a complex task that demands significant investments of time, resources, and knowledge [1]. To achieve multiple long-term benefits, it is crucial to understand the social and ecosystem dynamics associated with the territory [2]. This requires a more holistic and integrated approach to identifying suitable restoration activities based on the landscape, such as ecological restoration [1], sustainable use [3], and conservation itself, over time. This vision also encompasses concepts such as ecosystem restoration [4], forest restoration and landscape [5], and forest landscape restoration [6,7], from a broad socio-ecological perspective. Then, we need to find an area where we can develop a zoning of areas for landscape restoration based on the concept of sustainable development, involving economic, social, and environmental aspects from a transdisciplinary perspective.
Numerous aspects have been referred to as challenges in achieving practical implementation, including spatial scale, the integrative nature of restoration, the availability of high-quality native seeds, and governance and decision-making factors, among others [8]. Parameters affecting natural recovery and plant succession, as well as the social aspects supporting the maintenance of restoration processes, need to be identified or collectively agreed upon through participation and technical input [1,9]. However, there is often a lack of integration between approaches from the natural and biological sciences and the social sciences [8,10]. In this context, the integration or harmonization of technical–scientific methodologies utilizing ecological principles with a social perspective (economics, governance, and participation) [6,8] could be the key to shaping prioritization processes that lead to long-term landscape restoration projects.
Various techniques have been implemented to estimate landscape restoration areas, such as ecosystem services modeling with thresholds and the probability of implementation success, environmental quality indices, landscape metrics, blue and green infrastructure based on ecosystem services, biodiversity improvement, and soil restoration [11,12,13]. The multicriterial spatial analysis (MCSA) within the geographic information systems (GIS) has been widely used in applications related to environmental assessments and its adoption is due to the increasing availability and accessibility of spatial data and the feasibility of using geographic information technologies [14,15].
Different zoning schemes showing areas of greater importance for the implementation of restoration activities have been produced worldwide based on different objectives such as biodiversity [16,17], protected areas [18], social aspects [19], tree cover [20], and land-cover change [21], as well as integrating the above with cost–benefit analysis [22], and future scenarios up to 2050 [23]. Regardless of the underlying objective, all results aim to generate benefits in mitigating climate change and improving biodiversity and human well-being.
Global spatial prioritization provides initial guidelines, but for execution and greater effectiveness, an assessment must be made at the landscape or lower cartographic scale, involving historical, ecological, and socioeconomic factors [24]. A multifunctional landscape approach that improves the coexistence of different land uses with the interests of the stakeholders involved, together with a relevant review of land-cover maps and statistical analysis, is essential [25]. Finding a transdisciplinary approach that addresses the complexity of ecosystems and socio-ecological systems, considering ecological vitality, economic potential, and social acceptance, could accelerate restoration efforts, obtaining collateral benefits for all stakeholders involved [26,27]. Communication must be clear and transparent among parties, based on fair governance and incentivized by a long-term mechanism [24], with persistent processes over time [28].
Now, by understanding the perception of the importance of landscape restoration processes and the possible location of these activities on their properties, communities can provide guidelines for approaching future landscape restoration processes. Techniques like expert knowledge elicitation (EKE) could be implemented to estimate probabilities that reflect the state of the information that an individual or several individuals may have about the query. In this sense, Ref. [29] compiled applications of expert knowledge and elicitation for landscape ecology topics. In restoration issues, Ref. [30] generated a list of criteria and indicators for prioritizing restoration areas based on elicitation techniques with multiple actors. Additionally, Ref. [31] presented a study that seeks to obtain information from elicitation in conjunction with cartography, and other spatial methods have been applied in ecosystem service assessment.
In addition to the use of EKE, the integration of ecological and social aspects, such as social cartography, is necessary for the development of conservation studies. Methodologies that address these points and harmonize their results are key to defining areas for landscape restoration. As defined by [32], this constitutes the starting point for generating useful tools in the formulation of new strategies and strengthening existing ones for restoration processes. Restoration actors must work together, defining both biophysical and socioeconomic goals, and considering potential trade-offs, as stated by [33,34].
MCSA, social cartography, and elicitation are all highly valuable techniques for conducting processes of the definition and delineation of areas for ecological restoration purposes, but their integration allows these processes to be conducted holistically. One of the main advantages of MCSA is its ability to incorporate multiple factors or criteria into the decision-making process and weigh them according to their relative importance for a specific environment [14]. However, its implementation can be complex as it requires reliable data, technical skills, and specialized knowledge in geographic information systems (GIS) and spatial analysis.
Now, when we add all of the benefits offered by social cartography to the decision-making process, such as involving communities in decision-making and identifying areas of cultural, historical, or economic significance, recognizing that social cartography requires sufficient time and resources for participatory processes and data collection, it further enhances the capabilities obtained through MCSA [35].
Additionally, the incorporation of expert information for prioritizing restoration activities is a perfect complement to these two techniques and can be carried out through elicitation, which is an adaptable tool that can be used in different contexts and scales, from local projects to large-scale restoration, despite the limitations resulting from its complexity and potential subjectivity in responses [36].
Different methodologies that combine multi-criteria analysis with social and statistical techniques in the field of restoration have been developed at various scales. One of the methodologies that combines participatory mapping techniques with multi-criteria spatial analysis for prioritizing areas for landscape restoration at regional, local, and even plot levels is the restoration opportunities assessment methodology (ROAM) [37]. Moreover, multiple zoning processes have been developed globally at the national and sub-national levels [38].
This paper proposes the use of MCSA analysis with the harmonization of social-based techniques (EKE and social mapping) to estimate landscape restoration areas in the study area, including areas for protecting and restoring ecosystems, as well as promoting sustainable land use. Note that, in this paper, the word “harmonize” is defined as an action or process to integrate variables, data sets, and perspectives from social, environmental, economic, and governance disciplines, obtained through various techniques.

2. Materials and Methods
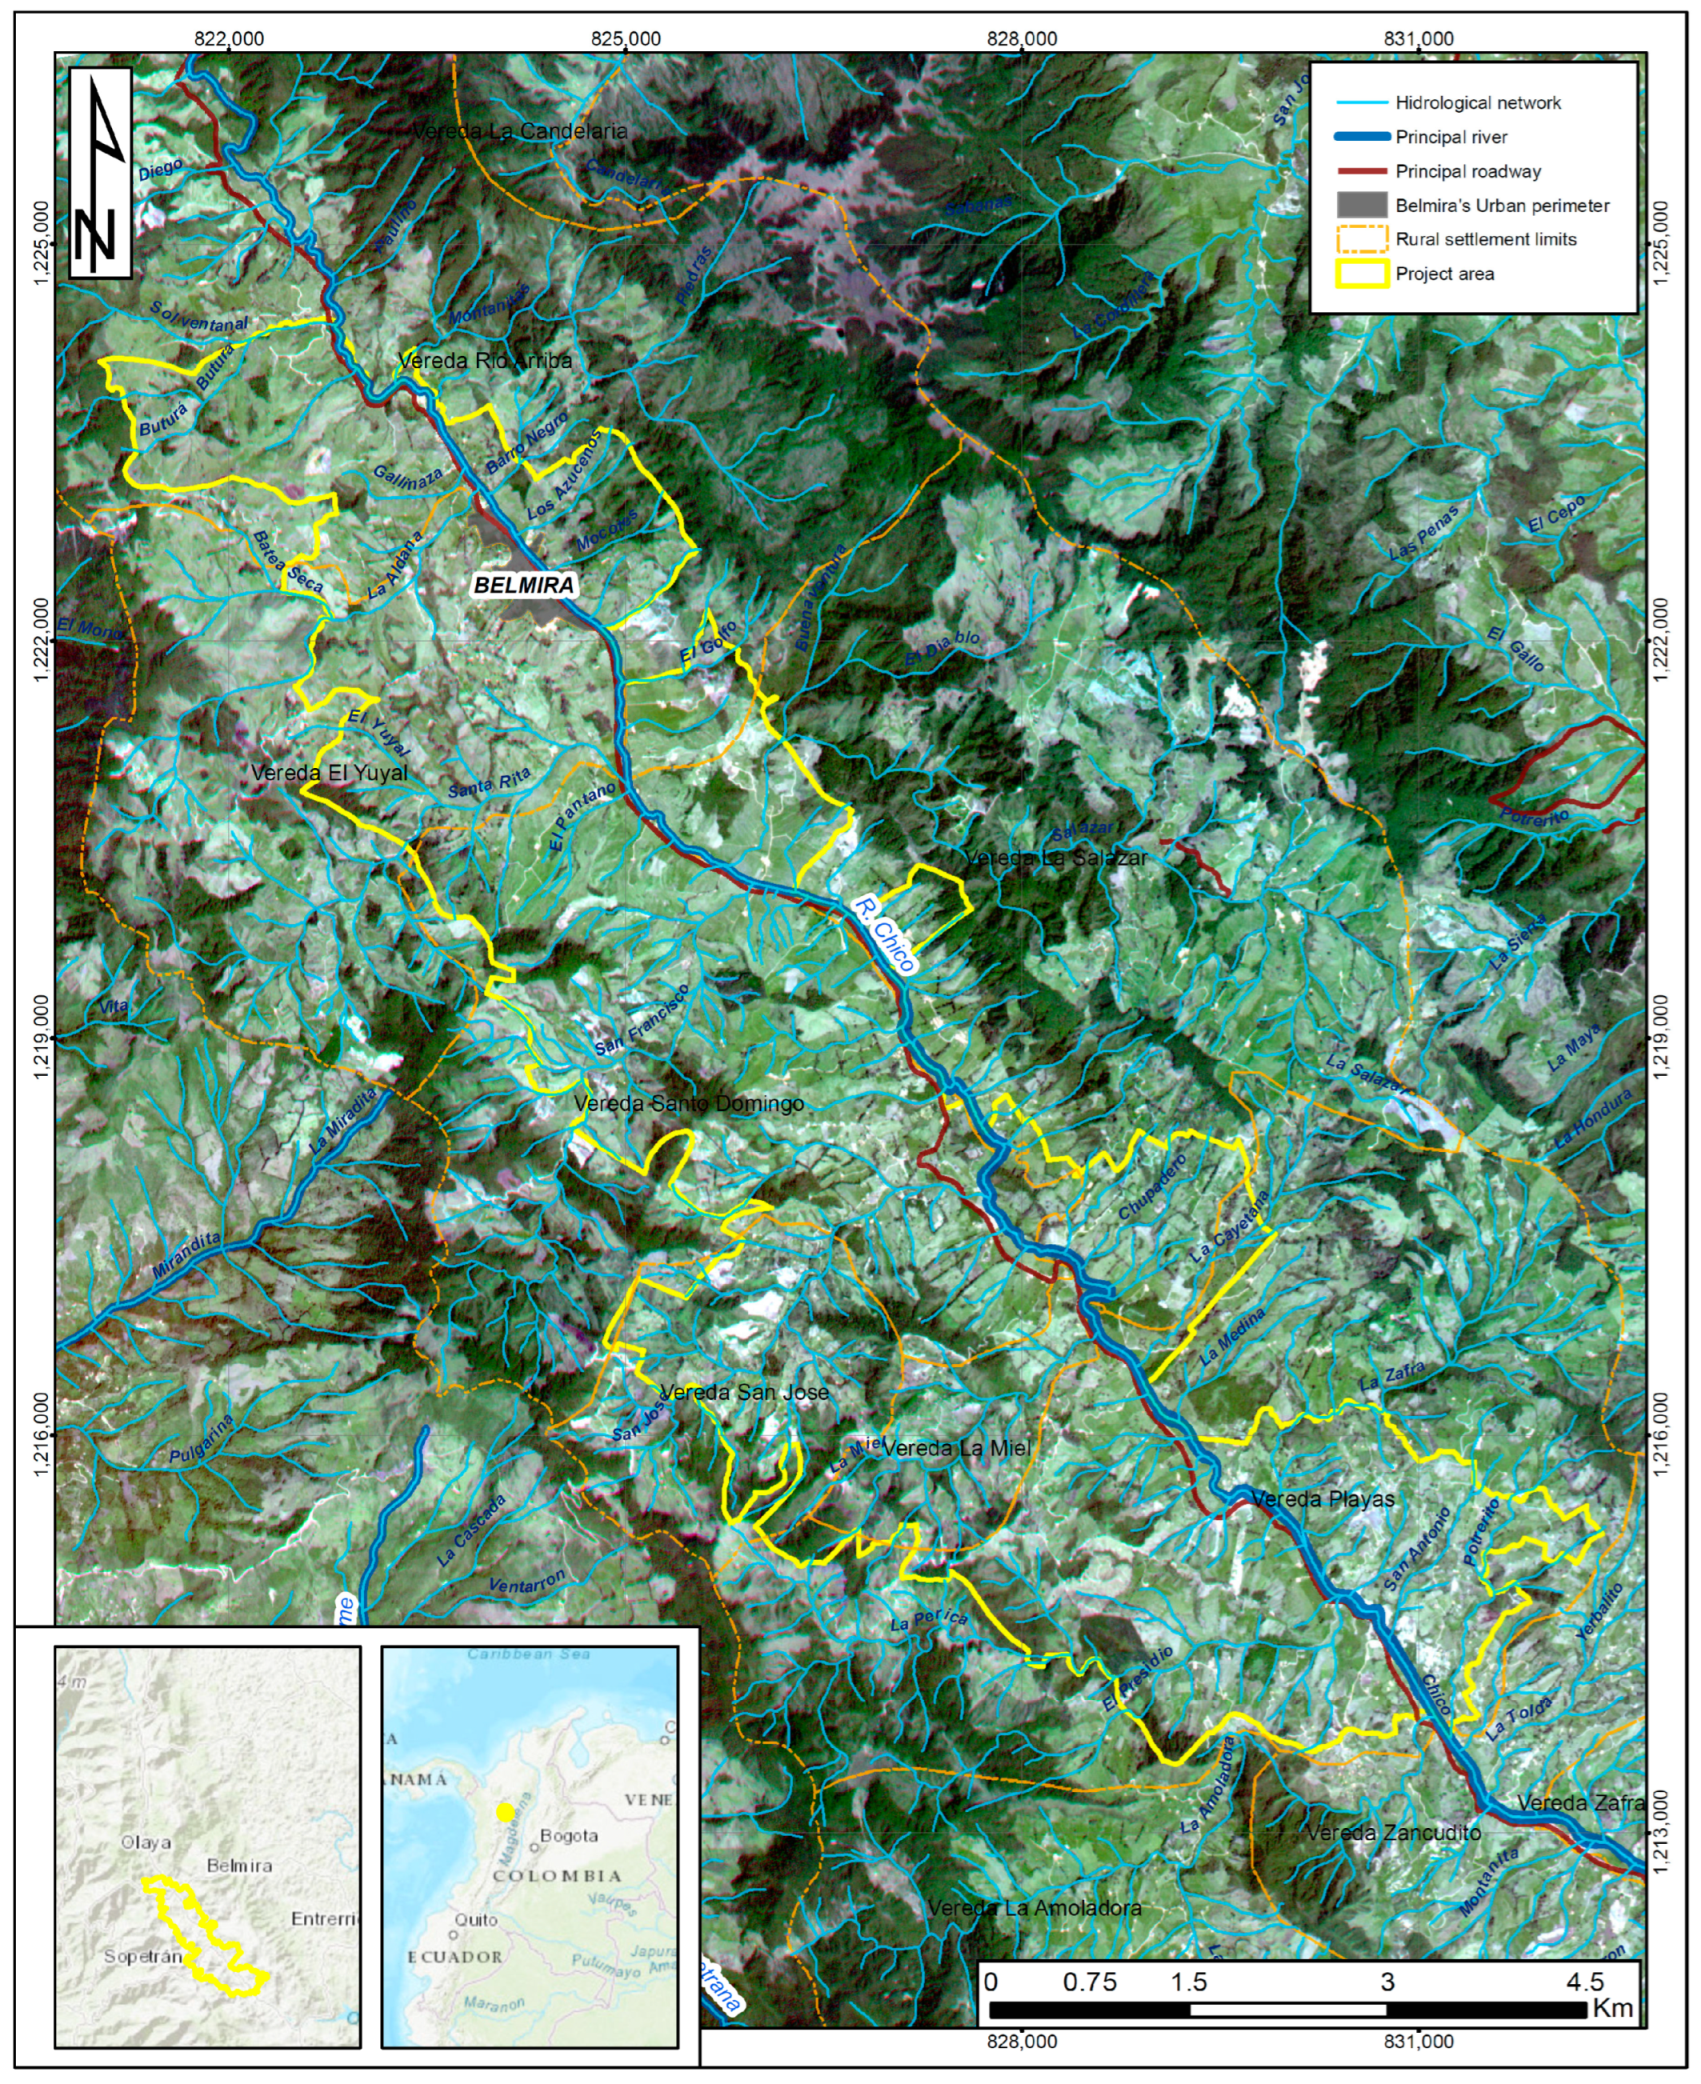
2.1. Study Area

This research was conducted in the rural area of Belmira Municipality, Antioquia, Colombia. Belmira is located in the northwestern region of Antioquia, Colombia. It has an average temperature of 14 degrees Celsius and an elevation ranging from 2400 to 3000 m above sea level (MASL). The estimated population in 2018 is nearly 6000 people. It is situated in the Central Mountain Range at coordinates 6°36′18″ N 75°39′57″ W. The municipality comprises a total of 15 rural settlements, covering approximately 29,000 hectares (ha) [39].
Most of the study area is predominantly covered by high-Andean ecosystems, with the population mainly engaged in activities related to agroecosystems (75.28%), including cattle pastures for livestock and mixed habitats for agricultural activities. Additionally, the landscape also includes high-Andean forests (15.43%) and secondary vegetation (4.84%) [40]. The ecological characteristics of the ecosystem are like those described in the Río Grande Basin, especially in the transitions between the Andean forest, high-Andean forest, and páramo, as reported by [41,42].
The predominant natural grasslands are defined within different life zones, such as montane wet forest (M-wf) and lower montane rainforest (LM-rf). The land cover includes pastures (cleared and managed, mainly focused on milk production), forests (riparian and massive forests), and transitory crops (such as potatoes, Solanum tuberosum ssp. Andigen), primarily [43]. Table S1 presents a summary of the main environmental, social, economic, and governmental features of the study area, as well as the predominant natural grasslands and open landscape components of the zone (see Supplementary Materials).
The Andean and high-Andean forests have usually been identified in remnants surrounding the páramo ecosystems. However, this coverage, which can be considered the original vegetation in terms of structure and composition, has limited ecological connectivity and has remained historically unfragmented (for more than 60 years) due to the predominance of the anthropogenic matrix [44].
Ideally, the native vegetation is described by [45], and it represents an ecological transition with multiple stages depending on the previous history of soil disturbances and other explicit factors, as addressed by [46].
There are further challenges in achieving restoration goals (ecological restoration activities) when the objectives are related to the recovery of original sites predominantly dominated by Andean oak. This is particularly challenging because more research is still required regarding restrictions and management conditions for effective establishment [47].
The research area is defined based on the following criteria: (1) areas outside the boundaries of the Integrated Management District of the Páramo and High-Andean Forest System in the Northwestern Middle of Antioquia (DMI SPBANMA), (2) areas within the municipal boundaries of Belmira [39], and (3) areas within the High Andean Cauca Orobiome [48]. These criteria allowed for the identification of an optimal research area considering logistical feasibility (size and concentration of the area for fieldwork), homogeneity in terms of ecosystem characteristics (unique biome), and the study objective (outside the protected area, in a neighboring area, and part of the buffer zone).
The total study area covers 3708.87 ha and extends from the northeastern part of Belmira’s urban area to the Río Arriba rural settlement, covering 552.67 ha. Towards the southwest, it includes the El Yuyal rural settlement with 386.75 ha, La Salazar with 143.34 ha to the south, Santo Domingo with 1082.24 ha, San José with 305.35 ha, La Miel with 262.89 ha, Playas with 914.91 ha, and the municipal center with 60.72 ha. The study area is represented by a mostly continuous polygon (see Figure 1).
Belmira is considered an important territory for the provision of ecosystem services in the north-central region of the country, particularly in terms of water supply and regulation, due to the presence of strategic ecosystems such as the Santa Inés páramo [49]. This páramo supplies the Río Grande II reservoir, which serves as a water and energy source for 32% of the population in the Metropolitan Area of Valle de Aburrá [50]. The region faces various socio-ecological challenges that need to be addressed from multiple perspectives to ensure the sustainable development of the territory. These challenges involve different interest groups within and around these ecosystems [51].
Historically, this region supported mining activities and small-scale agriculture [49]. At the end of the 19th century, settlement in the region combined spontaneous colonization and directed colonization, in which mining, agriculture, and livestock were the dominant activities. Historical reports indicate that pastures have dominated the landscape since the 1970s, and forests have occupied only about 38% of the northern highland area. Today, the dominant productive landscape is related to cattle ranching (meat and dairy), with natural grassland or improved grassland, under extensive management (kikuyo, Pennisetum clandestinum, and tréboles, Trifolium sp.), in a consolidated landscape as the main land use for socioeconomic support. In specific zones, the technological production of milk is developed (see Table S1 in Supplementary Materials). This research believes that it is of vital importance to direct restoration activities considering the soil history related to the study area in order to help ensure the sustainability of the ecosystem.
Belmira’s special characteristics include a significant portion of its area being within the National System of Protected Areas—SINAP, as well as the surrounding buffer areas where productive communities are located. The Río Grande basin, which is of high interest to downstream communities, exhibits a landscape with a historical imprint of human activities, including agriculture such as dairy and dual-purpose cattle farming, as well as the cultivation of crops such as criolla potatoes, cape gooseberry, and tomatoes, among others (see Figure 2).

2.2. Restoration Goals in the Study Area

Both identifying ecosystem-degrading disturbances and their respective stressors, constraints (also known as barriers and/or filters), and enhancers for landscape restoration provide clear guidance for defining restoration goals and criteria related to environmental, social, economic, and governance aspects of an area.
For the defined project area, disturbances such as agricultural expansion with monocultures like potatoes, cape gooseberry, and tree tomatoes, among others, as well as livestock expansion, have caused the degradation of native ecosystems [52]. Other historical factors (currently of lesser relevance) such as alluvial mining (sporadic), flooding, and the impact of invasive species (recently the presence of Thunbergia alata without a defined scope or mapping) influence the definition of these goals.
When considering the stressors for generating restoration processes, it is notable that the expansion of monoculture agriculture continues into the various remaining forest remnants. Other factors limiting restoration processes include the limited presence of native seed banks and their propagation, as well as the limited knowledge about the soil conditions in the area and the low capacity of communities for sustainable use practices. Regarding enhancing factors, the presence of various organizations (both private entities involved in environmental service payments and multiple universities) is significant. This is due to the area’s importance within the Río Grande Basin, where it plays a crucial role in hydroelectric generation and provides drinking water to the people in Medellin and its metropolitan area, the second-largest urban area in Colombia [52].
Based on the above, the definition of restoration objectives for the project area considers various environmental criteria (preservation of natural ecosystems, alignment with soil suitability and land capability, habitat improvements for species and communities), economic aspects (enhanced productivity based on sustainability criteria, with a positive financial impact), social considerations (community perceptions and preferences, with community empowerment), and governance factors (territorial management focused on appropriate processes, such as acting as a buffer zone for protected areas in terms of ecological connectivity). Additionally, there are multiple challenges and discussions regarding the restoration of ecosystem functions and the structural composition of ecosystems, particularly those remnants in still-conserved sites where vegetation associated with the transition from Andean to high-Andean forest is identified, bordering on the páramo [47].
As a complement, Ref. [52] have analyzed the spontaneous recovery of woody vegetation on agricultural lands abandoned in the study area. This recovery depended on various factors, including edaphic conditions (such as organic horizon content and depth and low bulk density of the soil), distance to remnant forests, distance to human settlements, and high mean annual precipitation. Forest recovery occurs because of declining livestock and dairy farming productivity, leading to the abandonment of agricultural areas and pastures. This behavior in the area is crucial for delineating the boundaries of restoration areas.

2.3. Identification of Landscape Restoration Areas and Activities

The identification of landscape restoration areas and activities is carried out through spatial analysis, where an initial feasibility map is generated, representing the viability for implementing landscape restoration processes within a 9 square meter (3 m pixel) area. This map is obtained by spatially combining nine variables using a multicriteria spatial analysis (MCSA) approach (see Table S2 in the Supplementary Materials). These variables encompass ecological and socioeconomic criteria, selected based on secondary information collection, field observations, and specific stressor barriers defined in [53]. To define the weight of the variables in the MCSA model, an analytic hierarchy process (AHP) [54] is applied. AHP is a mathematical theory of value, ratio, and judgment, involving proportion scales for the decision-making analysis of problems with multiple criteria. It is based on comparing the relative importance of each pair of variables, where decision-makers (experts) express their preferences between two elements on a proportional scale [55] (see Table S3 in the Supplementary Materials).
The AHP process begins with a relative importance assessment of the variables through a survey administered to experts in natural sciences and fields related to the study area. To compare different pairs of variables, the following question is asked: Which variable do you consider most important for defining suitable areas for landscape restoration? Each response is assigned a value according to the scale proposed by [56], and the values were incorporated into a pairwise comparison matrix to assess the importance between variables. Through a series of statistical and mathematical analyses, the principal eigenvector is established, which determines the weights ( W j ) and provides a quantitative measure of the consistency of value judgments among pairs of factors [57]. Based on the relative weights of the variables, the multicriteria spatial analysis (MCSA) is conducted. The process is performed using the “Raster Calculator” tool in ArcGIS Pro software, version 2.8, Redlands, CA, USA [58]. Each raster has values ranging from 0 to 100, and a raster overlay of the different spatial variables is applied, as shown in Equation (1).
F e a s i b i l i t y   m a p = i = 1 9 R i × w i ,
where R i represents the raster of each normalized variable, and w i represents the weight of each variable according to AHP. The resulting map is a raster image with a pixel resolution of 3 m, indicating values from 0 to 90 (the maximum value achieved in the overlay of all variables). These values are related to the feasibility of an area for landscape restoration processes. To assign qualitative classifications, the natural breaks algorithm by Jenks [58,59] is applied, resulting in 5 classes: very high, high, medium, low, and very low feasibility. This produces the feasibility map for landscape restoration in the study area.
According to the concept of landscape restoration given in the introduction, there are three main related activities: ecological restoration, conservation, and sustainable use. A raster map of landscape restoration activities is obtained based on a multitemporal analysis of land cover from 2010 to 2020, with a pixel size of 3 m (see Table S4 in the Supplementary Materials). Spatial techniques are then applied to derive the map of areas for landscape restoration.
The statistical validation of the variables used is performed through principal component analysis (PCA), followed by the application of AHP. The results of the expert assessment of variable comparisons are transferred to an aggregated comparison matrix, from which the normalized comparison matrix is derived (see Table S5 in the Supplementary Materials). With the mathematical formulation of these data, the priority vector is obtained, indicating the specific weight of each variable. The statistical validation is performed using the logical consistency test data (maximum Lambda value, consistency index, and consistency ratio). The consistency ratio value is 0.07, which is less than 10% of the maximum value for a larger 5 × 5 matrix, indicating consistency in the developed process.

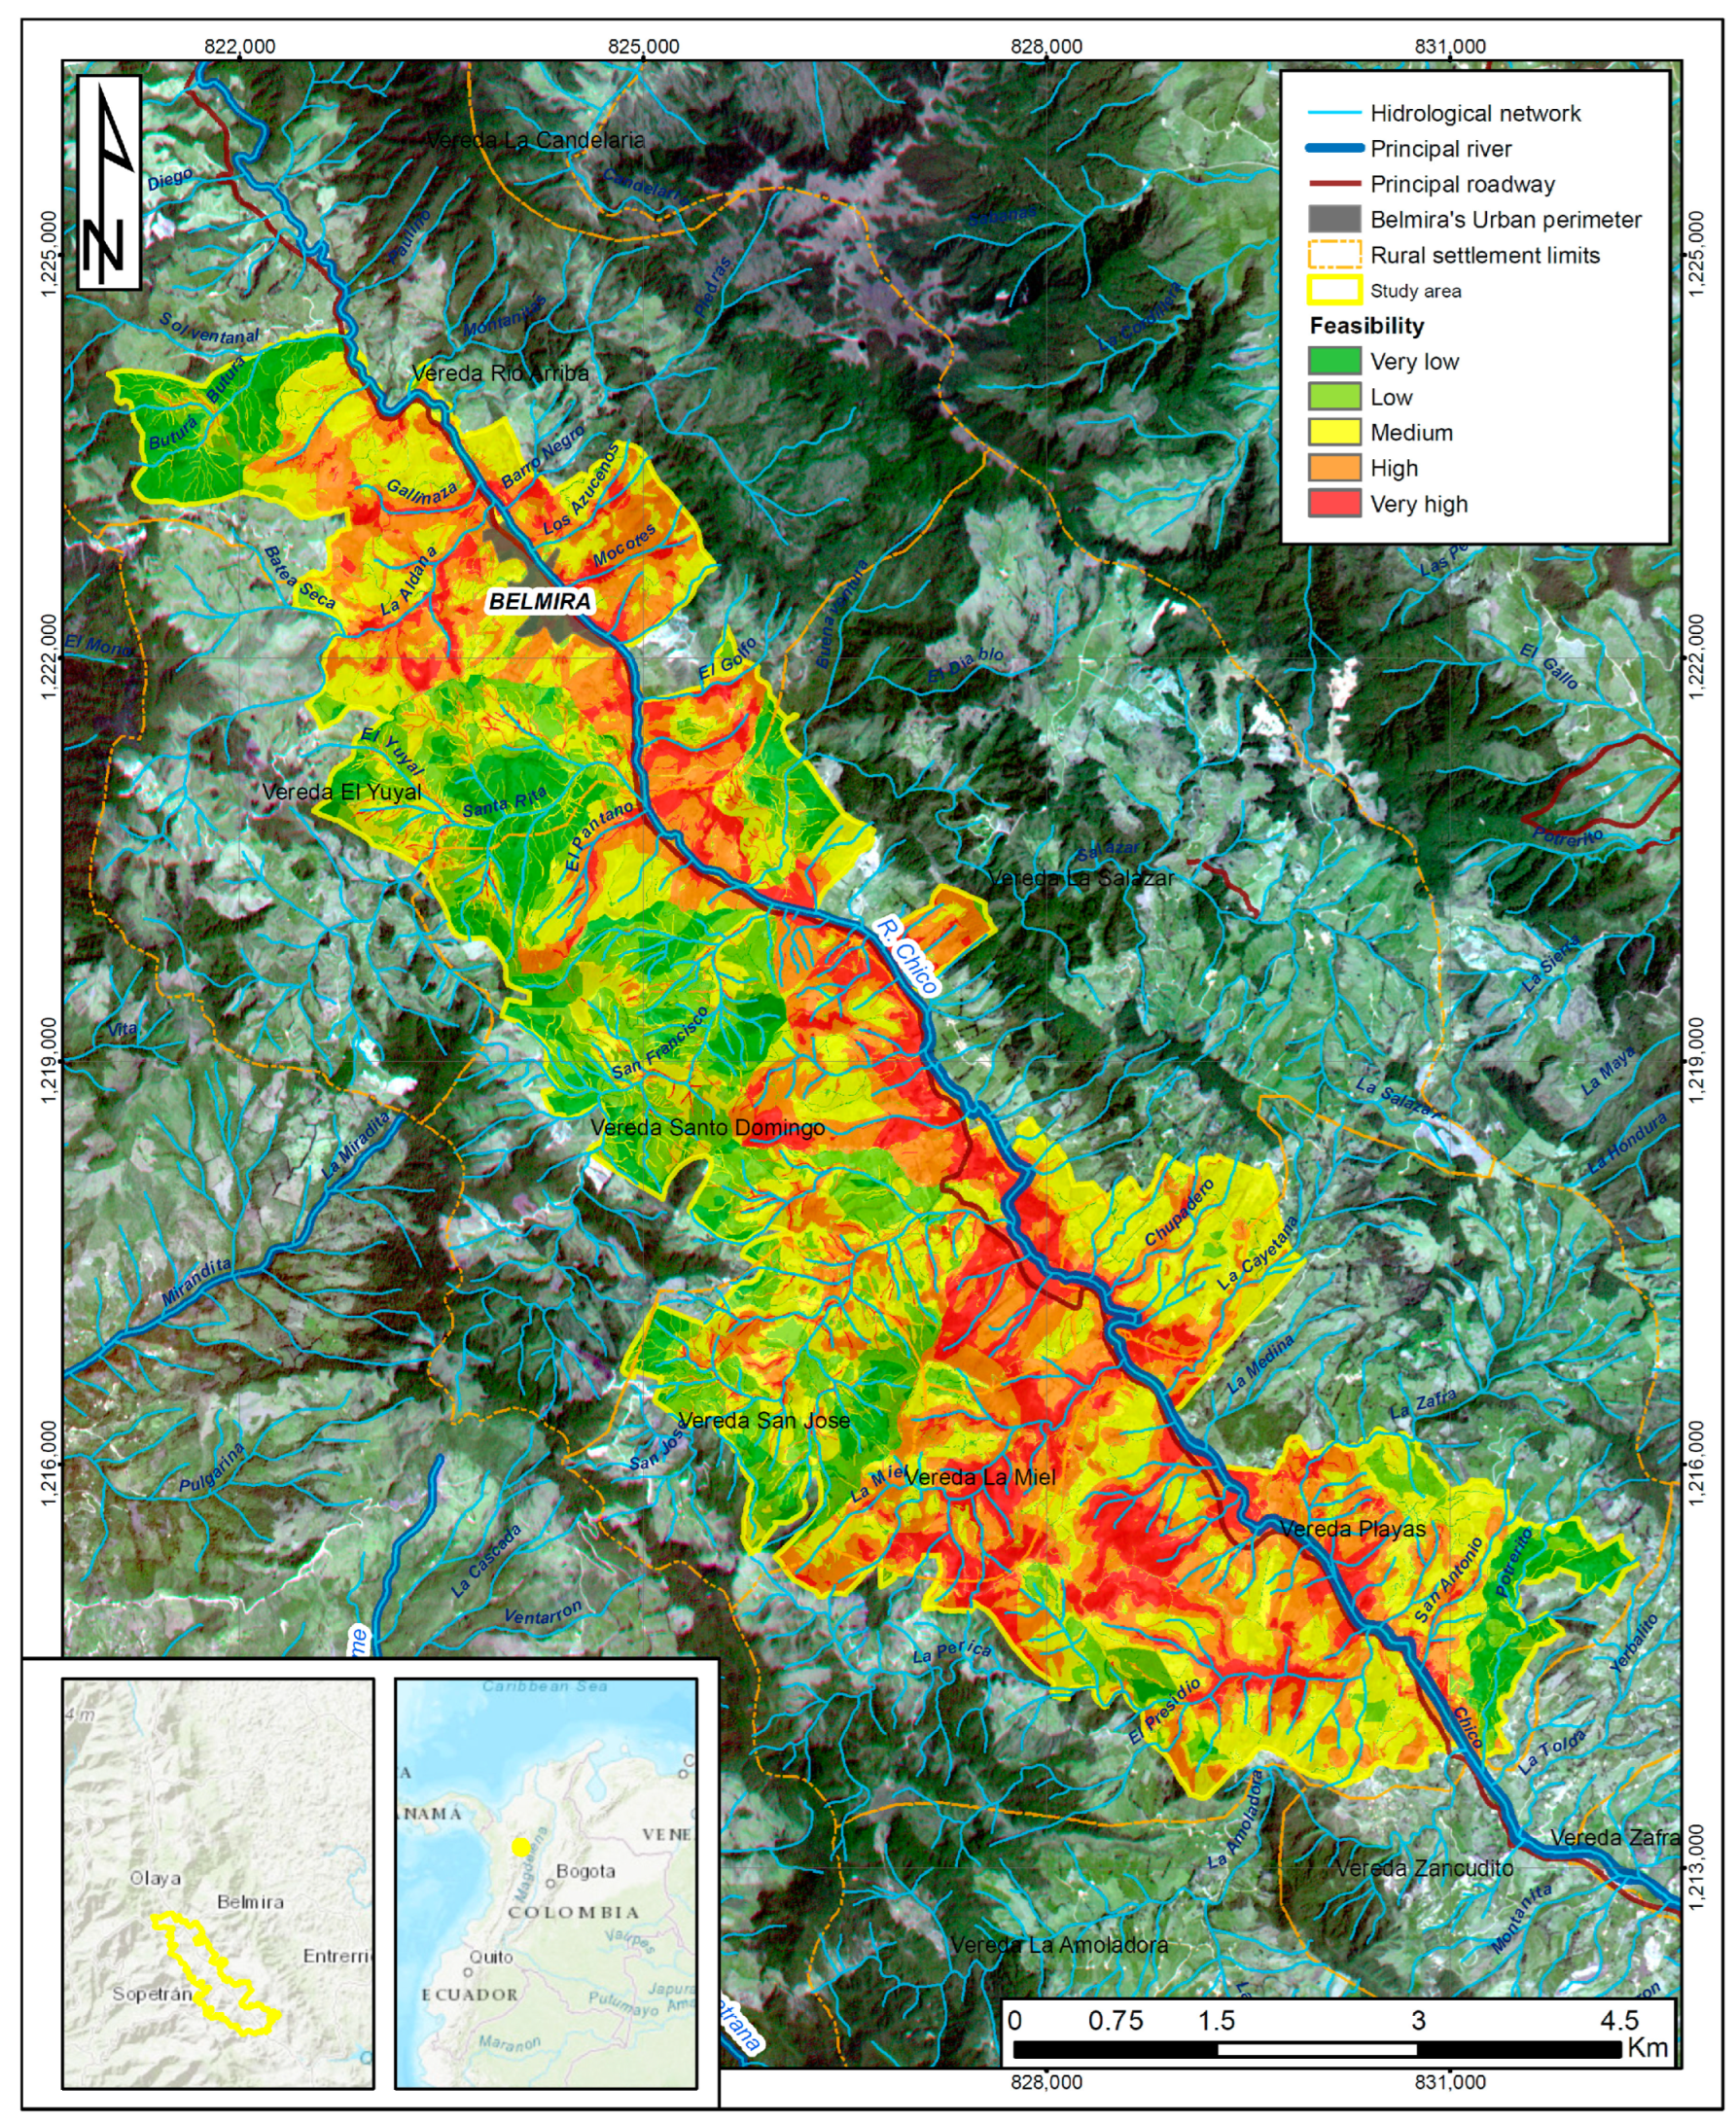
2.4. Localization of Areas and Landscape Restoration Activities

The combination of the feasibility map with the map of activities for landscape restoration allows for the assessment of the importance of these activities through elicitation techniques. EKE is a process of formulating an expert’s knowledge about a particular assertion or topic as a probability distribution in the absence of scientific data [60]. In this study, EKE is used to evaluate the importance of landscape restoration activities for certain experts. This process is conducted as rigorously and scientifically as possible, minimizing expert cognitive biases, using structured protocols. This process involves designing and validating questions, providing context with appropriate vocabulary, and adapting elicitation according to expert conditions [61].
Then, the distribution of importance for the five main restoration activities is elicited, which include “live fences” and “crop rotation” within the concept of sustainable use, “watershed and soil restoration” as ecological restoration activities, and “nature tourism” and “birdwatching” as conservation activities along with sustainable uses. These activities are defined based on the municipality’s characteristics, objectives set by the municipal government according to its management plan [62], the feasibility map, the framework of activities related to the sustainable development approach, and forest landscape restoration processes outlined by entities such as the UICN [37,63].
The elicitation process is carried out per property under study, as the level of importance can vary from one property to another due to their specific conditions. Therefore, elicitation is performed by using an expert for each property, and the selection criterion is based on choosing the person with the most knowledge of their area as the expert. In total, 13 experts were elicited for the 14 properties defined in the study area.
The list of properties evaluated in the study area through elicitation and social mapping is shown in Table 1.
In global terms, the statistical validation of the sampling is performed based on the area criterion (in ha). A sample size is assumed using a proportion for a finite population, with an estimation error of 0.05, a confidence level of 95%, and a success probability of 0.5. Considering that the total area of the research is 3708.87 ha, a total of 348.19 ha needs to be sampled. In this research, as shown in Table 1, a total of 419.37 ha are sampled for the elicitation and social mapping processes.
A graphical elicitation method is used through a tool that allows experts to manually set the level of importance they consider should be assigned to the five different proposed landscape restoration activities. These activities and their implications from social, economic, and environmental perspectives are explained to the experts in advance, along with the necessary basic statistical concepts for elicitation. Through a series of questions in a structured interview, where strategies are implemented to avoid any bias and anchoring of the experts, the 5th, 50th, and 95th percentiles of the distribution of the importance level for each proposed activity are obtained. These elicited distributions can exhibit asymmetric behaviors, and therefore can be approximated using models such as those proposed by [64] or [65]. In this study, we use beta models due to their lower parameter complexity and simpler approximation process. Hence, the percentiles obtained are approximated using the algorithm proposed by [66], using their corresponding values in a beta probability model (since the responses fall within the 0–1 or 0–100 interval).
To elicit, for example, the 50th percentile corresponding to the probability distribution of the importance level of the “living fences” activity, after providing the expert with pedagogical information about the concept of living fences, their environmental, social, and economic benefits, and basic statistical concepts, the expert is asked the following question: On average, from 0 to 100, what level of importance would you assign to this activity based on your knowledge of your property? Their response is recorded in an educational tool that allows the expert to adjust their belief or response throughout the elicitation process to avoid biases or anchoring in their responses.
On the other hand, based on a hypothetical scenario where there are economic resources to implement these same landscape restoration activities, a social mapping process is conducted with the property owners. Initially, the images of each property drawn by the owners in the field are digitized using ArcGIS Pro software, version 2.8, Redlands, CA; USA [58]. Subsequently, they are converted into raster format, maintaining the same pixel size as the feasibility maps. The respective statistics are calculated, and together with the results of the elicitation technique, the corresponding interpretation of the importance of the activities is performed. Note that similar social mapping processes have been implemented by [67,68], among others, but they do not combine information contained in elicitation processes.

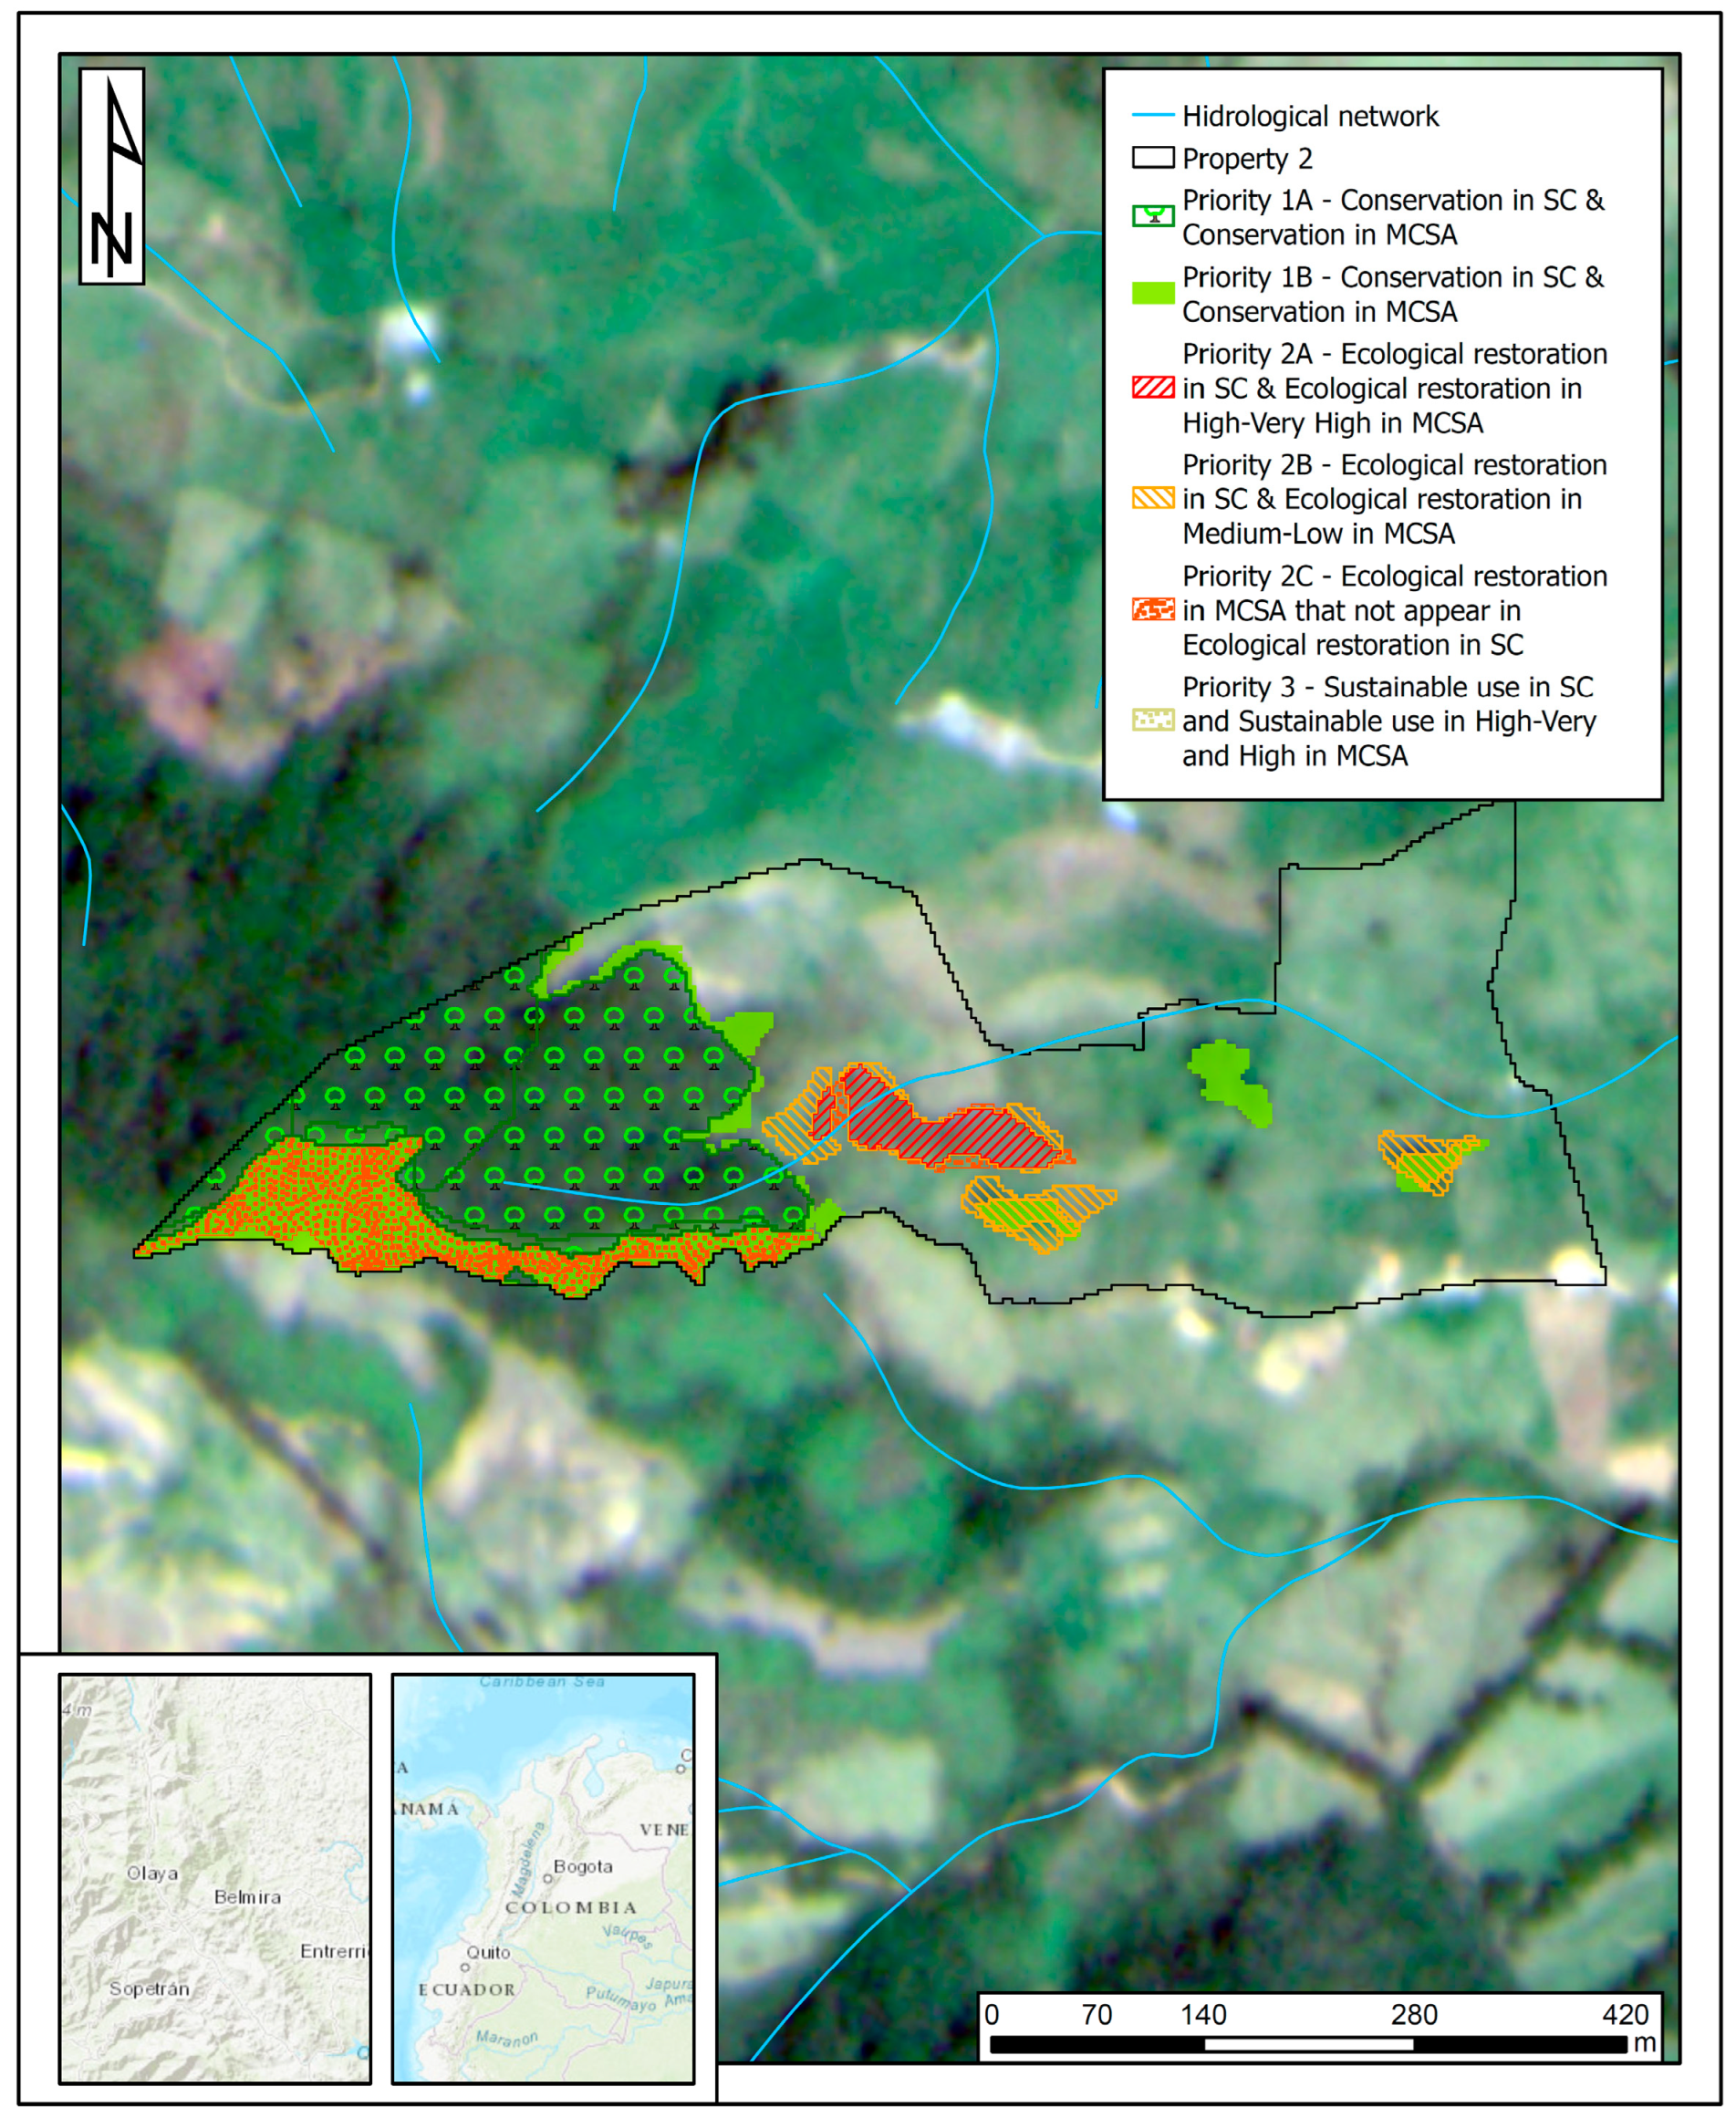
2.5. Harmonization of Techniques for Defining Areas for Landscape Restoration

In this paper, we illustrate the harmonization process using a single property area, Property ID 2, where all the collected information is simultaneously analyzed (Section 4 not only presents the highlights of property number two but also the results related to properties numbers 4 and 6, for a total of three properties for which the harmonization exercise is conducted). We compare the main results spatially, visually, and in terms of data between the following: the feasibility map and landscape restoration activities obtained through MCSA and multitemporal analysis, and the landscape restoration activity map obtained through social mapping and elicitation in some properties.
The results were harmonized, thus generating areas with a higher feasibility in both techniques and creating a possible strategy for approaching landscape restoration processes in the defined properties. The following priorities are assumed: (1) areas for conservation activities that overlap, based on the results of social mapping and multitemporal analysis, regardless of their feasibility level; (2) areas for conservation activities that do not overlap, based on the results of social mapping and multitemporal analysis, regardless of their feasibility level; (3) areas for ecological restoration activities found in the results of social mapping with high and very high feasibility; (4) areas for ecological restoration activities found in the results of social mapping with medium, low, and very low feasibility; (5) areas for ecological restoration activities found in the results of multitemporal analysis, regardless of their feasibility level; (6) areas for sustainable use activities found in the results of social mapping and multitemporal analysis with high and very high feasibility.

3. Results

The variables selected for constructing the feasibility map are land cover, erosion and mass movements, flooding, water importance, ecological connectivity (resistance and nodes), properties with conservation processes, properties with live fences, building density, and distance to forest loss. These variables are validated using principal component analysis (PCA) to discard redundant or duplicated variables for the study. The first two principal components only account for a total of 40.07% of the total variability and the first four principal components only account for 68.97% of the total variability in the data. Therefore, each variable can explain landscape phenomena on its own, and it is recommended to retain these nine variables for constructing the feasibility map.
Now, using the AHP process proposed by [53] to define the weights of the variables in the MCSA model, and the value assessment scale proposed by [54], we present the summary of the specific weights obtained in descending order based on information from the five consulted experts (see Table 2).
The variable with the highest weight is V02—erosion and landslides with 22%, followed by V04—water importance with 20%, V01—land cover with 17%, V05—ecological connectivity with 16%, V03—flooding with 8%, V09—distance to forest loss with 8%, and the remaining variables V07—properties with living fences, V08—density of constructions, and V06—properties with conservation processes with 4%, 3%, and 2%, respectively. When combining the variables according to the criteria, it is shown that the ecological criterion, composed of four variables, accounts for 63%; the socioeconomic–ecological criterion, composed of variables variables, accounts for 28%; and the socioeconomic criterion, composed of three variables, accounts for 9% (the complete prioritization matrix is available in [49] or see Table S5 in the Supplementary Materials).
Based on the weights assigned to each variable, the MCSA is applied to define the feasibility of landscape restoration. The results for each class, along with a description based on the contrast of areas with each individual variable, and their respective areas, are shown in Figure 3.
However, by comparing land-cover changes (based on the land-cover analysis from 2010 to 2020) with the landscape restoration activities and the feasibility map, a comprehensive map is generated that integrates both the landscape restoration activities and their corresponding land-cover changes (see Tables S6–S8 in the Supplementary Materials). This map facilitates decision-making regarding the prioritization of the restoration activities previously defined (see Figure 4).
The results show that approximately 4% of the area falls within the medium-to-high feasibility range for ecological restoration. Regarding sustainable use, 55.7% of the area exhibits medium-to-high feasibility, while conservation activities account for a total of 15.8% and are associated with areas of high forest interest.
It is noteworthy that 76.1% of the total study area (2822 ha) is conducive to the development of sustainable use initiatives, primarily due to the stable grassland coverage over the past 10 years (71.67%). Within this category, 1159.7 ha, equivalent to 31.3% of the total area, are defined as having a high-to-very-high feasibility for landscape restoration processes.
Based on the information presented in Figure 3, it is found that 15.80% of the study area is related to conservation processes (corresponding to 394.7 ha). Moreover, 10.7% of the area has a high-to-very-high feasibility for landscape restoration. The rural settlement with the highest amount of conservation areas is Santo Domingo (144.25 ha), followed by Playas (134.87 ha) and Río Arriba (94.26 ha). However, the San José and La Miel rural settlements, which have joint conservation cores, account for a combined area of 145.79 ha.
Similarly, it is found that 179.5 ha are part of the restoration category, equivalent to 4.84%. Among areas with high and very high feasibility, the largest amount of land is found in the vereda of Playas (45.38 ha), followed by Santo Domingo (45.23 ha) and La Miel (34.04 ha).
Following the construction of the feasibility map, the research focused on determining the most probable restoration activities to be applied in the study area based on expert criteria and the use of elicitation. Through the EKE, the importance level (in percentage) of each defined landscape restoration activity is estimated using probability models, considering the municipality’s characteristics, objectives outlined in its management plan [48], and the feasibility map presented in Figure 3. The activities under study are as follows: A1: living fences, A2: crop rotation, A3: watershed and soil restoration, A4: nature tourism, and A5: birdwatching. Note that A1 and A2 are part of the concept of sustainable use, A3 corresponds to ecological restoration, and A4 and A5 encompass both conservation and sustainable use.
The average age of the experts is 56.23 years, with a median of 61 years, a standard deviation (SD) of 12.14, and an interquartile range (IQR) of 12. The average expertise time (or knowledge of the area where the importance of activities is being elicited) is 21.08 years, with a median of 20 years, an IQR of 23, and an SD of 15.11. Furthermore, out of the 13 experts, 8 have previously participated in conservation processes, highlighting the relevance of the selected individuals as experts in this research.
Table 3 and Figure 5 illustrate that the activity A3: watershed and soil restoration exhibited the highest level of importance for independent implementation on the studied property. According to the experts, one of the benefits that could arise from the implementation of such activities in the future is the improvement in water resource regulation and provision.
In addition to the elicitation process, social mapping is carried out, which focuses on collecting information on viable areas for landscape restoration processes, with social, spatial, and dynamic interactions in the territory.
Now, through social mapping, and discriminating according to the activities presented in Table 4 (which shows the equivalence between the activities evaluated in both the elicitation and social mapping processes), the area of each evaluated activity is calculated. It is found that among the landscape restoration activities, the largest area (ha) to be implemented in the study area is related to sustainable use activities, with 330.02 ha, accounting for 79.19%; followed by conservation activities, with 68.30 ha and 16.39%; and finally restoration activities, with 10.04 ha and 2.41%.
At the level of more detailed activities, there is a particular interest from landowners in sustainable livestock processes. It is important to define the scope of this implementation, the method of execution, feasibility, training, and costs. Other initiatives of interest include trout farming, sustainable livestock, forest plantations, and glamping tourism initiatives.
After constructing feasibility maps, applying elicitation techniques to define activity importance, and conducting social mapping, the harmonization of these techniques is carried out to define areas for landscape restoration. This process involves integrating ecological and social aspects for each of the 14 properties considered in this study, which is essential for conservation projects [48]. In this study, in addition to providing consolidated estimates for the entire study area, the techniques are applied to each of the properties studied (see Table S9).
To illustrate the harmonization process, let us consider Property ID 2, where the elicitation process shows that the activities with the highest importance for implementation are A2: Crop rotation and A3: Watershed and soil restoration. Here, based on the conservation, ecological restoration, and sustainable use activities, the results from the multicriteria spatial analysis (MCSA) and the multitemporal analysis show a distribution of 26.97%, 10.75%, and 61.50%, respectively. With social mapping, the respective percentages are 32.83%, 6.02%, and 59.92%. The activity that exhibits the largest difference (>4%) is ecological restoration, with 0.88 ha. The information is presented in the comparison matrix of the areas obtained by both techniques in Table 5.
In the harmonization process, we see that priority areas correspond to conservation activities defined through social mapping and multicriteria analysis. For example, in collaboration with the landowner and based on the information from social mapping, elicitation, fieldwork, and multicriteria spatial analysis (MCSA), it is determined that activities such as A5: Nature tourism are important, combined with future lodging research (glamping) in the western area of their property. Towards the center of the property, there are areas of instability and erosion processes, which present the potential for water-related activities (water sources). Similarly, in the central part of the property, where water sources and drainage are present, ecological restoration processes with high and very high feasibility are jointly defined, covering an area of 0.49 ha.
Regarding sustainable use processes, the expert is interested in implementing these practices throughout their entire property. For the activity A1: Living fences, the expert proposes the establishment of some of these fences, strategically aligned to create possible ecological connectivity with restoration areas on their property. The areas designated for this activity, with high and very high feasibility, are prioritized as Priority 3, totaling 9.20 ha.
A general conservation strategy that is being considered in collaboration with the expert is primarily focused on sustainable livestock farming as a foundation. It involves implementing living fences initially, allowing the livestock to access water areas (wetlands) and enabling pasture rotation. It is also considered that ecological restoration areas will contribute to improving water source zones, where these processes could be implemented. Finally, the development of nature tourism and birdwatching strategies in the westernmost part of the property is contemplated, as it is believed to have the potential for generating additional resources.
The prioritization map of landscape restoration activities and a visual explanation of the implementation strategy are presented in Figure 6 and Figure 7, respectively.

4. Discussion

In the ecological restoration field, one of the primary challenges is achieving the integration of techniques that encompass social, environmental, and economic aspects of the area of interest, as suggested by the ROAM methodology [40]. While works such as those by [28,41] consider social and spatial components that point towards restoration processes, they do not encompass factors that are deemed essential for conducting comprehensive restoration processes. This research proposes a comprehensive and robust methodology for decision-making aimed at achieving benefits for both ecosystems and humans. This methodology involves exercises related to the prioritization of landscape restoration activities, considering the input of experts or land experts. Furthermore, it is observed that the use of elicitation techniques harmonized with MCSA and social cartography constitutes an effective strategy for delineating and prioritizing feasible areas for the preservation, restoration, and sustainable use of productive landscapes.
Three different techniques (MCSA, social cartography, and elicitation) have been harmonized to achieve the goal of delineating and prioritizing feasible areas for landscape restoration. The application of MCSA requires up-to-date and reliable sources for defining variables that involve ecological and socioeconomic criteria in the area of interest. However, this technique alone lacks the social component, which is ultimately what allows for the inclusion of specific aspects and characteristics known to local inhabitants and needing inclusion for the execution of restoration processes.
In this study, the aforementioned considerations are indeed essential for landscape restoration. However, a fundamental question arises: which restoration activities should be prioritized, considering the needs of both the local community and the ecosystems? This paper considers that by integrating elicitation methods with the first two techniques, an answer to this question could be provided, even though the implementation of such methods may not be straightforward.
Therefore, it is important to emphasize in this study that the suggested method can be used in various types of ecosystems without needing major changes. Additionally, it is worth noting that the outcomes obtained are in line with the municipal government’s proposed area management plan [48].
When harmonizing the results of these three techniques, it is found that, for three properties across six categories: two of these properties are related to conservation processes, all properties are related to ecological restoration, and only one of them is related to sustainable use. An integration of techniques allowed prioritizing areas for landscape restoration at a local level, considering ecological connectivity with protected areas, as well as social perceptions, to maximize multiple benefits of restoration, considering the places people need to live, produce food, and extract natural resources [2].
Furthermore, it is observed that for conservation activities, there is a variation of approximately 5% between the areas defined by both of the last techniques, which is a result of the difference in cartographic scale (1:10,000 and 1:5000). Regardless of the degree of feasibility, areas with this activity were prioritized. Protecting unaffected ecosystem areas is an essential part of landscape restoration processes [40].
Focusing on areas of ecological restoration, those defined by social cartography are proposed as a priority, ordered according to their feasibility value. In this paper, since the zoning is on private properties, it is important not to overlook the guidelines and needs of the property owner in the conservation processes they would be willing to undertake [69], and to try to maximize the benefits within the areas they are willing to allocate for these activities.
Regarding the harmonized areas for sustainable use, those with a higher feasibility were defined using both techniques. However, it does not imply that this activity cannot be developed in other areas. It is important to have a holistic view of the socio-ecological context, where the provision of ecosystem services is evaluated and balanced, as not all areas can have land use related to economic activities, nor can all areas be transformed into conservation processes.
The results showed that finding appropriate connectivity between the objectives of the protected area and adjacent landowners is important for the continuity of conservation processes. Ref. [70] defined the idea that buffer zones should be delineated and managed with an eclectic approach, meaning that a wide range of strategies and instruments should be chosen, ranging from pure conservation to sustainable use, always considering the harmonization between human habitation and resource use with the conservation and restoration of natural values, connecting them in a coherent ecological structure with the protected area.
Variables such as slope, soils, and wetlands would be of high importance for a better definition of the areas. Using these criteria with the communities could also help land-owners to identify specific areas that may be suitable for landscape restoration processes with specific data. For example, an important factor that could change the context of harmonization is the delineation of wetland areas. The collected information does not include spatial information in the territory. Therefore, the delineation of these ecosystems can be crucial for a proper definition of activities, with a socioecological focus.
Based on the MCSA, we observed that areas with high and very high feasibility for landscape restoration activities cover approximately 44.20% of the total research area, mainly in the Chicó River micro-basin and in the La Miel and Playas rural settlements. These areas coincide with primary forest zones and important ecological connectivity nodes. Furthermore, a relationship between land-cover changes and land use in areas adjacent to the forests is observed. This is in line with the findings by [71,72] regarding regeneration zones around forested areas in the Río Grande watershed, mainly related to abandoned areas or transition areas defined by land-cover changes between grasslands and woody vegetation in successional stages.
All areas are considered to have a high-to-very-high feasibility for forest conservation, but a small portion of the allocated ha for this activity shows low feasibility, mainly in the San José and Santo Domingo rural settlements. It is noteworthy that the constructed model demonstrates a relationship between areas with a higher feasibility for landscape restoration and areas that enhance ecological connectivity for bird species.
The sustainable use activity encompasses the largest area, accounting for 76.1% of the total, and is concentrated in the Chicó River watershed and the La Miel, Playas, and Río Arriba rural settlements. The implementation of silvopastoral and agroforestry practices is suggested to contribute to ecological balance and promote biodiversity, especially avifauna.
Based on the elicitation process, regardless of the different scenarios modeled according to the characteristics of the properties, it is found that the most important activity for all scenarios is A3: Restoration of basins and soils (see Table S8 in the Supplementary Materials). For landowners, one of the benefits that the implementation of this type of activity could bring in the future is the improvement in the regulation and provision of water resources. This connotation allows the valuation of this activity to always be of high importance, as water resources are fundamental for the communities of Belmira and the entire Río Grande watershed in their daily and commercial activities [43].
When comparing the results of the elicitation with those of social cartography, and considering a hypothetical scenario in which resources are available to carry out landscape restoration activities on their own properties, the areas allocated for this same activity were very limited (12.89 out of 419.37 ha), resulting in a low opportunity cost due to their limited potential for production processes.
Activities such as A4: Nature tourism and A5: Birdwatching present significant importance for the experts. The studies in [43,73] define that in the municipality of Belmira, people prioritize an interest in cultural ecosystem services related to ecotourism in general (including the Belmira páramo). Therefore, focusing efforts on these types of landscape restoration activities could allow, on the one hand, the conservation of natural areas and/or the development of sustainability-focused processes, as well as generating a greater income capacity for communities [40,57].

5. Conclusions

This study has revealed several key findings regarding landscape restoration in the complex Colombian Andes terrain of Belmira. The areas with the highest feasibility for ecological restoration, totaling 179.5 ha (4.84% of the research area), are predominantly clustered around primary forest regions, particularly in the vicinity of the La Miel, San José, and Santo Domingo rural settlements. Nevertheless, it is important to highlight the need for further investigation into the underlying causes of impacts in these zones, especially concerning forest loss and its potential association with anthropogenic expansion.
The analysis also emphasizes the significance of considering areas with low and very low feasibility for conservation processes. While these regions may not manifest as high an impact level as their more feasible counterparts, they retain their value for biodiversity conservation and ecosystem protection.
Furthermore, the prioritization of watershed and soil restoration as the most significant landscape restoration activity among landowners has been identified. This prioritization is driven by the desire to enhance water-related ecosystem services. However, potential discrepancies arise from the findings, as social mapping reveals a limited allocation of areas for this purpose. These discrepancies highlight the need for further exploration, particularly concerning the cost–opportunity aspects of production –conservation and concerns over potential displacements and expropriations of ecologically significant areas under conservation.
The synthesis of multidisciplinary approaches, incorporating methodologies such as ROAM, elicitation, and MCSA processes, has provided a comprehensive understanding of landscape restoration complexities in Belmira. This understanding facilitates the identification of areas with a high restoration potential at the property level, enabling effective prioritization and investment allocation for future implementation.
It is worth noting that the suitability map for landscape restoration through AEMC can be developed based on assessments of various variables, giving greater weight to important aspects such as ecosystem characteristics, ecosystem service gains, biodiversity, or the search for best sustainable use practices. This can be conducted by different stakeholders, including government entities, the private sector, and communities, among others. This process may or may not broaden the perspective, potentially altering the weighting developed in the model applied in this paper. The results can offer alternative viewpoints to the process and varied conclusions.

Supplementary Materials

The following supporting information can be downloaded at: https://www.mdpi.com/article/10.3390/f14091913/s1, Table S1: Summary of the environmental, social, economic, and governance characteristics, as well as some historical facts of the municipality of Belmira; Table S2: Variables used in the MCSA model. For variables like V04, although their use was not explicitly found as defined in this study, there are other studies that use variables measuring water importance. Regarding V06, the author performs an analysis of the importance of this variable but does not conduct a spatial study. As for V07, no study was found that relates it to the definition of restoration areas; Table S3: Fundamental comparison scale for the assessment of elements; Table S4: Proposed landscape restoration activities concerning changes in land cover between 2010 and 2020 in the study area. This relationship is assumed for the creation of the landscape restoration activity map, which is overlaid with the feasibility map of activities; Table S5: Prioritization matrix for defining suitable areas for landscape restoration, according to AHP (analytic hierarchy process). The values within the matrix represent the average of the importance ratings among variables, based on expert evaluations. The horizontal and vertical sum values are the product of matrix analysis. The priority vector displays the results of variable weights; Table S6: Land-cover change matrix between 2010 and 2020. It mainly highlights the forest losses, which amount to a total of approximately 43 ha, compared to the transition to pastures, which amount to a total of 89 ha; Table S7: Change in land-cover classes between 2010 and 2020, with their respective landscape restoration activities assigned. Some of the values that show 0.00% are because there is an area, but its representation in percentage relative to the total area (ha) is very low; Table S8: Activities and feasibility assessment for landscape restoration within the study area. Approximately 4% of the area is considered to have a medium-to-very-high feasibility for ecological restoration. In terms of sustainable use, 55.7% of the area has a medium-to-very-high feasibility. Regarding preservation, the total value is 15.8% of the entire area, associated with areas of forests of high interest; Table S9: Summary of the distribution of detailed and general landscape restoration activities in each of the properties evaluated through social cartography processes. References [74,75,76] are cited in the Supplementary Materials.

Author Contributions

Conceptualization, C.B.-C. and J.G.-M.; methodology, C.B.-C.; software, C.B.-C. and J.G.-M.; validation, C.B.-C. and J.G.-M.; formal analysis, C.B.-C. and J.G.-M.; investigation, C.B.-C. and J.G.-M.; resources, C.B.-C. and J.G.-M.; data curation, C.B.-C. and J.G.-M.; writing—original draft preparation, C.B.-C.; writing—review and editing, C.B.-C.; visualization, C.B.-C. and J.G.-M.; supervision, C.B.-C.; project administration, C.B.-C.; funding acquisition, C.B.-C. All authors have read and agreed to the published version of the manuscript.

Funding

This research was funded by the Instituto Tecnológico Metropolitano (ITM) and South Pole through the project P20244: “Priorización de zonas para la restauración ecológica y de uso público mediante la armonización de técnicas de mapeo participativo y modelación espacial multicriterio en el municipio de Belmira, Antioquia, Colombia”.

Institutional Review Board Statement

The study was conducted in accordance with the Declaration of Helsinki and was approved by the Institutional Ethics Committee of Instituto Tecnológico Metropolitano under protocol code 982, with approval granted on 1 June 2021.

Informed Consent Statement

Informed consent was obtained from all subjects involved in the study.

Data Availability Statement

The data and R code for the elicitation process are available at: https://figshare.com/s/5f43f0c5946a5848a357 (accessed on 27 July 2023).

Acknowledgments

The authors extend their sincere gratitude to the Instituto Tecnológico Metropolitano (ITM) and South Pole for their support through the project P20244. J.G.-M. would like to thank researcher Cristian David Ramírez Sosa for his guidance on the project from which this paper originates. Authors included in this section have consented to the acknowledgements.

Conflicts of Interest

The authors declare no conflict of interest.

References

  1. Gann, G.D.; McDonald, T.; Walder, B.; Aronson, J.; Nelson, C.R.; Jonson, J.; Hallett, J.G.; Eisenberg, C.; Guariguata, M.R.; Liu, J.; et al. International principles and standards for the practice of ecological restoration. Restor. Ecol. 2019, 27, S1–S46. [Google Scholar] [CrossRef]
  2. Brancalion, P.H.S.; Niamir, A.; Broadbent, E.; Crouzeilles, R.; Barros, F.S.M.; Almeyda Zambrano, A.M.; Baccini, A.; Aronson, J.; Goetz, S.; Leighton Reid, J.; et al. Global restoration opportunities in tropical rainforest landscapes. Sci. Adv. 2019, 5, eaav3223. [Google Scholar] [CrossRef] [PubMed]
  3. Millennium Ecosystem Assessment. Guide to the Millennium Assessment Reports. 2005. Available online: https://www.millenniumassessment.org/en/index.html (accessed on 19 May 2022).
  4. United Nations Environment Programme. Becoming #GenerationRestoration. Ecosystem Restoration for People, Nature and Climate. 2021. Available online: https://wedocs.unep.org/bitstream/handle/20.500.11822/36251/ERPNC.pdf (accessed on 1 July 2022).
  5. Besseau, P.; Graham, S.; Christophersen, T. (Eds.) Restoring Forests and Landscapes: The Key to a Sustainable Future; Global Partnership on Forest and Landscape Restoration: Vienna, Austria, 2018. [Google Scholar]
  6. Rietbergen-McCracken, J.; Maginnis, S.; Alastair, S. (Eds.) The Forest Landscape Restoration Handbook; Taylor & Francis: New York, USA, 2007. [Google Scholar]
  7. Mansourian, S.; Vallauri, D.; Dudley, N. Forest Restoration in Landscapes. Beyond Planting Trees; Springer Science & Business Media: New York, NY, USA, 2005; p. 35. [Google Scholar]
  8. Mansourian, S.; Berrahmouni, N.; Blaser, J.; Dudley, N.; Maginnis, S.; Mumba, M.; Vallauri, D. Reflecting on twenty years of forest landscape restoration. Restor. Ecol. 2021, 29, 7. [Google Scholar] [CrossRef]
  9. Favretto, N.; Stringer, L.C.; Dougill, A.J.; Kruger, L. Knowledge exchange enhances engagement in ecological restoration and rehabilitation initiatives. Restor. Ecol. 2022, 30, e13565. [Google Scholar] [CrossRef]
  10. Swart, J.A.; Zevenberg, J.; Ho, P.; Cortina, J.; Reed, M.; Derak, M.; Vella, S.; Zhao, H.; van der Windt, H.J. Involving society in restoration and conservation. Restor. Ecol. 2018, 26, S3–S6. [Google Scholar] [CrossRef]
  11. Qu, Y.; Sun, G.; Luo, C.; Zeng, X.; Zhang, H.; Murray, N.; Xu, N. Identify ingrestoration priorities for wetlands based on historical distributions of biodiversity features and restoration suitability. J. Environ. Manag. 2019, 231, 1222–1231. [Google Scholar] [CrossRef]
  12. De Matos, T.P.V.; De Matos, V.P.V.; De Mello, K.; Valente, R.A. Protected areas and forest fragmentation: Sustainability index for prioritizing fragments for landscape restoration. Geol. Ecol. Landsc. 2021, 5, 19–31. [Google Scholar] [CrossRef]
  13. Terêncio, D.P.S.; Varandas, S.G.P.; Fonseca, A.R.; Cortes, R.M.V.; Fernandes, L.F.; Pacheco, F.A.L.; Monteiro, S.M.; Martinho, J.; Cabral, J.; Santos, J.; et al. Integrating ecosystem services into sustainable landscape management: A collaborative approach Science of the Total Environment Integrating ecosystem services into sustainable landscape management: A collaborative approach. Sci. Total Environ. 2021, 794, 148538. [Google Scholar] [CrossRef]
  14. Gonzalez, A.; Enríquez-de-Salamanca, Á. Spatial Multi-Criteria Analysis in Environmental Assessment: A Review and Reflection on Benefits and Limitations. J. Environ. Assess. Policy Manag. 2018, 20, 1840001. [Google Scholar] [CrossRef]
  15. Malczewski, J.; Jankowski, P. Emerging trends and research frontiers in spatial multicriteria analysis. Int. J. Geogr. Inf. Sci. 2020, 34, 1257–1282. [Google Scholar] [CrossRef]
  16. Kemppinen, K.M.S.; Collins, P.M.; Hole, D.G.; Wolf, C.; Ripple, W.J.; Gerber, L.R. Global reforestation and biodiversity conservation. Conserv. Biol. 2020, 34, 1221–1228. [Google Scholar] [CrossRef] [PubMed]
  17. Luther, D.; Beatty, C.R.; Cooper, J.; Cox, N.; Farinelli, S.; Foster, M.; Lamoreux, J.; Stephenson, P.J.; Brooks, T.M. Global assessment of critical forest and landscape restoration needs for threatened terrestrial vertebrate species. Glob. Ecol. Conserv. 2020, 24, e01359. [Google Scholar] [CrossRef]
  18. Mappin, B.; Chauvenet, A.L.M.; Adams, V.M.; Di Marco, M.; Beyer, H.L.; Venter, O.; Halpern, B.S.; Possingham, H.P.; Watson, J.E.M. Restoration priorities to achieve the global protected area target. Conserv. Lett. 2019, 12, 534. [Google Scholar] [CrossRef]
  19. Erbaugh, J.T.; Pradhan, N.; Adams, J.; Oldekop, J.A.; Agrawal, A.; Brockington, D.; Pritchard, R.; Chhatre, A. Global forest restoration and the importance of prioritizing local communities. Nat. Ecol. Evol. 2020, 4, 1472–1476. [Google Scholar] [CrossRef] [PubMed]
  20. Bastin, J.-F.; Finegold, Y.; Garcia, C.; Mollicone, D.; Rezende, M.; Routh, D.; Zohner, C.M.; Crowther, T.W. The global tree restoration potential. Science 2019, 365, 76–79. [Google Scholar] [CrossRef]
  21. Laestadius, L.; Maginnis, S.; Minnemeyer, S.; Potapov, P.; Saint-Laurent, C.; Sizer, N. Mapping opportunities for forest landscape restoration. Unasylva 2011, 62, 47–48. [Google Scholar]
  22. Strassburg, B.B.N.; Beyer, H.L.; Crouzeilles, R.; Iribarrem, A.; Barros, F.; de Siqueira, M.F.; Sánchez-Tapia, A.; Balmford, A.; Sansevero, J.B.B.; Brancalion, P.H.S.; et al. Strategic approaches to restoring ecosystems can triple conservation gains and halve costs. Nat. Ecol. Evol. 2019, 3, 62–70. [Google Scholar] [CrossRef]
  23. Van Der Esch, S.; Sewell, A.; Bakkenes, M.; Doelman, J.; Langhans, E.S.; Bouwman, A.; Brink, B.; Berkhout, E. The Global Potential for Land Restoration: Scenarios for the Global Land Outlook 2; Policy Report; PBL Netherlands Environmental Assessment Agency: The Hague, Netherlands, 2022; Available online: www.pbl.nl/en (accessed on 1 July 2022).
  24. Di Sacco, A.; Hardwick, K.A.; Blakesley, D.; Brancalion, P.H.S.; Breman, E.; Cecilio Rebola, L.; Chomba, S.; Dixon, K.; Elliott, S.; Ruyonga, G.; et al. Ten golden rules for reforestation to optimize carbon sequestration, biodiversity recovery and livelihood benefits. Glob. Chang. Biol. 2021, 27, 1328–1348. [Google Scholar] [CrossRef]
  25. César, R.G.; Belei, L.; Badari, C.G.; Viani, R.A.G.; Gutierrez, V.; Chazdon, R.L.; Brancalion, P.H.S.; Morsello, C. Forest and landscape restoration: A review emphasizing principles, concepts, and practices. Land 2021, 10, 28. [Google Scholar] [CrossRef]
  26. Edrisi, S.A.; Abhilash, P.C. Need of transdisciplinary research for accelerating land restoration during the UN Decade on Ecosystem Restoration. Restor. Ecol. 2021, 29, 8. [Google Scholar] [CrossRef]
  27. Bullock, J.M.; Fuentes-Montemayor, E.; McCarthy, B.; Park, K.; Hails, R.S.; Woodcock, B.A.; Watts, K.; Corstanje, R.; Harris, J. Future restoration should enhance ecological complexity and emergent properties at multiple scales. Ecography 2022, 4, 1–11. [Google Scholar] [CrossRef]
  28. Fagan, M.E.; Reid, J.L.; Holland, M.B.; Drew, J.G.; Zahawi, R.A. How feasible are global forest restoration commitments? Conserv. Lett. 2020, 13, e12700. [Google Scholar] [CrossRef]
  29. Johnson, C.J.; Drew, C.A.; Perera, A.H. Elicitation and Use of Expert Knowledge in Landscape Ecological Applications: A Synthesis. In Expert Knowledge and Its Application in Landscape Ecology; Springer: New York, NY, USA, 2012; pp. 279–299. [Google Scholar] [CrossRef]
  30. Orsi, F.; Geneletti, D.; Newton, A.C. Towards a common set of criteria and indicators to identify forest restoration priorities: An expert panel-based approach. Ecol. Indic. 2011, 11, 337–347. [Google Scholar] [CrossRef]
  31. Lim, V.C.; Justine, E.V.; Yusof, K.; Mohamad Ariffin, W.N.S.W.; Goh, H.C.; Fadzil, K.S. Eliciting local knowledge of ecosystem services using participatory mapping and Photovoice: A case study of Tun Mustapha Park, Malaysia. PLoS ONE 2021, 16, e0253740. [Google Scholar] [CrossRef]
  32. Duarte Hernández, D.; Avella Muñoz, E.A. Análisis socio-ecológico de una iniciativa de restauración liderada por autoridades ambientales en Santander, Colombia. Colomb. For. 2018, 22, 68–86. [Google Scholar] [CrossRef]
  33. Brancalion, P.H.S.; Holl, K.D. Guidance for successful tree planting initiatives. J. Appl. Ecol. 2020, 57, 2349–2361. [Google Scholar] [CrossRef]
  34. Holl, K.D.; Brancalion, P.H.S. Tree planting is not a simple solution. Science 2020, 368, 580–581. [Google Scholar] [CrossRef]
  35. Liebman, M.; Paulston, R.G. Social Cartography: A new methodology for comparative studies. Comp. A J. Comp. Int. Educ. 1994, 24, 233–245. [Google Scholar] [CrossRef]
  36. O’Hagan, A. Expert Knowledge Elicitation: Subjective but Scientific. Am. Stat. 2019, 73, 69–81. [Google Scholar] [CrossRef]
  37. IDEAM; Instituto Humbolt; INVEMAR; IGAC. Mapa de ecosistemas continentales, costeros y marinos de Colombia. Escala 1:100.000; Memoria técnica; IDEAM: Bogotá, Colombia, 2017. Available online: http://www.ideam.gov.co/web/ecosistemas (accessed on 6 June 2022).
  38. CORANTIOQUIA. Aunar esfuerzos para realizar los estudios de amenaza, vulnerabilidad y riesgo, en municipios de la región norte de Antioquia. Convenio interadministrativo de Asociación: Departamento de Antioquia-Departamento Administrativo de Planeación-Corantioquia; Reporte; CORANTIOQUIA: Medellín, Colombia, 2015. Available online: https://www.corantioquia.gov.co/ciadoc/flora/AIRNR_CV_1409_68_2014.pdf (accessed on 7 June 2022).
  39. Bolaños-Valencia, I.; Villegas-Palacio, C.; López-Gómez, C.P.; Berrouet, L.; Ruiz, A. Social perception of risk in socio-ecological systems. A qualitative and quantitative analysis. Ecosyst. Serv. 2019, 38, 65. [Google Scholar] [CrossRef]
  40. Laestadius, L.; Maginnis, S.; Rietbergen-Mccracken, J.; Saint-Laurent, C.; Shaw, D.; Verdone, M. Guía sobre la metodología de evaluación de oportunidades de restauración (ROAM). Evaluación de las Oportunidades de Restauración del Paisaje Forestal a Nivel Nacional o Subnacional; IUCN and WRI; IUCN: Gland, Suiza, 2014; Available online: https://portals.iucn.org/library/sites/library/files/documents/2014-030-Es.pdf (accessed on 24 March 2022).
  41. McLain, R.; Lawry, S.; Guariguata, M.R.; Reed, J. Integración de la tenencia y la gobernanza en las evaluaciones de oportunidades de restauración del paisaje forestal. CIFOR Infobrief. 2019, 244, 1–8. [Google Scholar] [CrossRef]
  42. Catastro Antioquia. Catastro en Línea. Información geográfica del municipio de Belmira, Antioquia. In Gobernación de Antioquia; 2021. Available online: https://www.catastroantioquia.co/ (accessed on 13 April 2022).
  43. Berrouet, L.; Villegas-Palacio, C.; Botero, V. Vulnerability of Rural Communities to Change in an Ecosystem Service Provision: Surface water supply. A Case Study in the Northern Andes, Colombia. Land Use Policy 2020, 97, 104737. [Google Scholar] [CrossRef]
  44. Suarez-Pardo, A.; Villegas-Palacio, C.; Berrouet, L. Resilience in Agroecosystems: An Index Based on a Socioecological Systems Approach. Wea. Climate Soc. 2022, 14, 425–438. [Google Scholar] [CrossRef]
  45. Tobón, C. Ecohydrology of Tropical Andean Cloud Forests. In The Andean Cloud Forest; Myster, R.W., Ed.; Springer Nature: Basel, Switzerland, 2021; pp. 61–87. [Google Scholar] [CrossRef]
  46. Vera Ramirez, P.Y. Trade Off Entre Servicios Ecosistémicos y sus Implicaciones en el Diseño de un Esquema de Pagos por Servicios Ambientales. Master’s Thesis, Universidad Nacional de Colombia—Sede Medellín, Medellín, Colombia, 2018. Available online: http://bdigital.unal.edu.co/71159/ (accessed on 27 September 2022).
  47. Correa, V.; Sanín, M.J.; Tuberquia, D. Transición bosque altoandino—páramo: Composición, estructura y fisonomía de la vegetación en la Cordillera Central de Colombia. Caldasia 2023, 45, 174–186. [Google Scholar] [CrossRef]
  48. Castaño Espinal, J.R. Evaluación de la Dinámica Asociada a los Principales Grupos de Interés y los Servicios Ecosistémicos Como Aporte a la Actualización del Plan de Manejo del Distrito de Manejo Integrado (DMI) del Sistema de Páramos y Bosques Altoandinos del Noroccidente Medellín. Master’s Thesis, Instituto Tecnológico Metropolitano—ITM, Medellín, Colombia, 2020. [Google Scholar]
  49. Gonzalez, M.; Jose, L. Zonas Prioritarias Para Restauración del Paisaje en Belmira, Antioquia, Colombia. Master’s Thesis, Instituto Tecnológico Metropolitano ITM, Medellín, Colombia, 2022. [Google Scholar]
  50. Camelo, O. Determinantes Ambientales y de Uso de la Tierra de la Recuperación de los Bosques en una Matriz de Paisaje Antrópico: Cuenca del Río Grande—Antioquia. Master’s Thesis, Universidad Nacional de Colombia—Sede Medellín, Medellín, Colombia, 2015. [Google Scholar]
  51. Diez-Gómez, M.C.D.; Sepúlveda, Y.L.; Moreno, F. Desarrollo inicial del roble andino en respuesta al manejo en vivero y durante la plantación. Colomb. For. 2017, 20, 118–130. [Google Scholar] [CrossRef]
  52. Camelo, O.; Urrego, L.E.; Orrego, S.A. Environmental and socioeconomic drivers of woody vegetation recovery in a human-modified landscape in the Rio Grande basin (Colombian Andes). Restor. Ecol. 2017, 25, 912–921. [Google Scholar] [CrossRef]
  53. Saaty, R. The analytic hierarchy process—What it is and How it is used. Math. Model. 1987, 9, 161–176. [Google Scholar] [CrossRef]
  54. Rahman, M.R.; Shi, Z.H.; Chongfa, C. Assessing regional environmental quality by integrated use of remote sensing, GIS, and spatial multi-criteria evaluation for prioritization of environmental restoration. Environ. Monit. Assess. 2014, 186, 6993–7009. [Google Scholar] [CrossRef]
  55. Aznar Bellver, J.; Guijarro Martínez, F. Nuevos Métodos de Valoración. Modelos Multicriterio; Universitat Politècnica de València: Valencia, España, 2012. [Google Scholar]
  56. Saaty, T.L. The Analytic Hierarchy Process; McGraw-Hill: New York, NY, USA, 1980. [Google Scholar]
  57. Isaacs-Cubides, P.J.; Aguilar Garavito, M.; Rojas, T.; Marín, W.; Correa Aya, C.A.; Díaz Timote, J.; Ramiréz, W.; Garay, J.; Rodríguez, C.; Rodríguez, J.; et al. Restauración del Paisaje en la Amazonia Colombiana. 2020. Available online: http://reporte.humboldt.org.co/biodiversidad/2019/cap4/402/#seccion10 (accessed on 20 January 2022).
  58. ESRI. Data Classification Methods: Natural Breaks (Jenks). 2021. Available online: https://pro.arcgis.com/en/pro-app/latest/help/mapping/layer-properties/data-classification-methods.htm (accessed on 8 November 2022).
  59. Noth, T.; Rinner, C. Prioritization in wildfire restoration using gis-based ordered weighted averaging (Owa): A case study in southern california. AIMS Environ. Sci. 2021, 8, 481–497. [Google Scholar] [CrossRef]
  60. Garthwaite, P.H.; Kadane, J.B.; Hagan, A.O. Statistical Methods for Eliciting Probability Distributions. J. Am. Stat. Assoc. 2005, 100, 680–701. [Google Scholar] [CrossRef]
  61. Correa-Morales, J.C.; Barrera-Causil, C. Elicitation of the parameters of multiple linear models. Rev. Colomb. Estad. 2021, 44, 159–170. [Google Scholar] [CrossRef]
  62. Alcaldía de Belmira Antioquia. Programa de Gobierno. In Periodo 2020–2023 Belmira, es Hora de Avanzar; Alcaldía de Belmira: Belmira, Colombia, 2020. [Google Scholar]
  63. Newton, A.C.; Tejedor, N. Principles and Practice of Forest Landscape Restoration: Case Studies from the Drylands of Latin America; IUCN: Gland, Switzerland, 2011; Available online: https://portals.iucn.org/library/node/9872 (accessed on 24 March 2022).
  64. Martínez-Flórez, G.; Elal-Olivero, D.; Barrera-Causil, C. Extended Generalized Sinh-Normal Distribution. Mathematics 2021, 9, 2793. [Google Scholar] [CrossRef]
  65. Robertson, H.T.; Allison, D.B. A novel generalized normal distribution for human longevity and other negatively skewed data. PLoS ONE 2012, 7, e37025. [Google Scholar] [CrossRef]
  66. Correa-Morales, J.C.; Barrera-Causil, C.J. Introducción a la Estadística Bayesiana; Fondo Editorial ITM: Medellín, Colombia, 2018; p. 222. [Google Scholar] [CrossRef]
  67. Hernández-Gómez, R.C.; Cantillo-Higuera, E. La restauración ecológica como estrategia de construcción social en la Vereda Chipautá, Municipio de Guaduas, Cundinamarca. Ambiente Desarro. 2019, 22, 1–15. [Google Scholar] [CrossRef]
  68. Gil Grandett, N.I.; Ayola Gómez, I.J. La cartografía participativa como herramienta para la acción política, dos estudios de caso en espacios rurales y urbanos en Colombia. Rev. Del Dep. De Geogr. FFyH–UNC–Argent. 2019, 12, 290–316. [Google Scholar]
  69. Borda-Niño, M.; Ceccon, E.; Meli, P.; Hernández-Muciño, D.; Mas, J.F.; Brancalion, P.H.S. Integrating farmers’ decisions on the assessment of forest regeneration drivers in a rural landscape of Southeastern Brazil. Perspect. Ecol. Conserv. 2021, 19, 338–344. [Google Scholar] [CrossRef]
  70. Delzeit, R.; Pongratz, J.; Schneider, J.M.; Schuenemann, F.; Mauser, W.; Zabel, F. Forest restoration: Expanding agriculture. Science 2019, 366, 315. [Google Scholar] [CrossRef] [PubMed]
  71. Von Holle, B.; Yelenik, S.; Gornish, E.S. Restoration at the landscape scale as a means of mitigation and adaptation to climate change. Curr. Landsc. Ecol. Rep. 2020, 5, 85–97. [Google Scholar] [CrossRef]
  72. Camargo Ponce de León, G.; Guerrero Ruiz, G.A. Lineamientos Técnicos Para la Declaratoria y Gestión de Zonas Amortiguadoras (Parques Nacionales Naturales de Colombia (Ed.)); Panamericana Formas e Impresos S.A.: Bogotá, Colombia, 2005. [Google Scholar]
  73. Salazar Moncada, P.A. Evaluación de los Servicios Ecosistémicos Culturales Asociados al Páramo de Santa Inés en el Municipio de Belmira—Antioquia. Master’s Thesis, Instituto Tecnológico Metropolitano ITM, Medellín, Colombia, 2019. [Google Scholar]
  74. Uribe, D.; Geneletti, D.; Del Castillo, R.F.; Orsi, F. Integrating stakeholder preferences and GIS. Based Multicriteria Analysis to Identify Forest Landscape Restoration Priorities. Sustainability 2014, 6, 935–951. [Google Scholar] [CrossRef]
  75. Niemiec, R.M.; Willer, R.; Ardoin, N.M.; Brewer, F.K. Motivating landowners to recruit neighbors for private land conservation. Conserv. Biol. 2019, 33, 930–941. [Google Scholar] [CrossRef] [PubMed]
  76. Aguirre-Salado, C.A.; Miranda-Aragón, L.; Pompa–García, M.; Reyes-Hernández, H.; Soubervielle-Montalvo, C.; Flores-Cano, J.A.; Méndez–Cortés, H. Improving identification of areas for ecological restoration for conservation by integrating USLE and MCDA in a gis-environment: A pilot study in a priority region northern Mexico. ISPRS Int. J. Geo-Inf. 2017, 6, 9. [Google Scholar] [CrossRef]
Figure 1. Study area obtained through the integration of various spatial criteria, including administrative boundaries (municipal and protected area) and ecological features (biome). It is located within the northern Chicó River basin, cutting through the zone from northwest to southeast. The Chicó River is a highly significant environmental and social element in the study area.
Forests 14 01913 g001
Figure 2. Visual summary of the multiple stakeholders, commercial and subsistence activities, conservation instrument, and generalities of the Belmira complex study area.
Forests 14 01913 g002
Figure 3. Feasibility map of landscape restoration areas in the research area. The red areas are mainly concentrated around the Chicó River watershed, as well as in the La Miel and Playas rural settlements. There are also notable areas of interest around the municipal headwaters, towards the Río Arriba rural settlement. Other areas of interest are evident along the drainage systems, in the San José and El Pantano creek rural settlements, as well as in the El Yuyal rural settlement.
Forests 14 01913 g003
Figure 4. Map of landscape restoration feasibility and activities in the research area. The areas with the highest feasibility for ecological restoration activities are in the La Miel and San José rural settlements. Other areas of interest for this activity are found in the Playas rural settlement. Regarding conservation activities, although there is a prioritization ranging from very low to very high, they are of great interest. The areas with a very high priority for sustainable use are mainly concentrated in the Chicó River micro-watershed.
Forests 14 01913 g004
Figure 5. A priori elicited distributions of the level of importance for activities independent of the property under study. It is evident that the activity A3 concentrates its density curve around values close to 1 of the importance level (probability) with a strong left skewness.
Forests 14 01913 g005
Figure 6. Landscape restoration activities harmonization map for Property ID 2. The 6 priorities defined on the property are presented. CS: social cartography, MA: multitemporal analysis, MCSA: multicriteria spatial analysis.
Forests 14 01913 g006
Figure 7. Landscape restoration activities implementation strategy proposed based on the harmonization process information, for Property ID 2. The left image highlights potential areas for nature tourism, birdwatching (green), and glamping (orange). In yellow, the areas for A3: Restoration of basins and soils are shown, in relation to water source areas, within high feasibility zones. In blue, for both images, the potential wetland area is visually delimited. In the right image, the wetland areas (blue) are evident towards the east, as well as the living fences (green line) that the owner would consider implementing. Additionally, the orange circle highlights the livestock, which uses the wetland area. The owner intends to implement paddock rotation processes (blue arrows). The black arrow indicates north in the figure.
Forests 14 01913 g007
Table 1. List of properties evaluated in the study area. It is noteworthy that, on one hand, almost 45% of the sampled area is in the Río Arriba rural settlement, while, for example, only 0.79% is sampled in the La Miel rural settlement.
ID Property AreaArea
(ha)
Area
(%)
Rural SettlementsID Property AreaArea
(ha)
Area
(%)
Rural Settlements
16.411.53%San José 83.700.88%San José
218.764.47%Santo Domingo 986.8820.72%Río Arriba
353.7412.81%Santo Domingo 103.330.79%La Miel
415.573.71%El Yuyal112.550.61%El Yuyal
57.931.89%Playas 12107.4525.62%Río Arriba
63.330.79%Playas 1382.7319.73%Río Arriba
722.615.39%San José 144.401.05%El Yuyal
419.37100.00%
Table 2. Summary of weights for each variable in the MCSA model for obtaining the feasibility map of areas for landscape restoration. The variables with higher weights are related to an ecological criterion (except for V04, which, although it has a strong ecological relationship, also has socioeconomic importance). The variables with a socioeconomic criterion account for a total of 9%, and the variables with a mixed criterion account for 45%.
VariableCriterionWeight (%)
V02—Erosion and landslidesEcological
(Enhancement of ecosystem services)
22%
V04—Water importanceEcological/Socioeconomic20%
V01—Land coverEcological/Socioeconomic17%
V05—Ecological connectivityEcological16%
V03—FloodingEcological
(Enhancement of ecosystem services)
8%
V09—Distance to forest lossEcological/Socioeconomic8%
V07—Properties with living fencesSocioeconomic
(Territorial context)
4%
V08—Density of constructions Socioeconomic
(Territorial context)
3%
V06—Properties with conservation processesSocioeconomic
(Territorial context)
2%
Table 3. A priori estimation of certain parameters in the beta probability models elicited by activity regarding the level of importance of each. α: number of successes, β: number of failures, SD: standard deviation, IQR: interquartile range, Min: minimum value, Max: maximum value. Note: The parameters α and β represent the number of successes and failures, respectively, in a binomial process.
ActivityαβMeanMedianSDIQRMinMax
A12.640.170.9450.9970.1120.04880.1901
A22.600.180.9350.9940.1270.06250.0881
A33.070.080.9741.0000.0800.00600.1311
A42.560.200.9310.9910.1280.07160.2051
A52.560.200.9230.9890.1380.08680.0751
Table 4. Equivalence between the activities evaluated in both the elicitation and social mapping processes, and the general landscape restoration activities. Certain activities such as trout farming were not included in the evaluation but were mentioned by the communities. It is assumed that this activity would be part of the sustainable use category.
Activities
Landscape RestorationEvaluated through EKEOther Proposals by Landowners in Social Mapping
ConservationA4: Nature tourism *
A5: Birdwatching *
-
Wetland conservation
-
Forest conservation
-
Riparian forest remnants conservation
-
Maintenance of water sources
Ecological RestorationA3: Watershed and soil restoration
-
Enrichment of areas with native species
-
Enrichment of water sources and/or drainage areas with native species
-
Enrichment of areas with secondary vegetation
-
Restoration with riparian vegetation
-
Restoration in water source areas and important water bodies
-
Restoration in current/old erosion areas
Sustainable UseA1: Living fences
A2: Crop rotation
A4: Nature tourism
A5: Birdwatching
-
Trout farming
-
Sustainable livestock (conditional)
-
Glamping-type initiatives
-
Avocado cultivation
* Note: A4 and A5 activities are categorized under both conservation and sustainable use.
Table 5. Comparison of landscape restoration activity results obtained for Property ID 2 using MCSA and multitemporal analysis, and social mapping.
Social Mapping
ActivityConservationEcological RestorationSustainable UseInfrastructure (No Activity)Total (ha)Total (%)
Conservation4.480.170.38 5.0426.97%
Ecological restoration1.430.490.08 2.0110.75%
Sustainable use0.120.4610.680.2311.4861.50%
Infrastructure0.10 0.05 0.150.78%
Total (ha)6.131.1311.190.2318.67100%
Total (%)32.83%6.02%59.92%1.22%100%
Disclaimer/Publisher’s Note: The statements, opinions and data contained in all publications are solely those of the individual author(s) and contributor(s) and not of MDPI and/or the editor(s). MDPI and/or the editor(s) disclaim responsibility for any injury to people or property resulting from any ideas, methods, instructions or products referred to in the content.

