Article

Long Exposure to Salt Stress in Jatropha curcas Leads to Stronger Damage to the Chloroplast Ultrastructure and Its Functionality Than the Stomatal Function

1
Chongqing City Vocational College, Intelligent Construction Technology Application Service Center, Chongqing 404100, China
2
Grupo Regional de Investigación Participativa de los Pequeños Productores de la Costa Atlantica, Universidad de Córdoba, Montería 360002, Córdoba, Colombia
3
Rio Paranaíba Campus, Universidade Federal de Viçosa, Rio Paranaíba 38810-000, MG, Brazil
4
Departamento de Biologia Vegetal, Universidade Federal de Viçosa, Viçosa 56570-000, MG, Brazil
*
Authors to whom correspondence should be addressed.
Forests 2023, 14(9), 1868; https://doi.org/10.3390/f14091868
Submission received: 27 July 2023 / Revised: 25 August 2023 / Accepted: 11 September 2023 / Published: 13 September 2023
(This article belongs to the Section Forest Ecophysiology and Biology)

Abstract

:
As sessile organisms, plants face a wide range of abiotic stresses, with salinity being a significant condition affecting their growth, development, and productivity, particularly in arid and semi-arid regions. This study focused on understanding how salinity impacts Jatropha curcas, an important oilseed plant for the production of biodiesel. By examining the anatomy and ultrastructure of stomata and chloroplasts, we investigated the effects of prolonged salinity stress on J. curcas. This stress led to changes in the stomatal density, stomatal index, and ostiole aperture, which can cause an imbalance of water conductivity in the xylem. Through transmission electron microscopy, we explored the subcellular organization of J. curcas chloroplasts and their contribution to plant photosynthetic efficiency, providing insights into their role in this process. Notably, increases in salinity resulted in a significant increase in starch granule accumulation, leading to impaired granal and stromal grana lamellae, destroying this ultrastructure. Our findings indicate that the anatomy and ultrastructure of chloroplasts play a crucial role in influencing photosynthetic efficiency. Moreover, impaired hydraulic conductivity due to salinity and a lesser osmotic potential in vessels may cause a reduced source-to-sink relationship, which increases starch accumulation in the chloroplast and influences the ultrastructure of the chloroplast. This study offers a new perspective on the structure and function of chloroplasts in J. curcas, presenting innovative opportunities to develop strategies that enhance the production of biofuel in areas with high soil salinity.

Graphical Abstract

1. Introduction

Jatropha curcas, a globally cultivated plant, has gained recognition for its ability to thrive with a meager amount of water [1,2,3,4,5]. This remarkable attribute not only provides drought tolerance but also highlights its impressive salt tolerance [6,7,8,9,10]. J. curcas can tolerate high salinity levels in the soil, making it suitable for cultivation in coastal areas and regions with saline water sources [11,12,13]. Additionally, this plant exhibits rapid growth, enabling it to establish itself quickly in a variety of environments. Its adaptation to harsh agroclimatic conditions further enhances its desirability as a cultivated crop. J. curcas is highly valued by farmers and researchers, as it offers a sustainable solution for areas facing water scarcity and challenging climatic conditions, contributing to agricultural resilience and productivity [11].
Salinity is an environmental factor that can negatively affect plant growth and production. Recent studies have evaluated the effects of salinity on the stomatal density, stomatal index, photosynthetic efficiency, and leaf mesophyll of Jatropha curcas plants [14,15,16,17]. Exposure to salinity significantly reduced the stomatal density and stomatal index, which then negatively affected the photosynthetic efficiency. Altogether, the reduction in stomatal density may be one of the main causes for the decrease in photosynthetic efficiency in J. curcas under salt stress [14]. These results are important items that must be considered in order to understand how salinity affects plant physiology as well as to obtain more information for understanding the development of genetic improvement strategies to make the plant more tolerant to salinity.
Gas exchange is influenced by a series of factors that are both environmental and internal to the plant [18]. Under water/saline stress, there is usually a lower flow of water from the roots to the leaves, causing them to decrease the stomatal opening for CO2 uptake [16,19,20,21,22]. As CO2 is the fuel for photosynthesis, lower uptake generally leads to lower photosynthetic rates. However, other factors may have an equal or greater magnitude in influencing the modulation of photosynthesis magnitude. Under salinity, for example, as root cells absorb salt ions, their osmotic potential is reduced, which further reduces the uptake of water from the soil [6] as well as its transmission to the leaves, a process that is called hydraulic conductivity (Kp) [23,24]. Furthermore, a simple increase in CO2 uptake by the stomata does not necessarily directly result in an increase in gas exchange, since CO2 crosses several physical barriers before reaching the RuBisCo carboxylation site [25,26,27,28], a process called mesophilic conductance, which is analogous to stomatal conductance that is given by the change in CO2 uptake by the stomata. However, other processes can modulate photosynthesis, such as a decrease in or inactivation of enzymes in the Calvin–Benson cycle [14,22,27,28,29,30] or even the disruption of the chloroplast architecture [15,17,31,32,33,34,35]. The integrity and functionality of the electron transport system are crucial in the intricate process of photosynthesis, encompassing the journey from the adsorption of water to the generation of NADPH and ATP in the photochemical stage and ultimately leading to the formation of triose phosphate [36]. It is imperative to maintain the integrity of the chloroplasts’ ultrastructure to ensure an efficient utilization of captured electrons by a receiver system primarily composed of chlorophylls. These electrons are utilized in the reduction of NADP+, which transforms into its reduced form, NADPH. The resulting NADPH plays a vital role in the Calvin–Benson cycle, driving the assimilation of carbon dioxide and facilitating the synthesis of organic molecules. Thus, maintaining the integrity of the chloroplast is fundamental to the overall productivity and the success of photosynthesis [37].
In addition to physiological and biochemical responses, these plants are able to cope with saline conditions by making changes in the anatomical structure of their leaves and roots as well as changes in some features [38]. Leaf architecture is very important to enable CO2 flux in the mesophyll; therefore, the study of the anatomy of the plant leaf and its xylem vessels is highly interesting because with a lowered osmotic potential, the plant tends to reduce its water fluxes, which is followed by all metabolic events, not just simple photosynthesis. Our core hypothesis is that the reduction in vessel conductance with a lower osmotic potential can reduce the translocation of trioses phosphate to cytosol, leading to an increase in starch in the chloroplast, which can disrupt the chloroplast grana structure, leading to a decrease in the net photosynthesis. The main goal of this study was to demonstrate that salt stress changes the source–sink process and amylaceous structures that are formed in the chloroplast. Being substantial, these structures force the grana against the chloroplast wall, completely destroying the integrity of the thylakoids, which becomes one of the main causal events of low photosynthetic rates in mesophytic plants under saline stress.

2. Materials and Methods

2.1. Plant Material and Environmental Conditions

The experiments were conducted in the manner as described in detail in Pompelli et al. [14]. The global solar radiation intercepted by the plants varied widely during the experiment (Supplementary Figure S1), measuring 19,443 MJ m−2 in January 2017. However, when we considered the higher radiation intercepted by the plants in each evaluation, 3 March 2018, stood out with a higher radiation intercepted by plants (Supplementary Figure S1).
The genotypes chosen were the same as presented in Pompelli et al. [14] and Souza, et al. [39], with CNPAE183 considered tolerant to salinity, CNPAE218 considered sensitive, and JCAL171 with an intermediate tolerance. After producing the seedlings without salt, the J. curcas plants were transplanted to the final site, namely 250 L barrels filled with soil from the Petrolina region, as previously described [14]. After 30 days, the J. curcas plants were considered the plant source and then irrigated with five salt concentrations in the irrigation water (0 dS m−1, 2.5 dS m−1, 5.0 dS m−1, 7.5 dS m−1, and 10.0 dS m−1) and 5 replicates. Also, the water conductivity could be expressed as NaCl molarities in the order of 0 mM, 47 mM, 106 mM, 166 mM, and 226 mM. The plant irrigation was performed with an automated irrigation system containing (for each saline concentration) a 500 L water tank, a peristaltic pump, and a channel system that carried the water used for drip irrigation to the plants. All plants were irrigated every other day using dripper tubes with a flow of 2.5-L h−1 and a nominal diameter of 13 mm; we used two drippers per plant spaced 0.15 m apart. Irrigation was performed for 2 h per day by applying 10 L plant−1 day−1. After that, all plants were cultivated for 12 or 24 months with sampling occurring in this period for all features described below.
It is worth noting that before the collection of leaf samples, some stages of leaf primordia (less than 2 cm in length) were marked with red tape to ensure that all leaves developed within the treatment period and that they were not already formed in the field before samples were taken.

2.2. Optical Anatomy

Leaf fragments (5 cm2) of the 3rd attached, fully expanded leaf from the apex were sampled in 12- and 24-month stressed plants. In each plant, two leaf fragments were collected, promptly immersed in FAA50% for 48 h, and then stored in 70% (v/v) ethanol until analysis. Leaf samples were dehydrated in an ethylic series and embedded in plastic resin (Historesin-Leica Microsystems Nussloch, Heidelberg, Germany, part number 7592). Following this, all samples were processed as described in detail in Mendes et al. [40] according to the scheme presented in Supplementary Figure S3. For each sample, 100 images were captured with a digital camera (Mikrosysteme Vertrieb GmbH, model ICC50 HD; Wetzlar, Germany) and interfaced with a computer. To estimate the potential hydraulic conductivity (Kp), the principles of the Hagen–Poiseuille equation were implemented using Equation (1).
K p = π p w 128 η × V D × D h 4  
where Kp is the potential specific stem conductivity, η is the viscosity of water at 20 °C (1.002 × 10⁻³ Pa), ρw is the density of water at 20 °C (998.2 kg m−3), VD is the vessel density, and Dh is the hydraulically weighted vessel diameter (in m). Since the vessels were not exactly circular, the diameter of each vessel was calculated as the mean of the minimum and maximum diameters. The average Dh was calculated as well using the methodology found in Sterck et al. [41]. As recommended by Scholz et al. [42], we measured at least 50 vessels per photomicrograph, resulting in 250 vessels (5 repetitions) per treatment.

2.3. Scanning Electron Microscopy

Leaf fragments (~0.5 cm2) of the 3rd attached, fully expanded leaf from the apex were sampled in 12- and 24-month stressed plants and immediately fixed in a Karnovsky solution [43], prepared in 0.1 M of cacodylate buffer (sodium cacodylate trihydrate, Sigma Aldrich, St. Louis, MO, USA, part number C4945) at pH 7.4 and 2.5% glutaraldehyde (Sigma Aldrich, part number G5882) for 60 h at 4 °C. All preparation steps were conducted as described in detail in Pompelli et al. [14] with modifications proposed by Pompelli et al. [44]. For each sample, 50 images were captured via X-ray (EDS) (IXRF-Iridium Ultra Version 1.3, Model 550i ZEISS-LEO 1430VP (Carl Zeiss NTS Ltd., Cambridge, UK). For the stomatal area, stomatal pore area, stomatal complex area, and the ordinary cell area and its ratios, the methodology is schematized in Supplementary Figure S4. For this analysis, a minimum sampling size (n) was calculated to determine how many cells were required to be measured. This was calculated by using the formula below to find the number of cells to be measured within the total number of cells available. In this case, we used the tolerable error rate of 15% as recommended by Lin and Huang [45]:
n s a m p l e = E C N 100 e 2 E C N 100 e 2 + E C N + 100 e 2  
where ECN is the epidermal cell number and e is the tolerable error rate

2.4. Transmission Electron Microscopy

Leaf segments of approximately 0.5 mm in length were taken from the middle section of the 3rd attached, fully expanded leaf from the apex and were sampled from the 12- and 24-month control and stressed plants and immediately fixed in Karnovsky solution [43], prepared with 2% glutaraldehyde in 0.1 M of sodium cacodylate buffer at pH 7.4 [43]. Then, all leaf fragments were processed as described in detail in Mendes et al. [40]. For each sample, 25 ultrathin cuts (5 μm2) from at least 5 replicates were obtained with a transmission electron microscope (50 kV) with a coupled digital camera (EM 109, Carl Zeiss Microscopy Ltd., Jena, Germany).

2.5. Experimental Design and Statistical Analysis

The experiments were conducted in a completely randomized design composed of 3 J. curcas genotypes (CNPAE183, CNPAE218, and CNPAE171), 5 electric conductivities in the irrigation water (0 dS m−1, 2.5 dS m−1, 5.0 dS m−1, 7.5 dS m−1, and 10.0 dS m−1) and 1- and 2-year-old stressed J. curcas plants. All data were processed using two-way ANOVA in SigmaPlot for Windows v. 14.0 (Systat Software, Inc., San Jose, CA, USA). The principal component analysis was estimated after a multivariate analysis for all analyzed features in Minitab 18.1 (Minitab, Inc., Chicago, IL, USA). Heat maps were used to compare the mean of each treatment using the control (0 dS m−1) as a reference. After log2 transformation, the false color method was used, including a color scale. The heat maps were constructed using Microsoft® Office 360 (Microsoft Corporation, Redmond, WA, USA) and CorelDRAW Graphics Suite X8 (Corel Corporation, Ottawa, ON, Canada).

3. Results

The accumulated precipitation as measured in both 2017 and 2018 was 158.1 mm and 362.8 mm, respectively (Supplementary Figure S1). With these precipitation amounts, we can state that the plants were, in practice, fully irrigated with saline water for the entire experiment while using the appropriate treatments; based on that, the accumulated evapotranspiration was 158.3 mm and 355.5 mm, respectively, in 2017 and 2018 (Supplementary Figure S1).

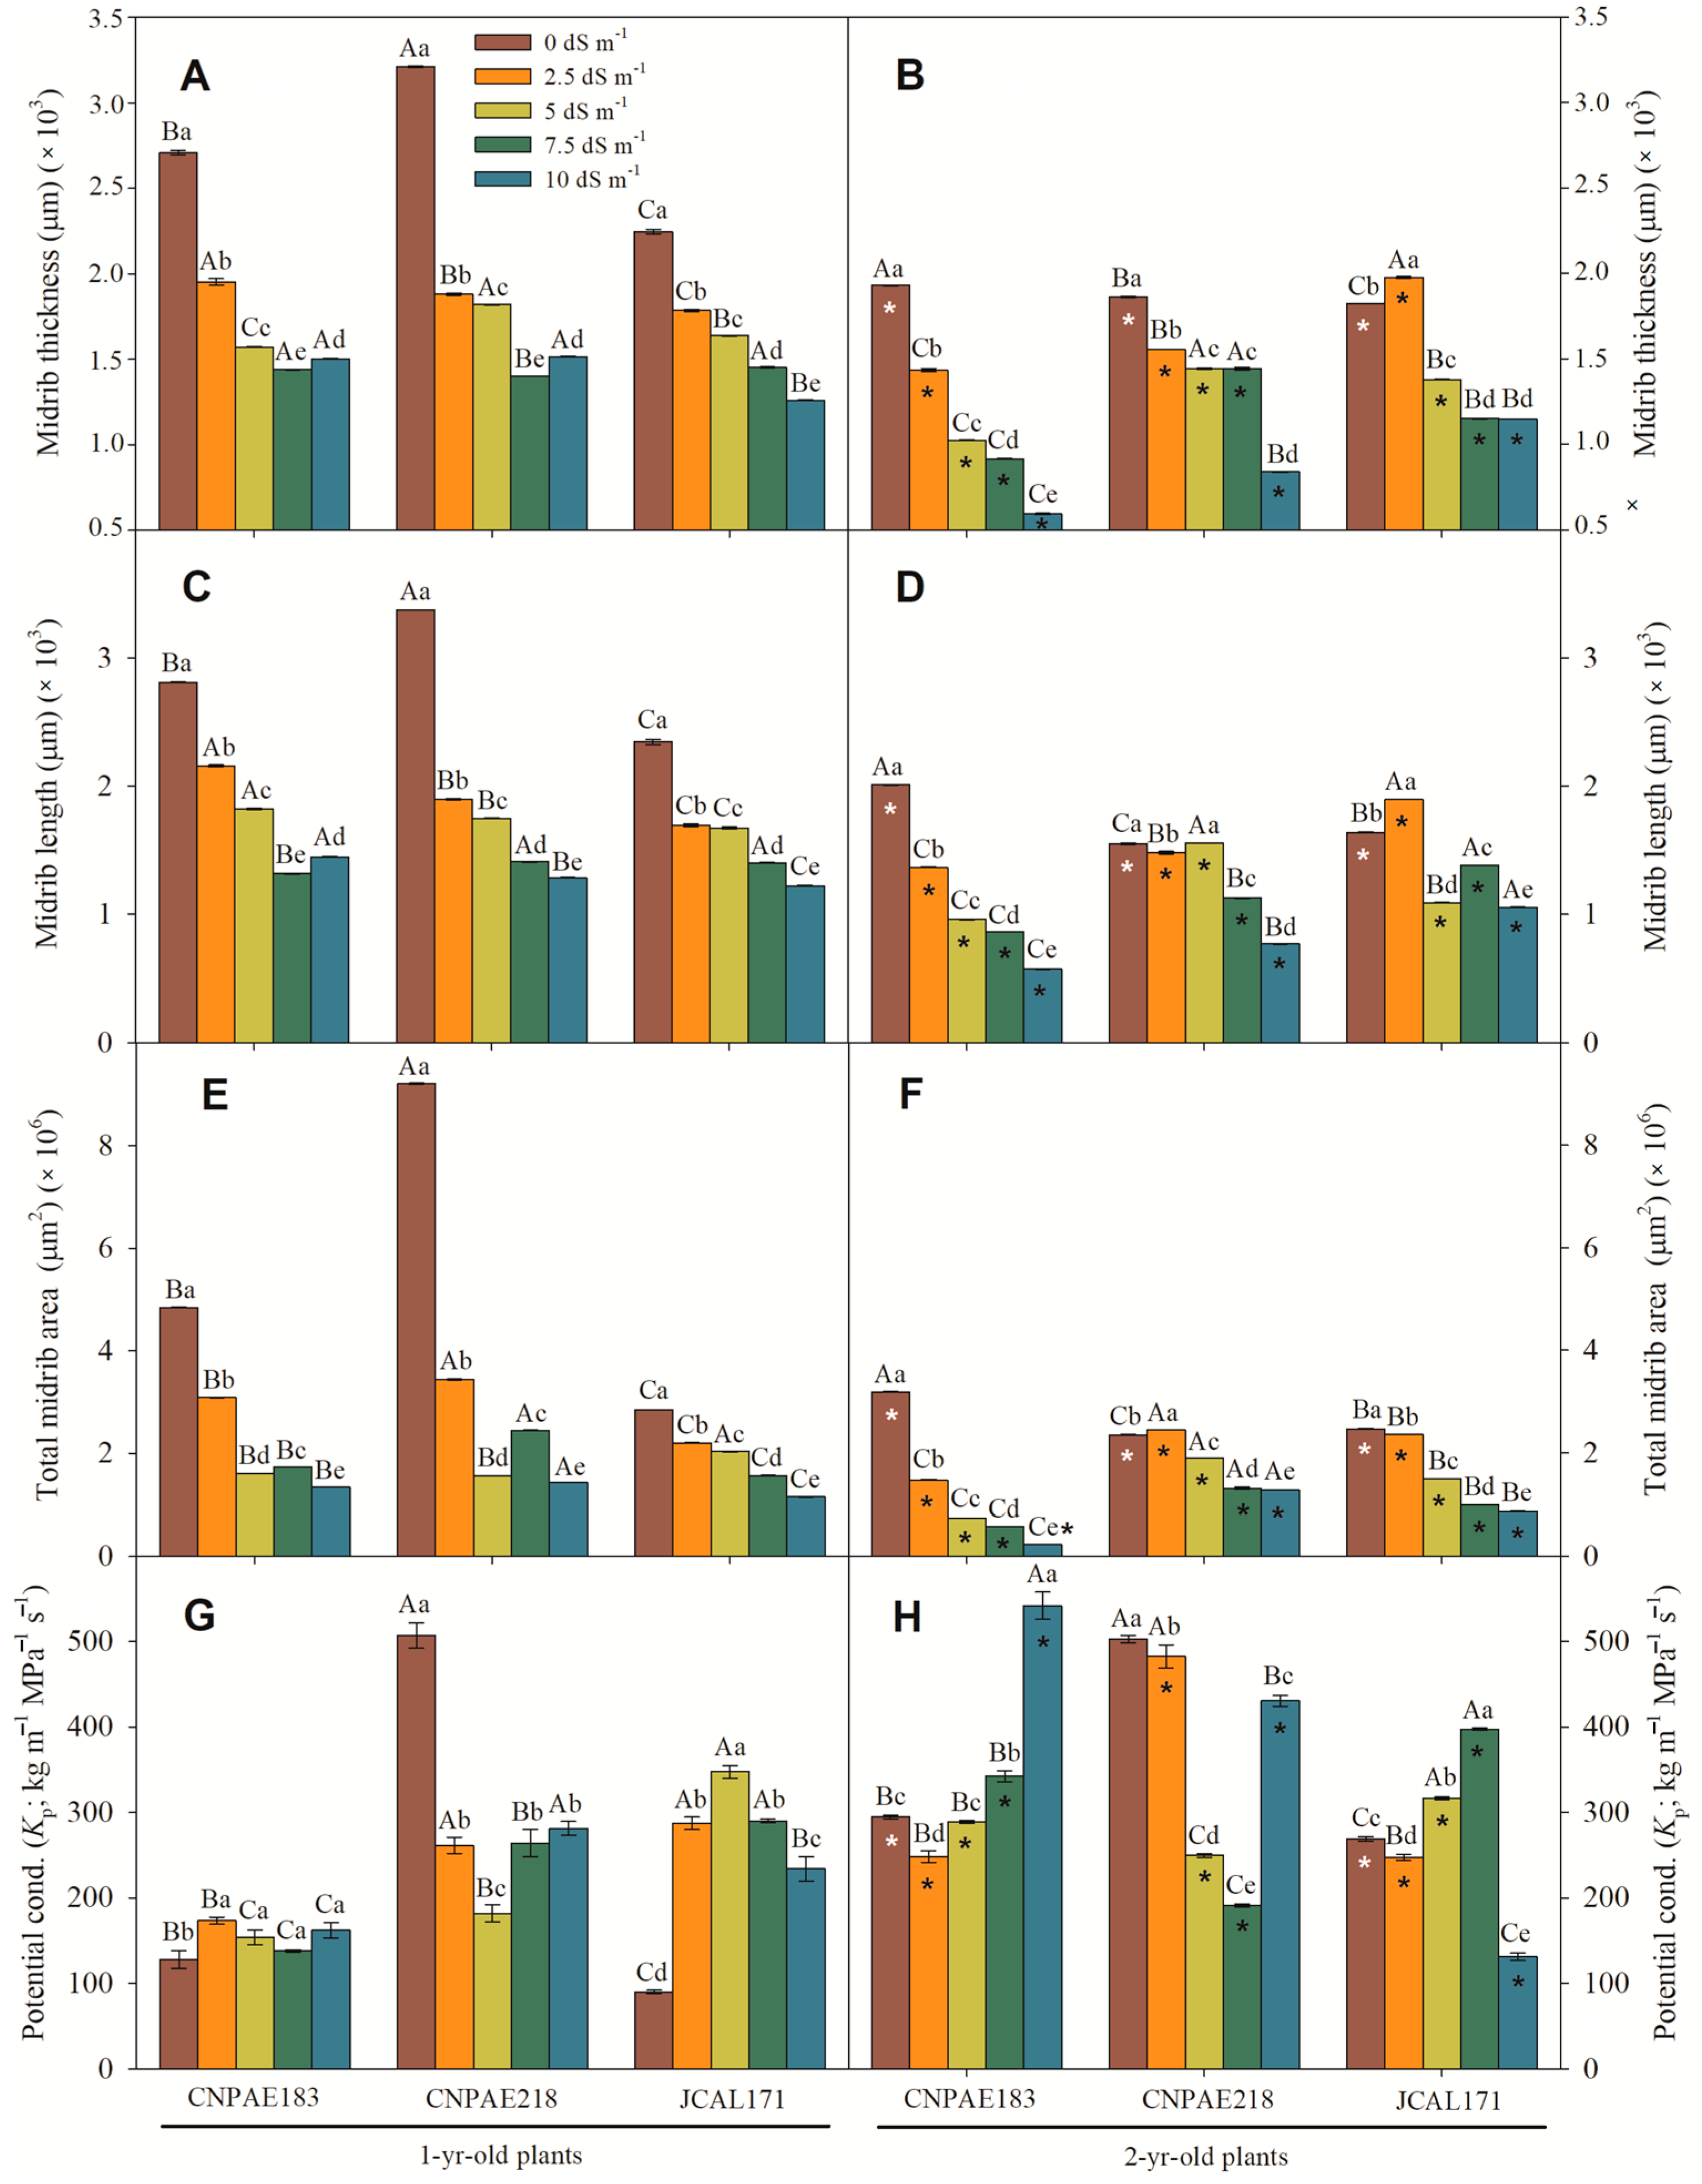
3.1. Cross Section of Leaves of J. curcas Plants under Salt Stress

In the cross section of J. curcas leaves, a significant difference was observed when comparing 1-year-old and 2-year-old J. curcas stressed plants (Figure 1 and Figure 2). For example, in the 1-year-old J. curcas stressed plants, the total leaf thickness (Figure 1A), the adaxial (Figure 1C) and abaxial surface thickness (Figure 1E), the thickness of the palisade parenchyma (Figure 1G), the thickness of the spongy parenchyma (Figure 2A), and the number of cells in the palisade (Figure 2E) were slightly (Figure 1G and Figure 2E) and moderately (Figure 1A,C,E) increased in both the 1-year-old and 2-year-old plants as the saline stress increased. On the other hand, all previously described features showed a median (Figure 1B) or strongly (Figure 1D,F,H and Figure 2B) decreased value in the 2-year-old J. curcas stressed plants. Moreover, neither the number of palisades (Figure 2E,F), the air spaces in the mesophyll (Figure 2G,H), the area of oxalate crystals (Figure 2I,J), nor the palisade to spongy parenchyma ratio (Figure 2C,D) changed significantly in any of the salt concentrations within the time the plants were subjected to salinity.
In the 1-year-old J. curcas salt-stressed plants, the adaxial epidermis surface cells were on average 1.7-fold higher than those on the abaxial epidermis surface. In the 2-year-old J. curcas stressed plants, this ratio was lower but with maximum and minimum values ranging from 1.1- to 2.2-fold higher. However, on the abaxial surface, a greater occurrence of a bistratified epidermis was observed (Figure 3A,B,E; green arrows), which was distinct from the adaxial surface of the epidermis. The total leaf thickness as well as the density of the spongy mesophyll was clearly visible (Figure 3). An increase in palisade and spongy parenchyma resulting from an increase in salinity was also evident. Similarly, the appearance of more than one palisade layer was also common. Thus, the palisade cell number seemed to increase as the salt concentration increased (Figure 2E,F) in both the 1-year-old and 2-year-old J. curcas plants.
Similar to the mesophyll thickness, the leaf blade, xylem thicknesses, length and width of the midrib, and vessel diameter were significantly decreased when exposed to a high level of salinity (Supplementary data file). The median value had a strong positive correlation with the salinity and salt exposure time, where a cross section of the leaf blade displayed more evidence that salt provoked many changes in the leaf blade structure to cope with the water stress imposed by salinity. In this sense, as salt stress increased, the lumen vessel area (Figure 4A,B), xylem area (Figure 4E,F), total xylem area (Figure 4G,H), xylem thickness (Figure 4I,J), midrib thickness (Figure 5A,B), midrib length (Figure 5C,D), and midrib area (Figure 5E,F) decreased in a similar proportion. The changes in these measurements corroborated this pattern, since a correlation between the salt concentration and xylem feature was moderately to strongly and inversely correlated to the lumen vessel area (r = −0.546), xylem area (r = −0.479), total xylem area (r = −0.724), xylem thickness (r = −0.547), midrib thickness (r = −0.754), midrib length (r = −0.726), and midrib area (r = −0.634) (Supplementary data file).
Also, the lumen vessel area, xylem area, and vessel element density showed a positive correlation with the potential conductivity of vessels (Kp) measured with a positive correlation (0.460, 0.486, and 0.640), respectively, denoting more and smaller xylem cells contributing positively to the water transportation system in the xylem. Similarly, the combined area of all xylem (total xylem area, thickness of xylem, midrib thickness, and midrib length) showed a negative (−0.201, −0.204, −0.140, and −0.149) correlation with Kp (Supplementary data file).

3.2. Scanning Electron Microscopy of the Epidermis (SEM)

In a frontal view, both epidermises were composed of polymorphic cells arranged with stomata densely (abaxial) or sparsely (adaxial) located. Paracytic stomata with ordinary cells of different sizes appeared on both epidermis surfaces. The stomata density (SD) ranged from 169 to 424 stomata per mm2 in the abaxial surface in the 1-year-old J. curcas plants and from 227 to 440 stomata per mm2 in the 2-year-old J. curcas plants. When examining the adaxial epidermis surface, the SD ranged from 49 to 219 stomata per mm2 in the 1-year-old J. curcas plants and from 33 to 234 stomata per mm2 in the 2-year-old J. curcas plants (Figure 6 and Figure 7). On both surfaces of the epidermis, the SD increased as the salt stress increased with the CNPAE218 genotype when irrigated with a saline solution of 10 dS m−1, showing a higher SD as the salt stress increased. The SD ranged from 124% to 379% higher in the abaxial than the adaxial (Figure 6 and Figure 7) epidermis surfaces. As a result of the increased salinity, the CNPAE218 and CNPAE171 genotypes both increased the SD, while in the CNPAE183 genotype, the SDs in plants irrigated with a saline solution of 10 dS m−1 were 69.3% and 82.3% lower than 0 dS m−1, respectively, in the 1-year-old and 2-year-old J. curcas plants.
Similarly, the abaxial ordinary cell density (OCDaba) ranged from 1817 to 2819 cells mm−2 (Figure 6C) in the 1-year-old J. curcas plants and from 1611 to 3009 cells mm−2 (Figure 6D) in the 2-year-old J. curcas plants. The ordinary adaxial cell density (OCDada) ranged from 859 to 1689 cells mm−2 (Figure 7C) in the 1-year-old J. curcas plants and from 813 to 1919 cells mm−2 (Figure 7D) in the 2-year-old J. curcas plants (Figure 7C,D).
Considering only the CNPAE183 genotype, the SD of the abaxial epidermis surface decreased from 339 to 207 (−39%; 1-year-old) and from 352 to 227 (−35.5%; 2-year-old) when comparing both stressed plants (10 dS m−1) and the control plants. At the same time, these plants showed a reduction in the OCDaba of 32.5% (1-year-old) and 17.6% (2-year-old). Thus, the stomatal index of these plants was 9% (1-year-old plants) and 19.4% (2-year-old plants) lower in salt-stressed plants. These permitted us to conclude that the reduction in the stomatal index (SI) in the CNPAE183 genotype was governed to a greater extent by the SD than by the OCD. Inversely, the CNPAE218 and CNPAE171 genotypes showed an increase in SD. In the CNPAE218 stressed plants, the SD increased by 43.8% and 26% compared to its controls, respectively, for the 1-year-old and 2-year-old plants. In these plants, the OCDaba increase in the 1-year-old plants was 24.6% and in the 2-year-old plants was 60.2%. Also, this tendency permitted us to assert that changes in the SI of the CNPAE218 genotype were more influenced by the SD in the 1-year-old plants and by the OCD in 2-year-old plants. The increase in SD of CNPAE171 (150% in 1-year-old plants and 80% in 2-year-old plants) with a corresponding increase of 58% and 40% in the OCD were sufficient data to argue that in CNPAE171, the increase in SI was governed by the SD more than the OCD.
On the adaxial surface, the trend continued in the CNPAE183 genotype, which showed a decrease in its SD by 52.3% and 66.7%, respectively, in the 1-year-old and 2-year-old plants. In these plants, the OCD decreased by 43.5% and 12.8%, confirming the fact that in the CNPAE183 genotype, the SD was the force that governed the modulation in the SI. On the other hand, in the CNPAE218 and CNPAE171 genotypes, the SD was increased by 147% and 157% (CNPAE218; 1-year-old and 2-year-old plants) and by 113% and 79% (CNPAE171; 1-year-old and 2-year-old plants), while the OCD was decreased by smaller magnitudes, which also confirmed that in these genotypes, the SD was the factor that most strongly contributed to the increase in SI in the CNPAE171 (2-year-old) plants and stability in the CNPAE218 genotype. This was a confirmation that the SD was the main factor that affected the SI, even with the strong positive correlation between the SD and the SI on the abaxial epidermis surface (r = 0.753), while the correlation with the OCDaba was 0.512. On the adaxial epidermis surface, the magnitude of force for the SI was shared in equal strength by the SD and OCDada, with the correlations being negative (−0.149 and −0.143 for the SD and OCDada, respectively).
In a general way, the ordinary cell area (OCA), stomatal complex area, and stomatal area followed the same tendency when compared to their densities. A higher density produced smaller cells, while a lower density resulted in larger cells (Figure 8 and Figure 9). Similarly, there were slight variations in features between times of salt. Alternatively, the differences between the abaxial and adaxial epidermis surfaces were quite distinct. For example, the OCA was 1.1- to 2.7-fold higher on the adaxial than on the abaxial epidermis surfaces among the 1-year-old J. curcas plants and between 1.6- to 2.6-fold higher among the 2-year-old J. curcas plants. For the stomatal area, the ratio between the adaxial and abaxial ranged from 1.1- to 1.4-fold in favoring the adaxial surface (Figure 8 and Figure 9). Distinctly, the stomatal pore area was much greater when measured in the abaxial versus the adaxial epidermis surface. The ratio between abaxial and adaxial stomatal area ranged from 1.2- to 47.8-fold higher in the abaxial than in the adaxial surface (in the 1-year-old J. curcas plants).
Figure 10 shows the arrangement of epidermal cells on both the adaxial (Figure 10A) and abaxial (Figure 10B) epidermis surface. Completely closed or entirely open stomata were rarely observed in the captured images (Figure 10C). As for the stomata, they may have had subsidiary cells (Figure 10D) with or without visible striations (Figure 10E) oriented in a plane orthogonal to the stomata. The abaxial epidermis was very hairy (Figure 10F,G) with brightly colored and unicellular epidermal hairs originating from epithelial cells. It seems reasonable to assume that these hairs favored stomatal openings by producing a microclimate close to the stomata or even providing another barrier to water loss, making water loss difficult.

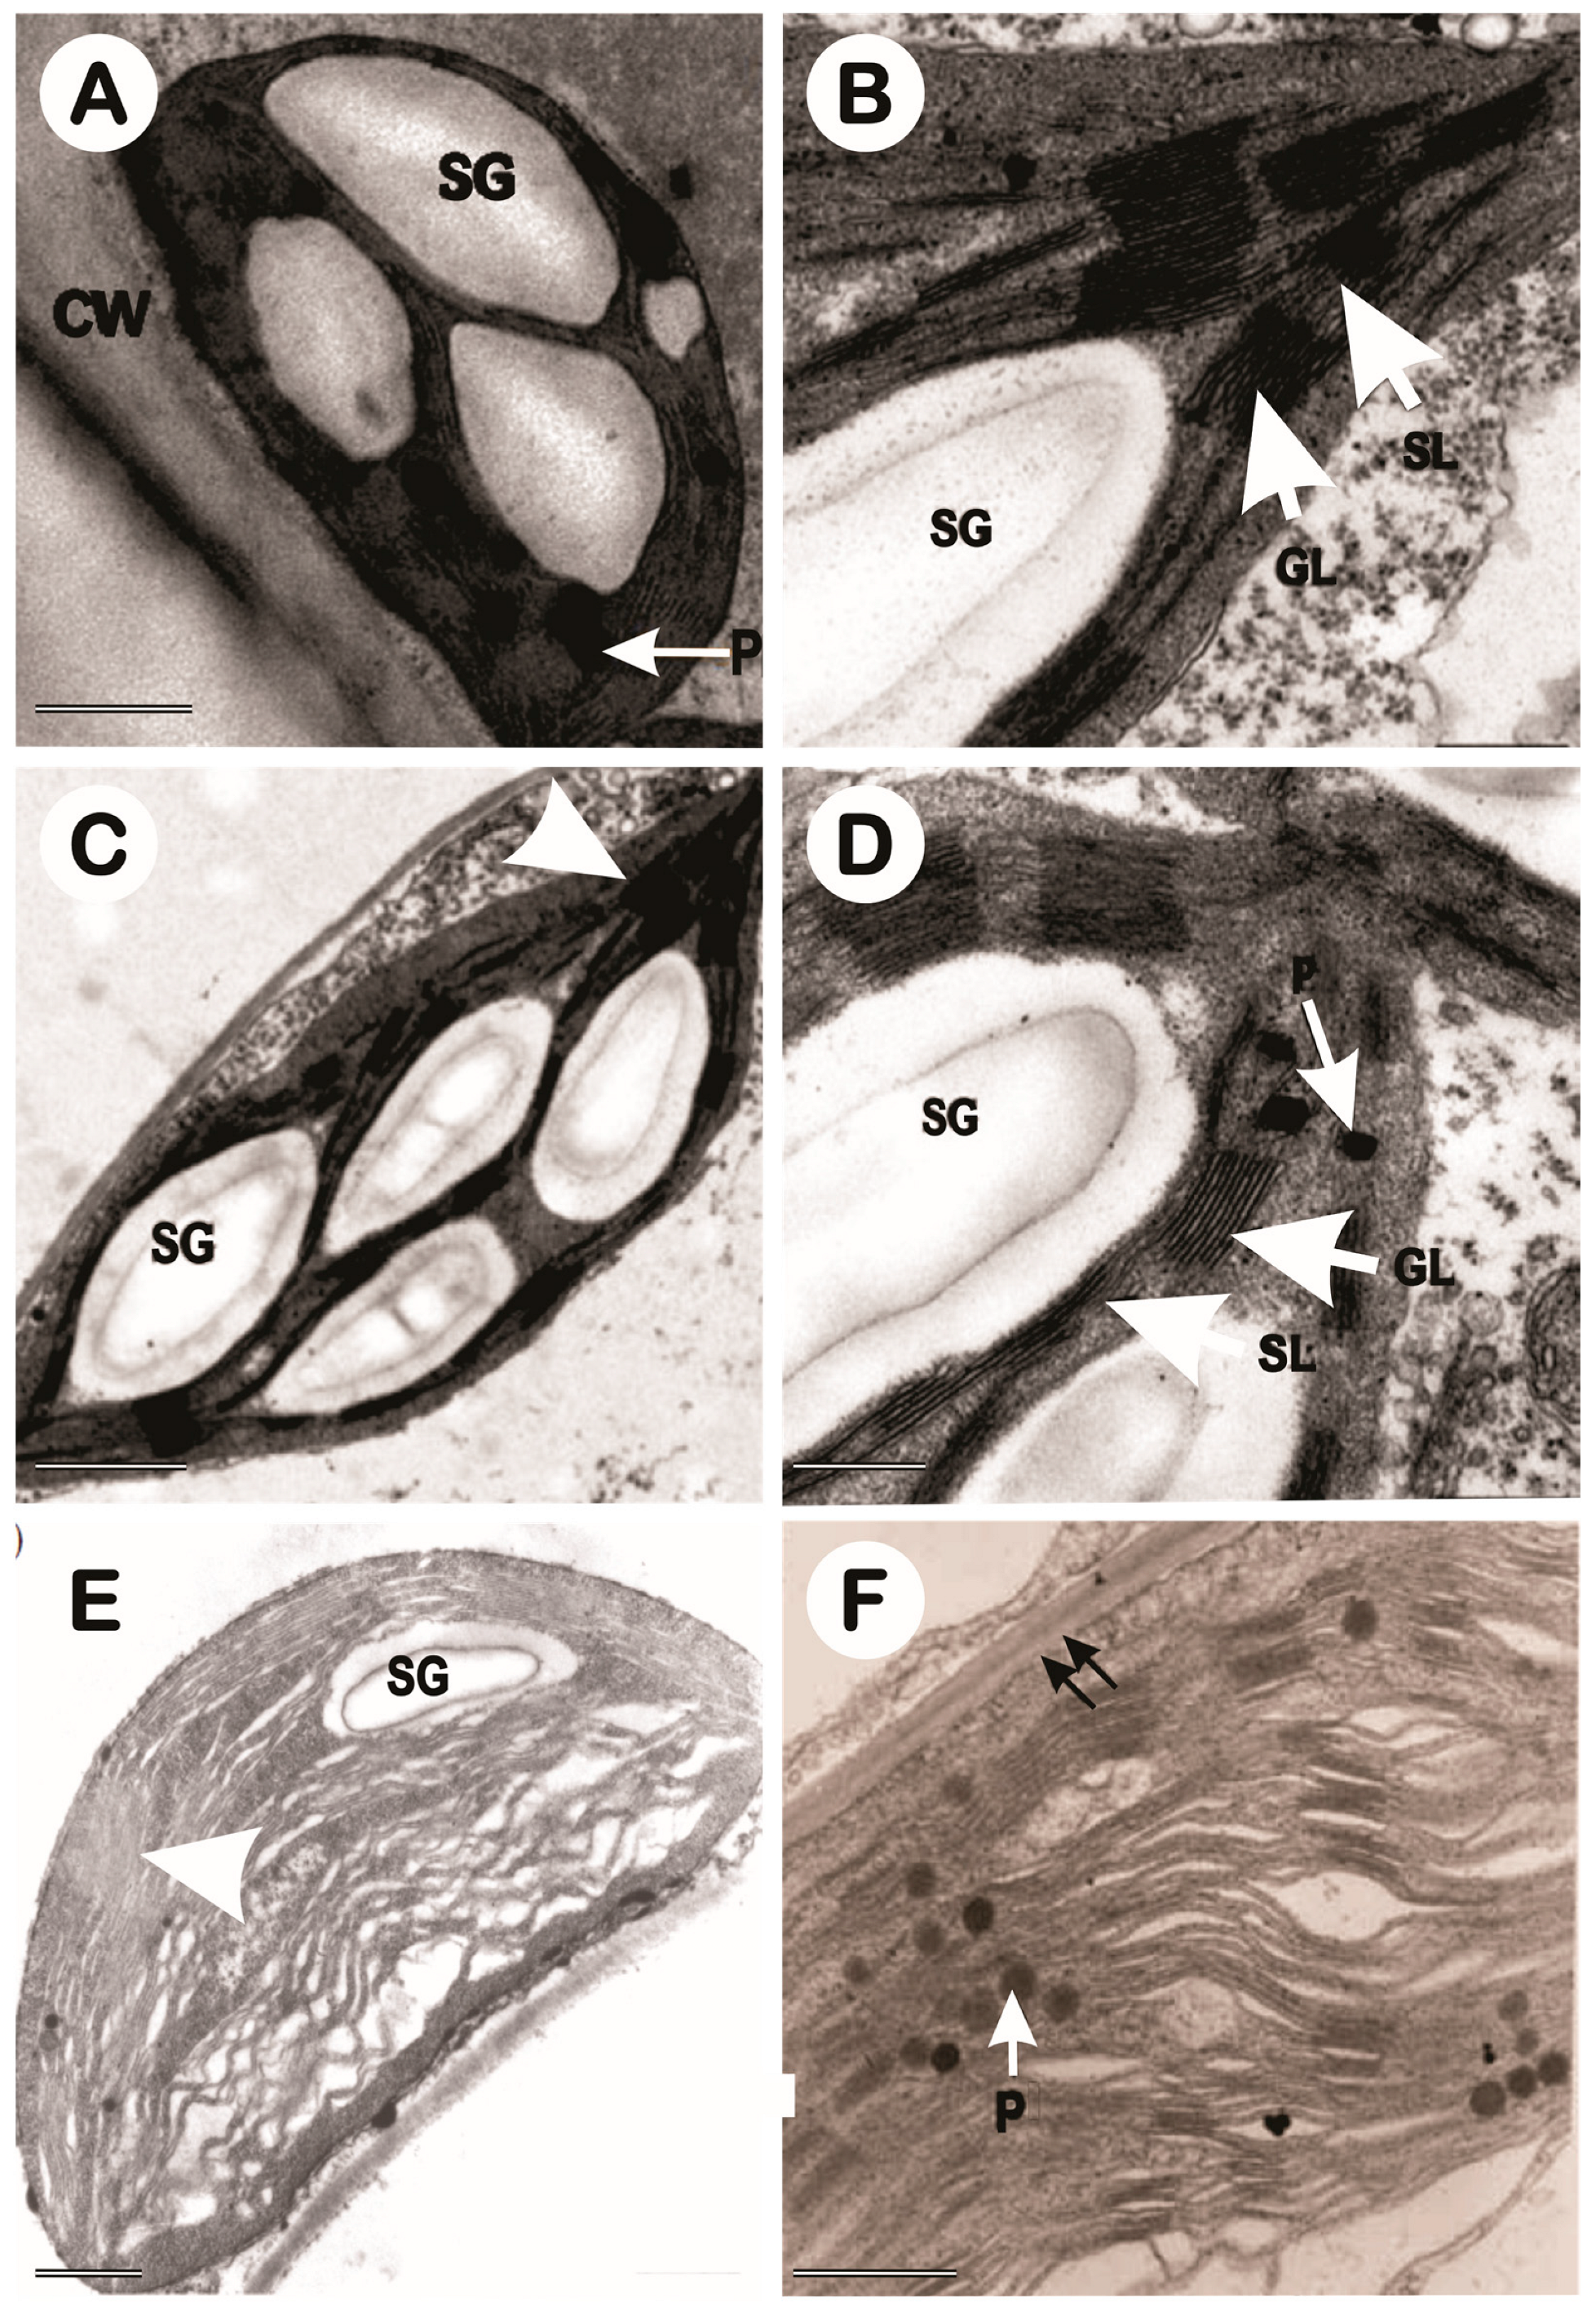
3.3. Transmission Electron Microscopy of Chloroplasts (TEM)

In this study, only the control and treatments with a saline solution of 10 dS m−1 were evaluated at three different points in time (Figure 11) and before stress (Figure 12) in the 1-year-old plants (Figure 13) and 2-year-old plants (Figure 14). NaCl affected the ultrastructure of the chloroplast (Figure 12). In the leaf fragments visualized before stress, very-well-formed chloroplasts were observed in a regular ellipsoidal-shaped arrangement with sparce plastoglobules, and some small, well-formed starch granules were observed only in the images of the CNPAE171 genotype. In the non-stressed plants, a well-formed structure of thylakoid granas and thylakoidal and stromal lamellas were described in comparison with each other and verified, while chloroplasts from salinity-impacted cells’ swollen thylakoids were very frequent, especially in the CNPAE218 and CNPAE171 genotypes. The disorganization of thylakoid membranes within chloroplasts was often accompanied by the disappearance of grana stacking (Figure 12, Figure 13 and Figure 14), resulting in significant alterations to the photosynthetic machinery. This disruption can lead to impaired light adsorption and electron transport processes, ultimately affecting the overall efficiency of net photosynthesis [14].
The density of chloroplasts per parenchyma cell was 34, 30, and 31 chloroplasts per cell, respectively, for the CNPAE183, CNPAE218, and CNPAE171 genotypes in plants that were evaluated before stress. However, this value dropped to 29 (−14.5%), 26 (−13.2%), and 27 (−15.3%) in the 1-year-old plants and to 31 (−9.5%), 19 (−37.8%), and 26 (−26%) in 2-year-old salt-stressed J. curcas plants, respectively, in CNPAE183, CNPAE218, and CNPAE171 (Figure 11A). While the chloroplast density per cell had a slight drop, the chloroplast size (Figure 11B) was more strongly affected in the salt-stressed J. curcas plants in both the 1-year-old and 2-year-old salt-stressed J. curcas plants. The chloroplast area before stress was 62 μm, 57 μm, and 54 μm, respectively, in CNPAE183, CNPAE218, and CNPAE171, which dropped to 53 μm (−14.9%), 46 μm (−18.5%), and 50 μm (−6.3%) in the 1-year-old plants and to 50 μm (−19.9%), 37 μm (−35.3%), and 47 μm (−11.8%) in the 2-year-old plants. Also, the density of the chloroplasts showed a significant decrease as the salinity increased. This perception must be evaluated using two methods: the cell area occupied by chloroplasts (Figure 11A) and the chloroplast area (Figure 11B) or by the negative correlation between the cell area occupied by chloroplasts x salt exposure (r = −0.335), cell area occupied by chloroplasts x salt concentration (r = −0.169), or chloroplast area x salt concentration (r = −0.762) (Supplementary data file).
The grana thickness of the CNPAE183 genotype was slightly reduced by 16.4% in the salt-stressed 2-year-old plants (Figure 11C). However, the grana thickness of the CNPAE183 genotype was on average 42%, 51%, and 18% thicker than the average grana of the CNPAE218 and CNPAE171 genotypes at 0, 12, and 24 months (Figure 11). The grana width (Figure 11D) (except for the CNPAE171 genotype 2-year-old plants, which showed no significant difference in any other treatment or genotype) was a factor that was reflected in the thickness-to-width grana ratio (Figure 11E).
The chloroplast area occupied by grana lamellae (more dense than five lamellae per grana) (Figure 11F) was significantly increased in the CNPAE183 and CNPAE218 genotypes in the 1-year-old plants even though in the 2-year-old plants, the percentage significantly decreased in all genotypes. The percentage of grana lamellae among the granal and stromal lamellae dropped from 80.9% to 67.7% and 64.7%, respectively, for the CNPAE183 genotype in the 0 to 1-year-old and the 2-year-old plants; from 69.5% to 62.1% and 54.5 for the CNPAE218 genotype in the 0 to 1-year-old plants and the 2-year-old plants; and from 72% to 63.6% and 58.2% for the CNPAE171 genotype in the 0 to 1-year-old and 2-year-old plants). This greater or lesser stacking of the lamellae could also be verified in the lamellae by the grana, where the CNPAE183 genotype did not change its percentage, while both CNPAE218 and CNPAE171 showed a sudden drop.
The presence of both the starch grain and plastoglobulus showed an increase as the salt stress increased. However, this increase was genotype-dependent. In CNPAE183, the relative starch granules per chloroplast increased from 11.2% to 32.8% (+193% in 1-year-old plants) and 14.4% (+29% in 2-year-old plants), the increase in the CNPAE218 genotype’s starch granules was 14.4% to 67.3 (+368% in 1-year-old plants) and 50.9 (+254% in 2-year-old plants), and the CNPAE171 genotype starch granules increased from 14.2% to 67.9% (+377% in 1-year-old plants) and 36.9% (+159% in 2-year-old plants). The plastoglobulus density increased from 1.8 to 6.5 (+267% in 1-year-old plants) and 3.1 (+76% in 2-year-old plants) for CNPAE183, from 2.2 to 11.1 (+403% in 1-year-old plants) and 12.4 (+461% in 2-year-old plants) for CNPAE218, and from 1.9 to 12.9 (+595% in 1-year-old plants) and 13 (+600% in 2-year-old plants) for CNPAE171.
Morphologically, in accordance with the plant’s lifetime, the previously healthy chloroplasts with well-formed and easily identified structures became primarily starch-storing chloroplasts, and due to their density, they gradually squeezed the granal lamellae against the chloroplast walls, causing the walls to rupture almost completely (Figure 13 and Figure 14), which in turn caused the formation of many plastoglobules (Figure 13 and Figure 14).
It was also verified that the chloroplasts acquired a readaptive capability with regard to the salinity; a fact that was very clear in the 2-year-old plants of the CNPAE171 genotype. This genotype restarted a very slow process of reorganizing the granal lamellae (Figure 14D) even while still very incipient and showed a significant formation of plastoglobules (Figure 14C). The CNPAE218 genotype, which in the 1-year-old plants did not show a clear formation of granal lamellae (Figure 13E,F), but resumed the formation of granal lamellae after the acclimatization of the 2-year-old plants (Figure 14E,F).

3.4. Principal Component Analysis (PCA)

The PCA was composed of PC1 + PC2, totaling 0.732 (i.e., all possible variations could be represented by this PCA with 73.2% of possibilities). With 42% similarity, the PCA showed the formation of four groups, including all treatments. The first group was a cluster of six combinations of genotype and salt concentrations. The second group was a cluster of three salinity treatments of CNPAE183 (0, 2.5, and 5 dS m−1) plus CNPAE171 at 5 dS m−1. The third group was a cluster of four combinations of genotype and salt concentrations, and finally, the fourth group contained a singular analysis composed of only one genotype and salinity treatment (CNPAE171; 2.5 dS m−1) (Figure 15A,B). Figure 15C shows that the featured grana area, grana width, grana stacking, grana thickness, chloroplast area, lamellae per grana, starch, and plastoglobulus were in the same PCA slot, signaling that there were shared similarities. However, to understand the relationship between them, grana stacking was isolated and will be better presented in Section 3 (Discussion). It is one of the best indicators for analyzing the integrity of chloroplasts. So, in the correlation between the grana stacking and the grana area and grana width, the return median and positive correlation were measured as 0.234, and 0.312, respectively. Other strong correlations with grana stacking were evidenced by the grana thickness (r = 0.864), chloroplast area (r = 0.765), and lamellae per grana (r = 0.776). Two other correlations between the grana stacking and starch (r = −0.748) and plastoglobulus (r= −0.949) were the strongest but were negatively correlated. The lamellae per grana and plastoglobulus also had a strong negative (r = −0.866) correlation. Thus, we can argue that the integrity of the chloroplasts was promoted by the size of the starch grains, the size of the chloroplasts, and the average number of lamellae per grana. The presence of starch grains, due to their high density, pressed the grains against the chloroplast walls (Figure 13A,C and Figure 14F), which destroyed the walls and generated a large concentration of plastoglobules, since the correlation between the starch grains and plastoglobules was rather high (r = 0.812).
The heat map analysis (Supplementary Figure S2) reviewed all features analyzed in this study. From this point of view, it is easy to perceive that as salt stresses increased, there was an increase in the number of xylem cells for all genotypes and salt conditions. There was also a decrease in the thickness of xylem cells, midrib thickness, midrib length, and midrib area as the salt stress increased. Additionally, the salt stress increased the stomatal pore area on the abaxial epidermis surfaces of CNPAE183 and CNPAE171, while for CNPAE218, it decreased. The same pattern was observed on the stomatal complex area and stomatal area, both on adaxial epidermis surfaces. However, in the 2-year-old plants, both of these features strongly increased for all genotypes and salt stresses, mainly in the CNPAE218 and CNPAE171 genotypes. It is clear that the starch granules and plastoglobulus significantly increased in both the 1-year-old and 2-year-old J. curcas plants under 10 dS m−1 of electrical conductivity.

4. Discussion

Salt-stressed J. curcas plants produce smaller leaves [14,15,22,46] with closely packed epidermal cells and other tissues, causing a higher stomata density and an ordinary leaf area density. With an increased salinity, smaller leaves have higher convection coefficients and a lower resistance to heat transfer through leaf boundary layers than larger leaves, and the leaf size may change to optimize the leaf temperature [47,48]. Larger leaves may be intrinsically vulnerable to drought-induced embolism due to the shorter vein length and larger xylem conduit diameters [49,50].
J. curcas plants under salt stress presented a thickening of the mesophyll, sometimes more notably pronounced (CNPAE183 and CNPAE218) [15] and sometimes less obvious (CNPAE171) [17]. The present data agree with previous data in reporting that salt stress increases the total leaf thickness [15,17,31,32,33,34,35]; however, in contrast to our results [51,52,53,54], other authors reported that salt stress did not have any influence on leaf thickness [55]. In support of this point of view, Taratima et al. [51] and Taratima, et al. [56] described that anatomical adaptations also do occur under salinity stress; e.g., an increase in the cuticle, epidermis, and leaf thickness occurs to prevent water loss. A reduction in leaf area in salt-stressed J. curcas plants was previously reported [15,20,57]. The present data disagree in part with those presented by Silva-Santos et al. [15]. The differences between our results and those of Silva-Santos et al. [15] were due to differences in salt exposure. While the studies described by Silva-Santos et al. [15] were evaluated after 50 h of salt stress, this study subjected the J. curcas plants to salt exposure for either a 1- or 2-year period with a basal salinity. Among the changes that can occur in plants under salt stress, the thickness of the spongy parenchyma increased in plants under salt stress, but this increase was not the same for other tissues, and as a result, they did not cause a significant effect of saline stress on the leaf thickness [55]. Regardless of this, an increase in palisade tissue thickness is related to an increase in the number of chloroplasts as well as a decrease in the thickness of spongy tissue, which facilitates CO2 reaching chloroplasts in the palisade parenchyma. These anatomical alterations could be an adaptation strategy to facilitate the photosynthesis process under saline stress conditions [31,34]. However, in this study, we described a positive correlation (r = 0.311) between the palisade and spongy parenchyma, a negative correlation (r = −0.176) between the palisade parenchyma and chloroplast area, and a non-significant correlation between the palisade thickness and cell area occupied by chloroplasts (Supplementary data file).
The occurrence of calcium oxalate (CaOx) crystals is related to Ca ion regulation, mechanical support, protection against grazing and chewing insects, and metal detoxification, depending upon the amount of the crystals, morphology, and distribution within the tissues [58]. The true function of calcium crystals in stressed plants is not well documented; however, Hunsche, et al. [59] stated that calcium oxalate crystals can build up a reservoir to ensure calcium supply for metabolic processes when its absorption and translocation are hindered due to environmental stresses such as salinity. Regarding this, CaOx forms a physiological barrier to the free diffusion of potentially toxic ions prevalent in a saline environment. In the present study, we verified a greater distribution of idioblast calcium oxalate-type crystals in the 2-year-old J. curcas plants in comparison to their 1-year-old counterparts.
Plants are remarkable organisms that have evolved various strategies to cope with challenges such as seasonal drought. One crucial adaptation involves changes in hydraulic conductance (Kp), which refers to the movement of water through the plant’s vascular system [60,61]. When faced with limited water availability, plants adjust their Kp to maintain a favorable water balance [60,62,63,64,65]. By regulating the flow of water, plants can allocate it efficiently, ensuring that essential processes like photosynthesis and nutrient uptake are sustained even in dry conditions. These adjustments in Kp allow plants to optimize their water use, enabling them to survive and thrive in environments prone to seasonal drought. In our study, the Kp showed a more or less constant pattern without a defined pattern but with a tendency to decrease. Similar results were described in Hordeum vulgare [38]. Several studies have demonstrated a relationship between the water potential that induces stomatal closure and that which triggers cavitation of the stem xylem [65]. Even though the Kp showed a clear trend for a positive relationship with the stomatal pore area on the adaxial surface of the epidermis (r = 0.339; Supplementary data file), this was not the case with the stomata on the abaxial surface (p = 0.481). This relationship became clearer with a positive correlation between the Kp and the stomatal area on the adaxial surface of the epidermis. Thus, the greater the vapor pressure deficit (VPD), the smaller the stomatal opening, the lower the potential conductivity, and the lower the pressure under the conductive vasculature for embolism [41]. However, the opposite premise is true: for a smaller VPD with a larger stomatal opening, the greater the Kp and the greater the need to replace the water in the conducting vessels that must also reduce their osmotic potential to be able to capture water. A reduction in Kp diminishes the risk of xylem embolism [66,67]. In accordance with Santana et al. [68], a decrease of 56% to 87% in whole-plant hydraulic conductivity as well as a 38% decrease in total biomass resulted in a significantly low biomass water use efficiency in water-deficit conditions as compared to irrigated plants [68]. Moreover, significant decreases of 57% to 65% in stem Kp were demonstrated in J. curcas plants under water deficit; these were completely recovered after six days of rehydration [24]. It appears that some genetic materials may have the ability to recover and/or maintain Kp via a mechanism that is still unknown. For example, in our study, the Kp showed a positive correlation with salt exposure (time in years; r = 0.564) but did not show a positive correlation with salt stress. With these data, we can infer that J. curcas, as a species with a moderate tolerance for salinity, presents a plasticity that allows it to live in saline environments, since the plant established itself in this environment and acclimatized over time. A trade-off with ‘stress time’ for hydraulic conductivity was previously reported in some Cyprus species [65], where in the first year, little significant effect of the moderate drought treatment on hydraulic conductivity was demonstrated; however, there were significant effects in the second year of study. The same results were shown in Pinus sylvestris and Quercus pubescens [41]. The positive correlation between the Kp and lumen vessel area (r = 0.460) and the vessel element density (r = 0.640) allowed us to infer that the pressure on the xylem permits an adaptation of the vessel elements. In accordance with Atabayeva et al. [38], under salt stress, a decrease in cell size, a higher stomata density, and a reduction in the thickness of the leaf epidermis of the apical meristem, cortex, and central cylinder diameter were shown [38]. A decrease in vascular bundle vessels as a consequence of water stress is commonly associated with a lowered water potential. In totum, we speculated that with more and smaller caliber vessel elements available, the plants must have controlled the Kp in a certain way to avoid embolism, even if this was not directly measured. It is noteworthy that the largest vessels (J. curcas) were the most efficient, but they were also the most vulnerable to cavitation; so, the reduction in the lumen vessel area is a very important strategy to withstand and escape salt stress [35,41,65,69,70]. Other key factors also contribute to an increase and decrease in resistances for the xylem and consequently to variations in the hydraulic conductance, such as the feature of secondary wall thickening, perforation plates, vessel dimensions, and density [71,72]. Xu, Zhang and Li [72] analyzed the relationships between a vessel’s anatomical traits and water transport inside the xylem of J. curcas. They showed that despite the xylem vessel providing a low-resistance path for water transport, changes in the vessel inner diameter significantly affected the total resistance. Some scholars [17,24,73] have demonstrated that a 34% increase in the density of vessels in a drought-tolerant genotype was associated with an increased Kp under a water deficit. The xylem of absorbent roots in plants under drought conditions contain only a small quantity of narrow vessels, which explains the low root Kp [74,75]. Notwithstanding, the maximum Kp and maximum photosynthetic rate are both closely related to the leaf vein density [76]. In general, leaf transpiration is directly related to the stomatal density and stomatal size [76,77]. Similarly, in Toona ciliata, the number of fine veins and stomatal density are both regulated by leaf expansion so that leaf Kp and photosynthetic rates promoted by stomatal conductance remain proportional [78].
Stomata play a pivotal role in regulating essential physiological processes. These stomatal pores help to maintain an optimal balance between water loss and CO2 uptake, particularly when faced with challenging environmental conditions. By controlling the size of their stomatal apertures, plants can modulate the rate of transpiration, thus conserving water during periods of drought or salt stress [14,15,79]. In this study, we characterized the leaf epidermis, both on the adaxial and abaxial surfaces. A lower stomata size and consequently a higher density (r = −0.704) were described in this study as well as in other studies for J curcas [14,15,46], Eucalyptus globulus [80], Gossypium hirsutum [76], and other species [35,81]. Lei et al. [76] stated that water stress alters the stomatal density on abaxial surfaces but not on an adaxial surface. Our findings disagree with those of these authors because the stomatal density of the most stressed plants (10 dS m−1) was increased both on the adaxial and abaxial surfaces, even though the abaxial epidermis is rich in reflector trichomes (Figure 10F,G). It is important to highlight that the increase in SD was only registered in the CNPAE218 and CNPAE171 genotypes, while in CNPAE183, there was a decrease (Figure 6A,B and Figure 7A,B), as previously described in prior research conducted by this team [14]. However, the stomatal pore area was reduced with an increase in both salt concentration and exposure time, with the last factor only affecting the abaxial surface. This finding was corroborated by Hsie et al. [46] and Silva-Santos et al. [15] for J. curcas and Lei et al. [76] for Gossypium hirsutum. Here, we demonstrated that the xylem conduction system was not able to keep the stomata open in more severe treatments, unlike that shown in the data presented by Lei et al. [76]. It should be noted that in the current study, the saline stress was uninterrupted for 2 years, while in cotton [76], the plants were exposed to a water deficit for only 12 days. Noteworthily, previous researchers proposed that small stomata can rapidly respond to changes in the external environment [46,76,77,82,83].
As previously described, grana stacking is the best indicator of chloroplast integrity. We believe that in non-stressed cells with a good source-to-sink relationship, photosynthates are produced and exported to the cytosol, where they are converted to other sugars and transported via the phloem [84]. However, phloem loading essentially depends on (i) an osmotic potential differential within the phloem vessels, (ii) utilization of photosynthate by sink organs, and (iii) a favorable transpiration current for xylem ascension, which should provide water to promote the osmotic potential differences between the source and sink [79]. The source-to-sink relationship is crucial to the phloem loaded to transport the trioses phosphate into the phloem [85,86]. Thus, the sink strength of a particular organ determines its force to mobilize photoassimilates from the source [86]. It is influenced by various factors, including the sink size or capacity of the tissue or organ to import and store further compounds from the source(s). Additionally, the sink activity as measured by the respiration rate plays a significant role in the overall dynamics of the source-to-sink relationship. To create a difference in osmotic potential to load phloem, there must be an osmotic differential between mesophyll cells and xylem cells. For example, there was no significant correlation between the SDadaxial and the Kp. Another observation showed that the SDabaxial had a smooth negative correlation with the Kp (r = −0.179), resulting in a weaker force on the xylem loaded with water. A significant correlation exists between the Kp and the stomatal pore area of the abaxial stomata. With a lower xylem ascension, lower metabolic rates under salt stress [14] and a lower sink strength (also caused by a lower osmotic potential) will result in a lower phloem loading. Thus, in the first moments after the onset of salt stress or in the first hours of the day, the photosynthetic rate can remain reasonable (even under salt stress), and if there are no conditions for the translocation of photoassimilates, they remain in the chloroplast and are used for the primary starch synthesis. As previously demonstrated, larger starch granules promote the destruction of thylakoid lamellae and then a secondary reduction in the photosynthetic rate [87]. Furthermore, favorable conditions must be present for phloem loading, which appears to be regulated by genes of the Cucumis sativus stachyose synthase (CsSTS) type [88], the Spondias tuberosa sucrose transporter 2 (StSUT2) type [89], and the SWEET4 superfamily of genes [90]. However, when the metabolism is reduced, the expression of genes involved in phloem loading may also be compromised, and as a consequence, more starch granules are formed into the chloroplast [91,92,93].

5. Conclusions

Our findings suggest that Jatropha curcas plants exposed to salt stress exhibit an increased mesophyll thickness characterized by more compact cells in the spongy parenchyma and occasionally a bistratified adaxial epidermis surface. The abaxial epidermis surface contained a higher stomata density and ordinary cell density, often accompanied by reflective trichomes. The rise in stomatal density (found in the CNPAE218 and CNPAE171 genotypes) or decrease in SD (found in the CNPAE183 genotypes) appeared to be regulated by a reduction in leaf area and was positively correlated with the potential conductivity of vessels, which showed a tendency to decrease in all studied genotypes. This potential conductivity served as a driving force for water movement from leaves to roots and soil. This variation in stomatal density was likely a response to salt stress. Notably, our main findings suggest that potential conductivity may be associated with certain chloroplast characteristics, including variations in the chloroplast density through an increase in starch granules promoted by a lesser load in the source-to-sink relationship as a consequence of lower osmotic potential promoted by salinity. Likewise, salt stress promoted a decrease in chloroplast per cells and grana per thylakoid. As a focal point, we can state that the CNPAE183 genotype was more tolerant to saline stress than the CNPAE218 and CNPAE171 genotypes. However, further studies are necessary to provide additional evidence for this hypothesis.

Supplementary Materials

The following supporting information can be downloaded at: https://www.mdpi.com/article/10.3390/f14091868/s1, Supplementary Figure S1. Climatological features showing (A) global radiance (red) and relative humidity (blue). In (B), the vertical bars and brown lines represent rainfall and air temperature (green). All data were measured in an automatic weather station located at a 2 km distance from the experimental area. Supplementary Figure S2. Heat map representing all analyzed features in tree genotypes of Jatropha curcas. The color code of the heat map is given at the log(2) scale. Data are normalized with respect to the mean response calculated for the control (0 dS m−1). To allow statistical assessment, individual plants from this set were normalized in the same way. Values represent means ± SE (SNK; p ≤ 0.05) of five biological replicates. An asterisk (*) indicates that the values from other samples are significantly different from controls. Supplementary Figure S3. The picture is drawn showing all xylem features as measured. Scale: 500 μm. Supplementary Figure S4. The picture is drawn showing all stomatic and stomatic complex features as measured. Scales: A, 2 μm; B, 10 μm.

Author Contributions

Conceptualization, M.F.P., J.D.P., W.L.A. and H.C.; methodology, M.F.P., J.D.P. and H.C.; software, M.F.P.; validation, M.F.P., J.D.P. and W.L.A.; formal analysis, M.F.P. and J.D.P.; investigation, M.F.P., J.D.P. and W.L.A.; writing—original draft preparation, M.F.P., J.D.P., W.L.A., H.C., Y.H., Z.C. and Q.L.; writing—review and editing, M.F.P., J.D.P., W.L.A., H.C., Y.H., Z.C. and Q.L.; supervision, H.C. and W.L.A.; project administration, M.F.P.; funding acquisition, M.F.P., W.L.A. and H.C. All authors have read and agreed to the published version of the manuscript.

Funding

This research was funded by the National Council for Scientific and Technological Development (CNPq-Brazil, Grant 404357/2013-0). We are thankful for the scholarships granted by CNPq-Brazil (Grant 163524/2017-3 to M.F.P.). The research fellowship granted by CNPq-Brazil to W.L.A. is also gratefully acknowledged.

Data Availability Statement

Not applicable.

Acknowledgments

The authors thank Embrapa Agroenergia (Brasília, DF, Brazil) for donating the J. curcas seeds and Embrapa Semiárido (Petrolina, PE, Brazil) for providing all infrastructure for the assembly of this study. In addition, the authors extend special thanks to the Nucleus of Microscopy and Microanalysis at the Universidade Federal de Viçosa for technical assistance.

Conflicts of Interest

The authors declare no conflict of interest.

References

  1. Achten, W.M.J.; Maes, W.H.; Reubens, B.; Mathijs, E.; Singh, V.P.; Verchot, L.; Muys, B. Biomass production and allocation in Jatropha curcas L. seedlings under different levels of drought stress. Biomass Bioenergy 2010, 34, 667–676. [Google Scholar] [CrossRef]
  2. Díaz-López, L.; Gimeno, V.; Simón, I.; Martínez, V.; Rodrígues-Ortega, W.M.; García-Sánchez, F. Jatropha curcas seedlings show a water conservation strategy under drought conditions based on decreasing leaf growth and stomatal conductance. Agric. Water Manag. 2012, 105, 48–56. [Google Scholar] [CrossRef]
  3. Pompelli, M.F.; Barata-Luís, R.M.; Vitorino, H.S.; Gonçalves, E.R.; Rolim, E.V.; Santos, M.G.; Almeida-Cortez, J.S.; Endres, L. Photosynthesis, photoprotection and antioxidant activity of purging nut under drought deficit and recovery. Biomass Bioenergy 2010, 34, 1207–1215. [Google Scholar] [CrossRef]
  4. Silva, L.D.; Gomes, F.P.; Oliveira, P.S.; Almeida, F.R.; Pirovani, C.P.; Laviola, B.G.; Amaral, J.F.T. Plasticity of photosynthetic metabolism in Jatropha curcas genotypes under water stress. Gen. Mol. Res. 2019, 18, gmr18228. [Google Scholar] [CrossRef]
  5. Cabrales-Rodríguez, R.; Betancur-Hurtado, C.A.; Rodríguez-Páez, L.A. Cultivo del Piñón (Jatropha curcas L.); Manejo Nutricional y Usos en Córdoba, Colombia; Universidad de Córdoba: Montería, Colombia, 2019; p. 88. [Google Scholar]
  6. Bezerra-Neto, E.; Coelho, J.B.M.; Jarma-Orozco, A.; Rodríguez-Páez, L.A.; Pompelli, M.F. Modulation of photosynthesis under salinity and the role of mineral nutrients in Jatropha curcas L. J. Agron. Crop Sci. 2021, 208, 314–334. [Google Scholar] [CrossRef]
  7. Cabral, G.A.L.; Binneck, E.; Souza, M.C.P.; Silva, M.D.; Ferreira Neto, J.R.C.; Pompelli, M.F.; Endres, L.; Kido, E.A. First expressed TFome of physic nut (Jatropha curcas L.) after salt stimulus. Plant Mol. Biol. Rep. 2020, 38, 189–208. [Google Scholar] [CrossRef]
  8. Campos, M.L.O.; Hsie, B.S.; Granja, J.A.A.; Correia, R.M.; Silva, S.R.S.; Almeida-Cortez, J.S.; Pompelli, M.F. Photosynthesis and antioxidant activity mechanisms in Jatropha curcas L. under salt stress. Braz. J. Plant Physiol. 2012, 24, 55–67. [Google Scholar] [CrossRef]
  9. Dorta-Santos, M.A.; Barriola, I.; Wassner, D.F.; Ploschuk, E.L. Photosynthesis, fluorescence and mesophyll conductance responses to increasing salinity levels in Jatropha curcas at early vegetative stages. J. Agron. Crop Sci. 2020, 206, 52–63. [Google Scholar] [CrossRef]
  10. Gadelha, C.G.; Miranda, R.S.; Alencar, N.L.M.; Costa, J.H.; Prisco, J.T.; Gomes-Filho, E. Exogenous nitric oxide improves salt tolerance during establishment of Jatropha curcas seedlings by ameliorating oxidative damage and toxic ion accumulation. J. Plant Physiol. 2017, 212, 69–79. [Google Scholar] [CrossRef]
  11. Reubens, B.; Achten, W.M.J.; Maes, W.H.; Danjon, F.; Aerts, R.; Poesen, J.; Muys, B. More than biofuel? Jatropha curcas root system symmetry and potential for soil erosion control. J. Arid Environ. 2011, 75, 201–205. [Google Scholar] [CrossRef]
  12. Fairless, D. The little shrub that could—Maybe. Nature 2007, 449, 652–655. [Google Scholar] [CrossRef] [PubMed]
  13. Arockiasamy, S.; Kumpatla, J.; Hadole, S.; Yepuri, V.; Patil, M.; Shrivastava, V.; Rao, C.; Kancharla, N.; Jalali, S.; Varshney, A.; et al. Breeding and biotechnological efforts in Jatropha curcas L. for sustainable yields. Oil Crop Sci. 2021, 6, 180–191. [Google Scholar] [CrossRef]
  14. Pompelli, M.F.; Ferreira, P.P.B.; Chaves, A.R.M.; Figueiredo, R.C.Q.Q.; Martins, A.O.; Jarma-Orozco, A.; Batista-Silva, W.; Endres, L.; Araújo, W.L. Physiological, metabolic, and stomatal adjustments in response to salt stress in Jatropha curcas. Plant Physiol. Biochem. 2021, 168, 116–127. [Google Scholar] [CrossRef]
  15. Silva-Santos, L.; Corte-Real, N.; Dias-Pereira, J.; Figueiredo, R.C.B.Q.; Endres, L.; Pompelli, M.F. Salinity shock in Jatropha curcas leaves is more pronounced during recovery than during stress time. Braz. J. Dev. 2019, 5, 11359–11369. [Google Scholar] [CrossRef]
  16. Acosta-Motos, J.R.; Ortuño, M.F.; Bernal-Vicente, A.; Diaz-Vivancos, P.; Sanchez-Blanco, M.J.; Hernandez, J.A. Plant responses to salt stress: Adaptive mechanisms. Agronomy 2017, 7, 18. [Google Scholar] [CrossRef]
  17. Melo, G.M.; da Cunha, P.C.; Pereira, J.A.F.; Willadino, L.; Ulisses, C. Anatomical changes in the leaves and roots of Jatropha curcas L. cultivated under saline stress. Rev. Ciência Agric. 2011, 42, 670–674. [Google Scholar] [CrossRef]
  18. Ashraf, M.; Harris, P. Photosynthesis under stressful environments: An overview. Photosynthetica 2013, 51, 163–190. [Google Scholar] [CrossRef]
  19. Arcoverde, G.B.; Rodrigues, B.M.; Pompelli, M.F.; Santos, M.G. Water relations and some aspects of leaf metabolism of Jatropha curcas young plants under two water deficit levels and recovery. Braz. J. Plant Physiol. 2011, 23, 123–130. [Google Scholar] [CrossRef]
  20. Corte-Real, N.; Miranda, P.V.V.C.; Endres, L.; Souza, E.R.; Pompelli, M.F. Tolerance to salinity in Jatropha curcas are genotype-dependent. Braz. J. Dev. 2019, 5, 22169–22199. [Google Scholar] [CrossRef]
  21. Gomes, M.F.C.; Binneck, E.; Ferreira-Neto, J.R.C.; Luz, G.A.; Benko-Iseppon, A.M.; Pompelli, M.F.E.L.; Kido, É.A. Transcriptome analysis uncovers the Jatropha curcas L. transportome after NaCl (150 mM) exposure. Physiol. Plant 2021, in press. [Google Scholar]
  22. Pompelli, M.F.; Jarma-Orozco, A.; Rodrígues-Páez, L.A. Salinity in Jatropha curcas: A review of physiological, biochemical, and molecular factors involved. Agriculture 2022, 12, 594. [Google Scholar] [CrossRef]
  23. Melcher, P.J.; Holbrook, N.M.; Burns, M.J.; Zwieniecki, M.A.; Cobb, A.R.; Brodribb, T.J.; Sack, L. Measurements of stem xylem hydraulic conductivity in the laboratory and field. Methods Ecol. Evol. 2012, 3, 685–694. [Google Scholar] [CrossRef]
  24. Oliveira, P.S.; Pereira, L.S.; Silva, D.C.; Souza Júnior, J.O.; Laviola, B.G.; Gomes, F.P. Hydraulic conductivity in stem of young plants of Jatropha curcas L. cultivated under irrigated or water deficit conditions. Ind. Crops Prod. 2018, 116, 15–23. [Google Scholar] [CrossRef]
  25. Fernández-Marín, B.; Gulías, J.; Figueroa, C.M.; Iñiguez, C.; Clemente-Moreno, M.J.; Nunes-Nesi, A.; Fernie, A.R.; Cavieres, L.A.; Bravo, L.A.; García-Plazaola, J.I.; et al. How do vascular plants perform photosynthesis in extremeenvironments? An integrative ecophysiological andbiochemical story. Plant J. 2020, 101, 979–1000. [Google Scholar] [CrossRef] [PubMed]
  26. Gauhl, E.; Björkman, O. Simultaneous measurements on the effect of oxygen concentration on water vapor and carbon dioxide exchange in leaves. Planta 1969, 88, 187–191. [Google Scholar] [CrossRef]
  27. Lin, J.; Li, J.P.; Yuan, F.; Yang, Z.; Wang, B.S.; Chen, M. Transcriptome profiling of genes involved in photosynthesis in Elaeagnus angustifolia L. under salt stress. Photosynthetica 2018, 56, 998–1009. [Google Scholar] [CrossRef]
  28. Sivakumar, P.; Sharmila, P.; Pardha-Saradhi, P. Proline alleviates salt-stress-induced enhancement in Ribulose-1,5-bisphosphate oxygenase activity. Biochem. Biophys. Res. Commun. 2000, 279, 512–515. [Google Scholar] [CrossRef]
  29. Choudhury, F.K.; Rivero, R.M.; Blumwald, E.; Mittler, R. Reactive oxygen species, abiotic stress and stress combination. Plant J. 2016, 90, 856–867. [Google Scholar] [CrossRef]
  30. Muchate, M.S.; Nikalje, G.C.; Rajurkar, N.S.; Suprasanna, P.; Nikam, T.D. Plant salt stress: Adaptive responses, tolerance mechanism and bioengineering for salt tolerance. Bot Rev. 2016, 82, 371–406. [Google Scholar] [CrossRef]
  31. El-Banna, M.F.; Abdelaal, K.A.A. Response of strawberry plants grown in the hydroponic system to pretreatment with H2O2 before exposure to salinity stress. J. Plant Prod. 2018, 9, 989–1001. [Google Scholar] [CrossRef]
  32. Bongi, G.; Loreto, F. Gas-exchange properties of saltstressed olive (Olea europea L.) leaves. Plant Physiol. 1989, 90, 1408–1416. [Google Scholar] [CrossRef] [PubMed]
  33. Terletskaya, N.; Kurmanbayeva, M. Change in leaf anatomical parameters of seedlings of different wheat species under conditions of drought and salt stress. Pak. J. Bot 2017, 49, 857–865. [Google Scholar]
  34. Toscano, S.; Ferrante, A.; Tribulato, A.; Romano, D. Leaf physiological and anatomical responses of Lantana and Ligustrum species under different water availability. Plant Physiol. Biochem. 2018, 127, 380–392. [Google Scholar] [CrossRef]
  35. Akcin, T.A.; Akcin, A.; Yalcin, E. Anatomical adaptations to salinity in Spergularia marina (Caryophyllaceae) from Turkey. Proc. Natl. Acad. Sci. India Sect. B Biol. Sci. 2014, 85, 625–634. [Google Scholar] [CrossRef]
  36. Trebst, A.; Tsujimoto, H.; Arnon, D. Separation of light and dark phases in the photosynthesis of isolated chloroplasts. Nature 1958, 182, 351–355. [Google Scholar] [CrossRef]
  37. Buchanan, B.B.; Wolosiuk, R.A. Photosynthesis: The carbon reactions. In Plant Physiology, 5th ed.; Taiz, L., Zeiger, E., Eds.; Sinauer Associates, Inc.: Sunderland, MA, USA, 2010; pp. 199–242. [Google Scholar]
  38. Atabayeva, S.; Nurmahanova, A.; Minocha, S.; Ahmetova, A.; Kenzhebayeva, S.; Aidosova, S.; Nurzhanova, A.; Zhardamalieva, A.; Asrandina, S.; Alybayeva, R.; et al. The effect of salinity on growth and anatomical attributes of barley seedling (Hordeum vulgare L.). Afr. J. Biotechnol. 2013, 12, 2366–2377. [Google Scholar]
  39. Souza, M.C.P.; Silva, M.D.; Binneck, E.; Cabral, G.A.L.; Iseppon, A.M.B.; Pompelli, M.F.; Endres, L.; Kido, E.A. RNA-Seq transcriptome analysis of Jatropha curcas L. accessions after salt stimulus and unigene-derived microsatellite mining. Ind. Crops Prod. 2020, 147, 112168. [Google Scholar] [CrossRef]
  40. Mendes, K.R.; Batista-Silva, W.; Dias-Pereira, J.; Pereira, M.P.S.; Souza, E.V.; Serrão, J.E.; Granja, J.A.A.; Pereira, E.C.; Gallacher, D.J.; Mutti, P.R.; et al. Leaf plasticity across wet and dry seasons in Croton blanchetianus (Euphorbiaceae) at a tropical dry forest. Sci. Rep. 2022, 12, 954. [Google Scholar] [CrossRef]
  41. Sterck, F.J.; Zweifel, R.; Sass-Klaassen, U.; Chowdhury, Q. Persisting soil drought reduces leaf specific conductivity in Scots pine (Pinus sylvestris) and pubescent oak (Quercus pubescens). Tree Physiol. 2008, 28, 529–536. [Google Scholar] [CrossRef]
  42. Scholz, A.; Klepsch, M.; Karimi, Z.; Jansen, S. How to quantify conduits in wood? Front. Plant Sci. 2013, 4, 56. [Google Scholar] [CrossRef]
  43. Karnovsky, M.J. A formaldehyde-glutaraldehyde fixative of high osmolality for use in electron microscopy. J. Cell Biol. 1965, 27, 137–138. [Google Scholar]
  44. Pompelli, M.F.; Martins, S.C.; Celin, E.F.; Ventrella, M.C.; DaMatta, F.M. What is the influence of ordinary epidermal cells and stomata on the leaf plasticity of coffee plants grown under full-sun and shady conditions? Braz. J. Biol. 2010, 70, 1083–1088. [Google Scholar] [CrossRef] [PubMed]
  45. Lin, Y.K.; Huang, C.F. Stochastic flow network reliability with tolerable error rate. Qual. Technol. Quant. Manag. 2013, 10, 57–73. [Google Scholar] [CrossRef]
  46. Hsie, B.S.; Mendes, K.R.; Antunes, W.C.; Endres, L.; Campos, M.L.O.; Souza, F.C.; Santos, N.D.; Singh, B.; Arruda, E.C.P.; Pompelli, M.F. Jatropha curcas L. (Euphorbiaceae) modulates stomatal traits in response to leaf-to-air vapor pressure deficit. Biomass Bioenergy 2015, 81, 273–281. [Google Scholar] [CrossRef]
  47. Leigh, A.; Sevanto, S.; Close, J.D.; Nicotra, A.B. The influence of leaf size and shape on leaf thermal dynamics: Does theory hold up under natural conditions? Plant Cell Environ. 2016, 40, 237–248. [Google Scholar] [CrossRef]
  48. Pompelli, M.F.; Mendes, K.R.; Ramos, M.V.; Santos, J.N.B.; Youssef, D.T.A.; Pereira, J.D.; Endres, L.; Jarma-Orozco, A.; Solano-Gomes, R.; Jarma-Arroyo, B.; et al. Mesophyll thickness and sclerophylly among Calotropis procera morphotypes reveal water-saved adaptation to environments. J. Arid Land 2019, 11, 795–810. [Google Scholar] [CrossRef]
  49. Peguero-Pina, J.J.; Sancho-Knapik, D.; Barrón, E.; Camarero, J.J.; Vilagrosa, A.; Gil-Pelegrín, E. Morphological and physiological divergences within Quercus ilex support the existence of different ecotypes depending on climatic dryness. Ann. Bot. 2014, 114, 301–313. [Google Scholar] [CrossRef]
  50. Gil-Pelegrín, E.; Saz, M.A.; Cuadrat, J.M.; Peguero-Pina, J.J.; Sancho-Knapik, D. Oaks Under Mediterranean-Type Climates: Functional Response to Summer Aridity. In Oaks Physiological Ecology. Exploring the Functional Diversity of Genus quercus L.; Gil-Pelegrín, E., Peguero-Pina, J.J., Sancho-Knapik, D., Eds.; Springer: London, UK, 2017; pp. 137–193. [Google Scholar]
  51. Taratima, W.; Samattha, C.; Maneerattanarungroj, P.; Trunjaruen, A. Physiological and anatomical response of rice (Oryza sativa L.) ‘Hom Mali Daeng’ at different salinity stress levels. Acta Agrobot. 2023, 76, 764. [Google Scholar] [CrossRef]
  52. Ola, H.; Elbar, A.; Farag, E.; Eisa, S.S.; Habib, S.A. Morpho-anatomical changes in salt stressed kallar grass (Leptochloa fusca L. Kunth). J. Agric. Biol. Sci. 2012, 8, 158–166. [Google Scholar]
  53. Barhoumi, Z.; Djebali, W.; Chaïbi, W.; Abdelly, C.; Smaoui, A. Salt impact on photosynthesis and leaf ultrastructure of Aeluropus littoralis. J. Plant Res. 2007, 120, 529–537. [Google Scholar] [CrossRef]
  54. Bastias, E.; Gonzales-Moro, M.B.; Gonzales-Murua, C. Zea mays L. amylacea from the Lluta Valley (Arica Chile) tolerates salinity stress when high levels of boron are available. Plant Soil. 2005, 267, 73–84. [Google Scholar] [CrossRef]
  55. Clemente-Moreno, M.J.; Gago, J.; Díaz-Vivancos, P.; Bernal, A.; Miedes, E.; Bresta, P.; Liakopoulos, G.; Fernie, A.R.; Hernández, J.A.; Flexas, J. The apoplastic antioxidant system and altered cell wall dynamics influence mesophyll conductance and the rate of photosynthesis. Plant J. 2019, 99, 1031–1046. [Google Scholar] [CrossRef] [PubMed]
  56. Taratima, W.; Ritmaha, T.; Jongrungklang, N.; Maneerattanarungroj, P.; Kunpratum, N. Effect of stress on the leaf anatomy of sugarcane cultivars with different drought tolerance (Saccharum officinarum, Poaceae). Rev. Biol. Trop. 2020, 68, 1159–1170. [Google Scholar] [CrossRef]
  57. Cavalcante, P.G.S.; Santos, C.M.; Filho, H.C.L.W.; Avelino, J.R.L.; Endres, L. Morpho-physiological adaptation of Jatropha curcas L. to salinity stress. Aust. J. Crop Sci. 2018, 12, 563–571. [Google Scholar] [CrossRef]
  58. Masrahi, Y.; Al-Namazi, A.; Alammari, B.; Alturki, T. Adaptations facilitate the invasion of Cylindropuntia rosea (DC.) Backeb. (Cactaceae) in the highlands of southwestern Saudi Arabia. Plant Signal. Behav. 2022, 17, 2144593. [Google Scholar] [CrossRef]
  59. Hunsche, M.; Bürling, K.; Saied, A.S.; Schmitz-Eiberger, M.; Sohail, M.; Gebauer, J.; Noga, G.; Buerkert, A. Effects of NaCl on surface properties, chlorophyll fluorescence and light remission, and cellular compounds of Grewia tenax (Forssk.) Fiori and Tamarindus indica L. leaves. Plant Growth Regul. 2010, 61, 253–263. [Google Scholar] [CrossRef]
  60. Tsuda, M.; Tyree, M.T. Plant hydraulic conductance measured by the high pressure flow meter in crop plants. J. Exp. Bot. 2000, 51, 823–828. [Google Scholar] [CrossRef]
  61. Poorter, L.; McDonald, I.; Alarcón, A.; Fichtler, E.; Licona, J.-C.; Peña-Claros, M.; Sterck, F.; Villegas, Z.; Sass-Klaassen, U. The importance of wood traits and hydraulic conductance for the performance and life history strategies of 42 rainforest tree species. New Phytol. 2010, 185, 481–492. [Google Scholar] [CrossRef]
  62. Dodd, I.C. Abscisic acid and stomatal closure: A hydraulic conductance conundrum? New Phytol. 2013, 197, 6–8. [Google Scholar] [CrossRef]
  63. Meinzer, F.; Grantz, D. Coordination of stomatal, hydraulic, and canopy boundary layer properties: Do stomata balance conductances by measuring transpiration? Physiol. Plant 1991, 83, 324–329. [Google Scholar] [CrossRef]
  64. North, G.B.; Brinton, E.K.; Browne, M.G.; Gillman, M.G.; Roddy, A.B.; Kho, T.L.; Wang, E.; Fung, V.A.; Brodersen, C.R. Hydraulic conductance, resistance, and resilience: How leaves of a tropical epiphyte respond to drought. Am. J. Bot. 2019, 106, 943–957. [Google Scholar] [CrossRef] [PubMed]
  65. Ladjal, M.; Huc, R.; Ducrey, M. Drought effects on hydraulic conductivity and xylem vulnerability to embolism in diverse species and provenances of Mediterranean cedars. Tree Physiol. 2005, 25, 1109–1117. [Google Scholar] [CrossRef] [PubMed]
  66. Linton, M.J.; Sperry, J.S.; Williams, D.G. Limits to water transport in Juniperus osteosperma and Pinus edulis: Implications for drought tolerance and regulation of transpiration. Funct. Ecol. 1998, 12, 906–911. [Google Scholar] [CrossRef]
  67. Hacke, U.G.; Sperry, J.S.; Pittermann, J. Drought experience and cavitation resistance in six shrubs from the Great Basin, Utah. Basic Appl. Ecol. 2000, 1, 31–41. [Google Scholar] [CrossRef]
  68. Santana, T.A.; Oliveira, P.S.; Silva, L.D.; Laviola, B.G.F.; de Almeida, A.-A.; Gomes, F.P. Water use efficiency and consumption in different Brazilian genotypes of Jatropha curcas L. subjected to soil water deficit. Biomass Bioenergy 2015, 75, 119–125. [Google Scholar] [CrossRef]
  69. Franks, P.J.; Gibson, A.; Bachelard, E.P. Xylem permeability and embolism susceptibility in seedlings of Eucalyptus camaldulensis Dehnh. from two different climatic zones. Aust. J. Plant Physiol. 1995, 22, 15–21. [Google Scholar] [CrossRef]
  70. Tyree, M. Dynamic measurements of root hydraulic conductance using a high pressure flowmeter in the laboratory and field. J. Exp. Bot. 1995, 46, 83–94. [Google Scholar] [CrossRef]
  71. Charrier, G.; Torres-Ruiz, J.M.; Badel, E.; Burlett, R.; Choat, B.; Cochard, H.; Delmas, C.E.L.; Domec, J.C.; Jansen, S.; King, A.; et al. Evidence for hydraulic vulnerability segmentation and lack of xylem refilling under tension. Plant Physiol. 2016, 172, 1657–1668. [Google Scholar] [CrossRef]
  72. Xu, T.; Zhang, L.; Li, Z. Computational fluid dynamics model and flow resistance characteristics of Jatropha curcas L xylem vessel. Sci. Rep. 2020, 10, 14728. [Google Scholar] [CrossRef]
  73. Neves, E.L.; Funch, L.S.; Viana, B.F. Comportamento fenológico de três espécies de Jatropha (Euphorbiaceae) da Caatinga, semi-árido do Brasil. Braz. J. Bot. 2010, 33, 155–166. [Google Scholar] [CrossRef]
  74. Krishnamurthy, L.; Zaman-Allah, M.; Marimuthu, S.; Wani, S.P.; Kesava Rao, A.V.R. Root growth in Jatropha and its implications for drought adaptation. Biomass Bioenergy 2012, 39, 247–252. [Google Scholar] [CrossRef]
  75. Tavecchio, N.; Reinoso, H.; Ruffini Castiglione, M.; Spanò, C.; Pedranzani, H.E. Anatomical studies of two Jatropha species with importance for biodiesel production. J. Agric. Sci. 2016, 8, 84–94. [Google Scholar] [CrossRef]
  76. Lei, Z.Y.; Han, J.M.; Yi, X.P.; Zhang, W.F.; Zhang, Y.L. Coordinated variation between veins and stomata in cotton and its relationship with water-use efficiency under drought stress. Photosynthetica 2018, 56, 1326–1335. [Google Scholar] [CrossRef]
  77. Drake, P.L.; Froend, R.H.; Franks, P.J. Smaller, faster stomata: Scaling of stomatal size, rate of response, and stomatal conductance. J. Exp. Bot. 2013, 64, 495–505. [Google Scholar] [CrossRef] [PubMed]
  78. Carins, M.R.; Jordan, G.J.; Brodribb, T.J. Differential leaf expansion can enable hydraulic acclimation to sun and shade. Plant Cell Environ. 2012, 35, 1407–1418. [Google Scholar] [CrossRef]
  79. Hameed, M.; Ashraf, M.; Naz, N.; Al-Qurainy, F. Anatomical adaptations of Cynodon dactylon (L.) Pers. from the salt range Pakistan to salinity stress. I. Root and stem anatomy. Pak. J. Bot. 2010, 42, 279–289. [Google Scholar]
  80. Franks, P.J.; Drake, P.L.; Beerling, D.J. Plasticity in maximum stomatal conductance constrained by negative correlation between stomatal size and density: An analysis using Eucalyptus globulus. Plant Cell Environ. 2009, 32, 1737–1748. [Google Scholar] [CrossRef]
  81. Rahman, A.A.N.S.; Rahman, M.; Shimanto, M.H.; Kibria, M.G.; Islam, M.A. Stomatal size and density trade-off varies with leaf phenology and species shade tolerance in a South Asian moist tropical forest. Funct. Plant Biol. 2022, 49, 307–318. [Google Scholar] [CrossRef]
  82. Xu, Z.; Zhou, G. Responses of leaf stomatal density to water status and its relationship with photosynthesis in a grass. J. Exp. Bot. 2008, 59, 3317–3325. [Google Scholar] [CrossRef]
  83. Zhang, S.B.; Guan, Z.J.; Sun, M.; Zhang, J.-J.; Cao, K.-F.; Hu, H. Evolutionary association of stomatal traits with leaf vein density in Paphiopedilum, Orchidaceae. PLoS ONE 2012, 7, e40080. [Google Scholar] [CrossRef]
  84. Dunford, S. Translocation in the Phloem. In Plant Physiology, 5th ed.; Taiz, L., Zeiger, E., Eds.; Sinauer Associates Inc.: Sunderland, MA, USA, 2010; pp. 271–303. [Google Scholar]
  85. DaMatta, F.M.; Cunha, R.L.; Antunes, W.C.; Martins, S.C.V.; Araujo, W.L.; Fernie, A.R.; Moraes, G.A.B.K. In field-grown coffee trees source-sink manipulation alters photosynthetic rates, independently of carbon metabolism, via alterations in stomatal function. New Phytol. 2008, 178, 348–357. [Google Scholar] [CrossRef] [PubMed]
  86. Smith, M.R.; Rao, I.M.; Merchant, A. Source-sink relationships in crop plants and their influence on yield development and nutritional quality. Front. Plant Sci. 2018, 9, 1889. [Google Scholar] [CrossRef] [PubMed]
  87. Zhai, L.; Yan, A.; Shao, K.; Wang, S.; Wang, Y.; Chen, Z.-H.; Xu, J. Large vascular bundle phloem area 4 enhances grain yield and quality in rice via source–sink–flow. Plant Physiol. 2023, 191, 317–334. [Google Scholar] [CrossRef] [PubMed]
  88. Haibo, D.; Zhang, W.; Hua, B.; Zhu, Z.; Zhang, J.; Zhang, Z. Cucumber STACHYOSE SYNTHASE is regulated by its cis-antisense RNA asCsSTS to balance source–sink carbon partitioning. Plant Cell 2023, 35, 435–452. [Google Scholar] [CrossRef]
  89. Miehe, W.; Czempik, L.; Klebl, F.; Lohaus, G. Sugar concentrations and expression of SUTs suggest active phloem loading in tall trees of Fagus sylvatica and Quercus robur. Tree Physiol. 2023, 43, 805–816. [Google Scholar] [CrossRef]
  90. Chen, L.; Ganguly, D.R.; Shafik, S.H.; Danila, F.; Grof, C.P.L.; Sharwood, R.E.; Furbank, R.T. The role of SWEET4 proteins in the post-phloem sugar transport pathway of Setaria viridis sink tissues. J. Exp. Bot. 2023, 74, 2968–2986. [Google Scholar] [CrossRef]
  91. Taylor, A.O.; Craig, A.S. Plants under climatic stress: II. low temperature, high light effects on chloroplast ultrastructure. Plant Physiol. 1971, 47, 719–725. [Google Scholar] [CrossRef]
  92. Ackerson, R.C.; Hebert, E.R. Osmoregulation in cotton in response to water stress: I. alterations in photosynthesis, leaf conductance, translocation, and ultrastructure. Plant Physiol. 1981, 67, 484–488. [Google Scholar] [CrossRef]
  93. Capellades, M.; Lemeur, R.; Debergh, P. Effects of sucrose on starch accumulation and rate of photosynthesis in rosa cultured in vitro. Plant Cell Tissue Organ Cult. 1991, 25, 21–26. [Google Scholar] [CrossRef]
Figure 1. Total leaf thickness (A,B), adaxial epidermis thickness (C,D), abaxial epidermis thickness (E,F), and palisade parenchyma thickness (G,H) of 1-year-old (A,C,E,G) and 2-year-old (B,D,F,H) Jatropha curcas genotype CNPAE183, CNPAE218, and CNPAE171 subjected to irrigation water with electrical conductivities of 0 dS m−1, 2.5 dS m−1, 5.0 dS m−1, 7.5 dS m−1, and 10.0 dS m−1. All data are expressed as means ± SE (n = 500). Different lowercase letters denote a significance within the salt concentration for each genotype, different uppercase letters denote a significance within the genotypes for the same salt concentration, and asterisks (*) denote significance within the sample data (1- and 2-year-old plants).
Forests 14 01868 g001
Figure 2. Spongy parenchyma thickness (A,B), palisade to spongy parenchyma (PP:PS) thickness ratio, (C,D) palisade layers on mesophyll (E,F), air spaces in mesophyll (G,H), and oxalate crystals in the mesophyll (I,J) of 1-year-old (A,C,E,G,I) and 2-year-old (B,D,F,H,J) Jatropha curcas genotype CNPAE183, CNPAE218, and CNPAE171 subjected to irrigation water with electrical conductivities of 0 dS m−1, 2.5 dS m−1, 5.0 dS m−1, 7.5 dS m−1, and 10.0 dS m−1. All data are expressed as means ± SE (n = 500). Different lowercase letters denote significance within the salt concentration for each genotype, uppercase letters denote significance within genotypes for the same salt concentration, and asterisks (*) denote significance within the sample data (1- and 2-year-old plants).
Forests 14 01868 g002
Figure 3. Light micrographs of cross sections of the CNPAE183 (A,B), CNPAE218 (C,D), and CNPAE171 (E,F) 1-year-old Jatropha curcas genotypes subjected to irrigation water with electrical conductivities of 0 dS m−1, (A,C,E) or 10 dS m−1 (B,D,F). PP, palisade parenchyma; SP, spongy parenchyma; VB, vascular bundles. Green arrows represent the bistratified epidermis in the abaxial surface. Scales = 100 μm.
Forests 14 01868 g003
Figure 4. Lumen vessel area (A,B), vessel element density (C,D), sum xylem area (E,F), total xylem area (G,H), and thickness of xylem (I,J) measured in 1-year-old (A,C,E,G,I) or 2-year-old plants (B,D,F,H,J) and 3 genotypes (CNPAE183, CNPAE218, and JCAL171) of Jatropha curcas under control (brown), 2.5 dS m−1 (orange), 5.0 dS m−1 (yellow), 7.5 dS m−1 (green), and 10.0 dS m−1 (blue) promoted by the addition of NaCl to the Hoagland solution. All data were measured in 100 repetitions per treatment, where in each repetition, all vessel elements were computed as described in the Materials and Methods section. Different lowercase letters denote significant differences between the salt concentrations within in the same genotype, and different uppercase letters denote significant differences between genotypes within the same salt concentration. Asterisks (*) denote significant differences between the 1-year-old and 2-year-old J. curcas plants.
Forests 14 01868 g004
Figure 5. Midrib thickness (A,B), midrib length (C,D), total midrib area (E,F), and potential conductivity of vessels (Kp; G,H) measured in 1-year-old (A,C,E,G) or 2-year-old plants (B,D,F,H) and 3 genotypes (CNPAE183, CNPAE218, and JCAL171) of Jatropha curcas under control (brown), 2.5 dS m−1 (orange), 5.0 dS m−1 (yellow), 7.5 dS m−1 (green), and 10.0 dS m−1 (blue) promoted by the addition of NaCl to a Hoagland solution. All data were measured in 100 repetitions per treatment, where in each repetition, all vessel elements were computed as described in the Materials and Methods section. Different lowercase letters denote significant differences between salt concentrations within the same genotype, and different uppercase letters denote significant differences between genotypes within the same salt concentration. Asterisks (*) denote significant differences between the 1-year-old and 2-year-old J. curcas plants.
Forests 14 01868 g005
Figure 6. Stomatal density (A,B), ordinary cell density (C,D), and the stomatal index (E,F) measured on the abaxial surface of a leaf of 1-year-old (A,C,E) or 2-year-old plants (B,D,F) and 3 genotypes (CNPAE183, CNPAE218, and JCAL171) of Jatropha curcas under control (brown), 2.5 dS m−1 (orange), 5.0 dS m−1 (yellow), 7.5 dS m−1 (green), and 10.0 dS m−1 (blue) promoted by the addition of NaCl to a Hoagland solution. All data were measured in 20 repetitions per saline treatment, where in each repetition, all features were computed as described in the Materials and Methods section. Different lowercase letters denote significant differences between salt concentrations within the same genotype, and different uppercase letters denote significant differences between genotypes within the same salt concentration. Asterisks (*) denote significant differences between the 1-year-old and 2-year-old J. curcas plants.
Forests 14 01868 g006
Figure 7. Stomatal density (A,B), ordinary cell density (C,D), and stomatal index (E,F) measured on leaf adaxial surfaces of leaves from a 1-year-old (A,C,E) or 2-year-old plant (B,D,F) and 3 genotypes (CNPAE183, CNPAE218, and JCAL171) of Jatropha curcas under control condition (brown), 2.5 dS m−1 (orange), 5.0 dS m−1 (yellow), 7.5 dS m−1 (green), and 10.0 dS m−1 (blue) promoted by the addition of NaCl to a Hoagland solution. All data were measured in 20 repetitions per saline treatment, where in each repetition, all features were computed as described in the Materials and Methods section. Different lowercase letters denote significant differences between salt concentrations within the same genotype, and different uppercase letters denote significant differences between genotypes within the same salt concentration. Asterisks (*) denote significant differences between the 1-year-old and 2-year-old J. curcas plants.
Forests 14 01868 g007
Figure 8. Ordinary cell area (A,B), stomatal complex area (C,D), stomatal area (E,F), and stomatal pore area (G,H) measured on the abaxial surfaces of leaves from 1-year-old (A,C,E,G) or 2-year-old plants (B,D,F,H) and 3 genotypes (CNPAE183, CNPAE218, and JCAL171) of Jatropha curcas under control condition (brown), 2.5 dS m−1 (orange), 5.0 dS m−1 (yellow), 7.5 dS m−1 (green), and 10.0 dS m−1 (blue) promoted by the addition of NaCl to a Hoagland solution. All data were measured in 500 (A,B) and 30 (CH) repetitions per treatment, where in each repetition, all features were computed as described in the Materials and Methods section. Different lowercase letters denote significant differences between salt concentrations within the same genotype, and different uppercase letters denote significant differences between genotypes within the same salt concentration. Asterisks (*) denote significant differences between the 1-year-old and 2-year-old J. curcas plants.
Forests 14 01868 g008
Figure 9. Ordinary cell area (A,B), stomatal complex area (C,D), stomatal area (E,F), and stomatal pore area (G,H) measured on the adaxial surface of leaves from 1-year-old (A,C,E,G) or 2-year-old plants (B,D,F,H) and 3 genotypes (CNPAE183, CNPAE218, and JCAL171) of Jatropha curcas under control conditions (brown), 2.5 dS m−1 (orange), 5.0 dS m−1 (yellow), 7.5 dS m−1 (green), and 10.0 dS m−1 (blue) promoted by the addition of NaCl to a Hoagland solution. All data were measured in 500 (A,B) and 30 (CH) repetitions per treatment, where in each repetition, all features were computed as described in the Materials and Methods section. Different lowercase letters denote significant differences between salt concentrations within the same genotype, and different uppercase letters denote significant differences between genotypes within the same salt concentration. Asterisks (*) denote significant differences between the 1-year-old and 2-year-old J. curcas plants.
Forests 14 01868 g009
Figure 10. Scanning electron microscopy (SEM) showing adaxial (A,B) and abaxial (C,E) epidermis surfaces with fully opened, partially opened, and closed stomata. (D,E) Stomata with the highest magnitude that exhibit both striated (D) and non-striated open stomata, both on the abaxial epidermis surface. (F) Low magnitude of abaxial epidermis surfaces displaying a very hairy and reflective abaxial epidermis, which is detailed as shown in (G). Scales: (AC), 50 μm; (D,E), 10 μm; (F,G), 100 μm. All images were captured in 2-year-old Jatropha curcas plants under 0 dS m−1 (A,B,D,E) and 10 dS m−1 (C) after SEM preparation.
Forests 14 01868 g010
Figure 11. Cell area occupied by chloroplast (A), chloroplast area (B), grana thickness (C), grana width (D), grana thickness to width ratio (E), grana area (F) stacking grana (G), lamellae per grana (H), starch granules per chloroplast (I), and number of plastoglobulus (J) measured in a 5 mm2 ultrathin layer of 1-year old, 2-year old, and control Jatropha curcas plants under 10.0 dS m−1 promoted by NaCl addition to a Hoagland solution. All measurement data were taken from 25 ultrathin cuts (5 mm2) from at least 3 replicates as described in the Materials and Methods section. Different lowercase letters denote significant differences between salt concentrations within the same genotype, and different capital letters denote significant differences between genotypes within the same salt concentration.
Forests 14 01868 g011
Figure 12. TEM showing regular ellipsoidal-shaped chloroplasts of CNPAE183 (A,B), CNPAE171 (C,D), and CNPAE218 (E,F) Jatropha curcas genotypes under 0 dS m−1 sampled from 1-year-old plants. All images show granal lamellae (large white arrows), plastoglobulus (P), and starch grains (SGs). (A,C,E) show an overview of chloroplasts, while (B,D,F) display an overview of granum and stroma lamellae. Mitochondria are also visible in (C). Scales: (A,C,E), 1 μm; (B,D,F), 500 nm.
Forests 14 01868 g012
Figure 13. Transmission electron microscopy (TEM) showing regular ellipsoidal-shaped chloroplasts of CNPAE183 (A,B), CNPAE171 (C,D), and CNPAE218 (E,F) in 1-year-old Jatropha curcas genotypes under 10 dS m−1 EC. All images show large starch grains (SGs), granal lamellae (large white arrows; GL), plastoglobulus (P), and stroma lamellae (SL). (A,C,E) show an overview of chloroplasts, while (B,D,F) display an overview of granum and stroma lamellae. In (A), the cell walls (CWs) are visible; in (F), a disruption of the outer envelope (black arrows) is highlighted. Scales: (A,C,E), 1 μm; (B,D,F), 500 nm.
Forests 14 01868 g013
Figure 14. Transmission electron microscopy (TEM) showing regular ellipsoidal-shaped chloroplasts of CNPAE183 (A,B), CNPAE171 (C,D), and CNPAE218 (E,F) from 2-year-old Jatropha curcas genotype plants under 10 dS m−1 EC. All images show large starch grains (SGs), granal lamellae (large white arrows; GL), plastoglobulus (P), and stroma lamellae. (A,C,E) show an overview of chloroplasts, while (B,D,F) display an overview of granum and stroma lamellae. In (C), numerous plastoglobules are visible. In (D,F), a disruption of thylakoids caused by large starch grains is highlighted as a contrast against A, which displays intact grana and stroma lamellae. Scales: (A,C,E), 1 μm; (B,D,F), 500 nm.
Forests 14 01868 g014
Figure 15. Multivariate analysis to assess all anatomical and ultrastructural characteristics of Jatropha curcas genotypes. In (A), all treatments are displayed in PC1 and PC2 to show a four cluster formation. In (B), a dendrogram based on similarities between genotypes and salt treatments is shown. In (C), the spatial distribution of all analyzed features displays the strength of each anatomical and ultrastructural characteristic: AbET, abaxial epidermis thickness; AdET, adaxial epidermis thickness; Chl area, chloroplast area; AOC, area occupied by chloroplast; LpG, lamellae per grana; OCA, ordinary cell area; OCD, ordinary cell density; PP, palisade parenchyma; SA, stomatal area; SCA, stomatal complex area; SD, stomatal density; SI, stomatic index; SP, spongy parenchyma; SPA, stomatal pore area; Stk, grana stacking; TLT, total leaf area.
Forests 14 01868 g015
Disclaimer/Publisher’s Note: The statements, opinions and data contained in all publications are solely those of the individual author(s) and contributor(s) and not of MDPI and/or the editor(s). MDPI and/or the editor(s) disclaim responsibility for any injury to people or property resulting from any ideas, methods, instructions or products referred to in the content.

