1. Introduction
Tree biomass constitutes a fundamental attribute of forest ecosystems and serves as a prerequisite for studying forest productivity, nutrient cycling, and estimating biomass energy, carbon storage, and sequestration [
1,
2]. Accurately estimating tree biomass holds significant importance in monitoring and managing forest resources, and plays a crucial role in understanding regional climate change and material cycles [
3,
4]. The single-tree biomass model has traditionally been a popular method for estimating tree biomass due to its simplicity and flexibility. Numerous studies have revealed a strong correlation between tree parameters (e.g., diameter at breast height, tree height, crown width, and wood density) and the biomass of individual forest trees [
5,
6]. The allometric model approach, which establishes a biomass model based on these tree parameters, represents a relatively accurate and convenient research method [
7]. This approach was included in the National Forest Inventory estimation in the IPCC 2019 [
8], which involved developing individual tree biomass equations to estimate biomass in foliage, branches, stems, and other tree components. This approach ultimately provided estimates of aboveground biomass and carbon content in live trees.
The error associated with estimating single-tree biomass using allometric models primarily stems from several factors, including observation error, allometric model selection and estimation, and the scale of the landscape. Among these factors, our research focuses on the selection and estimation of the allometric model. The most commonly used allometric equation for biomass estimation in Chinese forestry employs a power function. However, if the biomass of each tree component is independently modeled using the power function, the sum of the predicted biomass for each component will not equal the predicted total biomass, indicating non-additivity [
9]. Additionally, equations for each component are typically estimated separately, without considering the inherent correlation among biomass components measured in the same sample trees. To address this issue and account for the inherent correlation between each component and total biomass, various forms of compatible biomass models have been proposed domestically and internationally to ensure additivity between component and total biomass [
10,
11]. Currently, there are two main compatible biomass model systems: the additive model system and the aggregation model system [
12]. Comparative studies have shown that the additive model system offers higher prediction accuracy and greater flexibility in applications [
13], making it more easily generalized in terms of model applicability. The model system achieves additivity between the total biomass and components by basing it on each component, ensuring the total equals the sum of the components.
The additive model system needs reliable parameter estimates to achieve accurate single-tree biomass estimation. Currently, the Nonlinear Seemingly Uncorrelated (NSUR) method is still considered the most reliable approach for estimating parameters in compatible biomass model systems [
14,
15]. This method can be applied to better understand the correlation between partial equations and also helps ensure the compatibility between different models and the effectiveness of parameter estimation, which usually employs weighted regression to eliminate heteroscedasticity when the sample size is considerably large [
16]. However, there are just a few studies on estimating these parameters when the sample size is limited, particularly in relation to the common issue of heteroscedasticity in biomass models. As destructive sampling is often costly, labor-intensive, or ecologically sensitive, obtaining large tree samples for allometric model estimation becomes increasingly challenging. Consequently, it becomes extremely necessary to estimate parameters for single-tree additive biomass models based on small sample data. Cai [
17] pointed out that the log transformation can eliminate heteroscedasticity in variance by linearizing the trend of variation. This approach can be considered for parameter estimation in NSUR models when dealing with small tree samples. Bi et al. [
18] also pointed out that for a system of additive biomass equations with heteroscedastic additive error terms, the generalized method of moments (GMM) can be employed to obtain efficient parameter estimates without specifying the nature of heteroscedasticity, thereby avoiding the difficulties associated.
This study is conducted based on the measured aboveground biomass data obtained from 71 felled samples of four tree species in the Xiaolongshan area of Gansu Province. After comparing the two model systems using the independent diameter variable and the combined variable, respectively, as well as the two-parameter estimating methods of logarithmic NSUR and GMM, we outlined a total of four distinct approaches and finally identified the most effective method for constructing biomass models and estimating parameters. This selection aims to provide valuable technical support for the calculation and research of single-tree biomass models using a small sample size.
2. Materials and Methods
2.1. Study Site and Samples
The study is carried out in the Xiaolong Mountains, located in the southeastern part of Gansu Province, China, within the geographical coordinates of 33°31′–34°34′ N, 104°23′–106°43′ E. Encompassing a vast area of 623,808 hectares, the region experiences a warm temperate climate with a semi-humid continental monsoon climate. The average annual temperature ranges from 7 °C to 12 °C, and the annual rainfall varies between 460 mm and 800 mm [
19].
The forest area in the Xiaolong Mountains covers 338,830 hectares, accounting for a forest coverage rate of 62.46%. The total stocking volume of the forest amounts to 25,536,825 m3, with 86.9% comprising young and middle-aged forests, and the remaining 13.1% classified as near mature, mature, and overmature forests. The dominant tree species primarily consist of hardwoods, with oak trees being the most abundant species in the area. Sharp-tooth oaks and Chinese pines occupy approximately 71.52% of the total forest area. Mixed miscellaneous forests are also commonly found in the region.
The dataset used in this research was obtained from a subset of data collected in the Dang Chuan Forestry Centre, which falls under the jurisdiction of the Xiaolong Mountain Forestry Bureau. The dataset includes descriptive statistics of 71 felled sample trees, comprising 10 Pinus armandii Franch (Adrien René Franchet, 1899), 10 Betula albo-sinensis Burk (Ernst Adolf Burkart, 1979), 19 Pinus tabuliformis (Félix Guillaumin, 1954), and 32 Quercus aliena var. acuteserrata (Takenoshin Nakai, 1919). After felling, the diameter at breast height (DBH) and height of each selected tree were measured using a measuring tape. Subsequently, the biomass of each tree was calculated after sampling and drying.
Upon felling the sample trees, the materials were meticulously separated into different components following the procedure established by Soares and Schaeffer-Novelli [
20]. These components included trunks, branches (with a diameter larger than 2.5 cm at the base), leaves, and skins. The weight of each component was measured in the field, representing the wet biomass. Afterward, the components were subjected to oven drying so we could determine their dry biomass. Finally, the total dry biomass was calculated by summing the dry biomass of all the components. Summaries of sampled trees are shown in
Table 1.
2.2. Methodologies
2.2.1. Additive Biomass Equations
In forestry studies in China, the power function is the most commonly used allometric equation for estimating individual tree biomass [
21,
22]. Among the different error structures used in this scholarly field, the additive error structure is widely adopted due to its popularity and ease of interpretation [
23,
24]. Therefore, the basic model for estimating individual tree biomass is defined as follows:
where
represents the biomass of each component, including aboveground biomass, trunk biomass, bark biomass, branch biomass, and leaf biomass (measured in kilograms).
represents the respective influencing variables, while
and
denote the model parameters. The term
represents the model error, assumed to follow a normal distribution.
In the biomass model above, the diameter at breast height (
DBH) was first selected as the primary variable due to its simplicity and practicality. To enhance the predictive accuracy, tree height (
H) can be paired with
DBH, resulting in a combined predictor variable known as
D2H (or
DBH2H, i.e., the product of
DBH squared and
H). Based on data obtained from visual inspections of trunks, branches, leaves, and skin, two different biomass equations with variables
and
were established independently for each component:
When each component’s biomass is modeled independently, the sum of the predicted biomass for each component may not equal the predicted total biomass, indicating non-additivity. Recognizing the inherent correlation between each component and the total biomass, various forms of compatible biomass models have been proposed to ensure additivity between each component’s biomass and the total biomass. Currently, the additive model system is considered to offer higher prediction accuracy and greater flexibility in applications [
13], making it easier to generalize the model’s applicability. The additive model system is based on each component, ensuring that the total biomass equals the sum of the biomass of each part, thereby achieving additivity between the total biomass and the individual components. With DBH as a variable, the additive model system can be outlined as:
With
D2H as a variable, the additive model system can be outlined as:
where
D is
DBH (cm).
represents the biomass of each component (measured in kilograms), including trunk biomass (
), branch biomass (
), leaf biomass (
), skin biomass (
) and total aboveground biomass (
). Parameter
represents the growth constant coefficient which reflects the rate of increase of a biological organism. Parameter
represents the allometric exponent which describes the differential impact of the independent variable on the biomass. The term
represents the model error, assumed to follow a normal distribution.
2.2.2. Parameter Estimation Methods
- (1)
Logarithmic NSUR
When it comes to parameter estimation in an additive model system, the Nonlinear Seemingly Unrelated Regression (NSUR) method is widely recognized as a reliable approach [
20,
21]. This method not only considers the correlation between partial equations but also ensures compatibility among different models, leading to effective parameter estimation. NSUR can be viewed as the nonlinear counterpart of Seemingly Unrelated Regression (SUR) models, which are a type of generalized linear model with a specific error structure matrix. The formulation of SUR models is represented as follows:
where X is a full-rank column matrix, β is the parameter vector, Σ is the error covariance matrix, e is the error vector, and
represents the n×n identity matrix.
However, a common issue encountered in tree biomass data is heteroscedasticity, characterized by unequal variances in the residuals. Therefore, addressing heteroscedasticity in variance is crucial for accurate parameter estimation in NSUR models [
7,
22]. The weighted regression method is commonly employed to tackle this issue. However, in cases with small sample sizes, accurately determining weighting functions that capture the underlying variance pattern of the error terms is difficult. Consequently, the weighted regression method may not effectively correct for heteroscedasticity in variance.
As an alternative approach, we employed a log transformation method to collectively estimate the residual variance in our samples. The log transformation is a technique used to eliminate heteroscedasticity while linearizing the trend of variation [
25]. By applying the log transformation to the data, we can stabilize the variance and achieve homoscedasticity, enabling more reliable parameter estimation in NSUR models. The logarithmic transformation process is as follows:
Based on Formula (1) mentioned above, we moved
to the left side of the equation and took the natural logarithm:
After making
=
and considering that
is very small, we use series expansion and keep the remainder only once, which leads us to the following equation:
To facilitate parameter estimation convergence, model 4 was coded as follows:
and model 5 was coded as:
The biomass models mentioned above were constructed using Stata software (version 17), and the model parameters were estimated using the NSUR method within the program.
- (2)
Generalized method of moments (GMM)
GMM is a flexible estimation method that can be applied to a wide range of models and estimation issues. It allows for the incorporation of various moment conditions that capture different aspects of the data-generating process. This flexibility makes GMM suitable for complex models and situations where traditional estimation methods may not be applicable. In addition, GMM estimation allows for the calculation of robust standard errors that account for heteroscedasticity and potential correlation at the moment conditions and helps ensure valid hypothesis tests, confidence intervals, and statistical inference, even in the presence of heteroscedasticity. Thus, for a system of biomass equations with heteroscedastic error terms, GMM is a valuable method to obtain efficient parameter estimates without specifying the nature of the heteroscedasticity [
18] and avoid potential issues with estimating the heteroscedastic error variance involving a small sample.
To estimate the parameters using GMM, we specified a set of moment conditions based on theoretical considerations. These moment conditions can be constructed using instruments, which are variables that are correlated with the endogenous variables but not directly affected by the error term. The choice of moment conditions and instruments depends on the specific modeling assumptions and research objectives. The conditional moment restriction of the equation is
where
,
is the
kth instrumental variable of
, and
is the estimated value of
,
represents the error.
The process of estimating parameters using the Generalized Method of Moments (GMM) involves three steps. First, it is necessary to formulate moment conditions that represent the relationship between data and parameters. Second, we have to calculate the sample moment conditions by averaging the moment conditions over the available data. Finally, we estimate the parameters by minimizing the discrepancy between the sample moment conditions and their population counterparts. This is implemented in Stata software (version 17), using the GMM commands and functions.
2.2.3. Model Assessment and Validation
In order to determine the most suitable parameters estimating method for an additive model system, we employed statistical measures such as the adjusted coefficient of determination (R
2) and the root mean square error (RMSE) for analysis. The adjusted R
2 is a commonly used indicator that quantifies the percentage of the total variation in the dependent variable explained by the predictor variables, providing insights into how well the model fits the data. A higher adjusted R
2 value indicates a better fit of the regression model. Moreover, the adjusted R
2 accounts for the inclusion of additional independent variables and penalizes the model for insignificant variables, mitigating the risk of including variables based on chance alone [
26]. By considering the adjusted R
2 in conjunction with other statistical measures, we can identify the optimal allometric model as:
where
k is the number of independent variables,
n is the sample size, and
n −
k − 1 represents the degrees of freedom of the regression model.
Root mean square error (RMSE) is commonly used as a standard statistical metric to evaluate the performance of models in biomass research and it has been widely adopted for assessing the accuracy of different scientific models. In the biomass field, the RMSE is frequently presented as the standard measure for quantifying model errors, involving the errors in applying parameter estimating methods. The errors between the observed and fitted values were calculated for each system equation of each species following parameter estimation. In our case, the RMSE accounts for both the magnitude and variability of errors, giving greater weight to errors with larger absolute values. The computation of the RMSE involves taking the square root of the average of the squared errors in the dataset.
where,
is the sample size, and
represents the observed dry weight.
It is important to note that in the Logarithmic NSUR method, the fitted values obtained from Model 10 using Stata 17 software are logarithmic values of predicted biomass values. To obtain the actual predicted biomass values, these logarithmic values need to be back-transformed. Subsequently, the errors between the observed and predicted biomass values were calculated for each equation in the system. Finally, the root mean square error (RMSE) was computed for the additive model system using the Logarithmic NSUR method.
3. Results
Table 2 provides the estimated coefficients and fit indices for the additive Biomass Equations when the diameter is used as the independent variable. As shown, all coefficients were found to be statistically significant at a confidence level of 0.05. However, there are noticeable differences between the two parameter estimation methods: logarithmic NSUR and GMM. In terms of model fit, all the values of RMSE in
Table 2 were significantly low compared to the biomass weights illustrated in
Table 1. This indicates that both the logarithmic NSUR and GMM methods produced accurate predictions of biomass. However, the GMM method resulted in smaller residual RMSE values for both the component and total tree biomass compared to the logarithmic NSUR method.
As shown in
Table 2, when considering diameter as the only independent variable in the system of additive biomass equations, the R
2 values for both the logarithmic NSUR and GMM methods were mostly higher than 0.9, indicating accurate predictions, except for the leaf component. For the trunk component, R
2 values ranged from 0.87 to 0.97, with higher values observed for the GMM method. Similarly, for the branch component, R
2 values ranged from 0.87 to 0.94, except for
Pinus armandii Franch. The R
2 values for the leaf component ranged from 0.42 to 0.89, with the lowest estimate of 0.42 for
Betula albosinensis Burk. For the skin component, R
2 values ranged from 0.81 to 0.95, with all values, except for
Quercus aliena var. acuteserrata, surpassing 0.91. For total biomass prediction, R
2 values ranged from 0.91 to 0.98, with higher values observed for the GMM method compared to the logarithmic NSUR method.
Table 3 provides the estimated coefficients and fit indices for the additive biomass equations when a combined variable of diameter and tree height is used as the independent variable. Similar to
Table 2, all coefficients were found to be statistically significant at a confidence level of 0.05. Regarding the fit indices RMSE, the GMM method resulted in smaller values for both the component and total tree biomass compared to the logarithmic NSUR method. The R
2 values for both the NSUR and GMM methods were mostly higher than 0.9, except for the leaf component prediction. For trunk component biomass prediction, R
2 values ranged from 0.94 to 0.98, with higher values observed for the GMM method, except for
Betula albosinensis Burk. During branch component biomass prediction, R
2 values ranged from 0.85 to 0.95, except for
Pinus armandii Franch. The R
2 values for leaf component biomass prediction ranged from 0.37 to 0.87, with the lowest estimate being 0.37 (
Pinus tabuliformis) obtained via the logarithmic NSUR method. For skin component biomass prediction, R
2 values ranged from 0.84 to 0.96. In addition, when we predicted total biomass, R
2 values ranged from 0.96 to 0.98, with higher values observed during the application of the GMM method, except for
Pinus armandii Franch.
For the four species with 10 or more sample trees mentioned in
Table 3, incorporating tree height into the combined predictor variable alongside diameter generally led to reduced values of residual RMSE for component and total tree biomass, except for the leaf component. However,
Pinus tabuliformis was an exception, as the RMSE value for the additive biomass equations utilizing only the independent variable was slightly higher than the results using a combined variable. Consistently, the inclusion of tree height in the combined predictor variable with diameter generally yielded higher values of the generalized R
2 for the component and total tree biomass. Except for
Pinus tabuliformis, the R
2 value for the equations using only the independent variable was slightly smaller than that of the combined variable of diameter and tree height.
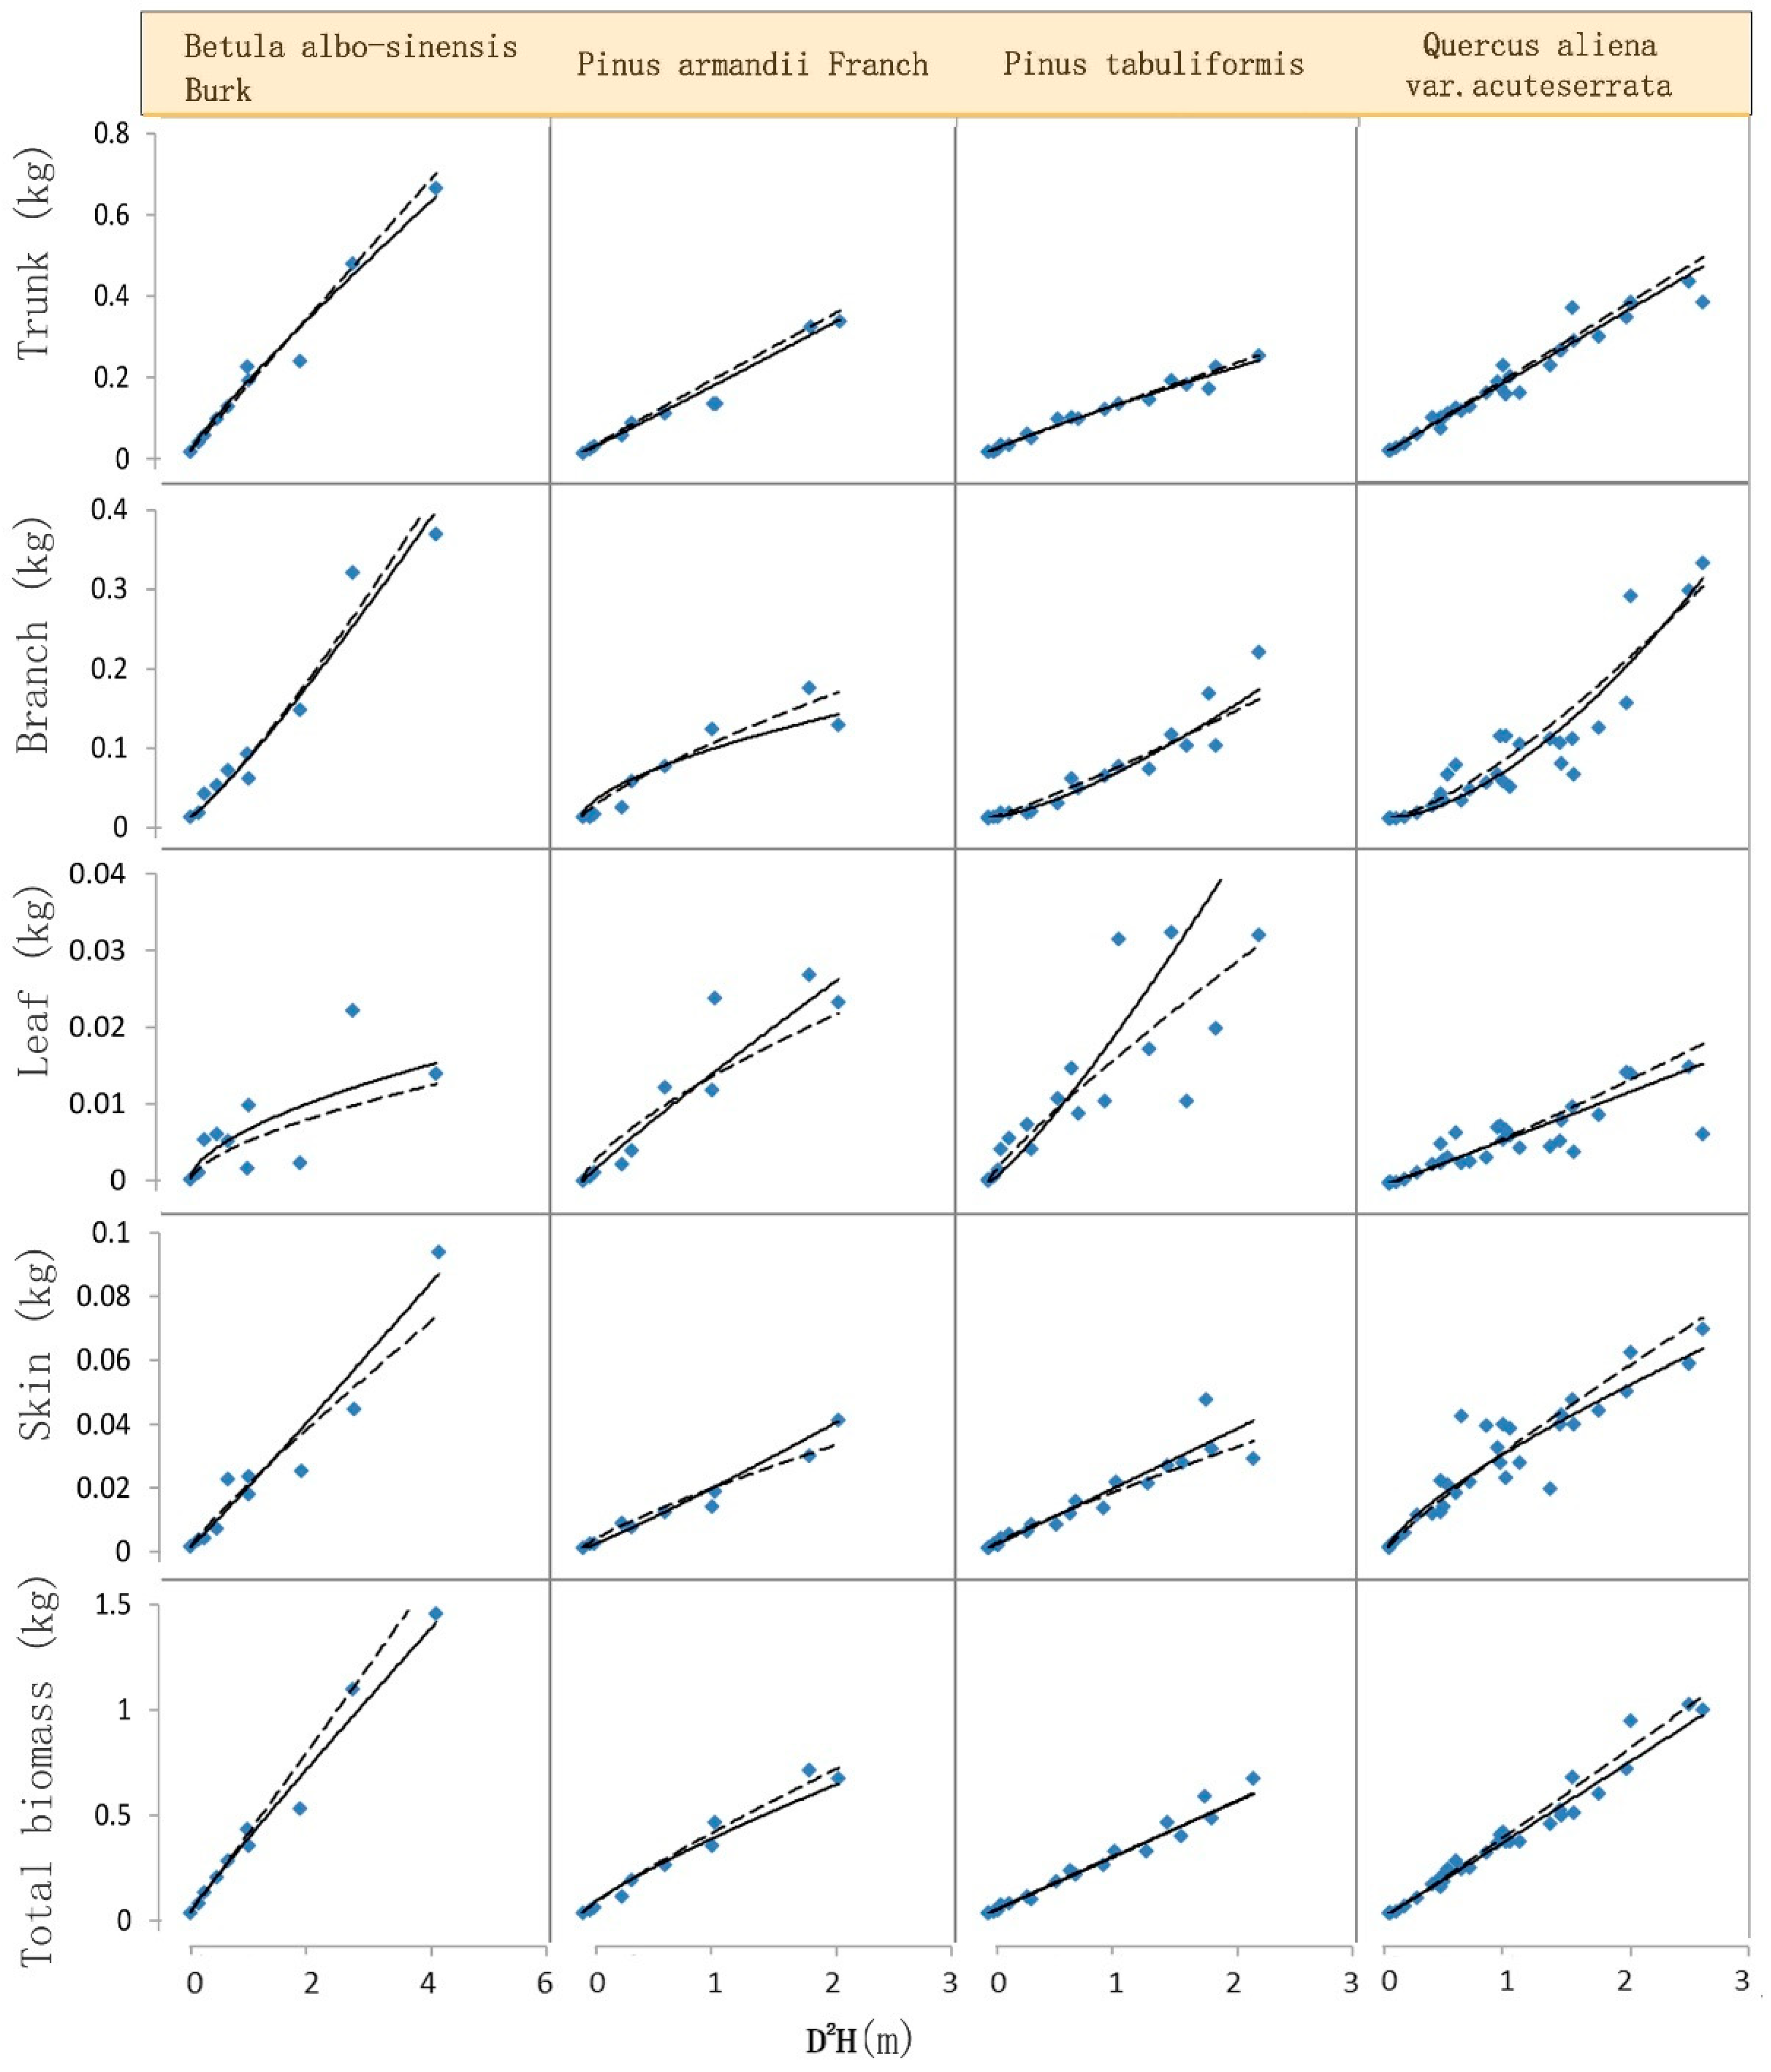
Figure 1 illustrates the fitted curves for all predicted biomass components and total tree biomass using logarithmic NSUR and GMM methods based on the system equations with the diameter as the independent variable. The measured data of tree samples considered true values are also plotted in the figure. Upon comparison, it can be observed that the additive biomass equations generally resulted in a good fit. The fitting was particularly satisfactory for trunk and branch components, as well as for skin components, while the leaf component exhibited larger discrepancies between the predicted and measured biomass. We also noticed that the fitting between the predicted and measured values was excellent for total tree biomass.
Similarly,
Figure 2 shows the fitting curve of aboveground biomass when we use the logarithmic NSUR and GMM methods based on the system equations with the combined variable of diameter and tree height. Among the four species, the results are better than that with the independent variable. The fitting was similar for trunk, branch, and skin components, but once again, the leaf component showed a greater deviation between the predicted and measured biomass. For total tree biomass, the fitting between the predicted and measured values was favorable.
4. Discussion
In response to the current limitation when it comes to analyzing additive biomass model parameters and handling the difficulty of obtaining large tree samples due to potential damage, this study focused on examining such parameters based on small sample data. Two model systems were established, one using diameter at breast height as the variable and the other incorporating both tree height and diameter at breast height. The NSUR method and GMM method were employed to analyze the parameters of these models. Comparing the results of RMSE and R2 presented in
Table 2 and
Table 3, it is evident that both methods yield satisfactory goodness of fit and estimation precision for the additive biomass models. The GMM method generally exhibited superior fitting for the biomass components and total tree biomass. Additionally, the additive biomass equations with the combined variable method outperformed the equations with diameter as the independent variable, as evidenced by the findings in
Figure 1 and
Figure 2. Overall, among the four approaches considered in this study, the GMM method with the combined variable is the most suitable approach for enforcing the additivity of different components. The NSUR method with the combined variable follows as the next favorable option. The GMM method with only the independent variable and the logarithmic NSUR method with only the independent variable rank subsequently in terms of suitability.
These findings provide evidence for the reliability of using the log transformation method in parameter estimation for NSUR models when dealing with small tree samples. Prior research by Bi et al. [
18] has also emphasized the effectiveness of employing log-transformed data in additive biomass model systems, as it successfully addresses the challenges associated with accurately representing the underlying pattern of residual variance in biomass components. Notably, our study took a step further by combining the log transformation method with NSUR models using small samples to analyze biomass, and our results convincingly demonstrate the reliability and effectiveness of this approach. Similarly, our study confirmed the reliability of the GMM method in handling small tree samples, aligning with the findings of Wang et al. [
27], who demonstrated that the GMM method efficiently generates parameter estimates under heteroscedastic conditions without requiring the specification of the heteroscedasticity nature.
In line with the study of Wang et al. [
27], our study also observed superior fitting for tree biomass using the GMM method, particularly when dealing with small sample data. Wang’s study specifically highlighted the GMM method’s ability to provide accurate biomass estimation. However, they focused on independently modeled equations rather than an additive model system that considers the relationship between the sum of predicted biomass for each component and the predicted total biomass. The reliability and accuracy of the GMM method in this work may be attributed to its ability to address endogeneity and heteroscedasticity, resulting in consistent, efficient, and robust parameter estimates. Moreover, the GMM method can handle complex data structures and identify underlying patterns in the data. Therefore, it is recommended over the logarithmic NSUR method for estimating parameters in additive biomass equations.
According to the results, it is evident that incorporating tree height in conjunction with diameter as a combined predictor variable generally leads to more accurate biomass estimates compared to equations that solely rely on diameter as the independent variable. This finding is consistent with previous studies, which have reported that incorporating tree height in the predictor variable typically improves the accuracy of estimating stem and total tree biomass, although the enhancement may be less pronounced for branch and leaf biomass [
28,
29,
30]. The results of our study further corroborate the notion that including tree height in the predictor variable enhances the accuracy of prediction (refer to
Table 2 and
Table 3). Taking into account the parameter analyzing methods mentioned earlier, the GMM method with a combined variable is the most suitable approach to ensure additivity among different biomass components for the small samples involved in this study.
5. Conclusions
Based on a small sample dataset comprising four tree species in the Xiaolongshan area of Gansu Province, we developed two additive biomass model systems using the independent diameter and the combined variable that comprises diameter and tree height. By employing the logarithmic NSUR method and GMM method, we estimated the parameters of these models and compared the results using fit indices and fitted curves. We outlined the following conclusions: (1) Both the GMM and logarithmic NSUR methods provided satisfactory goodness of fit and estimation precision for the additive biomass models, with the GMM method demonstrating slightly more accurate results. (2) Incorporating tree height into the predictor variable improved the estimation accuracy for total tree biomass and most component tree biomass. Overall, our study suggests that the GMM method with the combined variable is the most suitable approach for ensuring additivity among different biomass components when dealing with small sample sizes.
Several areas requiring further research have been identified. Firstly, based on the insights gained from this research, in addition to tree height, there are other variables such as tree crown width and tree age which can be considered predictors in the biomass models. By incorporating these additional variables, the accuracy of the biomass equation can be improved, thereby enhancing its precision. Secondly, if large tree samples can be obtained, it is helpful to compare the accuracy of biomass estimation models under different sample sizes, and further verify the reliability of the GMM method and logarithmic NSUR method with small sample sizes. Thirdly, alternative modeling techniques such as the Bayesian method can be considered to solve the problem of small sample estimation accuracy.


