
A Novel Strategy for Constructing Large-Scale Forest Scene: Integrating Forest Hierarchical Models and Tree Growth Models to Improve the Efficiency and Stability of Forest Polymorphism Simulation


 , , ,
, , ,
Abstract
1. Introduction
2. Materials and Methods
2.1. Study Areas
2.2. Data Collection
2.3. Data Analysis
2.3.1. Construction and Decomposition of Three-Dimensional Tree Model
2.3.2. Tree Hierarchical Growth Model
2.3.3. Visualization Simulation of Large-Scale Forest Scene Growth Dynamics Based on Forest Hierarchical Model
2.3.4. Evaluation Indicators for Large-Scale Forest Scene Construction
Frame Rate
Forest form Evaluation Method
3. Results
3.1. Forest Hierarchical Model
3.2. Visual Simulation Result Evaluation
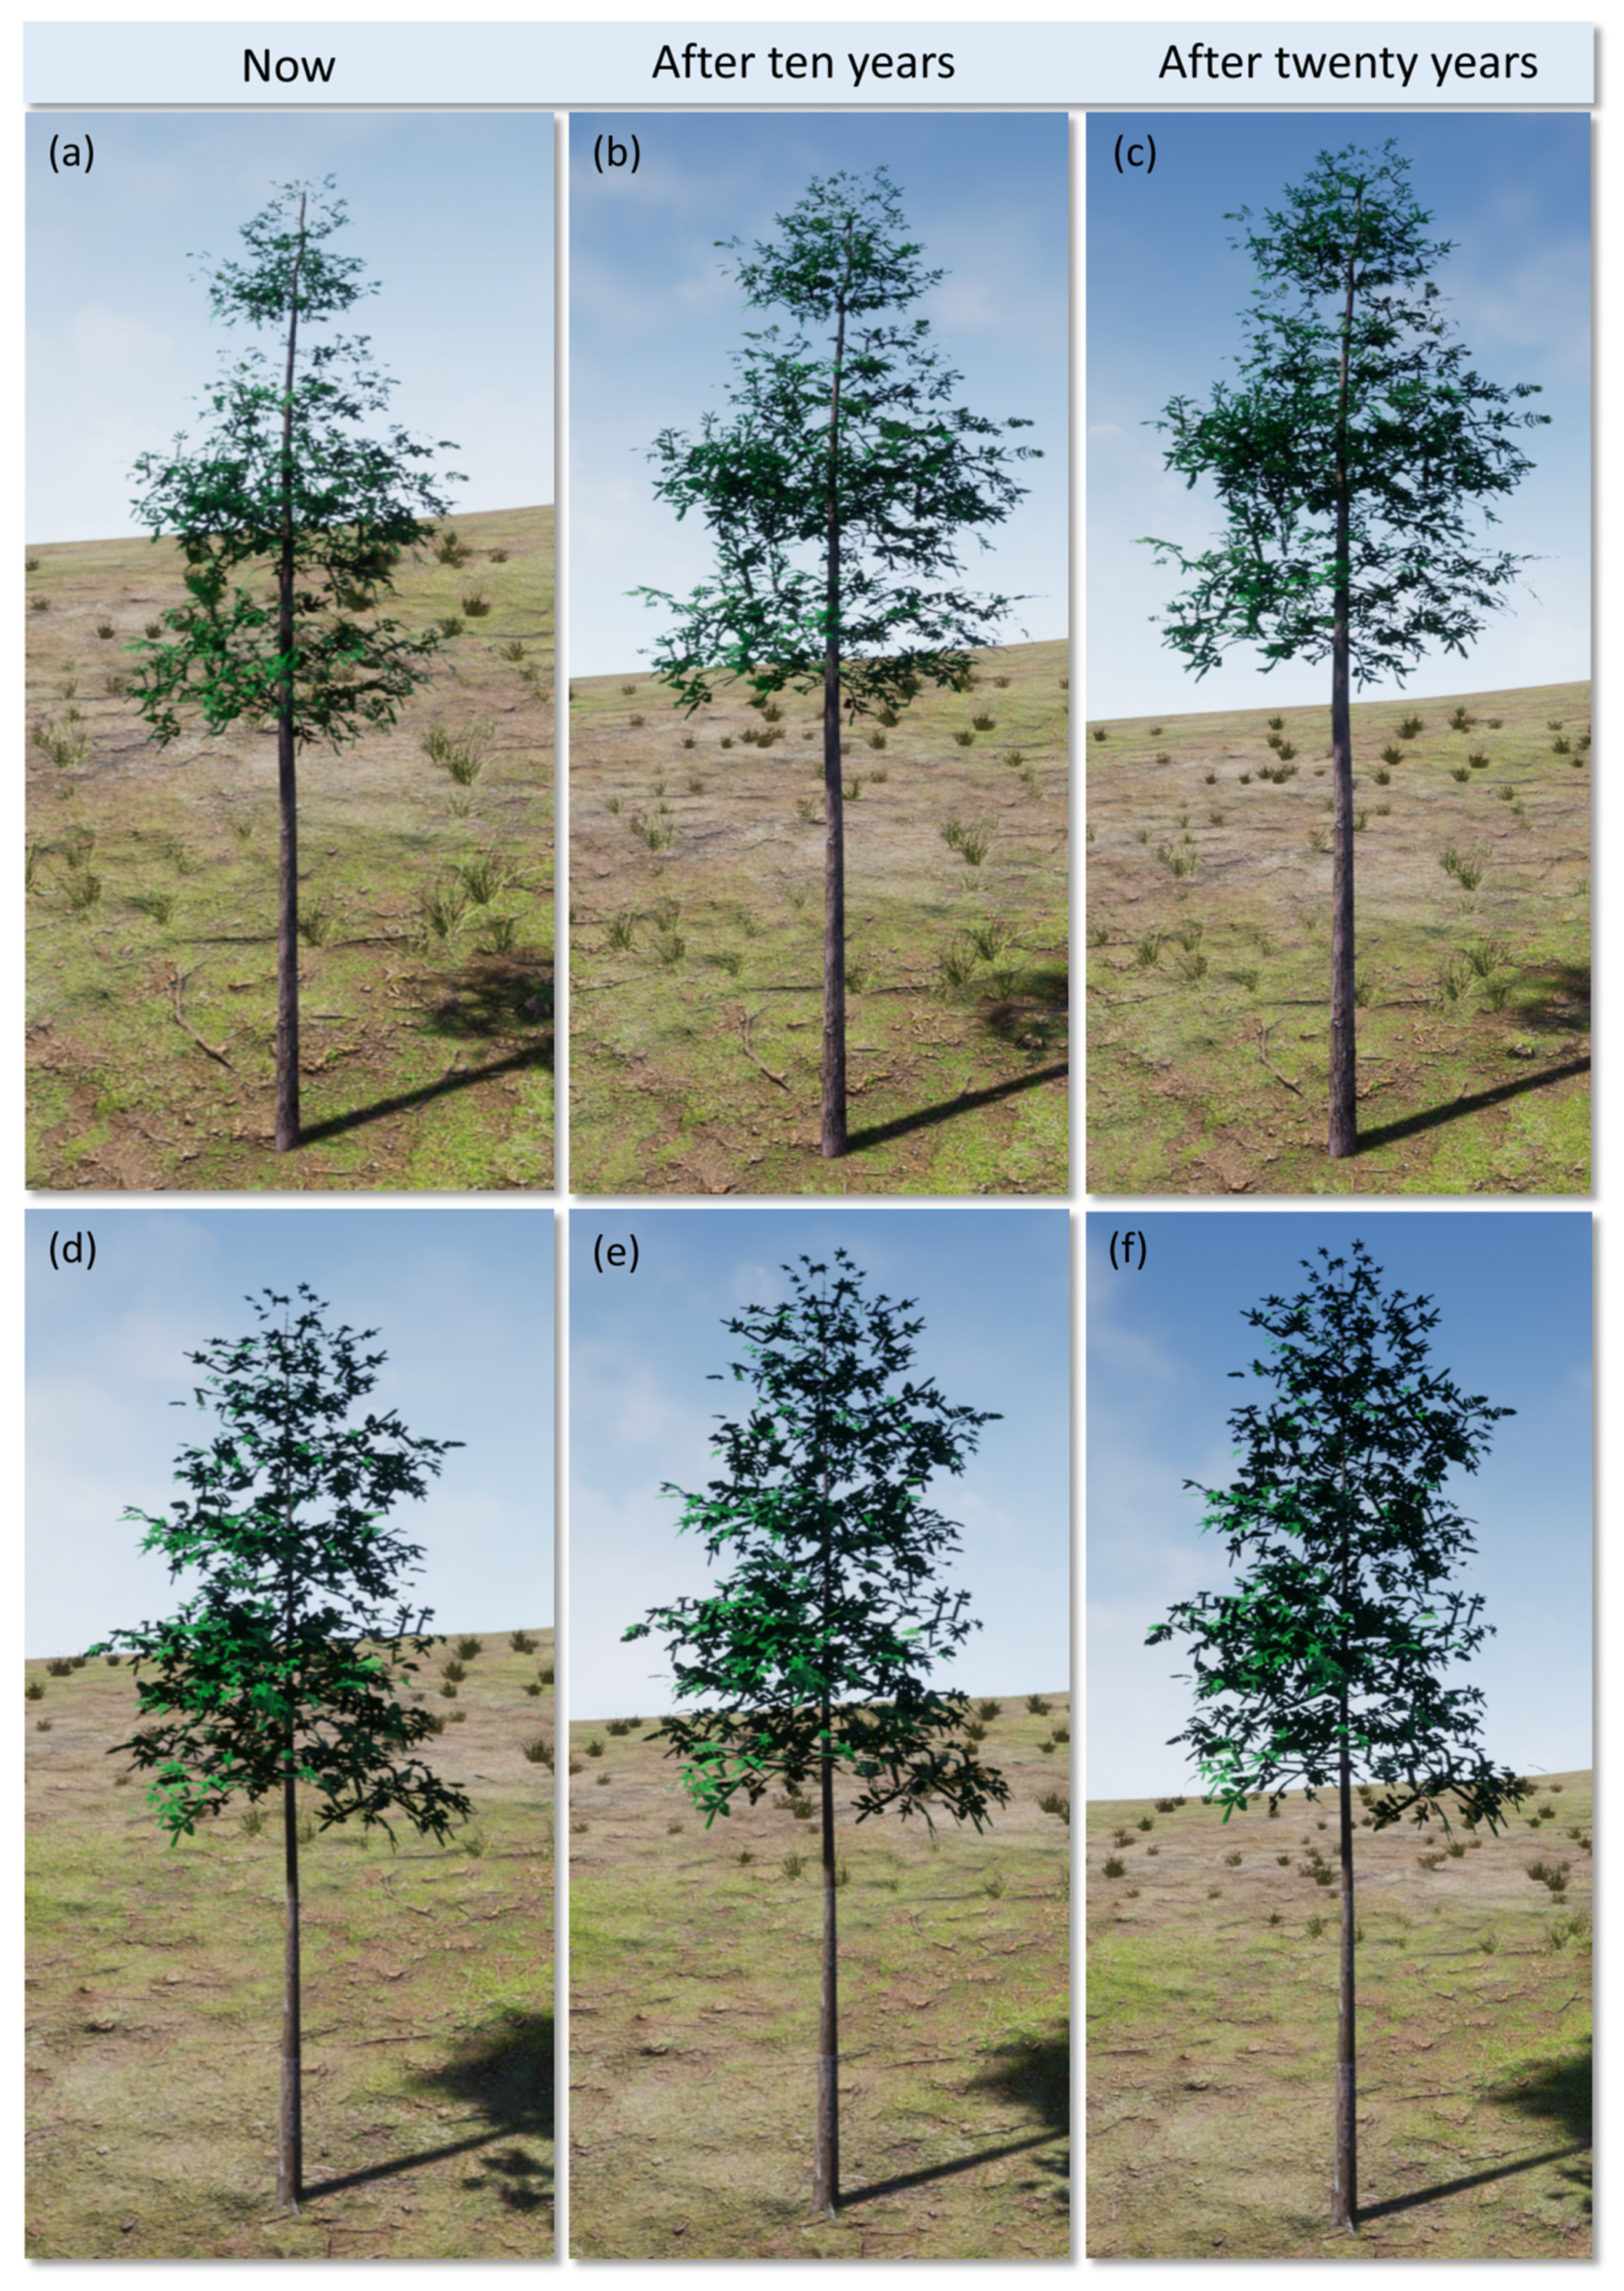
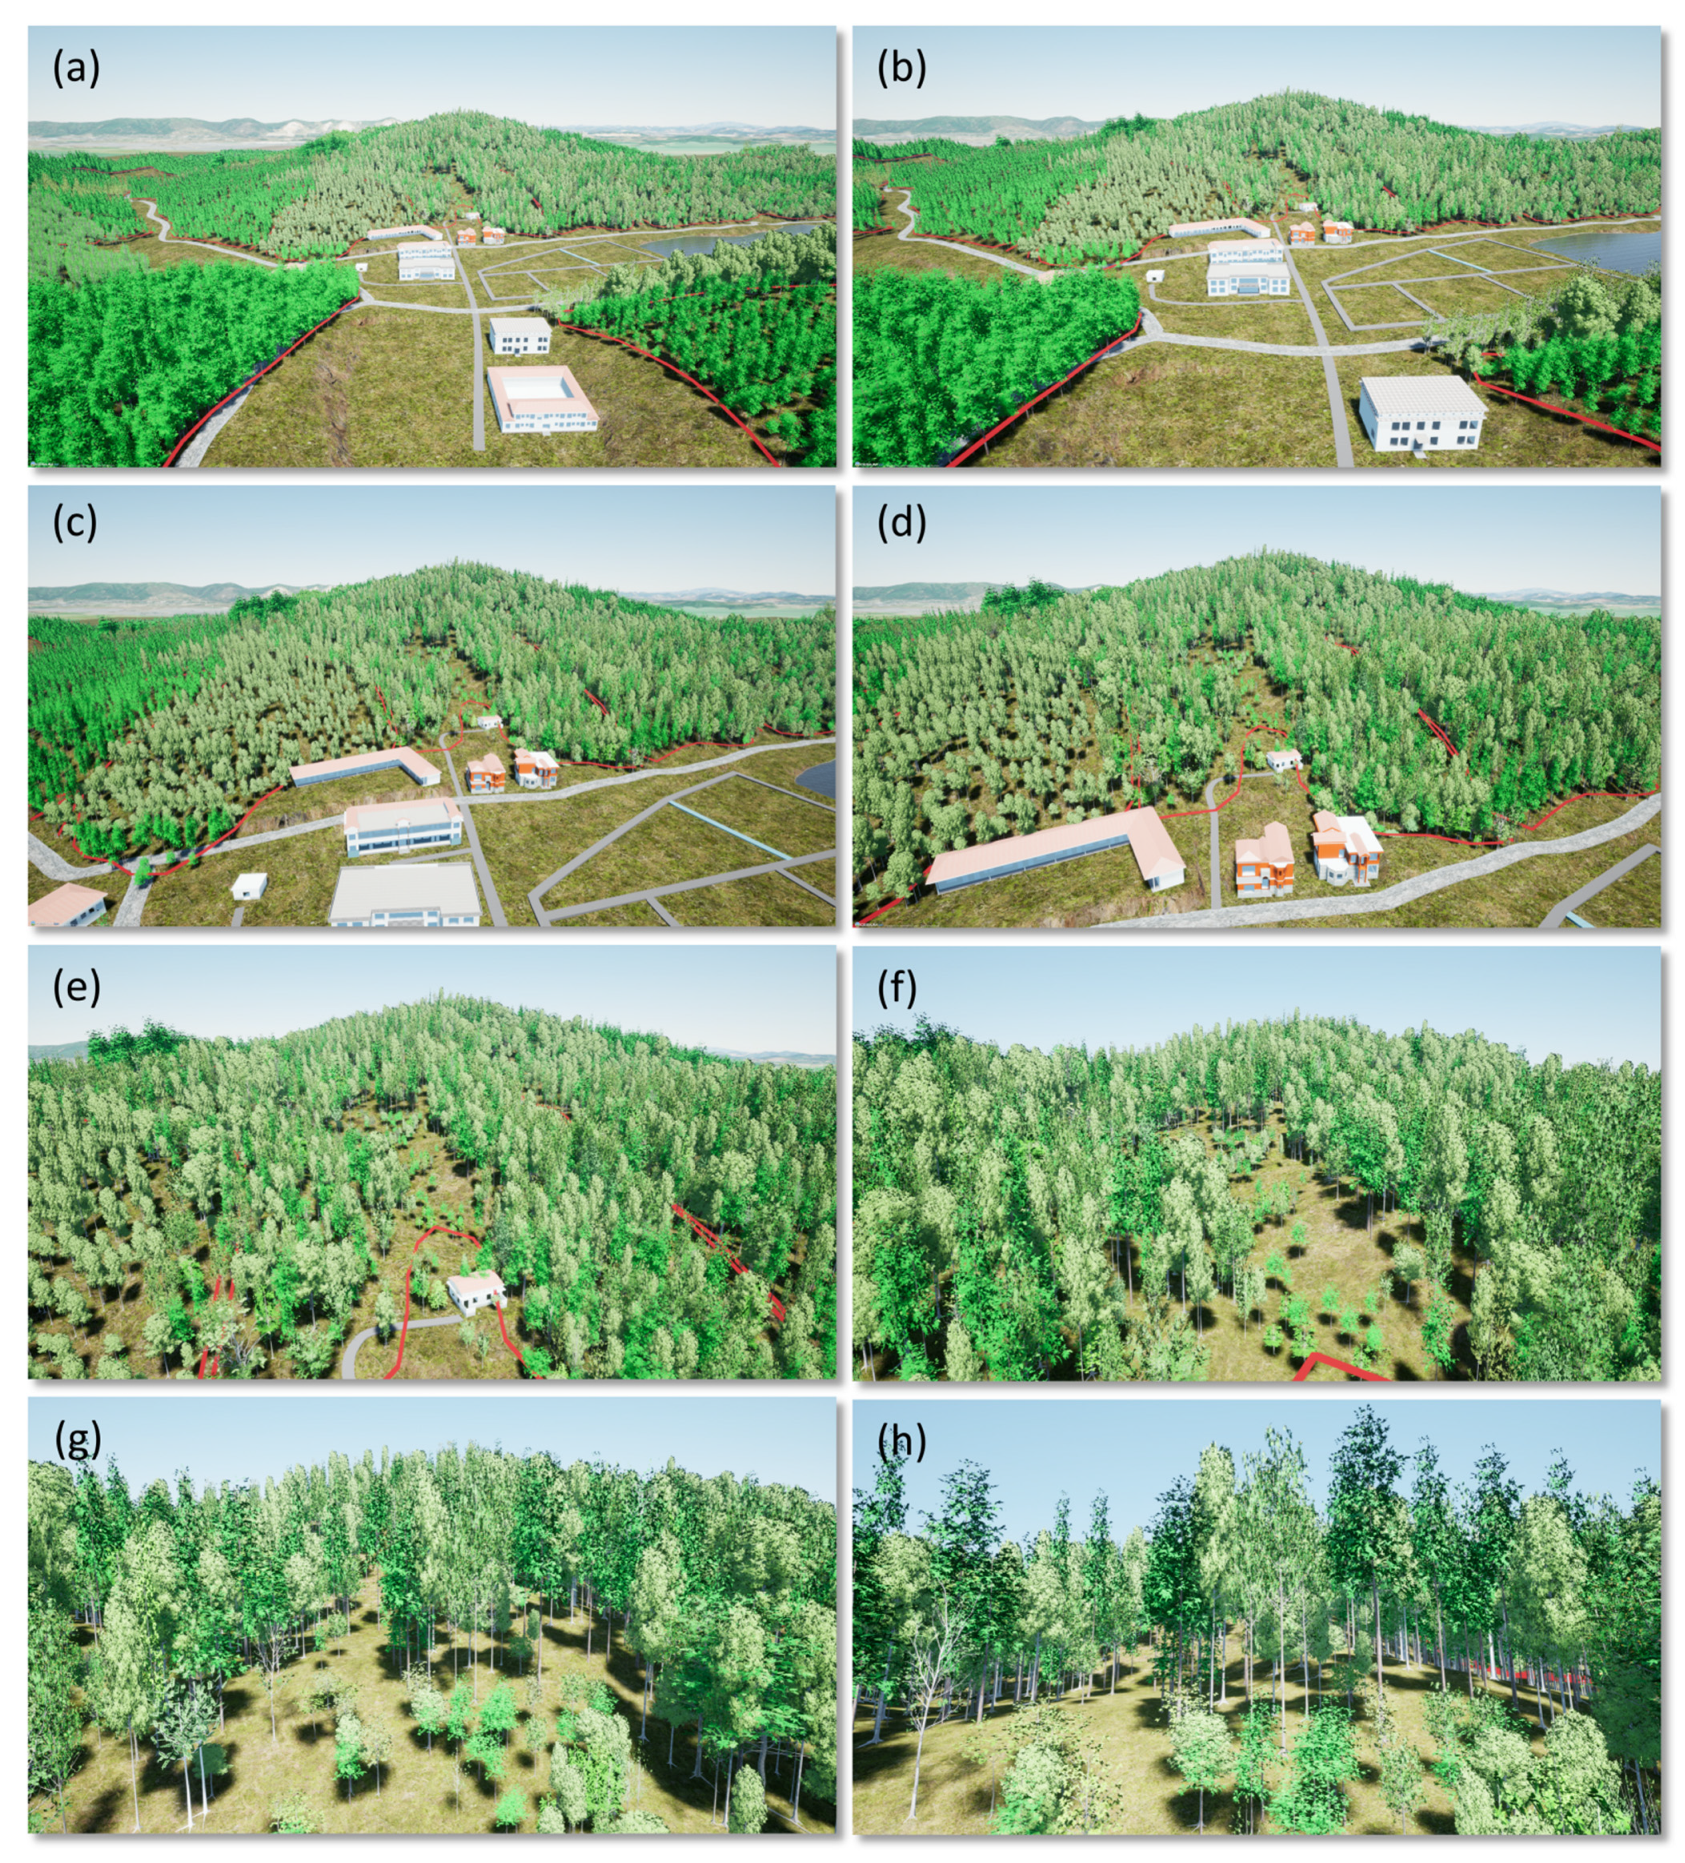
3.3. Visualization Simulation of Large-Scale Forest Scene Growth Dynamics
4. Discussion
5. Conclusions
Author Contributions
Funding
Data Availability Statement
Conflicts of Interest
References
- Franklin, J.F.; Spies, T.A.; Van Pelt, R.; Carey, A.B.; Thornburgh, D.A.; Berg, D.R.; Lindenmayer, D.B.; Harmon, M.E.; Keeton, W.S.; Shaw, D.C.; et al. Disturbances and Structural Development of Natural Forest Ecosystems with Silvicultural Implications, Using Douglas-Fir Forests as an Example. For. Ecol. Manag. 2002, 155, 399–423. [Google Scholar] [CrossRef]
- Hossein, A.; Djamali, M.; Ghorbanalizadeh, A.; And, E.R. Plant Biodiversity of Hyrcanian Relict Forests, N Iran: An Overview of the Flora, Vegetation, Palaeoecology and Conservation. Pak. J. Bot. 2010, 42, 231–258. [Google Scholar]
- Hof, J.G.; Joyce, L.A. Spatial Optimization for Wildlife and Timber in Managed Forest Ecosystems. For. Sci. 1992, 38, 489–508. [Google Scholar] [CrossRef]
- Huang, J.; Lucash, M.S.; Scheller, R.M.; Klippel, A. Walking through the Forests of the Future: Using Data-Driven Virtual Reality to Visualize Forests under Climate Change. Int. J. Geogr. Inf. Sci. 2021, 35, 1155–1178. [Google Scholar] [CrossRef]
- Lange, E. Integration of Computerized Visual Simulation and Visual Assessment in Environmental Planning. Landsc. Urban Plan. 1994, 30, 99–112. [Google Scholar] [CrossRef]
- Griffon, S.; Coligny, F. de AMAPstudio: A Software Suite for Plants Architecture Modelling. In Proceedings of the 2012 IEEE 4th International Symposium on Plant Growth Modeling, Simulation, Visualization and Applications, Shanghai, China, 31 October–3 November 2012; pp. 141–147. [Google Scholar]
- Li, S.; Zhang, H.; Li, Y.; Yang, T.; Shen, K. Three-Dimensional Visualization Simulation of Chinese Fir Stand Growth Based on Unity3D. In Proceedings of the 2018 3rd International Conference on Mechanical, Control and Computer Engineering (ICMCCE), Huhhot, China, 14–16 September 2018; IEEE: Piscataway, NJ, USA, 2018; pp. 530–534. [Google Scholar]
- Schroeder, W.J.; Zarge, J.A.; Lorensen, W.E. Decimation of Triangle Meshes. In Proceedings of the 19th Annual Conference on Computer Graphics and Interactive Techniques, Chicago, IL, USA, 27–31 July 1992; pp. 65–70. [Google Scholar]
- Kalvin, A.D.; Taylor, R.H. Superfaces: Polygonal Mesh Simplification with Bounded Error. IEEE Comput. Graph. Appl. 1996, 16, 64–77. [Google Scholar] [CrossRef]
- Lluch, J.; Camahort, E.; Vivó, R. An Image-Based Multiresolution Model for Interactive Foliage Rendering. J. WSCG 2004, 12, 507–514. [Google Scholar]
- Max, N. Optical Models for Direct Volume Rendering. IEEE Trans. Vis. Comput. Graph. 1995, 1, 99–108. [Google Scholar] [CrossRef]
- Feng, W.; Gang, W.; Deji, P.; Yuan, L.; Liuzhong, Y.; Hongbo, W. A Parallel Algorithm for Viewshed Analysis in Three-Dimensional Digital Earth. Comput. Geosci. 2015, 75, 57–65. [Google Scholar] [CrossRef]
- Weber, J.; Penn, J. Creation and Rendering of Realistic Trees. In Proceedings of the 22nd Annual Conference on Computer Graphics and Interactive Techniques, Los Angeles, CA, USA, 6–11 August 1995; pp. 119–128. [Google Scholar]
- Remolar, I.; Chover, M.; Belmonte, O.; Ribelles, J.; Rebollo, C. Geometric Simplification of Foliage. In Proceedings of the Eurographics (Short Presentations), Saarbrücken, Germany, 2–6 September 2002. [Google Scholar]
- Lluch, J.; Vicent, M.J.; Fernandez, S.; Monserrat, C.; Vivo, R. The Modelling of Branched Structures Using a Single Polygonal Mesh. In Proceedings of the VIIP, Marbella, Spain, 3–5 September 2001; pp. 203–207. [Google Scholar]
- Perbet, F.; Cani, M.-P. Animating Prairies in Real-Time. In Proceedings of the 2001 Symposium on Interactive 3D Graphics, Chapel Hill, NC, USA, 26–29 March 2001; pp. 103–110. [Google Scholar]
- Marshall, D.; Fussell, D.S.; Campbell III, A.T. Multiresolution Rendering of Complex Botanical Scenes. In Proceedings of the Graphics Interface, Kelowna, BC, Canada, 21–23 May 1997; Volume 97, pp. 97–104. [Google Scholar]
- Meyer, A.; Neyret, F.; Poulin, P. Interactive Rendering of Trees with Shading and Shadows. In Proceedings of the Rendering Techniques 2001: Proceedings of the Eurographics Workshop, London, UK, 25–27 June 2001; Springer: Berlin/Heidelberg, Germany, 2001; pp. 183–196. [Google Scholar]
- Lim, E.-M.; Honjo, T. Three-Dimensional Visualization Forest of Landscapes by VRML. Landsc. Urban Plan. 2003, 63, 175–186. [Google Scholar] [CrossRef]
- Decaudin, P.; Neyret, F. Rendering Forest Scenes in Real-Time. In Proceedings of the EGSR04: 15th Eurographics Symposium on Rendering, Norrköping, Sweden, 21–23 June 2004; pp. 93–102. [Google Scholar]
- Larsen, D.R.; Scott, I. The Sylview Graphical Interface to the SYLVAN STAND STRUCTURE Model with Examples from Southern Bottomland Hardwood Forests. In Proceedings of the 14th Biennial Southern Silvicultural Research Conference, Gen Tech. Rep SRS-121, Asheville, NC, USA, 1 January 2010; Department of Agriculture, Forest Service, Southern Research Station: Asheville, NC, USA, 2010. [Google Scholar]
- Li, Z.; Zhang, Y.-D. 3D Reconstruction Method of Forest Landscape Based on Virtual Reality. Multimed. Tools Appl. 2020, 79, 16369–16383. [Google Scholar] [CrossRef]
- Tianyang, D.; Jiajia, X.; Jing, F.; Ling, Z. Fast Generation of Large-Scale Forest Scene Based on Spatial Similarity. Int. J. Digit. Content Technol. Appl. 2012, 6, 13. [Google Scholar]
- Schaufler, G.; Stürzlinger, W. A Three Dimensional Image Cache for Virtual Reality. Comput. Graph. Forum 1996, 15, 227–236. [Google Scholar] [CrossRef]
- Bai, Z.Y.; Huang, X.Y. Plum Tree Visualization Based on Speed Tree. Key Eng. Mater. 2011, 474, 511–516. [Google Scholar] [CrossRef]
- Li, S.; Zhang, H.; Li, Y.; Yang, T.; He, J.; Ma, Z.; Shen, K. Dynamic Visual Simulation of Chinese Fir Stand Growth Based on Sample Library. For. Res. 2019, 32, 21–30. (In Chinese) [Google Scholar]
- Li, Y.; He, J.; Yu, S.; Wang, H.; Ye, S. Spatial Structures of Different-Sized Tree Species in a Secondary Forest in the Early Succession Stage. Eur. J. For. Res. 2020, 139, 709–719. [Google Scholar] [CrossRef]
- Tang, L.; Peng, X.; Chen, C.; Huang, H.; Lin, D. Three-Dimensional Forest Growth Simulation in Virtual Geographic Environments. Earth Sci. Inform. 2019, 12, 31–41. [Google Scholar] [CrossRef]
- Zamuda, A.; Brest, J. Vectorized Procedural Models for Animated Trees Reconstruction Using Differential Evolution. Inf. Sci. (NY) 2014, 278, 1–21. [Google Scholar] [CrossRef]
- Tang, L.; Chen, C.; Huang, H.; Lin, D. An Integrated System for 3D Tree Modeling and Growth Simulation. Environ. Earth Sci. 2015, 74, 7015–7028. [Google Scholar] [CrossRef]
- Ijiri, T.; Owada, S.; Igarashi, T. The Sketch L-System: Global Control of Tree Modeling Using Free-Form Strokes. In Proceedings of the Smart Graphics: 6th International Symposium, SG 2006, Vancouver, BC, Canada, 23–25 July 2006; Proceedings 6. Springer: Berlin/Heidelberg, Germany, 2006; pp. 138–146. [Google Scholar]
- Peng, W.; Pukkala, T.; Jin, X.; Li, F. Optimal Management of Larch (Larix Olgensis A. Henry) Plantations in Northeast China When Timber Production and Carbon Stock Are Considered. Ann. For. Sci. 2018, 75, 63. [Google Scholar] [CrossRef]
- Xie, L.; Widagdo, F.R.A.; Dong, L.; Li, F. Modeling Height–Diameter Relationships for Mixed-Species Plantations of Fraxinus mandshurica Rupr. and Larix olgensis Henry in Northeastern China. Forests 2020, 11, 610. [Google Scholar] [CrossRef]
- Miina, J.; Pukkala, T. Using numerical optimization for specifying individual-tree competition models. For. Sci. 2000, 46, 277–283. [Google Scholar]
- Dong, L.; Pukkala, T.; Li, F.; Jin, X. Developing Distance-Dependent Growth Models from Irregularly Measured Sample Plot Data—A Case for Larix Olgensis in Northeast China. For. Ecol. Manag. 2021, 486, 118965. [Google Scholar] [CrossRef]
- Pukkala, T. Methods to Describe the Competition Process in a Tree Stand. Scand. J. For. Res. 1989, 4, 187–202. [Google Scholar] [CrossRef]
- Packalen, P.; Pukkala, T.; Pascual, A. Combining Spatial and Economic Criteria in Tree-Level Harvest Planning. For. Ecosyst. 2020, 7, 18. [Google Scholar] [CrossRef]
- Anastacio, F.; Prusinkiewicz, P.; Sousa, M.C. Sketch-Based Parameterization of L-Systems Using Illustration-Inspired Construction Lines and Depth Modulation. Comput. Graph. 2009, 33, 440–451. [Google Scholar] [CrossRef]
- Letort, V.; Cournède, P.-H.; Mathieu, A.; De Reffye, P.; Constant, T. Parametric Identification of a Functional–structural Tree Growth Model and Application to Beech Trees (Fagus sylvatica). Funct. Plant Biol. 2008, 35, 951–963. [Google Scholar] [CrossRef]
- Bailey, R.L.; Dell, T.R. Quantifying Diameter Distributions with the Weibull Function. For. Sci. 1973, 19, 97–104. [Google Scholar]
- Bailey, R.L.; Cieszewski, C.J. Development of a Well-Behaved Site-Index Equation: Jack Pine in North-Cental Ontario: Comment. Can. J. For. Res. 2000, 30, 1667. [Google Scholar] [CrossRef]
- Feng, L.; De Reffye, P.; Dreyfus, P.; Auclair, D. Connecting an Architectural Plant Model to a Forest Stand Dynamics Model—Application to Austrian Black Pine Stand Visualization. Ann. For. Sci. 2012, 69, 245–255. [Google Scholar] [CrossRef]
- De Reffye, P.; Edelin, C.; Françon, J.; Jaeger, M.; Puech, C. Plant Models Faithful to Botanical Structure and Development. ACM Siggraph Comput. Graph. 1988, 22, 151–158. [Google Scholar] [CrossRef]
- Akarsu, E.; Fox, G.; Haupt, T.; Kalinichenko, A.; Kim, K.-S.; Sheethaalnath, P.; Youn, C.-H. Using Gateway System to Provide a Desktop Access to High Performance Computational Resources. In Proceedings of the Eighth International Symposium on High Performance Distributed Computing (Cat. No. 99TH8469), Redondo Beach, CA, USA, 6 August 1999; IEEE: Piscataway, NJ, USA, 1999; pp. 294–298. [Google Scholar]
- Castel, T.; Caraglio, Y.; Beaudoin, A.; Borne, F. Using SIR-C SAR Data and the AMAP Model for Forest Attributes Retrieval and 3-D Stand Simulation. Remote Sens. Environ. 2001, 75, 279–290. [Google Scholar] [CrossRef]
- Madureira, L.; Nunes, L.C.; Borges, J.G.; Falcão, A.O. Assessing Forest Management Strategies Using a Contingent Valuation Approach and Advanced Visualisation Techniques: A Portuguese Case Study. J. For. Econ. 2011, 17, 399–414. [Google Scholar] [CrossRef]
- Meng, X.Y. Forest Mensuration; Chinese Forestry Publishing House: Beijing, China, 2006. [Google Scholar]
- Luo, J.; Dai, C.; Tian, Y.; Peng, P.; Ma, F.; Zeng, Z.; Zhou, X.; Zhang, M. The tree height and DBH growth model of establishment of main constructive species for Project Forests of Carbon Sink in Hunan Province. Hunan For. Sci. Technol. 2016, 43, 46–50. (In Chinese) [Google Scholar]
- Ma, Z.; Zhang, H.; Li, Y.; Yang, T.; Chen, Z.; Li, S. Visual Simulation of Chinese Fir Crown Growth Based on Spatial Structure. For. Res. 2018, 31, 150–157. (In Chinese) [Google Scholar]
- Lei, K.; Zhang, H.; Qiu, H.; Liu, Y.; Hu, X.; Wang, J.; Cui, Z.; Zuo, Y. Comprehensive Decision Index of Logging (CDIL) and Visual Simulation Based on Horizontal and Vertical Structure Parameters. Forests 2023, 14, 277. [Google Scholar] [CrossRef]
- Garg, K.; Nayar, S. Photorealistic Rendering of Rain Streaks. ACM Trans. Graph. 2006, 25, 996–1002. [Google Scholar] [CrossRef]


| Subplot Number | Tree Species | Average DBH (cm) | Maximum Value | Minimum Value | Standard Deviation | Average H (m) | Maximum Value | Minimum Value | Standard Deviation | Average CW (m) | Number of Trees (Trees) | Canopy Density (%) | Stand Density (Trees/ha) | Area (ha) |
|---|---|---|---|---|---|---|---|---|---|---|---|---|---|---|
| 1 | Cunninghamia lanceolata, Schima superba, Machilus pauhoi | 18.22 | 37.9 | 1.7 | 10.22 | 21.8 | 22.3 | 1.6 | 5.66 | 3.75 | 4092 | 70 | 54.25 | 5.03 |
| 2 | Cunninghamia lanceolata, Schima superba, Machilus pauhoi | 19.3 | 35.4 | 0.8 | 9.48 | 23.4 | 23.2 | 1.7 | 5.51 | 3.83 | 1896 | 70 | 52.79 | 2.39 |
| 3 | Cunninghamia lanceolata, Schima superba, Machilus pauhoi | 22.8 | 43.8 | 0.8 | 10.73 | 24.1 | 24.5 | 1.5 | 6.33 | 3.4 | 4042 | 70 | 71 | 3.80 |
| 4 | Cunninghamia lanceolata, Schima superba, Machilus pauhoi | 20.3 | 35.6 | 1.1 | 10.1 | 16.7 | 23.3 | 1.8 | 5.32 | 3.1 | 1156 | 70 | 65 | 1.19 |
| 5 | Cunninghamia lanceolata | 24.5 | 52.9 | 0.8 | 11.06 | 18.5 | 26 | 1.5 | 6.75 | 3.33 | 3729 | 70 | 53 | 4.69 |
| 6 | Schima superba | 31.5 | 35.5 | 1 | 10.21 | 31.9 | 22.8 | 1.9 | 5.62 | 8.5 | 978 | 80 | 35 | 1.86 |
| 7 | Cunninghamia lanceolata | 6.2 | 42.3 | 1 | 12.64 | 3.1 | 23.6 | 1.8 | 6.74 | 4.2 | 4161 | 70 | 50 | 5.55 |
| 8 | Cunninghamia lanceolata | 16.4 | 39 | 0.6 | 10.82 | 17.5 | 25.7 | 1.6 | 7.18 | 2.6 | 929 | 70 | 78 | 0.79 |
| 9 | Schima superba, Sassafras tzumu, Cinnamomum camphora | 21.2 | 39.3 | 2.3 | 9.67 | 20.2 | 22 | 3.1 | 4.6 | 7.1 | 199 | 75 | 29 | 0.46 |
| 10 | Schima superba, Sassafras tzumu | 24.5 | 46.5 | 0.6 | 10.95 | 21.5 | 24.5 | 1.6 | 6.73 | 6.74 | 685 | 70 | 43 | 1.06 |
| 11 | Cunninghamia lanceolata | 22.5 | 36.9 | 0.6 | 10.36 | 22 | 25.8 | 1.8 | 6.42 | 3.33 | 7238 | 75 | 78 | 6.19 |
| 12 | Cunninghamia lanceolata, Schima superba | 20.3 | 45.1 | 1.1 | 11.66 | 18.1 | 24.4 | 1.9 | 7.48 | 4.65 | 4458 | 75 | 77 | 3.86 |
| 13 | Schima superba, Castanopsis sclerophylla, Cinnamomum camphora, Sassafras tzumu | 26.2 | 35.4 | 2.6 | 8.39 | 14.6 | 21.9 | 2.9 | 4.4 | 5.4 | 481 | 60 | 33 | 0.97 |
| 14 | Cunninghamia lanceolata | 22.8 | 46.5 | 0.3 | 11.39 | 18.6 | 24.1 | 1.8 | 6.18 | 3.65 | 2029 | 70 | 74 | 1.83 |
| 15 | Pinus massoniana, Cunninghamia lanceolata, Vernicia fordii | 21.5 | 36.7 | 1.3 | 7.36 | 15.9 | 23 | 3.7 | 3.68 | 5.31 | 7674 | 85 | 85 | 6.02 |
| 16 | Cunninghamia lanceolata | 24.1 | 39.6 | 2.2 | 9.43 | 20.2 | 22.8 | 4 | 4.8 | 4.05 | 5811 | 70 | 78 | 4.97 |
| 17 | Schima superba, Vernicia fordii | 29.4 | 42.4 | 1 | 11.02 | 19.5 | 21.5 | 1.5 | 4.85 | 8.5 | 3896 | 70 | 40 | 6.49 |
| 18 | Cunninghamia lanceolata | 13.8 | 42.1 | 1.2 | 11.52 | 12.2 | 24.3 | 2.2 | 6.84 | 2.54 | 11629 | 95 | 162 | 4.79 |
| 19 | Cunninghamia lanceolata | 27.5 | 46.1 | 3.3 | 9.88 | 21.1 | 23.1 | 0.7 | 5.11 | 3.62 | 1656 | 70 | 82 | 1.35 |
| 20 | Castanea mollissima, Paulownia fortunei, Cunninghamia lanceolata | 17.6 | 45 | 2 | 11.29 | 12.7 | 25.4 | 2.7 | 6.23 | 7.21 | 921 | 70 | 48 | 1.28 |
| 21 | Michelia platypetala | 21.2 | 41.2 | 4.9 | 4.92 | 16.5 | 19.6 | 2.1 | 2.08 | 4.05 | 2725 | 60 | 52 | 3.49 |
| 22 | Liriodendron tulipifera | 17.9 | 38.4 | 4.5 | 8.63 | 17.8 | 23.1 | 1.5 | 5.02 | 4.69 | 1411 | 75 | 71 | 1.32 |
| 23 | Vernicia fordii, Machilus pauhoi | 22.3 | 37.2 | 2 | 9.11 | 13.7 | 22.6 | 3.7 | 4.44 | 7.65 | 1542 | 75 | 29 | 3.55 |
| 24 | Cunninghamia lanceolata, Schima superba, Paulownia fortunei | 19.4 | 37.1 | 4.5 | 4.55 | 15.6 | 24.3 | 2.9 | 2.98 | 5.78 | 2419 | 85 | 95 | 1.70 |
| 25 | Cunninghamia lanceolata, Schima superba, Machilus pauhoi | 19.22 | 38.1 | 1.5 | 7.62 | 22.2 | 20.8 | 2.7 | 3.49 | 4.15 | 1547 | 75 | 52 | 1.98 |
| 26 | Cunninghamia lanceolata | 27.4 | 39.1 | 2.7 | 7.12 | 18.8 | 17.7 | 3.2 | 3.34 | 3.24 | 2213 | 75 | 71 | 2.08 |
| 27 | Cunninghamia lanceolata | 14.7 | 33.5 | 0.8 | 8.83 | 12.8 | 17.3 | 1.1 | 3.96 | 1.81 | 15539 | 90 | 158 | 6.56 |
| 28 | Schima superba, Cinnamomum camphora, Vernicia fordii | 15.2 | 38.3 | 1.3 | 7.58 | 12.1 | 22.7 | 1.4 | 3.57 | 2.24 | 6764 | 85 | 121 | 3.73 |
| 29 | Myrica rubra | 9.8 | 33.2 | 1.6 | 7.36 | 4.2 | 15.4 | 0.9 | 1.98 | 4.55 | 6344 | 65 | 60 | 7.05 |
| ID | Model Name | Growth Model | Description | References |
|---|---|---|---|---|
| 1 | DBH growth model | D represents diameter at breast height of tree, age represents time of growth | [48] | |
| 2 | H growth model | H represents height of tree, age represents time of growth | [48] | |
| 3 | CW growth model | CW represents crown width of tree, Ph represents horizontal structural parameters (minimum distance affected by adjacent trees) | [49] | |
| 4 | CH growth model | CH represents crown height of tree, Pv represents vertical spatial structural parameters (the average relative height of adjusted trees) | [49] | |
| 5 | UBH growth model | UBH represents height under the branches of tree, Pv represents vertical spatial structural parameters (the average relative height of adjacent trees) | [49] |
| Tree Attributes | 0–15 (cm) | 15–30 (cm) | 30–45 (cm) | 45–60 (cm) | 60–75 (cm) | 75–90 (cm) | >90 (cm) | |||||||
|---|---|---|---|---|---|---|---|---|---|---|---|---|---|---|
| Hierarchical Model | Integrated Model | Hierarchical Model | Integrated Model | Hierarchical Model | Integrated Model | Hierarchical Model | Integrated Model | Hierarchical Model | Integrated Model | Hierarchical Model | Integrated Model | Hierarchical Model | Integrated Model | |
| DBH (trees) | 1907 | 1907 | 1620 | 1620 | 539 | 539 | 26 | 26 | 0 | 0 | 0 | 0 | 0 | |
| CW (trees) | 112 | - | 1276 | - | 1773 | - | 635 | - | 208 | 67 | - | 21 | - | |
| H (trees) | 2 | 2 | 4 | 4 | 49 | 49 | 207 | 207 | 389 | 487 | 487 | 2954 | 2954 | |
| CH (trees) | 35 | - | 242 | - | 477 | - | 611 | - | 605 | 530 | - | 1592 | - | |
| UBH (trees) | 329 | - | 1263 | - | 913 | - | 534 | - | 393 | 318 | - | 342 | - | |
| Origins | 40 Years Old | 50 Years Old | |||||||||
|---|---|---|---|---|---|---|---|---|---|---|---|
| Age (Year) | UBH (m) | Measurements | Hierarchical Model | Integrated Model | Measurements | Hierarchical Model | Integrated Model | ||||
| Forecasts | Error | Forecasts | Error | Forecasts | Error | Forecasts | Error | ||||
| 15 | 1.6 | 7.8 | 8.3 | 0.5 | 8.7 | 0.9 | 9.4 | 9.6 | 0.2 | 9.8 | 0.4 |
| 15 | 1.4 | 7.6 | 8.8 | 0.8 | 6.5 | 1.1 | 9.2 | 10.4 | 1.2 | 10.5 | 1.3 |
| 20 | 2.9 | 8.2 | 9 | 0.8 | 7.4 | 0.8 | 10.1 | 10.5 | 0.4 | 9.4 | 0.7 |
| 20 | 3.1 | 8.4 | 8.7 | 0.3 | 8.9 | 0.5 | 10.3 | 11.3 | 1.1 | 11.7 | 1.4 |
| 25 | 4.9 | 8.1 | 8.5 | 0.4 | 8.7 | 0.6 | 9.8 | 10.1 | 0.3 | 9.2 | 0.6 |
| 25 | 5.8 | 9.3 | 10 | 0.7 | 8.5 | 0.8 | 11.5 | 11.7 | 0.2 | 11 | 0.5 |
| 30 | 7.1 | 9 | 7.3 | 1.7 | 11.1 | 2.1 | 10.6 | 11.2 | 0.6 | 9.7 | 0.9 |
| Mean value | 3.83 | 8.34 | 8.66 | 0.74 | 8.54 | 0.97 | 10.13 | 10.69 | 0.57 | 10.19 | 0.83 |
| Standard deviation | 5.29 | 1.51 | 1.98 | 1.14 | 3.49 | 1.31 | 1.91 | 1.82 | 1.03 | 2.24 | 0.96 |
| Origins | 40 Years Old | 50 Years Old | |||||||||
|---|---|---|---|---|---|---|---|---|---|---|---|
| Age (Year) | CW (m) | Measurements | Hierarchical Model | Integrated Model | Measurements | Hierarchical Model | Integrated Model | ||||
| Forecasts | Error | Forecasts | Error | Forecasts | Error | Forecasts | Error | ||||
| 15 | 2.9 | 6.2 | 7.1 | 0.9 | 7.6 | 1.4 | 8.1 | 8.8 | 0.7 | 9 | 0.9 |
| 15 | 2.7 | 5.9 | 7.2 | 1.3 | 7.4 | 1.5 | 7.9 | 8.2 | 0.3 | 7.3 | 0.6 |
| 20 | 3.3 | 6.3 | 7.4 | 1.1 | 7.4 | 1.1 | 7.8 | 8.4 | 0.6 | 7 | 0.8 |
| 20 | 3.4 | 6.7 | 7.4 | 0.7 | 7.6 | 0.9 | 7.6 | 8.8 | 1.2 | 9.1 | 1.5 |
| 25 | 4.1 | 5.8 | 6.4 | 0.6 | 7 | 1.2 | 8.2 | 9 | 0.8 | 9.4 | 1.2 |
| 25 | 4.3 | 6.1 | 6.9 | 0.8 | 7.7 | 1.6 | 8.5 | 9.4 | 0.9 | 7.2 | 1.3 |
| 30 | 5.2 | 6.9 | 7.4 | 0.5 | 6.1 | 0.8 | 8.9 | 9.3 | 0.4 | 8 | 0.9 |
| Mean value | 3.7 | 6.27 | 7.11 | 0.84 | 7.26 | 1.21 | 8.14 | 8.84 | 0.70 | 8.14 | 1.03 |
| Standard deviation | 2.16 | 0.99 | 0.9 | 0.69 | 1.37 | 0.74 | 1.09 | 1.08 | 0.75 | 2.48 | 0.77 |
| Evaluation Index | Good | General | Poor |
|---|---|---|---|
| Scene similarity | 19 | 1 | 0 |
| Scene immersion | 20 | 0 | 0 |
| Scene fluency | 18 | 2 | 0 |
| Forest polymorphism | 19 | 1 | 0 |
| Number of Trees | Before Growth | After Growth | ||||||
|---|---|---|---|---|---|---|---|---|
| Hierarchical Model | Integrated Model | Hierarchical Model | Integrated Model | |||||
| Average fps | Frame Rate Fluctuation Value | Average fps | Frame Rate Fluctuation Value | Average fps | Frame Rate Fluctuation Value | Average fps | Frame Rate Fluctuation Value | |
| 10 | 120 | 0.32 | 120 | 0.37 | 120 | 0.44 | 120 | 0.45 |
| 100 | 120 | 0.39 | 120 | 0.45 | 120 | 0.47 | 120 | 0.44 |
| 1000 | 64.37 | 0.42 | 65.47 | 0.48 | 64.37 | 0.53 | 65.47 | 0.56 |
| 10,000 | 39.65 | 0.54 | 42.43 | 0.52 | 39.65 | 0.66 | 42.43 | 0.65 |
| 100,000 | 30.63 | 0.61 | 30.74 | 0.64 | 29.68 | 0.69 | 30.64 | 0.69 |
Disclaimer/Publisher’s Note: The statements, opinions and data contained in all publications are solely those of the individual author(s) and contributor(s) and not of MDPI and/or the editor(s). MDPI and/or the editor(s) disclaim responsibility for any injury to people or property resulting from any ideas, methods, instructions or products referred to in the content. |
© 2023 by the authors. Licensee MDPI, Basel, Switzerland. This article is an open access article distributed under the terms and conditions of the Creative Commons Attribution (CC BY) license (https://creativecommons.org/licenses/by/4.0/).
Share and Cite
Lei, K.; Zhang, H.; Qiu, H.; Yang, T.; Liu, Y.; Zhang, J.; Hu, X.; Cui, Z. A Novel Strategy for Constructing Large-Scale Forest Scene: Integrating Forest Hierarchical Models and Tree Growth Models to Improve the Efficiency and Stability of Forest Polymorphism Simulation. Forests 2023, 14, 1595. https://doi.org/10.3390/f14081595
Lei K, Zhang H, Qiu H, Yang T, Liu Y, Zhang J, Hu X, Cui Z. A Novel Strategy for Constructing Large-Scale Forest Scene: Integrating Forest Hierarchical Models and Tree Growth Models to Improve the Efficiency and Stability of Forest Polymorphism Simulation. Forests. 2023; 14(8):1595. https://doi.org/10.3390/f14081595
Chicago/Turabian StyleLei, Kexin, Huaiqing Zhang, Hanqing Qiu, Tingdong Yang, Yang Liu, Jing Zhang, Xingtao Hu, and Zeyu Cui. 2023. "A Novel Strategy for Constructing Large-Scale Forest Scene: Integrating Forest Hierarchical Models and Tree Growth Models to Improve the Efficiency and Stability of Forest Polymorphism Simulation" Forests 14, no. 8: 1595. https://doi.org/10.3390/f14081595
APA StyleLei, K., Zhang, H., Qiu, H., Yang, T., Liu, Y., Zhang, J., Hu, X., & Cui, Z. (2023). A Novel Strategy for Constructing Large-Scale Forest Scene: Integrating Forest Hierarchical Models and Tree Growth Models to Improve the Efficiency and Stability of Forest Polymorphism Simulation. Forests, 14(8), 1595. https://doi.org/10.3390/f14081595