Article

Effects of Snow Cover on Carbon Dioxide Emissions and Their δ13C Values of Temperate Forest Soils with and without Litter

1
State Key Laboratory of Atmospheric Boundary Layer Physics and Atmospheric Chemistry, Institute of Atmospheric Physics, Chinese Academy of Sciences, Beijing 100029, China
2
Department of Atmospheric Chemistry and Environmental Science, College of Earth and Planetary Sciences, University of Chinese Academy of Sciences, Beijing 100049, China
3
Key Laboratory of Watershed Geographic Sciences, Nanjing Institute of Geography and Limnology, Chinese Academy of Sciences, Nanjing 210008, China
4
College of Tropical Crops, Hainan University, Haikou 570228, China
5
Faculty of Agriculture, Yamagata University, Tsuruoka 997-8555, Japan
*
Author to whom correspondence should be addressed.
Forests 2023, 14(7), 1384; https://doi.org/10.3390/f14071384
Submission received: 6 June 2023 / Revised: 4 July 2023 / Accepted: 5 July 2023 / Published: 6 July 2023

Abstract

:
The presence of litter and winter snow cover can affect the decomposition of organic matter in forest soils and changes in δ13C values of soil-respired carbon dioxide (CO2). However, limited information is available on the responses of CO2 emissions from forest soils and their δ13C values to snow cover and litter addition over the year. We experimentally manipulated snow cover to study the impacts of light and heavy artificial snow cover on soil heterotrophic respiration and its δ13C values, using undisturbed large soil columns collected from two typical temperate forests in Northeastern China. Based on the average temperatures of surface forest soils in four seasons of the year in this study region, the simulations of autumn freeze–thaw, winter freeze, spring freeze–thaw, and the growing season were sequentially carried out under laboratory conditions. A set of novel analysis systems, including automated chamber equipment and laser spectroscopy analysis with high-frequency measurements for CO2 concentrations and the 13C/12C isotopic ratios in CO2, was used to study the effects of artificial snow cover and the presence of litter on soil heterotrophic respiration and its δ13C values. During the autumn freeze–thaw simulation, there were larger CO2 emissions and less negative δ13C values of soil-respired CO2 upon heavy snow cover than upon light snow cover, indicating that the presence of increased snow cover prior to winter freeze can increase the decomposition of organic C in subsurface soils under temperate forests. The δ13C values of soil-respired CO2 in all treatments were, on average, less negative as the simulated spring freeze–thaw proceeded, which was contrary to the variations of the δ13C during the autumn freeze–thaw simulation. Soil heterotrophic respiration and its δ13C values during the spring freeze–thaw simulation were, on average smaller upon heavy snow cover than upon light snow cover, which differed from those during the autumn freeze–thaw and growing season simulations, respectively. Taken together, the results highlight that the effects of snow cover on soil heterotrophic respiration and its δ13C values under temperate forests may vary with different seasons of the year and the presence of litter.

1. Introduction

Permanent and seasonal snow cover regions occupy about 60% of the global land surface [1], which accounts for more than 70% of global soil organic carbon (C) stocks [2,3]. Snow cover directly affects the heat exchange between topsoils and the atmosphere, reducing the impacts of soil temperature fluctuations. Thicker surface snow cover (>30 cm) may even prevent soil frost under severe cold conditions, supplying relatively stable living environments for underground microbial activity [4]. However, in the context of global climate change, the area of land snow cover in the Northern Hemisphere in spring is currently decreasing year by year and is predicted to reduce by 25% until the end of this century [5]. It has been confirmed that snow cover in the Northern Hemisphere reduced by 7% in March and 11% in April 2010 compared to that in 1970 and that this reduction is accelerating [6]. Seasonal snow cover patterns can have complex and diverse responses to global climate change, probably affecting above- and belowground processes in forest ecosystems via the redistribution of resources such as light, heat, water, and nutrients [7,8]. As a vital process of soil C cycling, soil respiration can account for more than 60% of forest ecosystem respiration [9,10], and a small change in soil respiration due to climate changes can even give rise to important changes in forest ecosystem respiration. The interaction between snowpack accumulation and increased air temperature affects soil freeze–thaw cycles, which can lead to changes in soil properties and soil CO2 emissions [11].
In deciduous forests in the cold temperate zone, plant litterfall occurs as a pulse in late autumn and is considered one of the largest annual inputs of dissolved organic matter (DOM) into the soil [12,13], which can, in turn, affect soil CO2 emissions and δ13C values of soil-respired CO2 [14,15,16,17]. Furthermore, the variations of winter snowpack and following freeze–thaw variations in non-growing seasons in the cold climate zone can substantially influence the decomposition of litter and the dynamics of DOM released into the soil [11,18,19,20,21,22,23,24]. More importantly, there has been a trend of decreasing winter snowpack in cold temperate and boreal zones, especially in East Asia, under the background of global warming [25,26,27]. These phenomena can, in turn, affect the changes in soil respiration and its δ13C values in cold temperate forests over the year [15,16,24,28,29]. In recent decades, snow manipulation experiments have been widely carried out under different terrestrial ecosystems around the world, and there are some contrary results regarding the effects of snowpack on soil CO2 emissions in forest ecosystems [11,28,30,31] due to different soil moisture levels as well as temperature and the duration of soil freeze–thaw events after snow manipulation [28,32]. For example, natural variations in snow cover did not affect annual soil CO2 emission under a temperate forest in Austria [30], whereas soil CO2 emission was reduced by snow removal under a temperate forest in northeastern China [28]. Based on a one-year winter snow manipulation experiment under a mid-temperate forest in northeastern China, 50% removal of snowpack did not affect soil respiration and microbial biomass C, whereas a 50% increase of snowpack temporarily enhanced the ratio of fungi to bacteria [31]. A recent meta-analysis showed that snow addition significantly increased soil respiration by 15.5%, whereas snow removal had no effect [33]. The deep continuous snow cover was reported to be closely associated with relatively high soil heterotrophic respiration in winter [34]. Unfortunately, to date, there have been few studies describing the impacts of snow cover and litter on soil heterotrophic respiration and its δ13C values during non-growing and growing seasons over the year [15,16].
Based on the δ13C measurements of soil respiration in trenched and non-trenched plots, Moyes et al. showed that seasonal δ13C variability of approximately 4‰ enrichment in summer versus spring and fall soil respiration was ascribed to the heterotrophic CO2 source [35]. Under a mature temperate forest in northeastern China, the δ13C values of soil-respired CO2 in the trenched plots were, on average, less negative (by 0.6‰) than those in the non-trenched plots in the growing season [36]. Probably, heterotrophic respiration from decomposing soil organic matter (SOM) and litter would affect the changes in δ13C values of soil-respired CO2, with relatively large contributions of litter decomposition and surface soil layers to the δ13C in non-growing seasons [15,16]. Furthermore, aboveground litter inputs have an important impact on soil respiration and soil C cycling in various forest ecosystems over the year, mainly via their physical, chemical, and biological functions on soil properties [17]. However, to date, few studies have specifically documented how snow cover and the presence of litter affect soil CO2 emissions and their δ13C values in temperate forests over the year [14,15,16,36,37], which is indeed associated with evaluating more precisely the responses of forest soil C cycling to winter climate changes.
The Changbai mountain region of northeastern China belongs to a typical seasonal snow-covered area, with continuous surface snow cover lasting from late November to early April each year. Due to its unique geographical location and climatic conditions, the region is currently becoming sensitive to global climate change, which leads to changes in the aboveground snowpack and the quantity and quality of aboveground litter in forest ecosystems [38,39,40]. This can ultimately affect C cycling in forest soils and C fluxes between soils and the atmosphere in the region. The mature temperate mixed broadleaf and Korean pine forest (BKPF) belongs to the main zonal forest ecosystem in northeastern China, and its aboveground litter composition, root distribution, SOM, and microbial characteristics are quite different from those of nearby secondary white birch forest (WBF) soils [19,38,41,42]. Compared with the BKPF, the stand structure of WBF is simple, and the soil environment under the WBF stand is becoming more sensitive to solar radiation and air temperature due to the relatively low canopy [43], which can result in different snow cover and changes in soil temperature and moisture conditions under the two forest stands in the non-growing season. Probably, the above-mentioned factors can remarkably lead to different responses of soil respiration and its δ13C values to changes in snow cover and litter decomposition between the two forests over the year.
We propose that winter snow cover can affect soil microbial respiration and its δ13C during different seasons of the year, which would vary with forest stands and the presence of litter. To reduce the effects of other environmental factors as much as possible, laboratory-controlled incubation has been considered an effective method to study the interaction effects of snow cover and the presence of litter on soil CO2 emissions and their δ13C values. Based on the long-term laboratory-controlled incubation of undisturbed large soil columns collected from BKPF and WBF stands, the objectives of this study were to study the effects of snow cover and the presence of litter on soil heterotrophic respiration and its δ13C values of typical temperate forests in the Changbai mountain region in northeastern China. The results would provide a nice basis for understanding the responses of soil C cycling in temperate forests to global winter climate change.

2. Materials and Methods

2.1. Site Description and Collection of Soil Columns

The study area is in the temperate forest stands near the National Research Station of Changbai Mountain Forest Ecosystems (42°24′ N and128°6′ E) (Figure S1), with flat terrain and an average altitude of 738 m. The Changbai mountain region is located on the northeastern edge of the global monsoon climate and is influenced by the continental climate, which is characterized by long cold winters and short summers. A basic message regarding the thickness of ground snowpack, daily average air temperatures in winter, and the status of soil freezing was given by Xu et al. [29]. Within the climate region, the mature temperate BKPF belongs to the main zonal forest ecosystem in northeastern China, and its aboveground litter composition, SOM, and soil microbial characteristics are quite different from those of nearby secondary WBF [19,29]. Dominant trees of the BKPF stand include Tuan linden (Tilia amurensis Rupr.), Mongolian oak (Quercus mongolica Fisch. ex Turcz), Manchurian ash (Fraxinus mandshurica Rupr.) and Korean pine (Pinus koraiensis Sieb. et Zucc.), mostly >200 years old, and their stand densities are 117.1, 37.1, 27.2 and 98.9 trees ha−1, respectively [44]. The WBF stand is dominated by white birch (Betula platyphylla Suk.) and mountain poplar (Populus davidiana Dode), mostly >70 years old, and its stand density is 1402 stem ha−1; both white birch and mountain polar account for approximately 51.5% and 23.1% basal area of tree species, respectively [43]. Due to the differences in vegetation cover and tree species phototaxis, both air temperature and understory PAR transmittances under WBF stand in the non-growing season are higher than those under BKPF stand [43], resulting in the relative rapid melting of surface snowpack each year. The temperate forest soil belongs to an Andosol, containing a 3–5 cm depth of organic layer and approximately 10 cm depth of A horizon. Main soil properties, such as pH, texture, SOM, and bulk density, as well as the properties of aboveground litter, were described by Xu et al. [45,46] and Wu et al. [19,42].
We established 12 2 m × 2 m small plots with the well-preserved aboveground litter layers under BKPF, and WBF stands each in October 2017, prior to the occurrence of the autumn freeze–thaw process, for collecting large soil columns at approximately 15 cm depth under the two forests. At the center of each small plot, a stainless-steel cylindrical grinding tool (20 cm in diameter) was firstly smashed in the soil at approximately 15 cm depth and then replaced by thickened UPVC tubes (20 cm in diameter and 20 cm in height), and the soil column was finally taken out as one undisturbed soil column with aboveground litter. All forest soil column samples were sealed by covers and transported to the laboratory immediately, and they were stored in the dark at 4 °C prior to laboratory incubation.

2.2. Setup of Incubation Experiments

Half of all undisturbed soil columns (n = 6) under BKPF and WBF stands each removed the litter layer, and the other half retained the litter layer (n = 6). Referring to the average monthly precipitation in winter in this study area from 2005 to 2015, two levels of snow cover were considered as light and heavy snow cover treatments, respectively (Table 1). Throughout the incubation, all soil columns with and without litter layers were covered four times with artificial snow made by the snowflake ice machine (FM50, Beijing Yijialin Technology Ltd., Beijing, China), and the scheme of artificial snow addition was shown in Table 1. The total amount of snow addition in the heavy snow cover treatment accounted for approximately 40% of the average annual snowfall to avoid water and nutrient leaching inside soil columns, which was twice the total amount of snow addition in the light snow cover treatment. Based on the average distribution of annual snowfall in autumn, winter, and spring in this study area, the total amount of snow cover in autumn and spring was assumed to be the same as in winter, and snow was added evenly twice in autumn. Based on the variations of soil temperature and air temperature in the field over the year (Figure S2), long-term incubation experiments were conducted by using cryogenic incubators (LRH-250CA, Shanghai Yiheng, Shanghai, China) to reasonably set up the changes in simulated temperature levels at four different seasons of the year (Table 2). During the whole incubation, the outer surface of all UPVC pipes containing soil columns was wrapped with insulation materials to simulate freeze–thaw fluctuations in the field as closely as possible.

2.3. Measurements of CO2 Emissions from Soil Columns and Their δ13C Values

During the whole incubation, a CO2 isotope spectrum analyzer (CCIA-38d-EP, Los Research Inc., Fremont, CA, USA) along with its supporting fully automated soil respiration analysis system (SF-3000, Beijing LICA United Technology Limited, Beijing, China) was nicely combined with cryogenic incubators (LRH-250CA, Shanghai Yiheng, Shanghai, China), to determine CO2 emissions from large soil columns and the 13C/12C isotope ratios of soil-respired CO2 in the chamber headspace (Figure S3). The sampling frequency was 1 Hz for the measurement of CO2 concentration and its 13C/12C ratio in the headspace, and the output results of the stable isotopic ratios were based on Pee Dee Belemnite (PDB) as the standard, expressed by δ13C:
δ13C (‰) = (Rsample/Rstandard − 1) × 100
where Rsample and Rstandard represent the molar ratios of sample and standard 13C/12C, respectively.
Both CO2 concentrations and the 13C/12C isotope ratios in CO2 were determined using the δ13C-CO2 automatic analysis system (Figure S3), with a precision of 0.05 μmol mol−1 and 0.1‰ for a 5-min integration time, respectively. The δ13C values of CO2 produced via microbial respiration in soil columns were calculated based on the Keeling plot approach [47,48], namely using linear regressions of the δ13C values of soil-respired CO2 against the reciprocal of headspace CO2 concentrations at second scales during the closure ranging from 90 to 200 s as mentioned afterward. The closure time as short as possible (e.g., within several minutes) can minimize the disturbance of the soil-atmosphere system and concentration dependence of δ13C measurement of headspace CO2 with high precision [49,50,51]. The effect of water vapor on the δ13C measurement was nicely eliminated using a dehumidification device attached to the CO2 isotope spectrum analyzer (CCIA-38d-EP, Los Research Inc., Fremont, CA, USA). Therefore, the δ13C-CO2 automatic analysis system with high-frequency measurements can be nicely combined with laboratory incubation experiments to investigate the changes in soil CO2 emissions and their δ13C values using large soil columns (diameter = 20 cm) (Figure S3). Prior to each assay, the CO2 isotope analyzer was calibrated using two standard CO2 mixture gases containing two different CO2 concentrations (CO2 concentrations and its δ13C values: 398.60 μL L−1 and −22.31‰; 794.30 μL L−1 and −22.34‰), 1% Argon (w/w), and balance gas of air. The standard CO2 mixture gases were supplied by Air Products (Beijing Helium Pu North Branch Gas Industry Ltd., Beijing, China), and their δ13C and δ18O values were, respectively, measured with a mass spectrometer combined with a Trace Gas System (Isoprime-100, Elementar Ltd., Langenselbold, Germany), using reference materials NBS 19 and IAEA-CO-8 by the Environmental Stable Isotope Laboratory, Chinese Academy of Agricultural Sciences. During the whole incubation, CO2 emissions from soil columns in all treatments were also determined using a portable greenhouse gas analyzer (915-0011, Los Research Inc., Fremont, CA, USA) nicely coupled by a smart respiratory chamber (SC-11, Beijing LICA United Technology Limited, Beijing, China) (Figure S3). Due to sharp fluctuations of soil CO2 emissions upon the simulated freeze–thaw processes, the frequency of CO2 emission determination was six times each day during the periods of simulated autumn and spring freeze–thaw, respectively (Table 2). Within the period of winter freeze simulation (Table 2), soil CO2 emissions in all treatments were measured only once every 60 days. During the period of growing season simulation (Table 2), soil CO2 emissions in all treatments were measured initially five times each day, and then measured once every 5–7 days as it became gradually stable. Upon the determination of CO2 emissions, the duration of the closure varied from 90 to 200 s to ensure the measurement accuracy as much as possible, which was dependent on the size of soil microbial respiration at the different stages of the incubation. Throughout the incubation, the method of weighing and adding water was used at intervals to compensate for the evaporation loss of water in soil columns. During the non-freezing period of soil columns, soil volumetric water contents (v/v, %) at 5 cm depth inside soil columns in all treatments were determined at regular intervals using a portable MPkit (ICT, Sydney, NSW, Australia).

2.4. Statistical Analysis

We calculated CO2 emission per unit area (m−2) merely concerning the surface area of soil columns. The δ13C values of soil-respired CO2 in all treatments during the whole incubation were calculated according to the method of the Keeling plot [47,48]. Based on the two methods mentioned previously for measuring soil CO2 emission (Figure S3), the results were almost the same and averaged at each sampling. Means and standard errors were calculated for selected variables at each sampling of the incubation based on three replicates. All variables were examined for homogeneity of variance using Levene’s test and normality using Shapiro–Wilk test and log-transformed as needed. The soil CO2 emissions and δ13C values of soil-respired CO2 in all treatments at each stage of the incubation were, on average, described with box plots using OriginPro 2021 (OriginLab Corporation, Northampton, MA, USA). Three-factor repeated analysis of variance (ANOVA) was used with forest type, snow cover, and the presence of litter to assess individual and interactive effects on cumulative soil CO2 emissions at each stage of the incubation and throughout the incubation. Two-factor repeated ANOVA was used with snow cover and the presence of litter to assess individual and interactive effects on the average soil CO2 emissions and average δ13C values of soil-respired CO2 at each stage of the incubation. When ANOVA was significant, pairwise comparisons of means were examined using Duncan’s multiple-range test. The differences in soil volumetric water contents across all treatments, average soil CO2 emissions, and average δ13C values of soil-respired CO2 between the first and second week of the simulated autumn and spring freeze–thaw simulations (Table 2) were, respectively, assessed at a significant level of a = 0.05 using Student’s test. Least significant differences (LSDs) were calculated at a significant level of a = 0.05 to assess the differences between light and heavy snow cover-treated soil columns in soil CO2 emissions and δ13C values in CO2 at each sampling of the incubation. The relationships between soil CO2 emissions, δ13C values of soil-respired CO2, and soil moisture contents at 5 cm depth across soil columns were fitted with nonlinear and linear regressions. All statistical analyses were conducted using SPSS for Windows software (version 19.0) (IBM Corp., New York, NY, USA).

3. Results

3.1. Changes in Soil Moisture at the Different Stages of the Incubation

Prior to the incubation, volumetric water contents at 5 cm depth in all BKPF soil columns were, on average, 26.0 ± 1.0%, which was much larger than in all WBF soil columns (16.0 ± 1.0%). However, the spatial heterogeneity in initial volumetric water contents across all soil columns under each forest stand was negligible. Following the first addition of artificial snow, volumetric water contents of BKPF and WBF soil columns at 5 cm depth were, on average, increased by 29.0 ± 1.0% and 17.0 ± 1.0%, respectively (Figure 1), which were slightly larger than the background values as mentioned previously. Furthermore, following the second addition of artificial snow during the autumn freeze–thaw simulation, volumetric water contents of BKPF and WBF soil columns at 5 cm depth would increase substantially in the heavy snow cover treatment, especially in the absence of litter, and were mostly significantly larger than in the light snow cover treatment (p < 0.05) (Figure 1). Afterward, all soil columns treated with two different snow cover levels remained to be frozen until the second week of the spring freeze–thaw simulation. During the early spring freeze–thaw simulation, the task of the fourth snow addition was completed (Table 1 and Figure 2), and the following soil moisture did not change much. Therefore, soil volumetric water contents measured during the simulated growing season were averaged to represent the final volumetric water contents of soil columns in all treatments. During the simulated growing season, volumetric water contents of BKPF and WBF soil columns at 5 cm depth were, on average, 65.0 ± 0.5% and 56.0 ± 1.0% in the heavy snow cover treatment, and 40.0 ± 1.0% and 29.0 ± 1.0% in the light snow cover treatment, respectively (Figure 1).

3.2. Effect of Snow Cover and the Presence of Litter on CO2 Emissions from Soil Columns

Prior to the incubation, CO2 emissions from BKPF and WBF soil columns (n = 12, each forest type) at 15 °C were, on average, 1.48 ± 0.06 and 1.52 ± 0.09 μmol CO2 m−2 s−1, respectively. However, the soil CO2 emissions across all soil columns varied little between the two forest stands and within a single stand. The results suggested that the spatial variability of background conditions was negligible in the subsequent analysis of soil CO2 emissions in all treatments. During the autumn freeze–thaw simulation, CO2 emissions from BKPF and WBF soil columns in all treatments showed a zigzag fluctuation with the freeze–thaw alterations (Figure 2), and with the decrease of freeze and thaw temperatures, the emissions had a decreasing trend (p < 0.001) (Figure 2 and Figure 3). The increased snow cover could increase the soil CO2 emissions, especially at the early stage of the autumn freeze–thaw simulation (Figure 2 and Figure 3). This phenomenon resulted in relatively larger cumulative CO2 emissions from soil columns with and without litter during the simulated autumn freeze–thaw, compared with those from the light snow cover treatment (p < 0.05) (Table 3). The results of ANOVA showed that the presence of litter and increased snow cover could significantly increase soil CO2 emissions, but there were no significant differences between the two forest stands and no interaction effects of snow cover and the presence of litter on the soil CO2 emissions (Table 3).
During the simulated winter freeze period, CO2 emissions from BKPF and WBF soil columns in all treatments remained at a low level, with a range from 0.03 to 0.17 μmol CO2 m−2 s−1 (Figure 2 and Figure 3). Based on the results of ANOVA, cumulative soil CO2 emissions during the winter freeze simulation were significantly affected by forest stands, the presence of litter, and snow cover (Table 3). During the spring freeze–thaw simulation, CO2 emissions from BKPF and WBF soil columns in all treatments showed a zigzag fluctuation with the soil freeze–thaw alterations (Figure 2), and with the increase of freeze and thaw temperatures, the emissions increased substantially, especially under light snow cover conditions (p < 0.001) (Figure 2 and Figure 3). In contrast to that during the autumn freeze–thaw simulation, the increased snow cover significantly reduced CO2 emissions from BKPF and WBF soil columns during the spring freeze–thaw simulation (Figure 2 and Figure 3). The decrease in the increased snow cover-induced cumulative CO2 emissions appeared larger in BKPF soil columns than in WBF soil columns, but the difference was not significant (Table 3). During the late period of the spring freeze–thaw simulation, there were several flush emissions of CO2 from soil columns treated with the light snow cover, regardless of forest stands and the presence of litter (Figure 2).
During the simulated growing season, soil columns treated with heavy snow cover completely melted, and cumulative soil CO2 emissions were significantly larger than those upon light snow cover, especially in the presence of litter (p < 0.01) (Table 3). Throughout the incubation, there were relatively large increases in the increased snow cover-induced cumulative CO2 emissions from WBF soil columns, and the emissions were significantly affected by forest stands, snow cover, and the presence of litter (Table 3). In the absence of litter, cumulative CO2 emissions from WBF soil columns treated with two different snow cover levels became larger than those from BKPF soil columns at the different stages of the incubation and throughout the incubation, especially during the winter freeze and growing season simulations (p < 0.05). However, regardless of snow cover levels, there were no significant differences in the cumulative soil CO2 emissions in the presence of litter between BKPF and WBF stands, except during the winter freeze simulation (Table 3). Taken together, the results indicated that the impacts of snow cover and the presence of litter on soil heterotrophic respiration in temperate forests would vary with forest types and different seasons of the year.

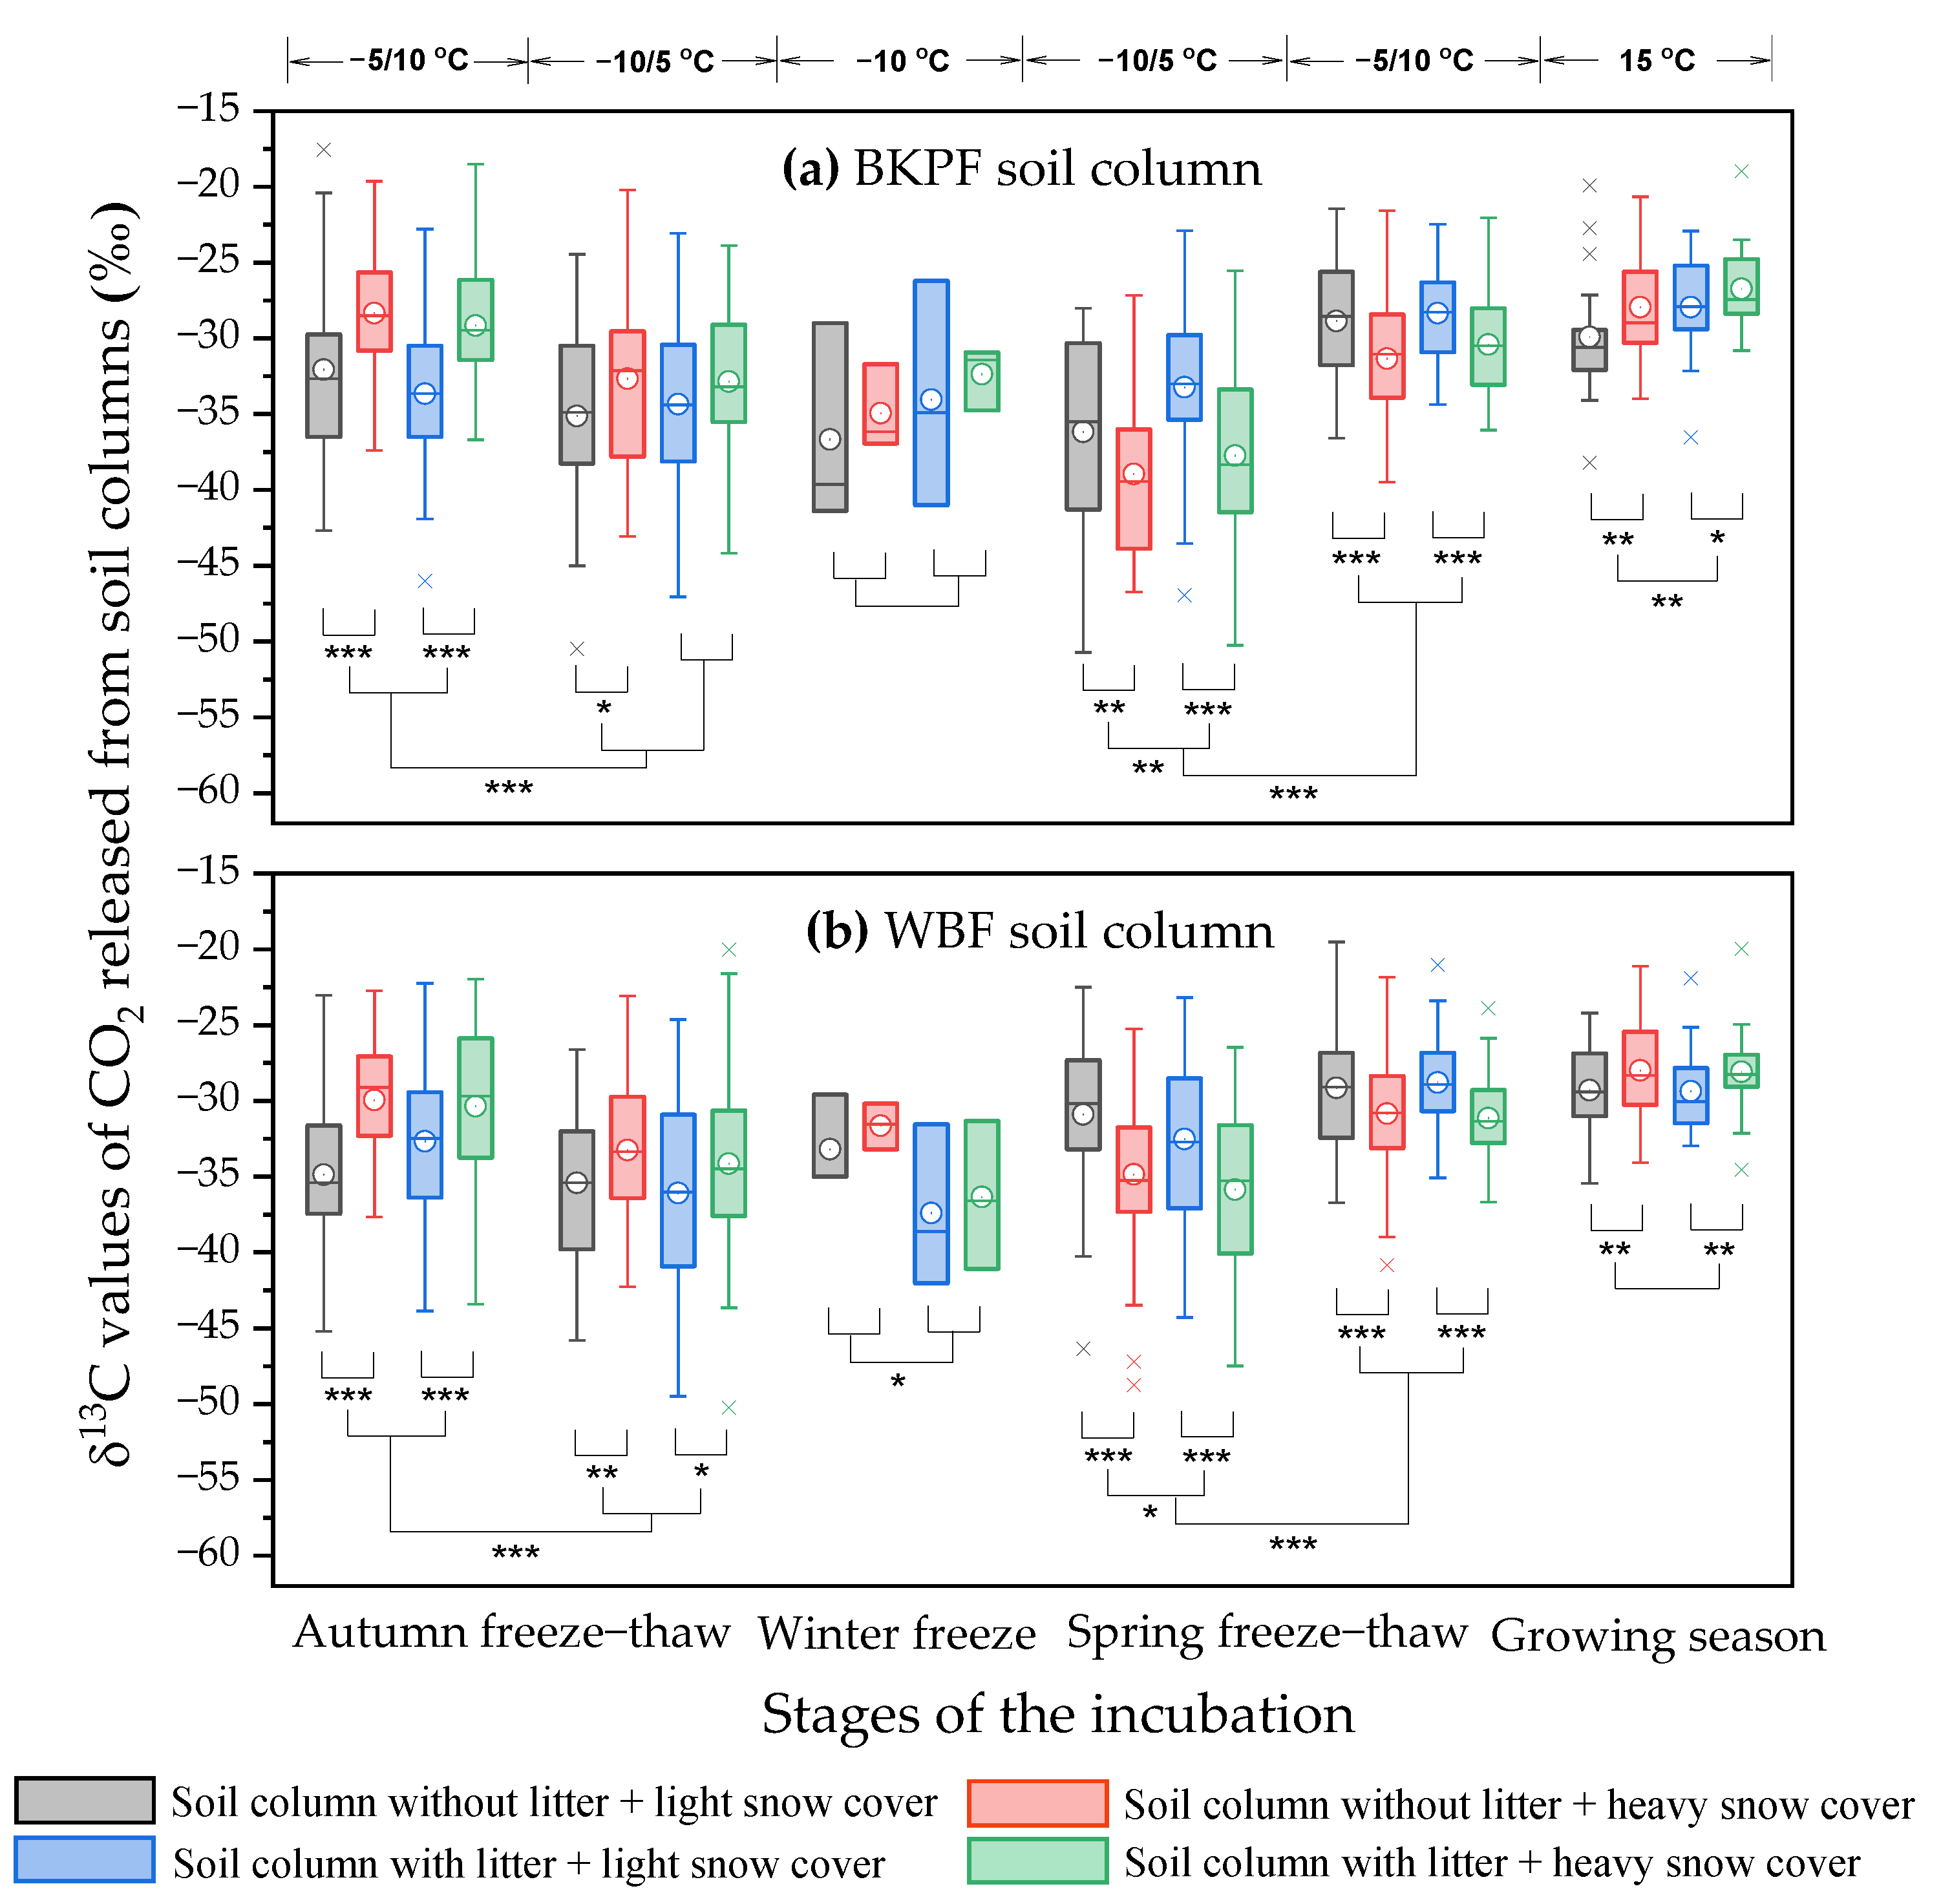
3.3. Effect of Snow Cover and the Presence of Litter on the δ13C Values of Soil-Respired CO2

During the autumn freeze–thaw simulation, the δ13C values of soil-respired CO2 fluctuated with the soil freeze–thaw alterations (Figure 4), and with the decrease of freeze and thaw temperatures, δ13C values of soil-respired CO2 in all treatments decreased on average substantially (p < 0.001) (Figure 5). Furthermore, regardless of the presence of litter, the δ13C values of soil-respired CO2 in the heavy snow cover treatment became, on average, less negative than those in the light snow cover treatment (p < 0.05), especially at the early stage of the autumn freeze–thaw simulation (p < 0.001) (Figure 5). However, the effect of the presence of litter on the average δ13C values of soil-respired CO2 did not occur during the autumn freeze–thaw simulation (Figure 5). Together with the finding that the heavy snow cover treatment can significantly increase soil heterotrophic respiration (Figure 3), the results indicate that the increased snow cover may remarkably promote the decomposition of organic C in subsurface soils under temperate forest stands during the autumn freeze–thaw period under field conditions, regardless of the presence of litter.
In contrast to those during the autumn freeze–thaw simulation, δ13C values of soil-respired CO2 in all treatments during the spring freeze–thaw simulation appeared to have a V-shaped fluctuating trend with the freeze–thaw alterations (Figure 4), and with the increase of freeze and thaw temperatures, there were on average less negative δ13C values of soil-respired CO2 in all treatments (p < 0.001) (Figure 5). Furthermore, under heavy snow cover conditions, the δ13C values of the CO2 released from BKPF and WBF soil columns were, on average more negative, especially at the early stage of the simulated spring freeze–thaw (p < 0.01) (Figure 5). This indicates that the presence of increased snow cover in winter may accelerate the decomposition of organic C in surface mineral soils and/or litter layers under temperate forests in the field during the spring freeze–thaw period. During the simulated growing season, δ13C values of soil-respired CO2 in all treatments increased gradually, and then remained relatively less negative until the end of the incubation, compared with those at the other stages of the incubation (Figure 4). On average, the increased snow cover could result in less negative δ13C of CO2 released from BKPF and WBF soil columns during the simulated growing season (p < 0.05), which was the same as shown during the simulated autumn freeze–thaw (Figure 5). Throughout the incubation, there was a shift of about 4.2‰ 13C-enrichment on average in the simulated growing season versus non-growing season soil respiration measured on all soil columns (Figure 5).
With the development of litter decomposition, the effect of litter on the δ13C values of soil-respired CO2 would vary with forest stands and different stages of the incubation. The average δ13C values of soil-respired CO2 in WBF soil columns were significantly affected by the presence of litter during the winter freeze simulation and at the early stage of the spring freeze–thaw simulation, respectively (Figure 5b). However, the δ13C values of the CO2 emitted from BKPF soil columns were, on average, significantly affected by the presence of litter at the early stage of the spring freeze–thaw simulation and during the simulated growing season, respectively (Figure 5a).

3.4. Relationships among Soil CO2 Emissions, δ13C Values of Soil-Respired CO2, and Soil Moisture

Regardless of snow cover and the presence of litter, there was a nice nonlinear relationship between soil CO2 emissions and δ13C values of soil-respired CO2 throughout the incubation (Figure 6). Under experimental conditions, the δ13C values of soil-respired CO2 had a relatively large variability when the soil CO2 emissions were less than 1.0 mmol CO2 m−2 s−1 (Figure 6). The addition of different snow covers would result in a large range of volumetric water contents in BKPF and WBF soil columns at 5 cm depth during the different stages of the incubation (Figure 1). During the whole incubation, CO2 emissions from soil columns and their corresponding δ13C values increased with the soil moisture within the range from 14.2% to 65.2% (v/v), regardless of forest types and the presence of litter (Figure 7). Under experimental conditions, soil moisture at 5 cm depth could explain the 12% and 33% variability of the δ13C values of soil-respired CO2 in the absence and presence of litter, respectively (Figure 7b).

4. Discussion

4.1. Effects of Snow Cover on Soil CO2 Emissions Vary with the Presence of Litter and Forest Stands

As the simulated autumn freeze–thaw proceeded, CO2 emission rates of BKPF and WBF soil columns decreased on average substantially due to a decrease in freeze-and-thaw temperatures (Figure 3), and cumulative soil CO2 emissions significantly varied with levels of snow cover and the presence of litter (Table 3). During the autumn freeze–thaw simulation, heavy snow cover led to an increase in volumetric soil water contents due to the initial melting of artificial snow (Figure 1) and the incomplete freezing status of soil columns prior to the winter freeze. This would increase CO2 emissions from soil columns upon the addition of heavy snow cover, especially during the early autumn freeze–thaw simulation (Figure 2 and Figure 3), hence enhancing cumulative soil CO2 emissions (Table 3). Additionally, changes in freeze and thaw temperatures and following microbial activity, as well as the supply of labile dissolved organic C (DOC) (e.g., carbohydrates) initially released into the soil upon melting of artificial snow, could promote soil CO2 emissions during the early autumn freeze–thaw simulation (Figure 3). The soil labile C pools released initially upon artificial snow cover can be partly supported by the results reported by Zhu et al. [52], who documented that the release of only O-alkyl C (e.g., carbohydrates) from fir and birch litter was increased by the presence of snow cover.
Based on the differences between CO2 emissions from soil columns without and with litter, litter-derived CO2 emissions following two levels of snow cover were coarsely calculated. During the autumn freeze–thaw simulation, the litter-derived CO2 emissions from BKPF soil columns became, on average greater than those from WBF soil columns, especially upon heavy snow cover (Table 3). In this study area, the BKPF stand lies in a climax community of forest succession, with a greater SOM content and lower bulk density than the adjacent secondary WBF stand [19]. Furthermore, the thickness of litter layers under the BKPF stand is normally greater than that under the WBF stand due to the relatively slow degradable needles of Pinus koraiensis trees and different litter leaf accumulations of tree species [38,40]. The different properties of litter layers under the two forest stands and their impacts on the soils upon initial melting of artificial snow would explain the relatively great litter-induced CO2 emissions from BKPF soil columns during the autumn freeze–thaw simulation (Table 3). The relatively high soil C availability (e.g., the microbial biomass C divided by soil organic C) under WBF stand [19] would explain larger cumulative CO2 emissions from WBF soil columns without litter and with two levels of snow cover during the different stages of the incubation and throughout the incubation, compared with those from BKPF soil columns (Table 3). However, except during the winter freeze simulation, no significant differences in the cumulative CO2 emissions were observed in the two forest soil columns with litter. In the presence of litter, the relatively great cumulative CO2 emissions from WBF soil columns during the winter freeze simulation (Table 3) were partially attributed to the relatively great DOC concentrations and microbial degradable C pools (e.g., glucose C) in the water extracts of organic layers under WBF stand in autumn than under BKPF stand [42].
On the contrary to that, during the autumn freeze–thaw simulation, the reduced snow cover during the spring freeze–thaw simulation could increase soil CO2 emission (Figure 2). This can result from more freeze–thaw cycles and greater soil temperature fluctuations under relatively low soil moisture conditions [53]. Following long-term winter freeze simulation, frequent soil freeze–thaw cycles could increase the contents of DOC released into the soil at thaw [22,24,29], especially at the late stage of the spring freeze–thaw simulation (Figure 2). The melting of artificial spring snow and following increased soil moisture would promote the activity of soil microorganisms and an associated flush of nutrients [22,54,55,56,57], which can, in turn, increase the soil CO2 emissions during the spring freeze–thaw simulation, especially when the soil water content is below optimum [24,58]. This can explain several substantial flush CO2 emissions from soil columns treated with light snow cover during the late spring freeze–thaw simulation, regardless of the presence of litter and forest stands (Figure 2). As the artificial snow cover increased, the complete melting of soil columns was detarded with the simulated spring freeze–thaw fluctuations. These phenomena resulted in relatively small cumulative CO2 emissions from heavy snow cover-treated soil columns during the spring freeze–thaw simulation, compared with those from light snow cover-treated soil columns (Table 3). Since the incubation entered the simulated growing season, soil columns treated with heavy snow cover showed relatively larger CO2 emissions compared with soil columns treated with light snow cover, especially in the presence of litter (Figure 2 and Figure 3, Table 3). Furthermore, the increased snow cover-induced cumulative CO2 emissions from WBF soil columns with and without litter were larger than those from BKPF soil columns during the simulated growing season (Table 3). Taken together, the results indicate that the impacts of snow cover on CO2 emissions from forest soils can vary with forest stands and the presence of aboveground litter as well as different seasons of the year.

4.2. Changes in the δ13C Values of Soil-Respired CO2 and Influencing Mechanisms

The δ13C values of soil-respired CO2 in all treatments became, on average, less negative during the first week than during the second week of the autumn freeze–thaw simulation (Figure 5). This was probably ascribed to an initial supply of DOC (e.g., carbohydrates) containing less depleted 13C in the soils upon the melting of artificial snow relative to the δ13C of soil organic C [59]. At the start of the simulated autumn freeze–thaw, there was an increase in labile C pools (e.g., carbohydrates) released into the soil [19,21], especially under high soil moisture conditions as caused by the initial melting of heavy artificial snow. The selective degradation of carbohydrates by microorganisms in our microcosm incubation was thus most likely to explain relatively less negative δ13C of the CO2 respired initially during the autumn freeze–thaw simulation [60] (Figure 5). While the autumn freeze–thaw simulation proceeded, labile, isotopically heavier C compounds (e.g., carbohydrates) in soils could be preferentially and rapidly decomposed by microorganisms, and then the relatively refractory organic matter (e.g., lignin) with relatively low δ13C was likely to be selectively decomposed by microorganisms surviving in soils under freeze–thaw conditions [61]. Based on the measurements of δ13C values and specific ultraviolet absorbance at 254 nm (SUVA254) of DOC collected from the intact organic horizons across the latitudinal transect over the year, the δ13C values of DOC would decrease on average with the increase in the SUVA254 values [59]. Kalbitz et al. [62] also reported that greater SUVA254 values of soil-dissolved organic matter in forest floors were associated with more negative δ13C values. The index of SUVA254 values normally reflects the aromaticity and bioavailability of DOC in soil extracts and leachates [63], and the SUVA254 values can increase following the simulated freeze–thaw fluctuations mainly due to microbial decomposition of labile DOC pools [19,21]. These could be responsible for the relatively lower δ13C values of soil-respired CO2 in all treatments at the late stage of the autumn freeze–thaw simulation. Based on relatively larger CO2 emissions and less negative δ13C of soil-respired CO2 upon heavy snow cover than upon light snow cover (Figure 4 and Figure 5) and the fractionation variations of δ13C in SOM occur at different soil layers [37], it can be thus reasonably concluded that the presence of increased snow cover prior to winter freeze can increase the decomposition of organic C in subsurface soils under temperate forests in late autumn annually, which deserves further study in the future under field conditions to explore the magnitude of the soil C flush emission and the critical intrinsic influencing mechanisms involved.
Our results indicate a relatively great range of δ13C values of soil-respired CO2 across all forest soil columns when soil CO2 emissions are less than 1.0 mmol CO2 m−2 s−1 (Figure 6). Furthermore, during the simulated autumn and spring freeze–thaw as well as winter freeze stages, δ13C values of soil-respired CO2 at each sampling were mostly characterized by relatively large standard errors (Figure 4). The large uncertainty of δ13C values of soil-respired CO2 during the non-growing season simulation corresponded with the results reported by Bowling et al. [64], who reported that the δ13C values of nocturnal whole-forest respiration in non-growing season ranged from −15‰ to −40‰ and varied more greatly than in growing season in a subalpine forest of Niwot Ridge, USA. This large uncertainty in the δ13C-CO2 values would result from a small range in CO2 concentrations and δ13C values in non-growing seasons upon using the Keeling plot approach [65] and the effects of diffusive transport-induced fractionation under non-steady state conditions caused by the freeze–thaw simulations [16,51].
The δ13C values of soil-respired CO2 in all treatments became, on average, less negative as the simulated spring freeze–thaw proceeded (p < 0.001) (Figure 5), which was contrary to the variations of the δ13C values during the autumn freeze–thaw simulation. Furthermore, there were, on average, relatively more negative δ13C of soil-respired CO2 upon heavy snow cover than upon light snow cover during the spring freeze–thaw simulation, which differed from the relatively less negative δ13C of soil-respired CO2 upon heavy snow cover during the autumn freeze–thaw and growing season simulations, respectively (Figure 5). These phenomena could result in a shift of about 4.2‰ 13C-enrichment on average in the simulated growing season versus non-growing season soil respiration measured on all soil columns during the whole incubation (Figure 5). This shift is well supported by the results reported by Moyes et al. [35], who documented that a seasonal pattern of about 4‰ 13C-enrichment in summer versus spring and fall soil respiration under deciduous trees can be attributed to the seasonal variability of soil heterotrophic respiration.
As the autumn and spring freeze–thaw simulation proceeded, the δ13C values of soil-respired CO2 in all treatments became, on average, more negative at low temperatures (−10/5 °C) than at high temperatures (−5/10 °C), regardless of snow cover and the presence of litter (Figure 5), which indicates temperature-dependent changes in the δ13C values of soil-respired CO2 under experimental conditions. This would result from the microbial-mediated decomposition of different C compounds available in the soils at the different stages of the incubation, which is likely related to the structure of the soil microbial community, as proposed by Andrews et al. [66]. Under frequent freeze–thaw disturbances caused by changes in snow cover, soil fungi, which are normally considered K-strategic microorganisms, can have a better performance than bacteria in substrate utilization in mid-latitude systems [4,67,68], and fungal biomass typically has lower δ13C values than bacterial biomass [69,70]. Normally, K-strategic microorganisms (mainly fungi) can degrade recalcitrant organic matter, whereas r-strategic microorganisms (mainly bacteria) depend on easily degradable organic matter and sufficient nutrients [71]. Furthermore, organic carbon compounds with different biodegradability contain different C isotopic compositions, with a decrease in the δ13C values from labile to recalcitrant organic matters [61]. At the early stage of soil freeze–thaw in autumn, r-strategic microorganisms can preferentially utilize labile C pools (e.g., carbohydrates) with more enrichment in 13C, resulting in relatively less negative δ13C of soil-respired CO2 during the first week than during the second week of the autumn freeze–thaw simulation (Figure 5). As the autumn freeze–thaw proceeded or after a long-term severe winter freeze, soil microbial biomass decreased, and the structure of the microbial community would have a shift towards fungi-dominated microorganisms [29,67,68], due to less sensitivity of fungi than bacteria following soil freeze–thaw or freeze processes, especially under cold winter conditions [68,72,73]. Therefore, microorganisms surviving after a severe winter freeze can release extracellular enzymes to degrade recalcitrant organic C compounds [21,74]. Probably, a shift from more labile to more recalcitrant respiratory substances, or changes in soil microbial biomass and microbial community after long-term severe winter freeze can lead to more negative δ13C of the CO2 respired initially during the spring freeze–thaw simulation (Figure 5). The temperature-dependent changes in the δ13C values of soil-respired CO2 in this study differed obviously from the results reported in previous studies without freeze–thaw disturbances [66,75]. During the 98-day laboratory incubation using forest soils, Gauthier et al. [75] observed a linear increase in δ13C values of soil-respired CO2 with decreasing temperature from 28 °C to 8 °C. Andrews et al. [66] also observed a larger increase in the δ13C values of soil-respired CO2 at 4 °C than at 22 °C, which would be related to changes in the soil microbial community composition. Taken together, the results indicate that changes in the amount and quality of organic C compounds released into the soil upon freeze–thaw disturbances [19,21,76], soil aggregate distribution [76], and microbial properties such as the structure of the microbial community and microbial activity as well as soil enzyme activity [21,23,24,57,68,74,77] can most likely influence the temperature-dependent changes in the δ13C values of soil-respired CO2.
The δ13C values of soil microbial respiration can reflect the decomposition of SOM and plant substrates and have been reported to vary greatly with environmental conditions [78,79]. Our results show that the δ13C values of soil-respired CO2 under experimental conditions can increase with the increase in volumetric soil water contents at 5 cm depth within a range from 14.2% to 65.2% (v/v) (Figure 7b). This is different from the results reported by Barbour et al. [79], who observed a negative relationship between the δ13C values of soil-respired CO2 and volumetric soil water content at a pasture site in New Zealand during nearly 10-day measurement. In a temperate desert steppe, the δ13C values of soil-respired CO2 significantly decreased with increasing soil moisture within the range from 2.0% to 28.0% (v/v) (determination coefficient of regression, R2 = 0.24) [80]. However, Phillips et al. reported that there were no changes in the δ13C values of heterotrophic soil-respired CO2 with a large soil moisture range [81]. The differences would result from different site-specific experimental conditions and other soil properties. Furthermore, 12% and 33% variations in the δ13C values of soil-respired CO2 in this study were, respectively, explained by volumetric soil water contents, in the absence and presence of litter (Figure 7b). This result indicates that in addition to soil moisture, other soil properties such as different organic C sources, microbial biomass, and microbial community may affect the δ13C of soil heterotrophic respiration under experimental conditions, which deserves further study in the future under field conditions.

5. Conclusions and Future Perspectives

The set of novel analysis systems was well used to study the changes in heterotrophic respiration of undisturbed large soil columns and their corresponding δ13C values under laboratory conditions. Based on laboratory simulation incubation experiments of four different seasons over the year, the effects of artificial snow cover on forest soil heterotrophic respiration and its δ13C values could vary with different seasons of the year, the presence of litter, and forest types. During the autumn freeze–thaw simulation, there were relatively larger CO2 emissions and less negative δ13C values of soil-respired CO2 upon heavy snow cover than upon light snow cover, indicating that the presence of increased snow cover prior to winter freeze may increase the decomposition of organic C in subsurface soils under temperate forests. The δ13C values of soil-respired CO2 in all treatments became, on average, less negative as the simulated spring freeze–thaw proceeded, which was contrary to the variations of the δ13C values observed during the autumn freeze–thaw simulation. The δ13C values of soil-respired CO2 during the simulated spring freeze–thaw were, on average, more negative upon heavy snow cover than upon light snow cover, which was contrary to the variations of the δ13C values observed during the simulated autumn freeze–thaw and growing season periods, respectively. Regardless of snow cover and the presence of litter, a shift of about 4.2‰ 13C-enrichment on average in the simulated growing season versus non-growing season soil heterotrophic respiration was observed on all large soil columns, and it would be attributed to changes in soil moisture, amount and quality of organic C compounds released into the soil, and soil microbial properties under experimental conditions. Normally, seasonal changes in δ13C values of soil heterotrophic and autotrophic respiration in terrestrial ecosystems can, to some extent, reflect the responses of SOM decomposition to environmental conditions [16,35,78,79]. The results of this study highlight the impacts of winter snow cover and the presence of litter on soil respiration and its δ13C values under temperate forests over the year, which deserves further study in the future under field conditions to explore the critical intrinsic influencing mechanisms, by moderately considering the functions of soil physicochemical and microbial properties as well as priming effects caused by fine root biomass in regulating the δ13C of soil respiration and soil C dynamics [11,16,36,61,76,77,82].

Supplementary Materials

The following supporting information can be downloaded at: https://www.mdpi.com/article/10.3390/f14071384/s1, Figure S1: Map of the study area located near the National Research Station of Changbai Mountain Forestry Ecosystem in Jilin Province, northeastern China. Figure S2: Dynamics of maximum and minimum daily air temperature as well as daily average soil temperature at 15 cm depth during the period from September 2011 to November 2012 in the study area and four subdivisions for the late autumn freeze–thaw period, winter freeze period, spring freeze–thaw period, and the growing season, respectively. Figure S3: Measurements of soil CO2 emissions and δ13C values of CO2 released from large soil columns collected from two temperate forest stands, using a set of novel analysis systems.

Author Contributions

Conceptualization, methodology, formal analysis, resources, writing—original draft preparation, writing—review and editing, supervision, funding acquisition, X.X.; methodology, formal analysis, investigation, writing—review and editing, H.W.; formal analysis, writing—review and editing, J.Y.; formal analysis, writing—review and editing, S.T.; formal analysis, writing—review and editing, W.C. All authors have read and agreed to the published version of the manuscript.

Funding

This research was funded by the National Natural Science Foundation of China (grant numbers: 41175133, 41775163, 41975121, and 42275130) and by the State Key Laboratory of Atmospheric Boundary Layer Physics and Atmospheric Chemistry (No. LAPC-KF-2023-02).

Data Availability Statement

Not applicable.

Conflicts of Interest

The authors declare no conflict of interest.

References

  1. Zhang, T.; Barry, R.G.; Armstrong, R.L. Application of satellite remote sensing techniques to frozen ground studies. Polar Geogr. 2004, 28, 163–196. [Google Scholar] [CrossRef]
  2. Tarnocai, C.; Canadell, J.G.; Schuur, E.A.G.; Kuhry, P.; Mazhitova, G.; Zimov, S. Soil organic carbon pools in the northern circumpolar permafrost region. Glob. Biogeochem. Cycles 2009, 23, GB2023. [Google Scholar] [CrossRef]
  3. Brooks, P.D.; Grogan, P.; Templer, P.H.; Groffman, P.; Öquist, M.G.; Schimel, J. Carbon and nitrogen cycling in snow-covered environments. Geogr. Compass 2011, 5, 682–699. [Google Scholar] [CrossRef]
  4. Uchida, M.; Mo, W.; Nakatsubo, T.; Tsuchiya, Y.; Horikoshi, T.; Koizumi, H. Microbial activity and litter decomposition under snow cover in a cool-temperate broad-leaved deciduous forest. Agric. For. Meteorol. 2005, 134, 102–109. [Google Scholar] [CrossRef]
  5. IPCC. Summary for policymakers. In Climate Change 2020: The Physical Science Basis; Cambridge University Press: New York, NY, USA, 2021. [Google Scholar]
  6. Brown, R.D.; Robinson, D.A. Northern Hemisphere spring snow cover variability and change over 1922–2010 including an assessment of uncertainty. Cryosphere 2011, 5, 219–229. [Google Scholar] [CrossRef] [Green Version]
  7. Kreyling, J.; Haei, M.; Laudon, H. Absence of snow cover reduces understory plant cover and alters plant community composition in boreal forests. Oecologia 2012, 168, 577–587. [Google Scholar] [CrossRef]
  8. Robroek, B.J.M.; Heijboer, A.; Jassey, V.E.J.; Hefting, M.M.; Rouwenhorst, T.G.; Buttler, A.; Bragazza, L. Snow cover manipulation effects on microbial community structure and soil chemistry in a mountain bog. Plant Soil 2013, 369, 151–164. [Google Scholar] [CrossRef] [Green Version]
  9. Wu, J.B.; Guan, D.X.; Wang, M.; Pei, T.F.; Han, S.J.; Jin, C.J. Year-round soil and ecosystem respiration in a temperate broad-leaved Korean pine forest. For. Ecol. Manag. 2006, 223, 35–44. [Google Scholar] [CrossRef]
  10. Liu, X.P.; Dong, W.X.; Wood, J.D.; Wang, Y.Y.; Li, X.X.; Zhang, Y.M.; Hu, C.S.; Gu, L.H. Aboveground and belowground contributions to ecosystem respiration in a temperate deciduous forest. Agric. For. Meteorol. 2022, 314, 108807. [Google Scholar] [CrossRef]
  11. Xu, X.K. Effect of freeze-thaw disturbance on soil C and N dynamics and GHG fluxes of East Asia forests: Review and future perspectives. Soil Sci. Plant Nutr. 2022, 68, 15–26. [Google Scholar] [CrossRef]
  12. Kalbitz, K.; Solinger, S.; Park, J.H.; Michalzik, B.; Matzner, E. Controls on the dynamics of dissolved organic matter in soils: A review. Soil Sci. 2000, 165, 277–304. [Google Scholar] [CrossRef]
  13. Wardle, D.A.; Walker, L.R.; Bardgett, R.D. Ecosystem properties and forest decline in contrasting long-term chronosequences. Science 2004, 305, 509–513. [Google Scholar] [CrossRef] [PubMed] [Green Version]
  14. Ngao, J.; Epron, D.; Brechet, C.; Granier, A. Estimating the contribution of leaf litter decomposition to soil CO2 efflux in a beech forest using 13C-depleted litter. Glob. Chang. Biol. 2005, 11, 1768–1776. [Google Scholar] [CrossRef]
  15. Sakata, T.; Ishizuka, S.; Takahashi, M. Separation of soil respiration into CO2 emission sources using 13C natural abundance in a deciduous broad-leaved forest in Japan. Soil Sci. Plant Nutr. 2007, 53, 328–336. [Google Scholar] [CrossRef]
  16. Mauritz, M.; Celis, G.; Ebert, C.; Hutchings, J.; Ledman, J.; Natali, S.M.; Pegoraro, E.; Salmon, V.G.; Schadel, C.; Taylor, M. Using stable carbon isotopes of seasonal ecosystem respiration to determine permafrost carbon loss. J. Geophys. Res.-Biogeosci. 2019, 124, 46–60. [Google Scholar] [CrossRef] [Green Version]
  17. Zhang, Y.J.; Zou, J.L.; Meng, D.L.; Dang, S.N.; Zhou, J.H.; Osborne, B.; Ren, Y.Y.; Liang, T.; Yu, K.K. Effect of soil microorganisms and labile C availability on soil respiration in response to litter inputs in forest ecosystems: A meta-analysis. Ecol. Evol. 2020, 10, 13602–13612. [Google Scholar] [CrossRef]
  18. Kiikkila, O.; Kitunen, V.; Spetz, P.; Smolander, A. Characterization of dissolved organic matter in decomposing Norway spruce and silver birch litter. Eur. J. Soil Sci. 2012, 63, 476–486. [Google Scholar] [CrossRef]
  19. Wu, H.H.; Xu, X.K.; Cheng, W.G.; Fu, P.Q.; Li, F.Y. Antecedent soil moisture prior to freezing can affect quantity, composition and stability of soil dissolved organic matter during thaw. Sci. Rep. 2017, 7, 6380. [Google Scholar] [CrossRef] [PubMed] [Green Version]
  20. Hobara, S.; Osono, T.; Hirose, D.; Noro, K.; Hirota, M.; Benner, R. The roles of microorganisms in litter decomposition and soil formation. Biogeochemistry 2014, 118, 471–486. [Google Scholar] [CrossRef]
  21. Wu, H.H.; Xu, X.K.; Fu, P.Q.; Cheng, W.G.; Fu, C.S. Responses of soil WEOM quantity and quality to freeze-thaw and litter manipulation with contrasting soil water content: A laboratory experiment. Catena 2021, 198, 105058. [Google Scholar] [CrossRef]
  22. Tan, B.; Wu, F.Z.; Yang, W.Q.; He, X.H. Snow removal alters soil microbial biomass and enzyme activity in a Tibetan alpine forest. Appl. Soil Ecol. 2014, 76, 34–41. [Google Scholar] [CrossRef]
  23. Nakajima, M.; Cheng, W.G.; Tang, S.R.; Hori, Y.; Yaginuma, E.; Hattori, S.; Hanayama, S.; Tawaraya, K.; Xu, X.K. Modeling aerobic decomposition of rice straw during off-rice season in an Andisol paddy soil in a cold temperate region, Japan: Effects of soil temperature and moisture. Soil Sci. Plant Nutr. 2016, 62, 90–98. [Google Scholar] [CrossRef] [Green Version]
  24. Wu, H.H.; Xu, X.K.; Cheng, W.G.; Han, L. Dissolved organic matter and inorganic N jointly regulate greenhouse gases fluxes from forest soils with different moistures during a freeze-thaw period. Soil Sci. Plant Nutr. 2020, 66, 163–176. [Google Scholar] [CrossRef]
  25. Yu, Z.; Liu, S.R.; Wang, J.X.; Sun, P.S.; Liu, W.G.; Hartley, D.S. Effects of seasonal snow on the growing season of temperate vegetation in China. Glob. Chang. Biol. 2013, 19, 2182–2195. [Google Scholar] [CrossRef] [PubMed]
  26. Shibata, H. Impact of winter climate change on nitrogen biogeochemistry in forest ecosystems: A synthesis from Japanese case studies. Ecol. Indic. 2016, 65, 4–9. [Google Scholar] [CrossRef]
  27. Zhou, B.T.; Wang, Z.Y.; Shi, Y.; Xu, Y.; Han, Z.Y. Historical and future changes of snowfall events in China under warming background. J. Clim. 2018, 31, 5873–5889. [Google Scholar] [CrossRef]
  28. Wang, C.K.; Han, Y.; Chen, J.Q.; Wang, X.C.; Zhang, Q.Z.; Bond-Lamberty, B. Seasonality of Soil CO2 Efflux in a Temperate Forest: Biophysical Effects of Snowpack and Spring Freeze–Thaw Cycles. Agric. For. Meteorol. 2013, 177, 83–92. [Google Scholar] [CrossRef]
  29. Xu, X.K.; Duan, C.T.; Wu, H.H.; Li, T.S.; Cheng, W.G. Effect of intensity and duration of freezing on soil microbial biomass, extractable C and N pools, and N2O and CO2 emissions from forest soils in cold temperate region. Sci. China Earth Sci. 2016, 59, 156–169. [Google Scholar] [CrossRef]
  30. Schindlbacher, A.; Jandl, R.; Schindlbacher, S. Natural variations in snow cover do not affect the annual soil CO2 efflux from a mid-elevation temperate forest. Glob. Chang. Biol. 2014, 20, 622–632. [Google Scholar] [CrossRef] [Green Version]
  31. Gao, D.C.; Hagedorn, F.; Zhang, L.; Liu, J.; Qu, G.F.; Sun, J.F.; Peng, B.; Fan, Z.Z.; Zheng, J.Q.; Jiang, P.; et al. Small and transient response of winter soil respiration and microbial communities to altered snow depth in a mid-temperate forest. Appl. Soil Ecol. 2018, 130, 40–49. [Google Scholar] [CrossRef]
  32. Tang, S.R.; Cheng, W.G.; Hu, R.G.; Nakajima, M.; Guigue, J.; Kimani, S.M.; Sato, S.; Tawaraya, K.; Xu, X.K. Decomposition of soil organic carbon influenced by soil temperature and moisture in Andisol and Inceptisol paddy soils in a cold temperate region of Japan. J. Soils Sediments 2017, 17, 1843–1851. [Google Scholar] [CrossRef]
  33. Li, W.; Wu, J.; Bai, E.; Jin, C.; Wang, A.; Yuan, F.; Guan, D. Response of terrestrial carbon dynamics to snow cover change: A meta-analysis of experimental manipulation (II). Soil Biol. Biochem. 2016, 103, 388–393. [Google Scholar] [CrossRef]
  34. Blankinship, J.C.; Hart, S.C. Consequences of manipulated snow cover on soil gaseous emission and N retention in the growing season: A meta-analysis. Ecosphere 2012, 3, 1–20. [Google Scholar] [CrossRef]
  35. Moyes, A.B.; Gaines, S.J.; Siegwolf, R.T.W.; Bowling, D.R. Diffusive fractionation complicates isotopic partitioning of autotrophic and heterotrophic sources of soil respiration. Plant Cell Environ. 2010, 33, 1804–1819. [Google Scholar] [CrossRef]
  36. Diao, H.Y.; Wang, A.Z.; Yuan, F.H.; Guan, D.X.; Wu, J.B. Autotrophic respiration modulates the carbon isotope composition of soil respiration in a mixed forest. Sci. Total Environ. 2022, 807, 150834. [Google Scholar] [CrossRef]
  37. Diao, H.Y.; Wang, A.Z.; Yuan, F.H.; Guan, D.X.; Dai, G.H.; Wu, J.B. Environmental effects on carbon isotope discrimination from assimilation to respiration in a coniferous and broad-leaved mixed forest of northeast China. Forests 2020, 11, 1156. [Google Scholar] [CrossRef]
  38. Zheng, J.P.; Guo, Z.L.; Xu, C.Y.; Fan, C.N. Seasonal dynamics of litter accumulation in major forest communities on the northern slope of Changbai Mountain, Northeast China. Acta Ecol. Sin. 2011, 31, 4299–4307. [Google Scholar]
  39. Ma, L.J.; Qin, D.H. Spatial-temporal characteristics of observed key parameters for snow cover in China during 1957–2009. J. Glaciol. Geocryol. 2012, 34, 1–11. [Google Scholar]
  40. Li, D.S.; Zheng, J.Q.; Wang, X.X.; Zheng, X.B.; Han, S.J. Effects of nitrogen addition and water manipulation on leaf litter decomposition. J. Beijing For. Univ. 2016, 38, 44–52. [Google Scholar]
  41. Yang, L.Y.; Li, W.H.; Wu, S.T. Fine root decomposition and nitrogen mineralization of the primitive Korean pine and broadleaved forests as well as its secondary forests in the Changbaishan Mountains, northeastern China. J. Beijing For. Univ. 2007, 29, 10–15. [Google Scholar]
  42. Wu, H.H.; Xu, X.K.; Duan, C.T.; Li, T.S.; Cheng, W.G. Synergistic effects of dissolved organic carbon and inorganic nitrogen on methane uptake in forest soils without and with freezing treatment. Sci. Rep. 2016, 6, 32555. [Google Scholar] [CrossRef] [PubMed] [Green Version]
  43. Zhou, G.; Liu, Q.J.; Xu, Z.Z.; Du, W.X.; Yu, J.; Meng, S.W.; Zhou, H.; Qin, L.H.; Shah, S. How can the shade intolerant Korean pine survive under dense deciduous canopy? For. Ecol. Manag. 2020, 457, 117735. [Google Scholar] [CrossRef]
  44. Hao, Z.Q.; Zhang, J.; Song, B.; Ye, J.; Li, B.H. Vertical structure and spatial associations of dominant tree species in an old-growth temperate forest. For. Ecol. Manag. 2007, 252, 1–11. [Google Scholar] [CrossRef]
  45. Xu, X.K.; Han, L.; Wang, Y.S.; Inubushi, K. Influence of vegetation types and soil properties on microbial biomass carbon and metabolic quotients in temperate volcanic and tropical forest soils. Soil Sci. Plant Nutr. 2007, 53, 430–440. [Google Scholar] [CrossRef] [Green Version]
  46. Xu, X.K.; Yin, L.; Duan, C.T.; Jing, Y.S. Effect of N addition, moisture, and temperate on soil microbial respiration and microbial biomass in forest soil at different stages of litter decomposition. J. Soils Sediments 2016, 16, 1421–1439. [Google Scholar] [CrossRef]
  47. Keeling, C.D. The concentration and isotopic abundances of atmospheric carbon dioxide in rural areas. Geochim. Cosmochim. Acta 1958, 13, 322–334. [Google Scholar] [CrossRef]
  48. Keeling, C.D. The concentration and isotopic abundances of carbon dioxide in rural and marine air. Geochim. Cosmochim. Acta 1961, 24, 277–298. [Google Scholar] [CrossRef]
  49. Kammer, A.; Tuzson, B.; Emmenegger, L.; Knohl, A.; Mohn, J.; Hagedorn, F. Application of a quantum cascade laser-based spectrometer in a closed chamber system for real-time δ13C and δ18O measurements of soil-respired CO2. Agric. For. Meteorol. 2011, 151, 39–48. [Google Scholar] [CrossRef]
  50. Wen, X.F.; Meng, Y.; Zhang, X.Y.; Sun, X.M.; Lee, X. Evaluating calibration strategies for isotope ratio infrared spectroscopy for atmospheric 13CO2/12CO2 measurement. Atmos. Meas. Technol. 2013, 6, 1491–1501. [Google Scholar] [CrossRef]
  51. Chen, C.H.; Wei, J.; Wang, J.Y.; Guo, Q.J.; Wen, X.F. Disentangling diel variations in the carbon isotopic composition of soil CO2 efflux: Insights from a multi-chamber system and a non-steady model. J. Soil Sci. Plant Nutr. 2022, 22, 3096–3109. [Google Scholar] [CrossRef]
  52. Zhu, J.J.; Wu, Q.X.; Wu, F.Z.; Yue, K.; Ni, X.Y. Decline in carbon decomposition from litter after snow removal is driven by a delayed release of carbohydrates. Plant Soil 2022, 481, 83–95. [Google Scholar] [CrossRef]
  53. Groffman, P.M.; Driscoll, C.T.; Fahey, T.J.; Hardy, J.P.; Fitzhugh, R.D.; Tierney, G.L. Colder soils in a warmer world: A snow manipulation study in a northern hardwood forest ecosystem. Biogeochemistry 2001, 56, 135–150. [Google Scholar] [CrossRef]
  54. Brooks, P.; Williams, M.; Schmidt, S. Inorganic nitrogen and microbial biomass dynamics before and during spring snowmelt. Biogeochemistry 1998, 43, 1–15. [Google Scholar] [CrossRef]
  55. Lee, M.S.; Lee, J.S.; Koizumi, H. Temporal variation in CO2 efflux from soil and snow surfaces in a Japanese cedar (Cryptomeria japonica) Plantation, central Japan. Ecol. Res. 2008, 23, 777–785. [Google Scholar] [CrossRef]
  56. Gao, D.C.; Peng, B.; Fan, Z.Z.; Pei, G.T.; Bai, E. Different winter soil respiration between two mid-temperate plantation forests. For. Ecol. Manag. 2018, 409, 390–398. [Google Scholar] [CrossRef]
  57. Wu, Q.Q. Season-dependent effect of snow depth on soil microbial biomass and enzyme activity in a temperate forest in Northeast China. Catena 2020, 195, 104760. [Google Scholar] [CrossRef]
  58. Yohannes, Y.; Shibistova, O.; Abate, A.; Fetene, M.; Guggenberger, G. Soil CO2 efflux in an Afromontane forest of Ethiopia as driven seasonality and tree species. For. Ecol. Manag. 2011, 261, 1090–1098. [Google Scholar] [CrossRef]
  59. Philben, M.; Bowering, K.; Podrebarac, F.A.; Laganière, J.; Edwards, K.; Ziegler, S.E. Enrichment of 13C with depth in soil organic horizons is not explained by CO2 or DOC losses during decomposition. Geoderma 2022, 424, 116004. [Google Scholar] [CrossRef]
  60. Benner, R.; Fogel, M.L.; Sprague, E.K.; Hodson, R.E. Depletion of 13C in lignin and its implications for stable carbon isotope studies. Nature 1987, 329, 708–710. [Google Scholar] [CrossRef]
  61. Bowling, D.R.; Pataki, E.E.; Randerson, J.T. Carbon isotopes in terrestrial ecosystem pools and CO2 fluxes. New Phytol. 2008, 178, 24–40. [Google Scholar] [CrossRef] [Green Version]
  62. Kalbitz, K.; Glaser, B.; Bol, R. Clear-cutting of a Norway spruce stand: Implications for controls on the dynamics of dissolved organic matter in the forest floor. Eur. J. Soil Sci. 2004, 55, 401–413. [Google Scholar] [CrossRef]
  63. Xu, X.K.; Luo, X.B.; Jiang, S.H.; Xu, Z.J. Biodegradation of dissolved organic carbon in soil extracts and leachates from a temperate forest stand and its relationship to ultraviolet absorbance. Chin. Sci. Bull. 2012, 57, 912–920. [Google Scholar] [CrossRef] [Green Version]
  64. Bowling, D.R.; Massman, W.J.; Schaeffer, S.M.; Burns, S.P.; Monson, R.K.; Williams, M.W. Biological and physical influences on the carbon isotope content of CO2 in a subalpine forest snowpack, Niwot Ridge, Colorado. Biogeochemistry 2009, 95, 37–59. [Google Scholar] [CrossRef]
  65. Zobitz, J.M.; Keener, J.P.; Schnyder, H.; Bowling, D.R. Sensitivity analysis and quantification of uncertainty for isotopic mixing relationships in carbon cycle research. Agric. For. Meteorol. 2006, 136, 56–75. [Google Scholar] [CrossRef]
  66. Andrews, J.A.; Matamala, R.; Westover, K.M.; Schlesinger, W.H. Temperature effects on the diversity of soil heterotrophs and the δ13C of soil-respired CO2. Soil Biol. Biochem. 2000, 32, 699–706. [Google Scholar] [CrossRef]
  67. Monson, R.K.; Lipson, D.L.; Burns, S.P.; Turnipseed, A.A.; Delany, A.C.; Williams, M.W.; Schmidt, S.K. Winter forest soil respiration controlled by climate and microbial community composition. Nature 2006, 439, 711–714. [Google Scholar] [CrossRef]
  68. Aanderud, Z.T.; Jones, S.E.; Schoolmaster, D.R., Jr.; Fierer, N.; Lennon, J.T. Sensitivity of soil respiration and microbial communities to altered snowfall. Soil Biol. Biochem. 2013, 57, 217–227. [Google Scholar] [CrossRef]
  69. Dijkstra, P.; Ishizu, A.; Doucett, R.; Hart, S.C.; Schwartz, E.; Menyailo, O.V.; Hungate, B.A. 13C and 15N natural abundance of the soil microbial biomass. Soil Biol. Biochem. 2006, 38, 3257–3266. [Google Scholar] [CrossRef]
  70. Werth, M.; Kuzyakov, Y. 13C fractionation at the root–microorganisms–soil interface: A review and outlook for partitioning studies. Soil Biol. Biochem. 2010, 42, 1372–1384. [Google Scholar] [CrossRef]
  71. Fontaine, S.; Mariotti, A.; Abbadie, L. The priming effect of organic matter: A question of microbial competition? Soil Biol. Biochem. 2003, 35, 837–843. [Google Scholar] [CrossRef]
  72. Schadt, C.W.; Martin, A.P.; Lipson, D.A.; Schmidt, S.K. Seasonal dynamics of previously unknown fungal lineages in tundra soils. Science 2003, 301, 1359–1361. [Google Scholar] [CrossRef] [Green Version]
  73. Buckeridge, K.M.; Grogan, P. Deepened snow alters soil microbial nutrient limitations in arctic birch hummock tundra. Appl. Soil Ecol. 2008, 39, 210–222. [Google Scholar] [CrossRef]
  74. Weintraub, M.N.; Scott-Denton, L.E.; Schmidt, S.K.; Monson, R.K. The effects of tree rhizodeposition on soil exoenzyme activity, dissolved organic carbon, and nutrient availability in a subalpine forest ecosystem. Oecologia 2007, 154, 327–338. [Google Scholar] [CrossRef]
  75. Gauthier, A.; Amiotte-Suchet, P.; Nelson, P.N.; Léeêque, J.; Zeller, B.; Hénault, C. Dynamics of the water extractable organic carbon pool during mineralisation in soils from a Douglas fir plantation and an oak-beech forest—An incubation experiment. Plant Soil 2010, 330, 465–479. [Google Scholar] [CrossRef]
  76. Tang, S.R.; Yuan, P.; Tawaraya, K.; Tokida, T.; Fukuoka, M.; Yoshimoto, M.; Sakai, H.; Hasegawa, T.; Xu, X.K.; Cheng, W.G. Winter nocturnal warming affects the freeze-thaw frequency, soil aggregate distribution, the contents and decomposability of C and N in paddy fields. Sci. Total Environ. 2022, 802, 149870. [Google Scholar] [CrossRef]
  77. Böstrom, B.; Comstedt, D.; Ekblad, A. Can isotopic fractionation during respiration explain the 13C-enriched sporocarps of ectomycorrhizal and saprotrophic fungi? New Phytol. 2007, 177, 1012–1019. [Google Scholar] [CrossRef]
  78. Amundson, R.; Stern, L.; Baisden, T.; Wang, Y. The isotopic composition of soil and soil-respired CO2. Geoderma 1998, 82, 83–114. [Google Scholar] [CrossRef]
  79. Barbour, M.M.; Hunt, J.E.; Kodama, N.; Laubach, J.; McSeveny, T.M.; Rogers, G.N.D.; Tcherkez, G.; Wingate, L. Rapid changes in δ13C of ecosystem-respired CO2 after sunset are consistent with transient 13C enrichment of leaf respired CO2. New Phytol. 2011, 190, 990–1002. [Google Scholar] [CrossRef] [PubMed]
  80. Guo, N.; Lv, S.J.; Lv, G.Y.; Xu, X.B.; Yao, H.Y.; Yu, Z.H.; Qiu, X.; Wang, Z.Y.; Wang, C.J. Effects of warming and precipitation on soil CO2 flux and its stable carbon isotope composition in the temperate desert steppe. Sustainability 2022, 14, 3351. [Google Scholar] [CrossRef]
  81. Phillips, C.L.; Nickerson, N.; Risk, D.; Kayler, Z.E.; Anderson, C.; Mix, A.; Bond, B.J. Soil moisture effects on the carbon isotope composition of soil respiration. Rapid Commun. Mass Spectrom. 2010, 24, 1271–1280. [Google Scholar] [CrossRef]
  82. Babur, E.; Dindaroglu, T.; Danish, S.; Haggblom, M.M.; Ozlu, E.; Gozukara, G.; Uslu, O.S. Spatial responses of soil carbon stocks, total nitrogen, and microbial indices to post-wildfire in the Mediterranean red pine forest. J. Environ. Manag. 2022, 320, 115939. [Google Scholar] [CrossRef] [PubMed]
Figure 1. Changes in soil moisture at 5 cm depth in large forest soil columns during the different stages of the incubation. Data are shown as means ± 1 × standard errors (n = 3). *, p < 0.05; ***, p < 0.001.
Forests 14 01384 g001
Figure 2. Dynamics of CO2 emissions from snow-covered large forest soil columns with and without aboveground litter during the different stages of the incubation. Data are shown as means ± 1 × standard errors (n = 3). Vertical bars show the least significant difference at the a = 0.05 level (LSD0.05) between light and heavy snow-covered forest soil columns at each sampling time. The arrows represent the time of snow addition during the simulated autumn freeze–thaw, winter freeze, and spring freeze–thaw periods, respectively.
Forests 14 01384 g002
Figure 3. Box plots of the average CO2 emissions from snow-covered large forest soil columns with and without aboveground litter during the different stages of the incubation. Boxes represent interquartile ranges (IQRs), and horizontal lines and circles within boxes indicate median and mean values, respectively. Lower and upper whiskers (x) represent 25 percentiles minus 1.5 IQR and 75 percentiles plus 1.5 IQR, respectively. *, p < 0.05; **, p < 0.01; ***, p < 0.001.
Forests 14 01384 g003
Figure 4. Dynamics of the δ13C values of CO2 released from snow-covered large forest soil columns with and without aboveground litter during the different stages of the incubation. Data are shown as means ± 1 × standard errors (n = 3). Vertical bars show the least significant difference at the a = 0.05 level (LSD0.05) between light and heavy snow-covered forest soil columns at each sampling time. The arrows represent the time of snow addition during the simulated autumn freeze–thaw, winter freeze, and spring freeze–thaw periods, respectively.
Forests 14 01384 g004
Figure 5. Box plots of the average δ13C values of CO2 released from snow-covered large forest soil columns with and without aboveground litter during the different stages of the incubation. (a) BKPF soil column; (b) WBF soil column. *, p < 0.05; **, p < 0.01; ***, p < 0.001. A description of box plots is provided in the caption of Figure 3.
Forests 14 01384 g005
Figure 6. Relationships between CO2 emissions from snow-covered large forest soil columns and their corresponding δ13C values in the presence and absence of litter during the whole incubation. Data are shown as means ± 1 × standard errors (n = 3). The relationships between soil CO2 emissions and their corresponding δ13C values are fitted with nonlinear regressions. The blue and green lines in (ad) are nonlinear regression fitting lines with light and heavy snow cover, respectively.
Forests 14 01384 g006
Figure 7. Relationships between CO2 emissions from snow-covered large forest soil columns with and without aboveground litter (a) and their corresponding δ13C values (b) during the whole incubation versus soil moisture at 5 cm depth in soil columns. Data are shown as means ± 1 × standard errors (n = 3). The relationships between soil CO2 emissions and their corresponding δ13C values against the soil moisture in the presence and absence of litter were fitted with linear regressions, respectively.
Forests 14 01384 g007
Table 1. Amount and time of snow addition at the different stages of the incubation.
Levels of Snow CoverSimulation Stages
Autumn Freeze–ThawWinter FreezeSpring Freeze–Thaw
Light snow
cover
35 g and 35 g on the first and 8th days of the incubation, respectively160 g on the 15th day of the incubation70 g on the 205th day of the incubation
Heavy snow
cover
150 g and 150 g on the first and 8th days of the incubation, respectively600 g on the 15th day of the incubation300 g on the 205th day of the incubation
Table 2. Temperature setting at the four stages of the incubation.
Simulation StageAutumn
Freeze–Thaw
Winter FreezeSpring
Freeze–Thaw
Growing Season
Duration (day)771807761
Daily freeze–thaw alternation time (hour)12/1224 (a)12/1224 (a)
Temperature setting (°C)−5/10−10/5−10−10/5−5/1015
(a) 24 h each day at a constant temperature.
Table 3. Cumulative CO2 emissions from forest soil columns during the different stages of the incubation and the results of ANOVA.
Forest Type (FT)Litter Cover
(L)
Levels of Snow Cover (S)Simulation Stage
Autumn Freeze–ThawWinter
Freeze
Spring
Freeze–Thaw
Growing
Season
Total
(g CO2-C m−2)
BKPFWithoutLight4.84 ± 0.118.43 ± 0.2422.15 ± 1.55128.67 ± 3.77164.08 ± 5.21
Heavy5.74 ± 0.2610.44 ± 0.7711.98 ± 0.49139.46 ± 2.41167.62 ± 2.30
WithLight6.51 ± 0.3116.02 ± 0.4725.08 ± 0.30161.92 ± 2.08209.53 ± 2.34
Heavy8.58 ± 0.7920.42 ± 1.6817.13 ± 1.19197.17 ± 13.47243.30 ± 16.82
WBFWithoutLight5.71 ± 0.1115.03 ± 0.7324.01 ± 1.51154.06 ± 3.69198.81 ± 5.59
Heavy7.67 ± 0.1419.73 ± 0.8116.30 ± 0.47182.48 ± 2.67226.17 ± 3.69
WithLight6.55 ± 0.6527.04 ± 1.6523.99 ± 2.05157.92 ± 9.07215.51 ± 12.40
Heavy8.20 ± 0.5430.57 ± 1.7717.83 ± 0.39203.71 ± 3.14260.31 ± 5.76
Three−way factorial ANOVA with FT, L, and S as fixed factors (p-value)
FT0.338<0.0010.3960.0640.025
L0.032<0.0010.1670.0050.002
S0.0180.040<0.0010.0040.033
FT × L0.2270.4340.3370.0840.154
FT × S0.8010.7860.5310.4420.469
L × S0.7330.8560.5760.2590.326
FT × L × S0.5640.5940.9220.8450.789
Disclaimer/Publisher’s Note: The statements, opinions and data contained in all publications are solely those of the individual author(s) and contributor(s) and not of MDPI and/or the editor(s). MDPI and/or the editor(s) disclaim responsibility for any injury to people or property resulting from any ideas, methods, instructions or products referred to in the content.

