Article

Soil Depth Can Modify the Contribution of Root System Architecture to the Root Decomposition Rate

1
Co-Innovation Center for Sustainable Forestry in Southern China, Jiangsu Province Key Laboratory of Soil and Water Conservation and Ecological Restoration, Nanjing Forestry University, Nanjing 210037, China
2
Jiangsu Academy of Forestry, Dongshanqiao, Jiangning, Nanjing 211153, China
3
Department of Forestry and Environmental Conservation, Clemson University, Clemson, SC 29634, USA
*
Author to whom correspondence should be addressed.
Forests 2023, 14(6), 1092; https://doi.org/10.3390/f14061092
Submission received: 14 March 2023 / Revised: 18 May 2023 / Accepted: 22 May 2023 / Published: 25 May 2023
(This article belongs to the Section Forest Soil)

Abstract

:
Aims: Changes in root system architecture (RSA) and soil depth affect the root decomposition rate. However, due to soil opacity, many variables of RSA have not been well studied or even measured. Methods: To investigate the effects of soil depth and the characteristics of RSA on the root decomposition rate, soil samples (Soil cores were collected in October 2020 from Cunninghamia lanceolata and Pinus taeda plantations, which were 40 years old) were obtained using a soil auger and had a diameter of 10 cm and a length of 60 cm. Samples were taken from six different soil depths, ranging from 0 to 60 cm with a 10 cm interval between each depth. The RSA in the in-situ soil cores was analyzed using computed tomography scans and Avizo. Results: Root volume and the number of root throats were significantly higher at the 0–10 cm soil depth than at the 10–60 cm soil depth, but root length was significantly lower at the 50–60 cm soil depth (p < 0.05). Structural equation modeling showed that different stand types influenced root biomass and thus the root decomposition rate directly or indirectly through the characteristics of the stand types. RSA, i.e., root thickness and breadth, affected root biomass indirectly and then affected the root decomposition rate. Root biomass contributed the most to the root decomposition rate in the Cunninghamia lanceolata (20.19%) and Pinus taeda (32.26%) plantations. The contribution of the RSA variables to the root decomposition rate exceeded 50% at the 20–30 cm and 40–50 cm soil depths. Conclusions: Our findings suggested that the influence of the RSA variables on the root decomposition rate varies with soil depth. This deserves more consideration in our future studies on root decomposition and RSA.

1. Introduction

Roots play a vital role in trees’ ability to acquire nutrients and water from the soil [1,2], making them crucial for tree productivity. The biomass of roots constitutes a considerable portion, ranging from 10% to 65%, of the overall biomass of trees [3,4,5]. This substantial root biomass greatly influences the carbon dynamics and storage capacity of forest ecosystems [6,7,8]. At the same time, roots are affected by a combination of factors, including the soil environment in which the plant is located and the tree species itself [5,8]. Despite their importance, many aspects of roots remain relatively unknown. This is mainly because the roots are underground and the opaque nature of soils is a major impediment to root studies [9]. Therefore, the number of studies on roots is small compared to studies on the above-ground parts. Among these studies on the roots of forest trees, studies on root system architecture (RSA) are often neglected.
RSA describes the spatial arrangement pattern of different types of roots distributed in the soil [10], i.e., the size and definite location of each specific point of the roots [11]. RSA has important effects on nutrient acquisition and storage and carbon allocation in forest trees. Different types of RSA create different growth habits in forest trees. At the same time, forest trees also adjust their RSA to adapt to the changing external environment [12,13]. When roots encounter a nutrient-rich medium, trees increase [14] or decrease [15] lateral root growth near nutrient-rich areas. When nutrient-poor areas are present, the tree will suppress root growth in these areas. It has been shown that drought causes a decrease in root length density and an increase in root diameter [16]. Trees can also adjust their roots to utilize nutrients at different soil depths [17]. When nutrients in the upper soil are not sufficient, the tree will adjust its roots to grow deeper into the soil to obtain sufficient nutrients. When there are sufficient nutrients in the upper soil, the roots will adjust again to make more use of the upper soil nutrients [18,19]. The variation in RSA at soil depth largely reflects the distribution of soil nutrients at soil depth. The dynamic nature of the root structure, as it adapts to the environment and its own requirements, plays a crucial role in optimizing the growth and development of forest trees [20,21]. Conducting a comprehensive and detailed investigation of RSA has significant implications for the understanding of soil–plant systems. The RSA serves as an indicator of root growth and soil nutrient distribution, directly influencing the rate of root decomposition [22]. Typically, the quantification of RSA involves variables such as root diameter, root length, root surface area, and root volume, all of which impact the root decomposition rate [23]. However, these variables only provide a two-dimensional representation of the distribution pattern of the RSA [11]. Since roots exist in soil as a three-dimensional structure with significant variability, analyzing the RSA solely from a two-dimensional perspective might overlook crucial information [24]. This disregarded information could hold great importance for the rate of root decomposition.
To improve the accuracy of characterizing RSA, a large number of research methods have been applied, including excavation methods, minirhizotrons, and artificial transparent growth media to observe roots [25,26]. However, all of these methods have certain drawbacks. For example, the manual method involves the destructive excavation of the roots by hand and cleaning the roots to measure the root diameter, length, angle, and depth [27]. The coordinates of the root surface are recorded, and the results of the manual measurements are inputted into software to reconstruct the entire root system in three-dimensional (3D). This method is time-consuming and labor-intensive, and if not handled properly, this destructive method can bring external disturbances to the inter-root environment, leading to inaccurate repeated measurements over time [28]. Further, because of the need to manually clean the roots, some fine roots will inevitably be broken and washed away in the process, causing damage to the original structure of the roots and leading to errors in the final results [29]. Although the minirhizotron method can achieve in situ observations, it can only observe a small volume of soil surrounding the transparent minirhizotron observation tubes [30]. The problem with the artificial medium method is that while it simulates the natural habitat, due to the diversity and uncertainty of the field environment, the method cannot fully restore the real growth condition of the forest roots in the field [31]. In summary, the opacity of the soil medium is a major problem limiting the study of roots [9]. Computed tomography (CT) has been applied as a non-destructive method to investigate the RSA with the advancement of technology and research tools [32,33,34]. The three-dimensional reconstruction of the roots can be achieved by CT, and the reconstructed RSA can be quantified using analysis software. With CT nondestructive techniques, we can analyze more structural characteristics of the roots, and we can further investigate the influence of the real structural characteristics of the roots in soil on the root decomposition rate.
To better investigate the distribution characteristics of forest RSA at different soil depths and to study its influence on the root decomposition rate, we designed a 12-month field experiment within Cunninghamia lanceolata and Pinus taeda plantations. The in situ soil core method was innovatively improved by scanning the in situ soil cores using medical CT to obtain the RSA distribution characteristics in a non-destructive manner. Our study intends to address the following main questions: (1) what is the distribution pattern of the RSA at each soil depth?, (2) How do RSA variables affect the root decomposition rate, and (3) Does the contribution of each RSA variable to the root decomposition rate differ by tree species and soil depth?

2. Materials and Methods
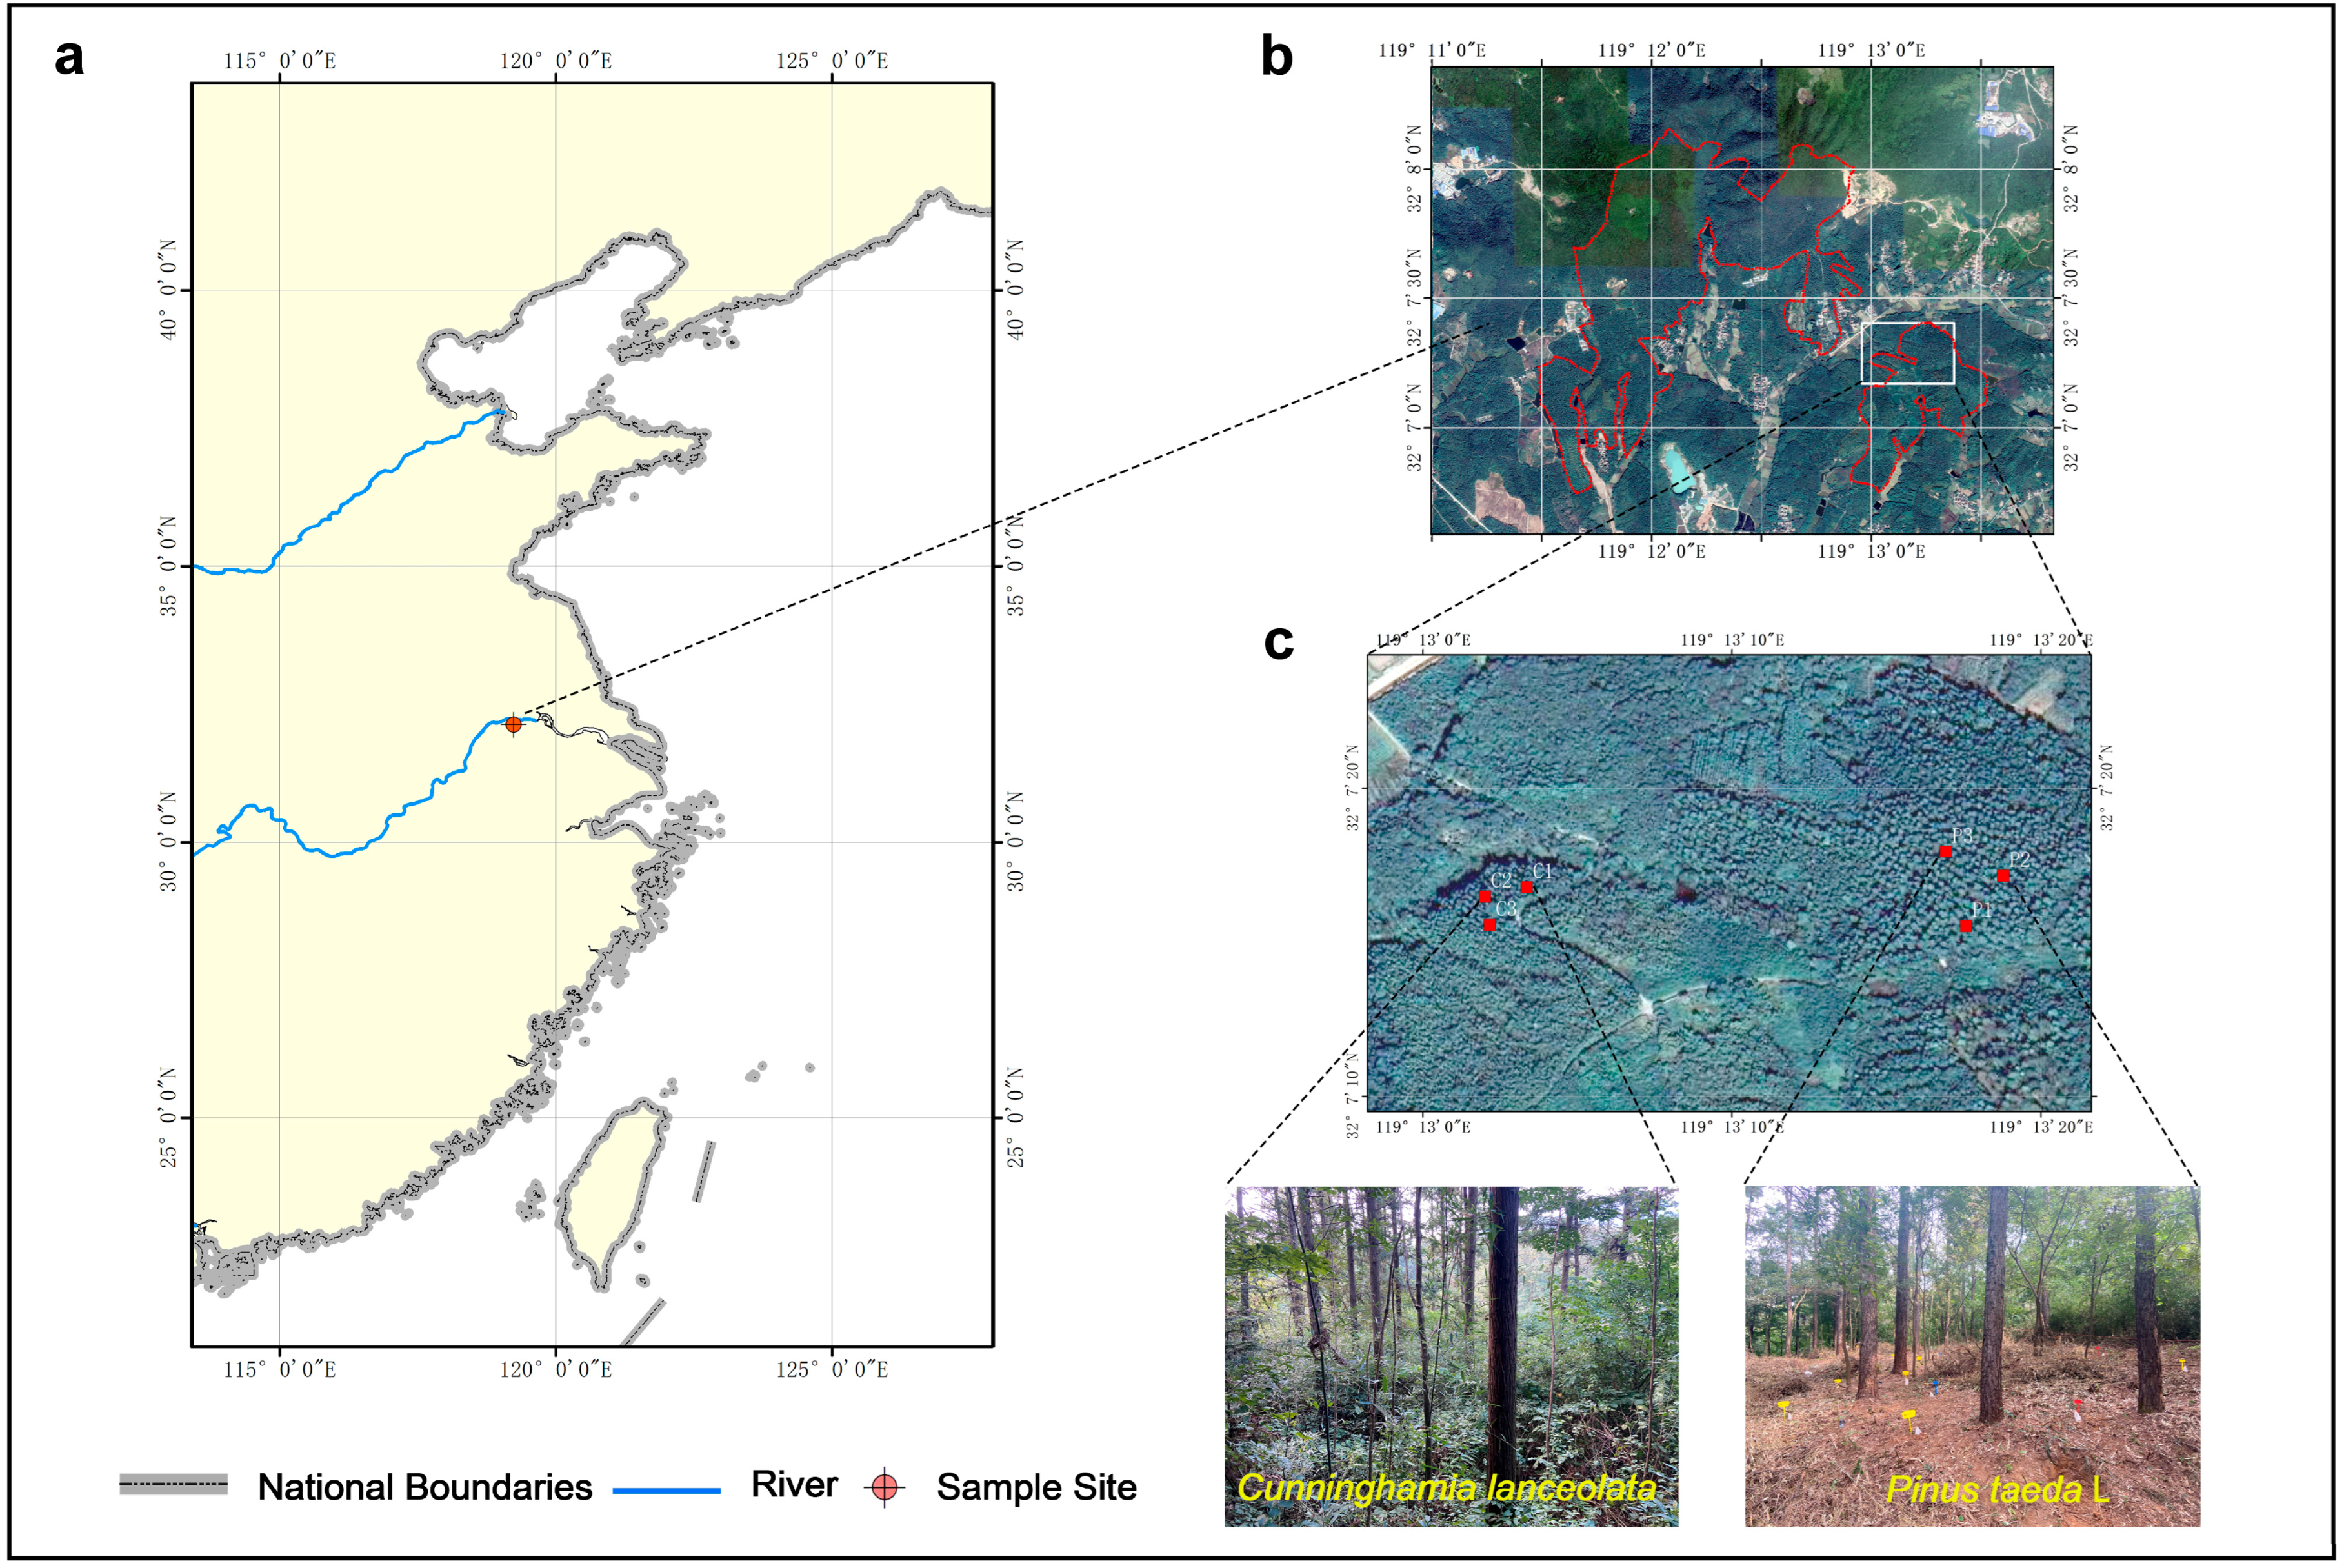
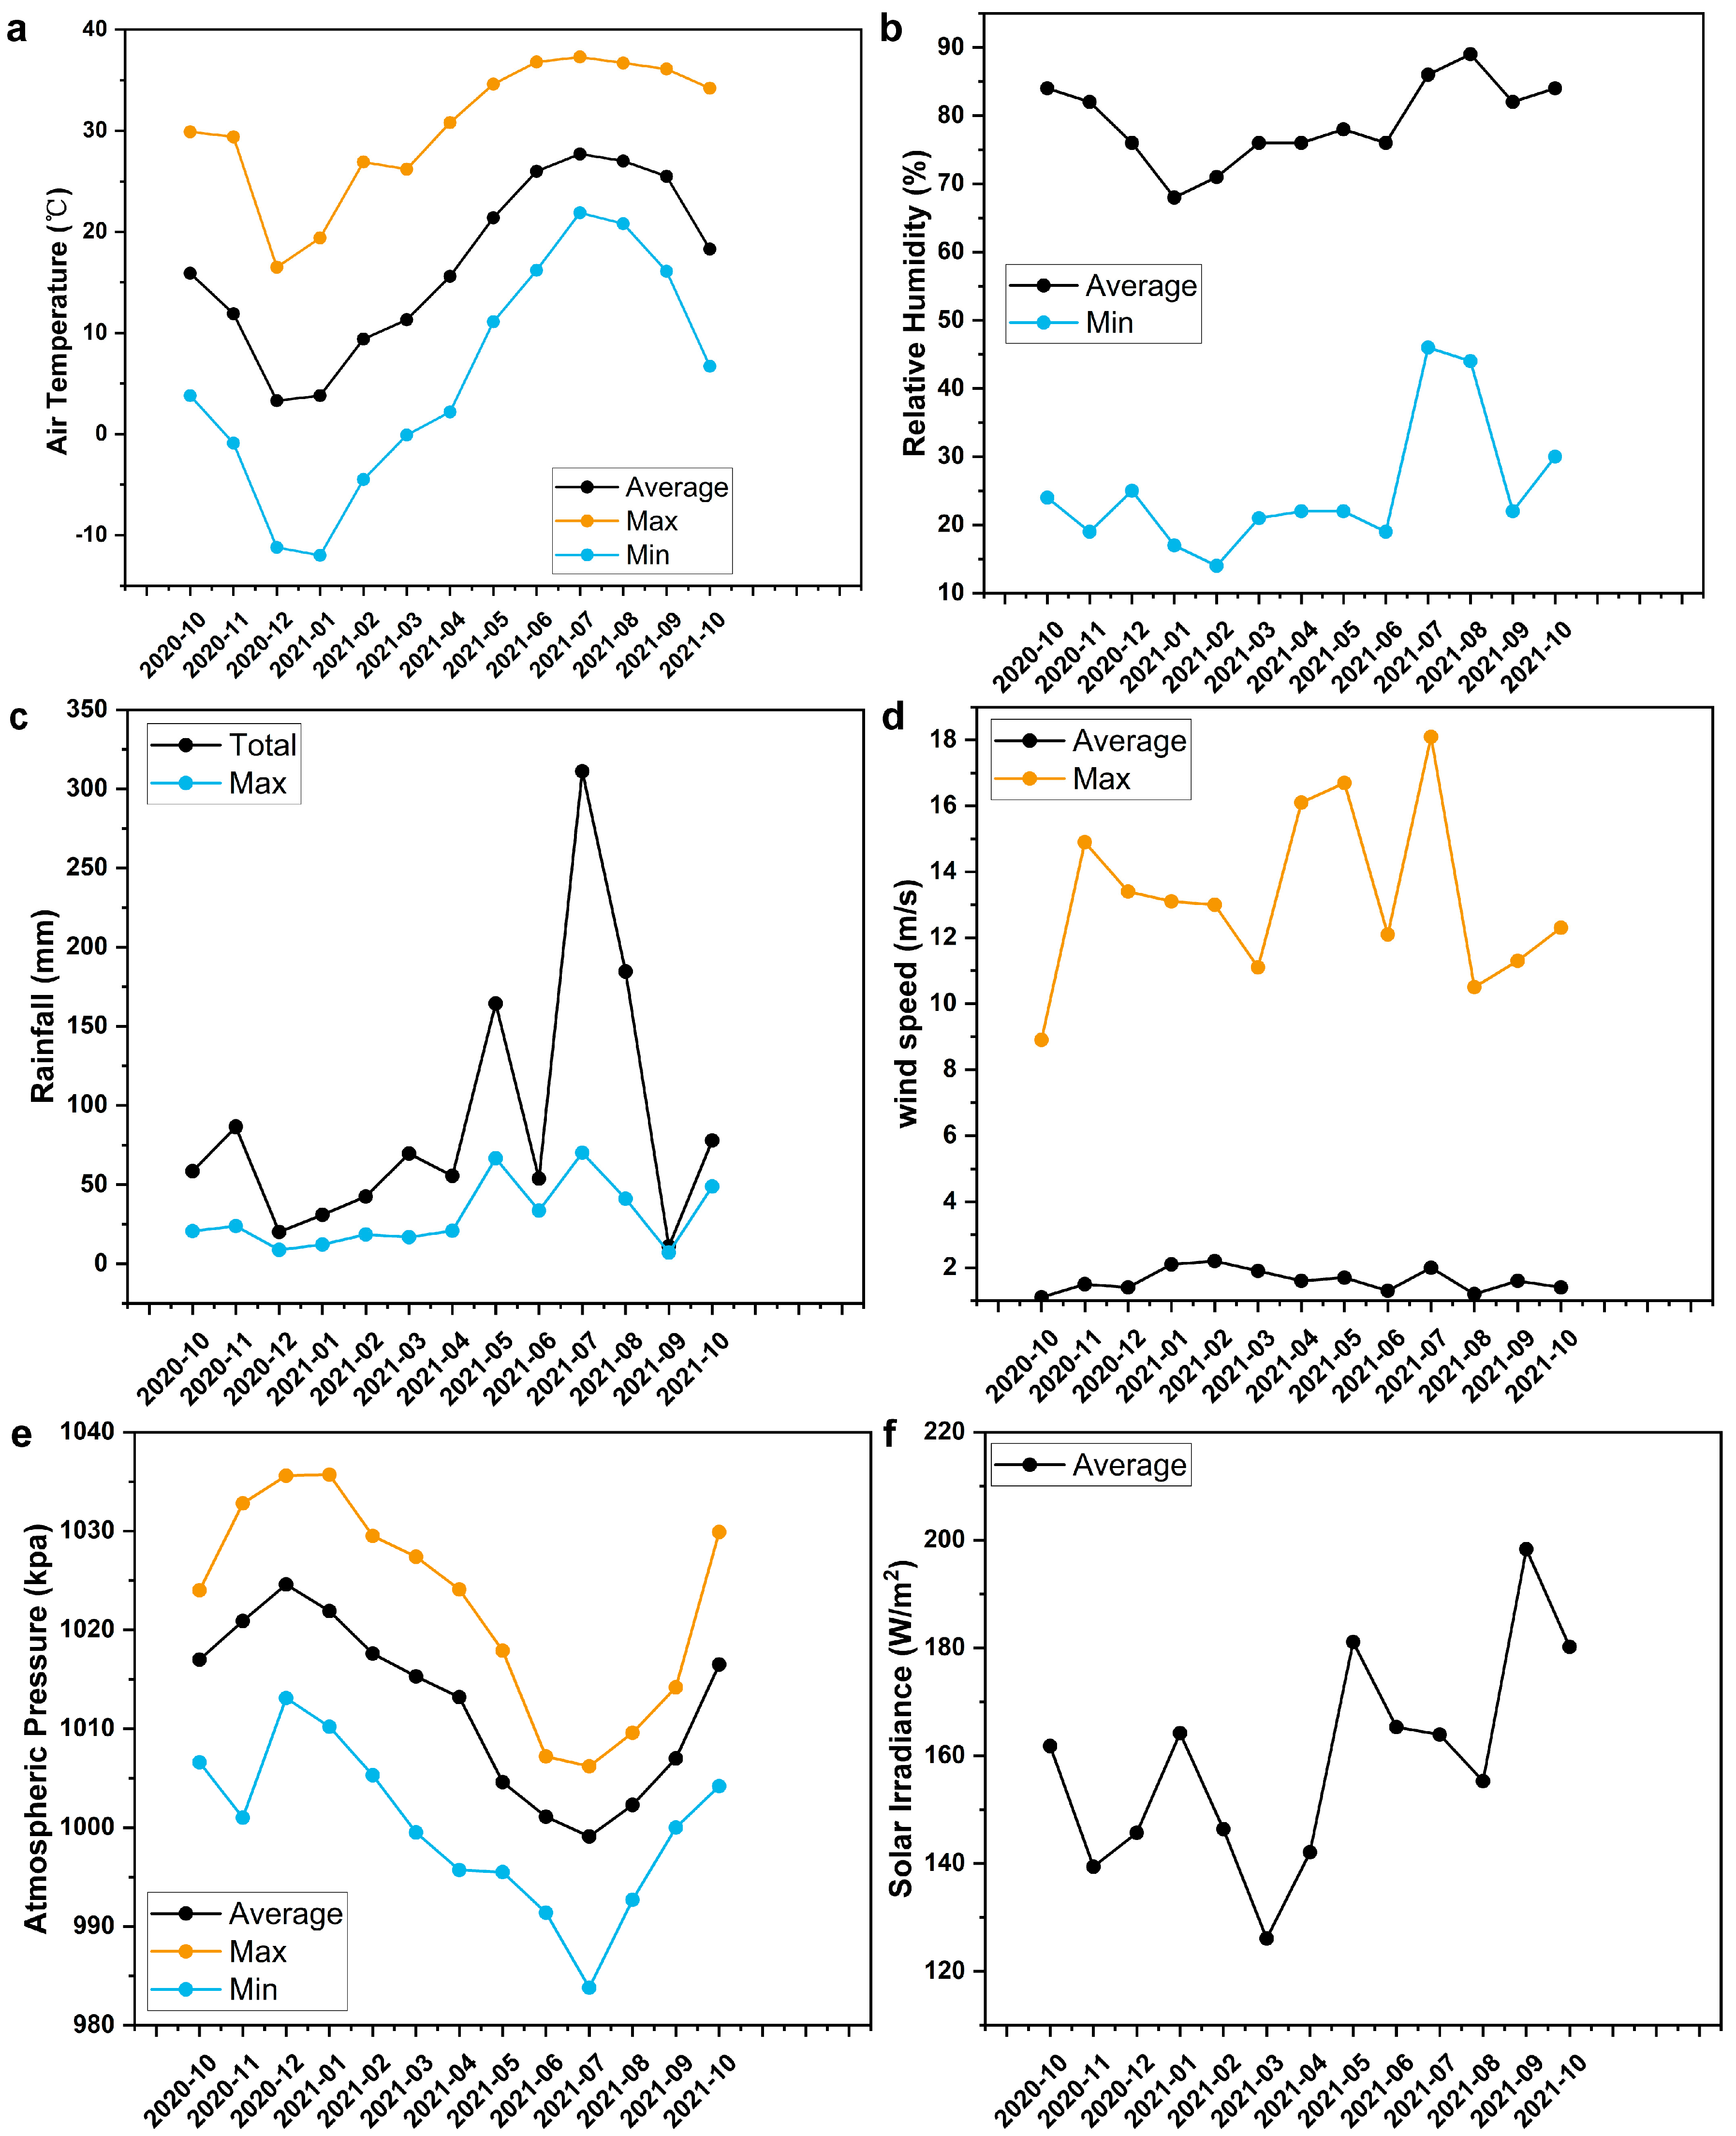
2.1. Study Site

Our study site was located at Xiashu Forest Farm, Jurong City, Jiangsu Province, China (119°22′46″ E, 32°12′57″ N), at an elevation of 100 m, which was established by Nanjing Forestry University (Figure 1). According to the Harmonized World Soil Database (HWSD) and World Reference Base for soil resources (WRB), the soil type in this area is yellow–brown soil, mainly eluvial, slightly acidic, with a high sediment content, and a depth of about 1.0 m. The soil pH is 5.22. The natural forest at the Xiashu Forest Farm was dominated by secondary forest [35].
The region has a northern subtropical monsoon climate. The average annual temperature is 15.2 °C. The lowest monthly average temperature is −0.8 °C, in January. The highest average temperature is 31.6 °C, in July. The average frost-free period is 233 days. The seasonal fluctuation of rainfall is large. The average annual precipitation is 1055.6 mm, and the average annual relative air humidity is as high as 79%. The total rainfall during the experimental period from October 2020 to October 2021 was 1167.4 mm, of which precipitation in May August accounted for more than 60% of the total precipitation (Figure A1) (Appendix A).

2.2. Experimental Design
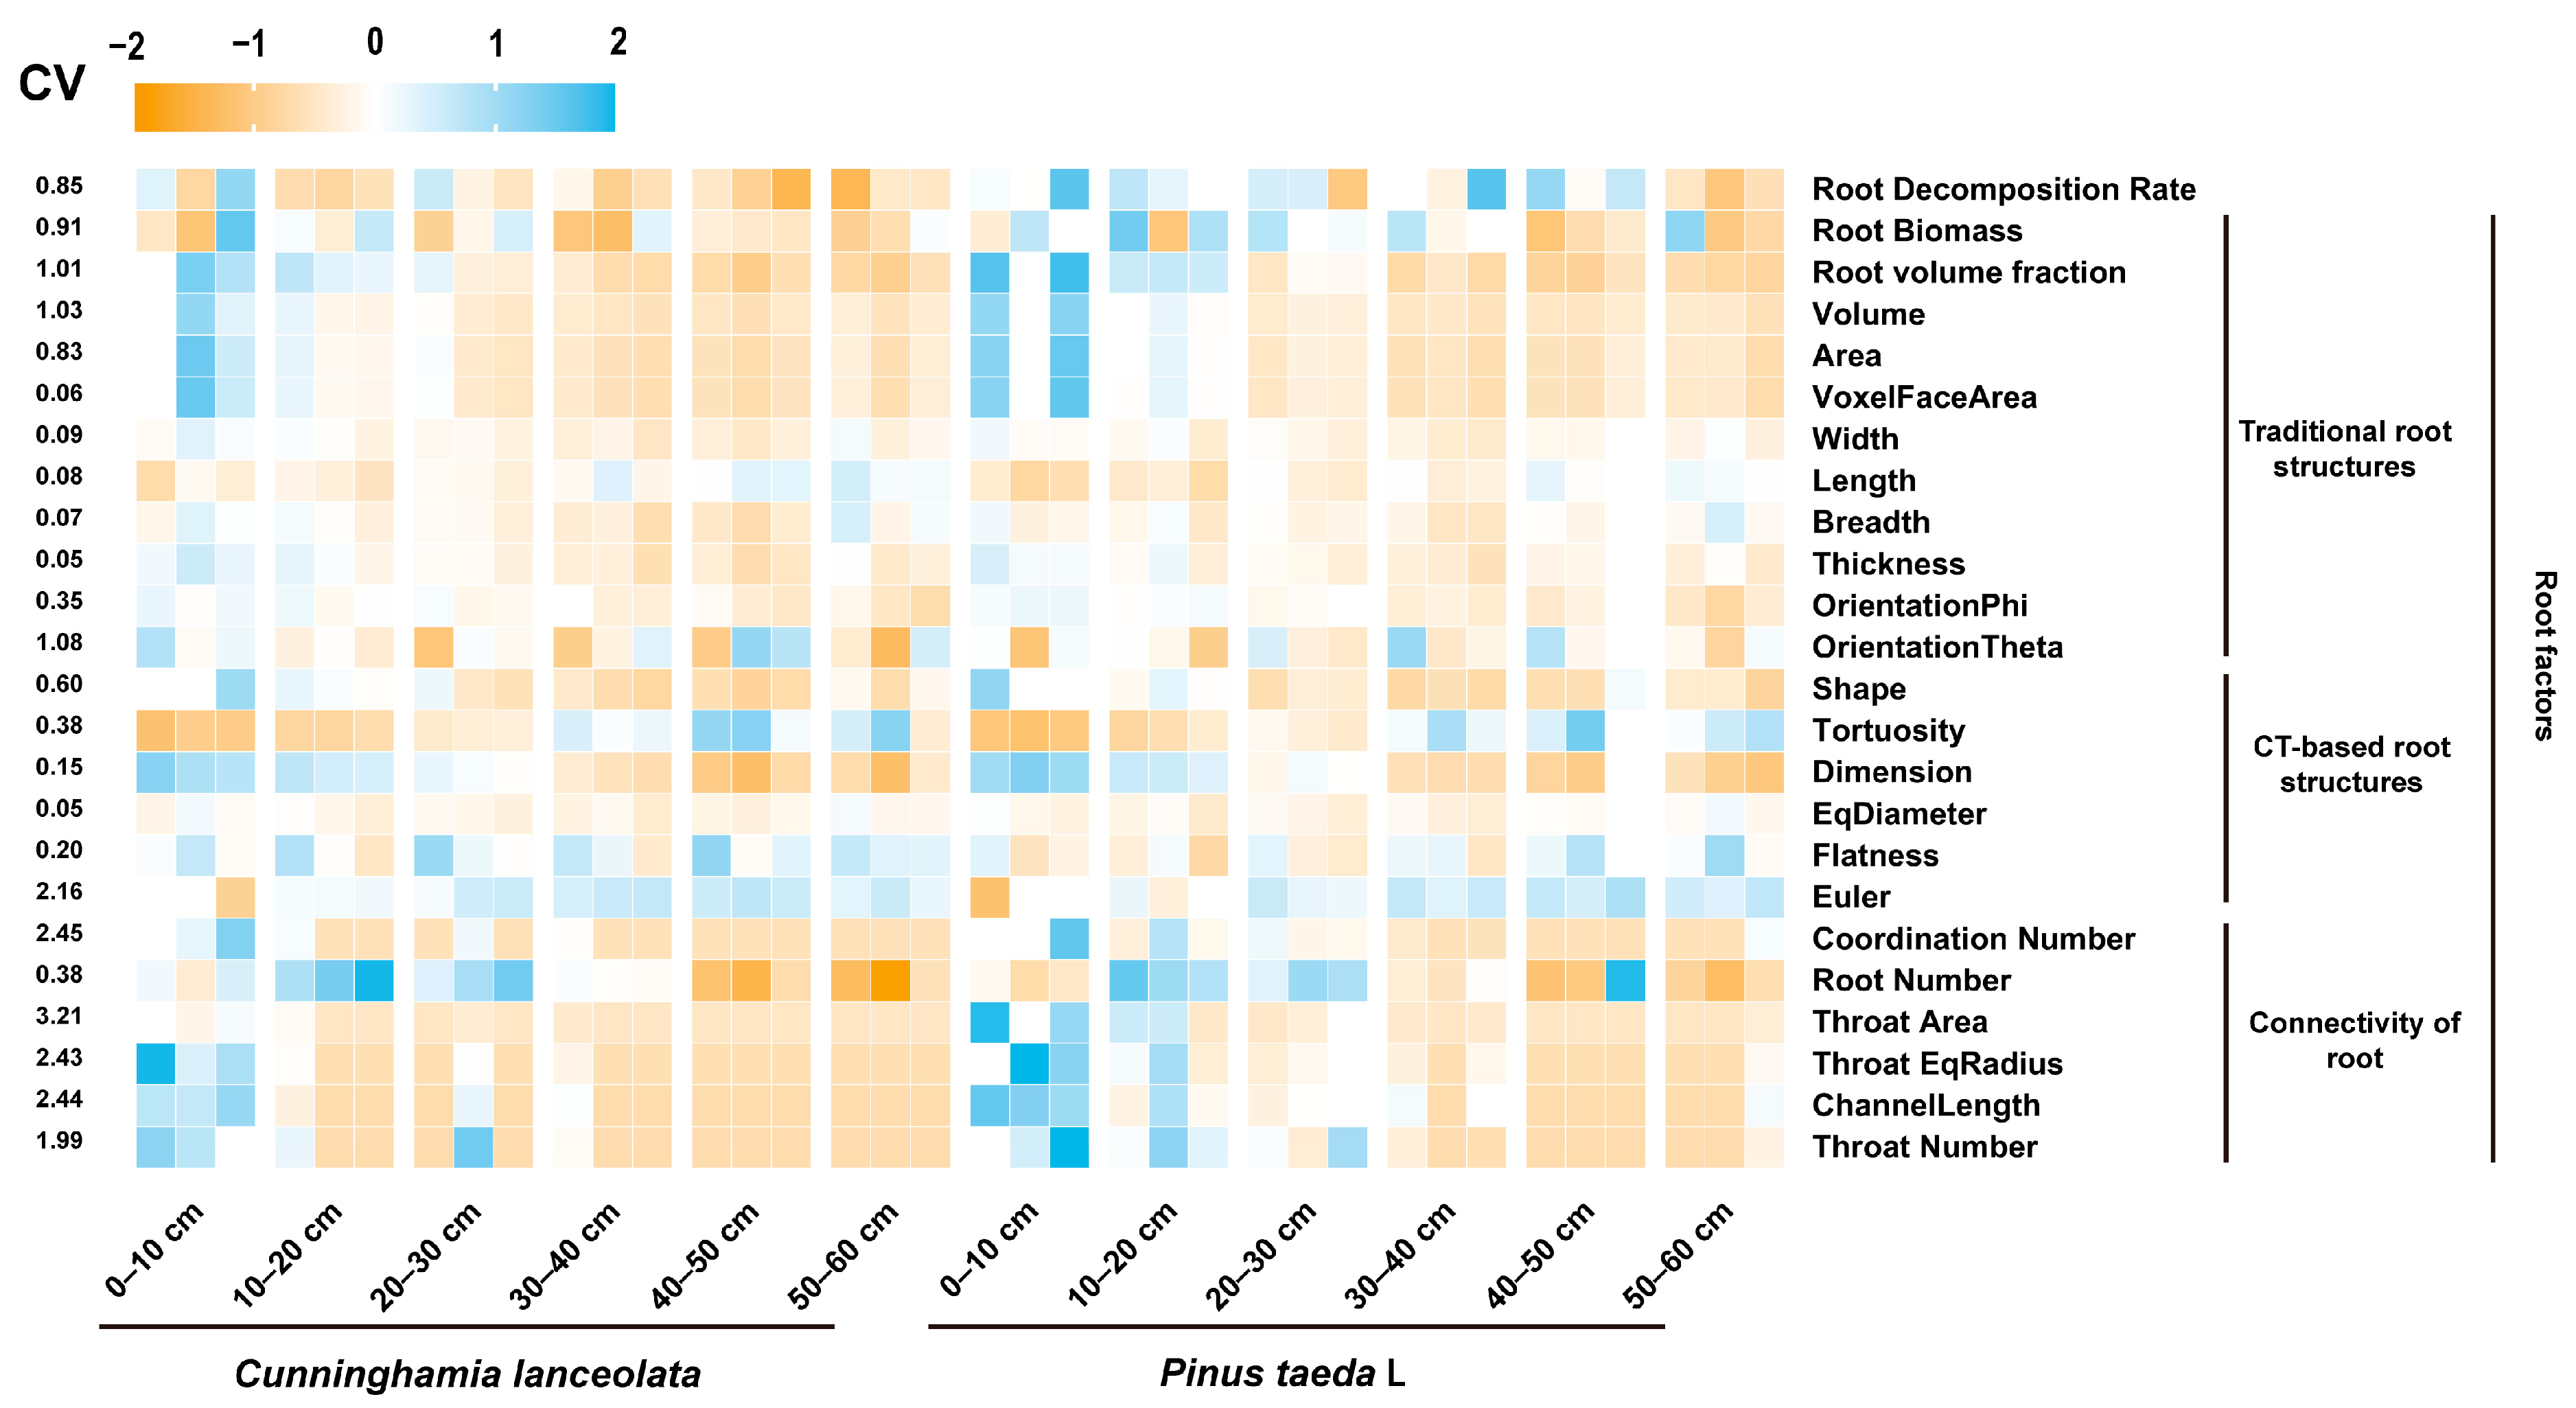
In this study, Cunninghamia lanceolata and Pinus taeda plantations in good growing condition were selected, and three plots (20 m × 20 m) were randomly set up in each plantation type (The age of the Cunninghamia lanceolata plantation was 43 years, the average tree height was 13.86 m, and the average diameter at breast height was 23.88 cm. The age of the Pinus taeda plantation was 39 years, the average tree height was 14.08 m, and the average diameter at breast height was 29.11 cm) (Table A1). In October 2020, sample strips were set up at least 1 m from the nearest tree within the selected Cunninghamia lanceolata and Pinus taeda plantations to ensure that root biomass was as uniform as possible within each soil core [36,37]. Ten sample strips were set up in each sample plot. Soil cores were taken using a special soil drill with an inner diameter of 10 cm and a length of 60 cm, which we designed and made. The drill was made of stainless steel and was driven to a predetermined depth using an impact pick. The drill was then removed with the core intact using a High Lift Jack. Four soil cores were drilled in each sample strip, resulting in 40 soil cores from each sample plot. We carefully placed the soil core from the drill in a 74 μm nylon bag and returned it to the soil from which the core was extracted. On days 0, 120, 240, and 360 after the completion of sampling, 30 soil cores were randomly removed from each sample plot. The roots in the soil core were cleaned, dried, and weighed to calculate the root decomposition rate.
At each sampling session, the in situ soil cores that were incubated were removed along with the nylon mesh bags. The removed soil cores were protected with a 10 cm diameter and 60 cm height polyvinyl chloride (PVC) pipe, which was sealed with plastic wrap and protected from shocks. On days 0 after the completion of sampling, the cores were scanned using CT equipment within 12 h after sampling and were then cut into 6 sections (0–10 cm, 10–20 cm, 20–30 cm, 30–40 cm, 40–50 cm, and 50–60 cm) at 10 cm intervals. Detailed measurements of RSA at each soil depth were then made using Avizo. On days 120, 240, and 360 after the completion of sampling, the soil cores were cut directly after sampling, and the roots were removed to calculate the root decomposition rate.

2.3. RSA

The intact soil cores were scanned using a United Imaging uCT510 medical scanner (United Imaging Intelligence, Shanghai, China). Scanning was done at 1 mm intervals using 120 kV and 335 mA current. The scanned images were reconstructed using Avizo 2019.1 (Thermo Fisher Scientific Avizo, Waltham, MA, USA), and the oblique CT image correction was performed using VG Studio Max 2022.1 (Volume Graphics GmbH, Heidelberg, Germany). The images were thresholded for segmentation using Avizo’s intensity histogram, and the roots were reconstructed and then analyzed using Avizo’s computational module [38].
The traditional RSA (RSA variables that can be obtained by traditional means) and the CT-based RSA (RSA variables that cannot be obtained by traditional means or are difficult to obtain but can be easily obtained by CT) were calculated directly by the Avizo computing module (Table A2). The connectivity of roots was calculated by fitting roots to spheres and throats between roots to synthetic sticks.

2.4. Root Decomposition Rate

In this study, the constant K in the classical decomposition dynamics describing the exponential loss of mass over time [39], that is, the mass loss ratio per unit time, was taken as the root decomposition rate. The specific calculation method is as follows:
For each soil depth for each removed soil core, the roots were removed, cleaned, and dried at 65 °C to a constant weight. We calculated the roots’ mass loss rate (k) by applying the first-order exponential decay model [40]:
Xt/Xt−1 = e−kΔt
where Xt(g) is the root mass obtained by sampling, Xt−1(g) is the root mass obtained on the previous sampling date, and Δt is the time (in years) that elapsed between the collection of the two samples (Table 1).

2.5. Statistical Analysis

All statistical analyses were performed using SPSS 26.0 (SPSS Inc., Chicago, IL, USA). To facilitate comparison among different variables, we standardized all variables using the z-score (Figure A2). We used the average approach [41] to divide 24 variables into three indicators. To detect differences in the root decomposition rate, root biomass, and RSA between different soil depths and different stand types, we first analyzed the interaction between soil depth and tree species using two-way analysis of variance. With one exception, we detected a significant interaction between the soil depth and stand type. Therefore, we conducted and reported one-way ANOVAs for stand type separately for each soil depth and for soil depth for each stand type. If the ANOVA results were significant (p < 0.05), the least significant difference (LSD) test was used to determine significant differences between soil depths and tree species (p < 0.05). We used Pearson’s correlation coefficient to quantify the strength and significance of the relationship between RSA, soil depth, tree species, and the root decomposition rate coefficient. Structural equation modeling (SEM) analysis (Amos, 24.0, Chicago, IL, USA) was used to estimate the direct and indirect effects of RSA on the root decomposition rates. Several metrics (χ2, p-value, GFI, and RMSEM) were used to test the goodness-of-fit of the model: p-value > 0.05, GFI > 0.9, and RMSEM < 0.08. Augmented regression tree (BRT) analysis (R 4.2.1) was conducted to estimate the contribution of tree species, soil depth, and RSA to the root decomposition rate [42]. Graphs were plotted using Origin (Origin, version 2021, Northampton, MA, USA) and GraphPad Prism 9 (GraphPad Software, Inc., La Jolla, CA, USA).

3. Results

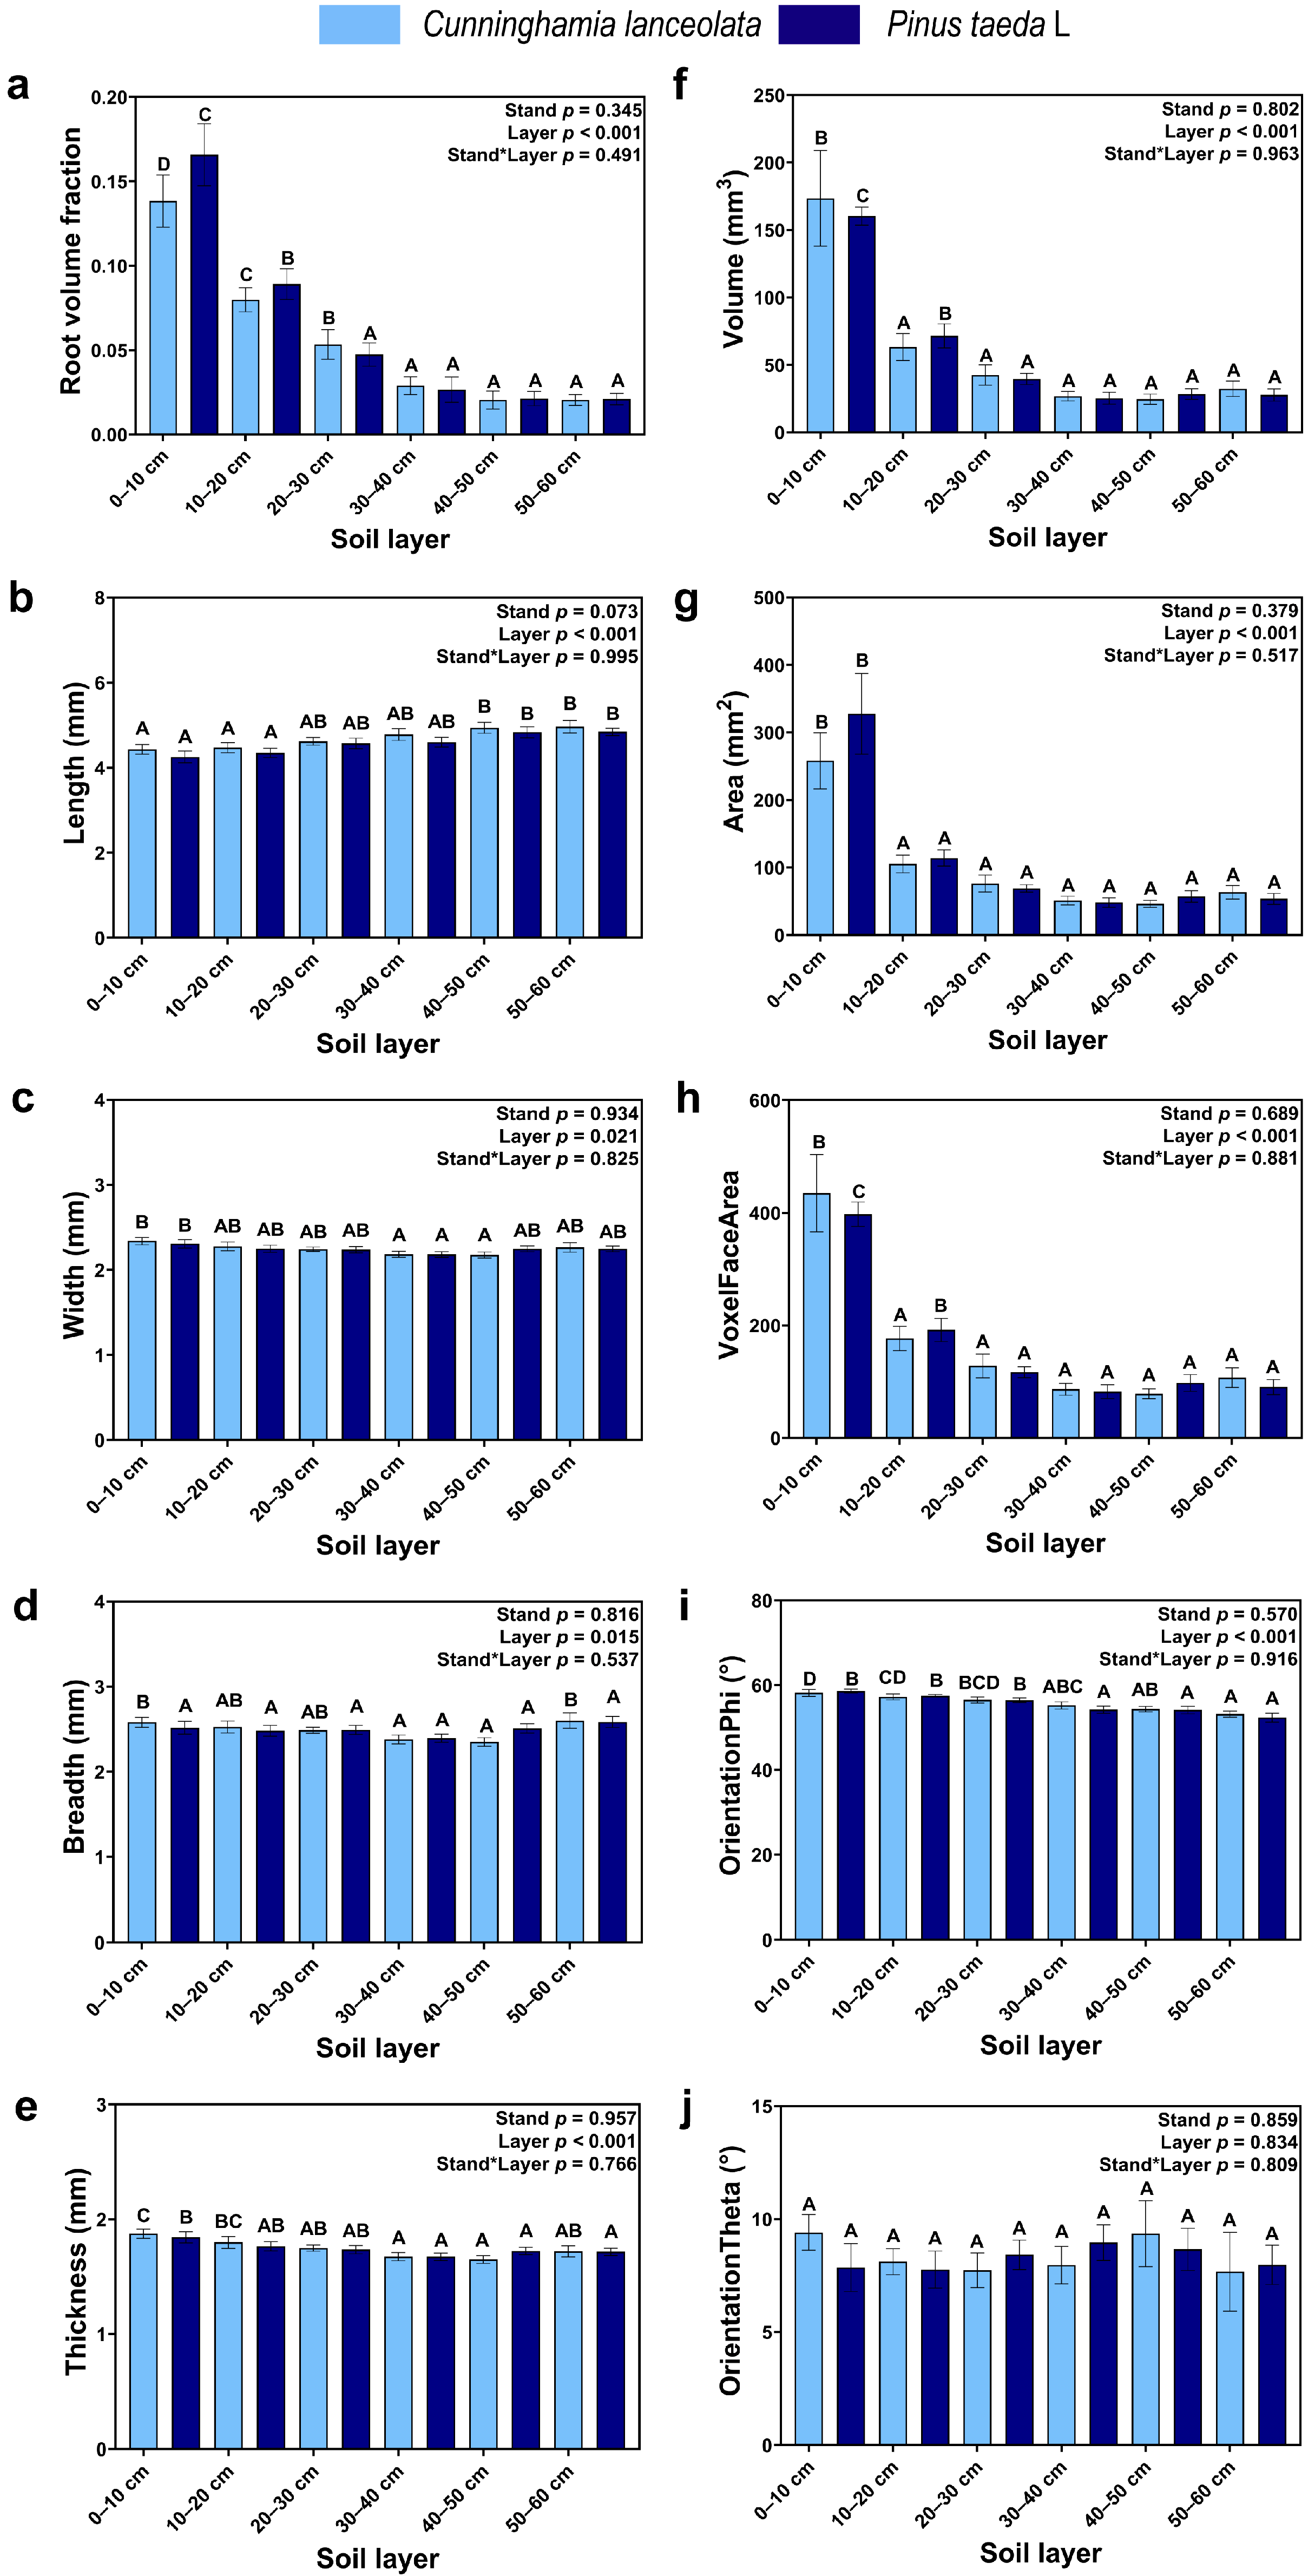
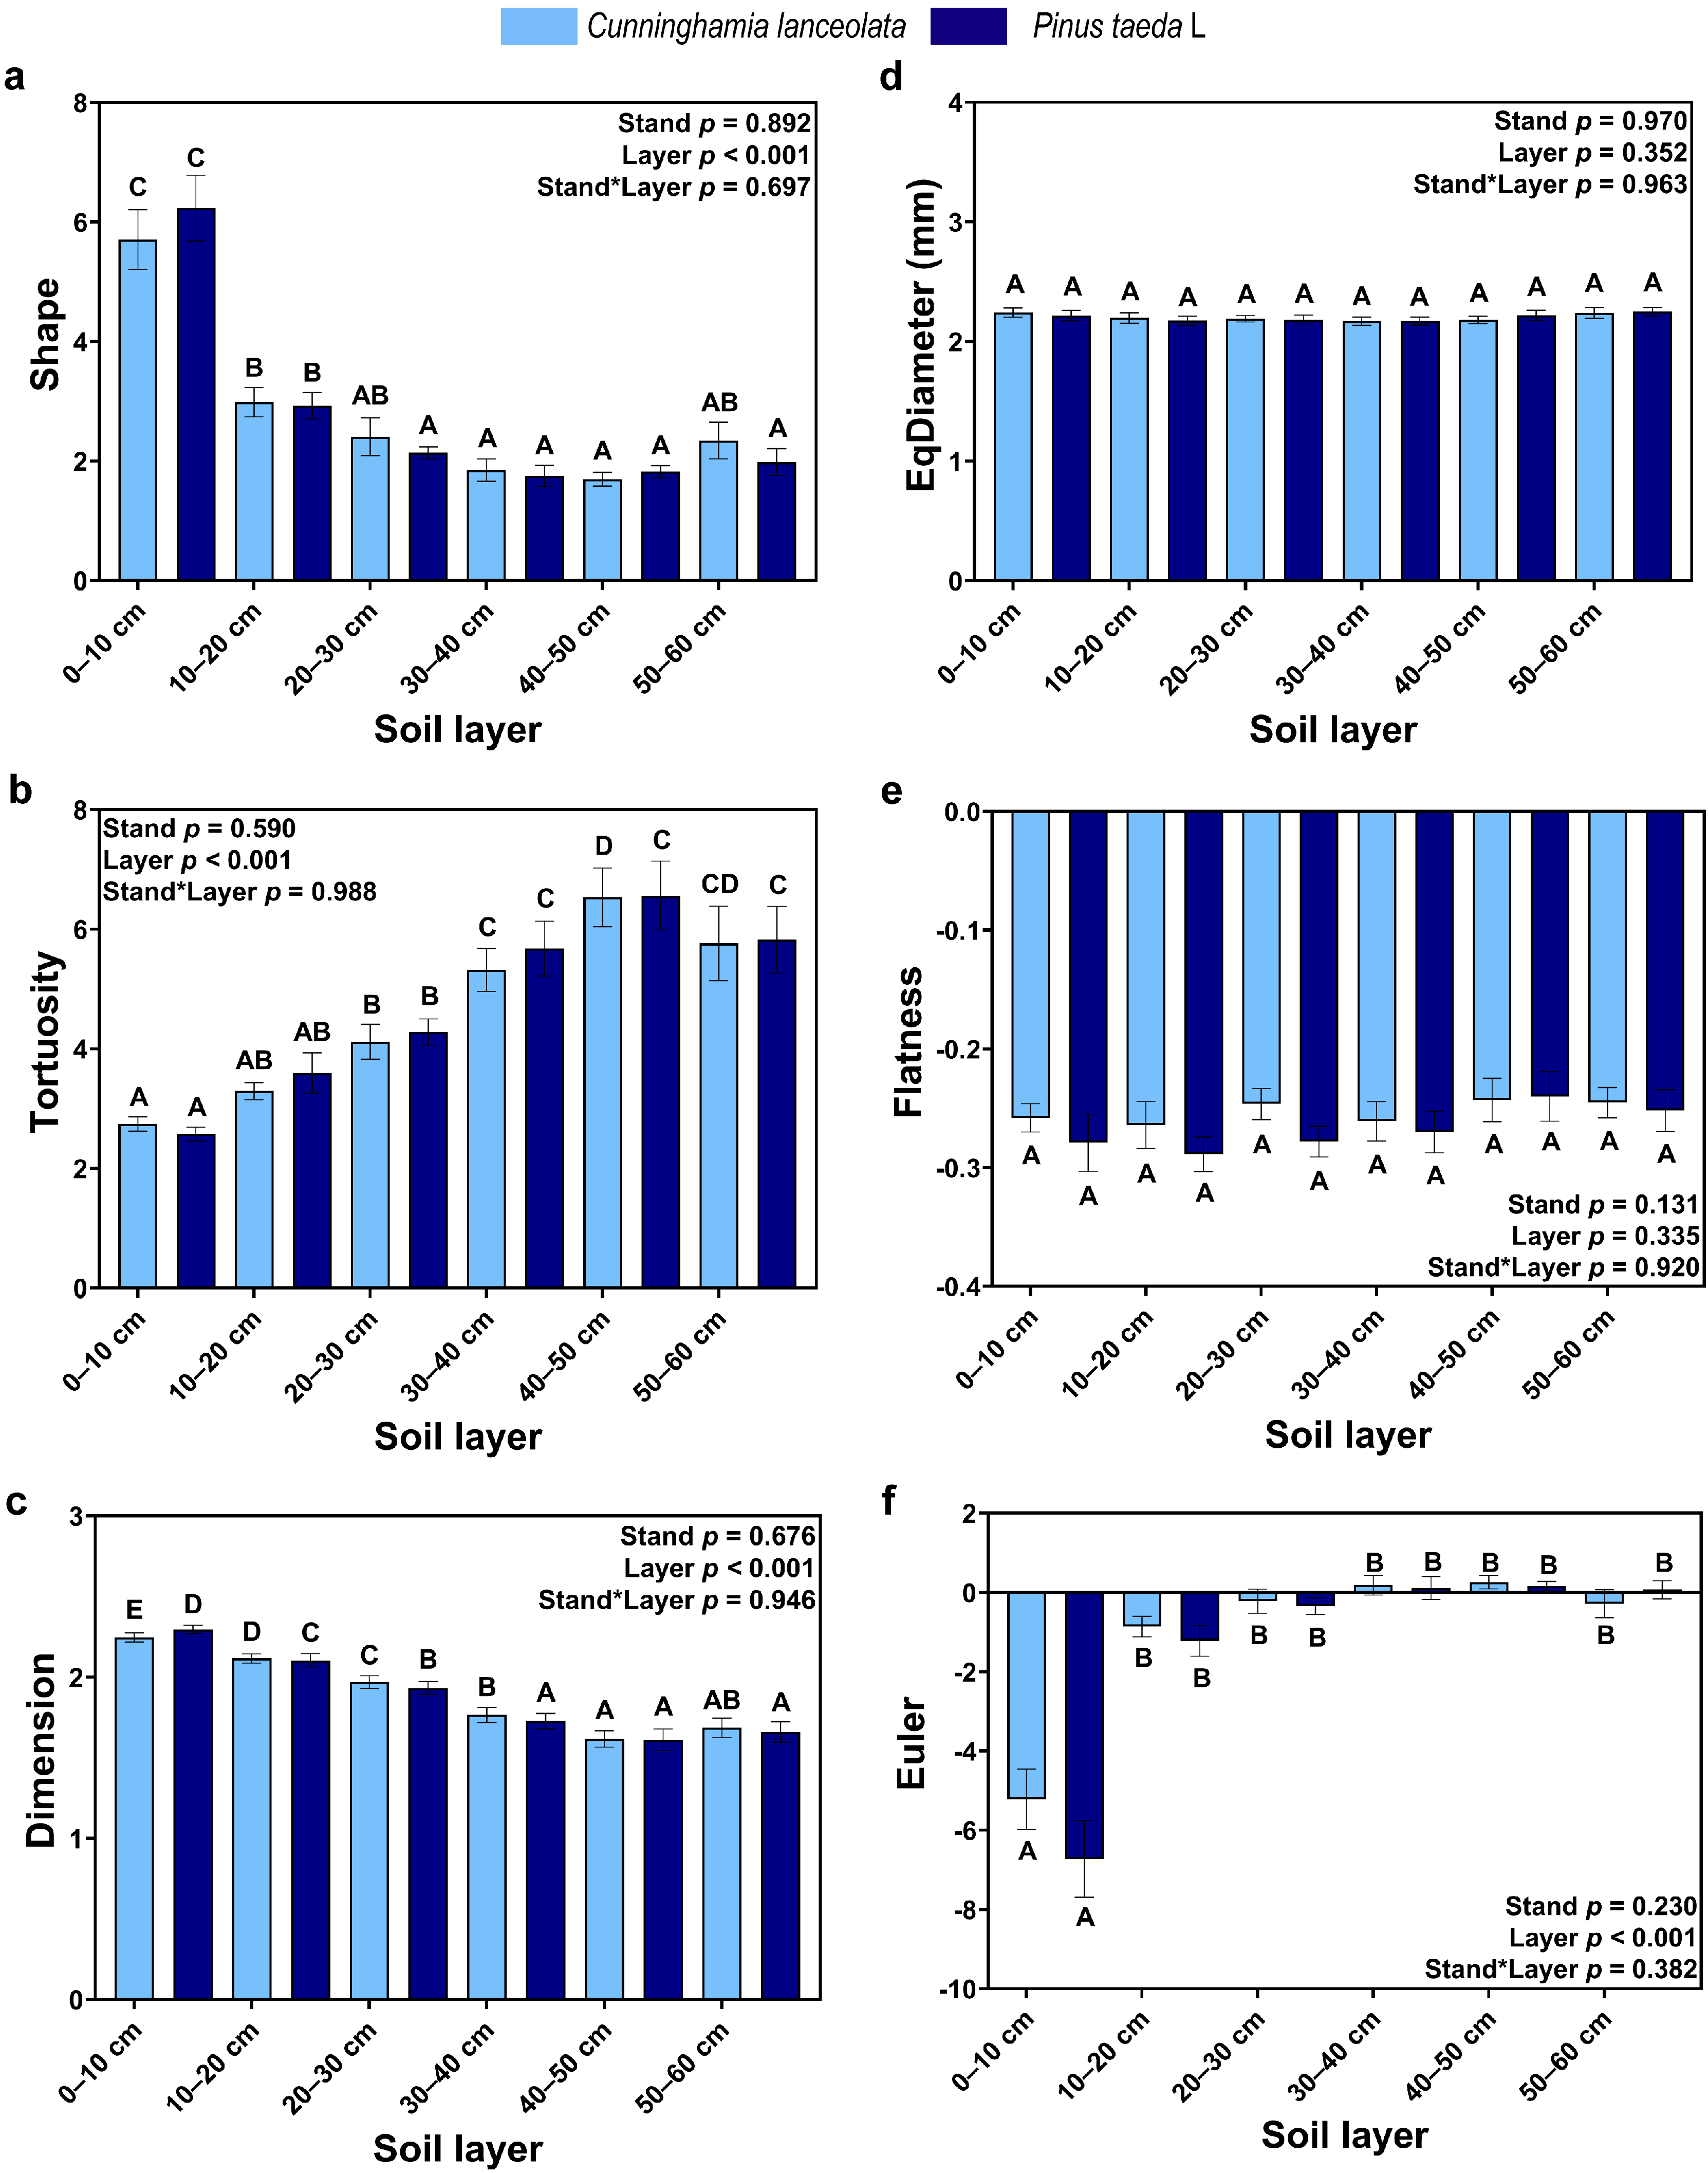
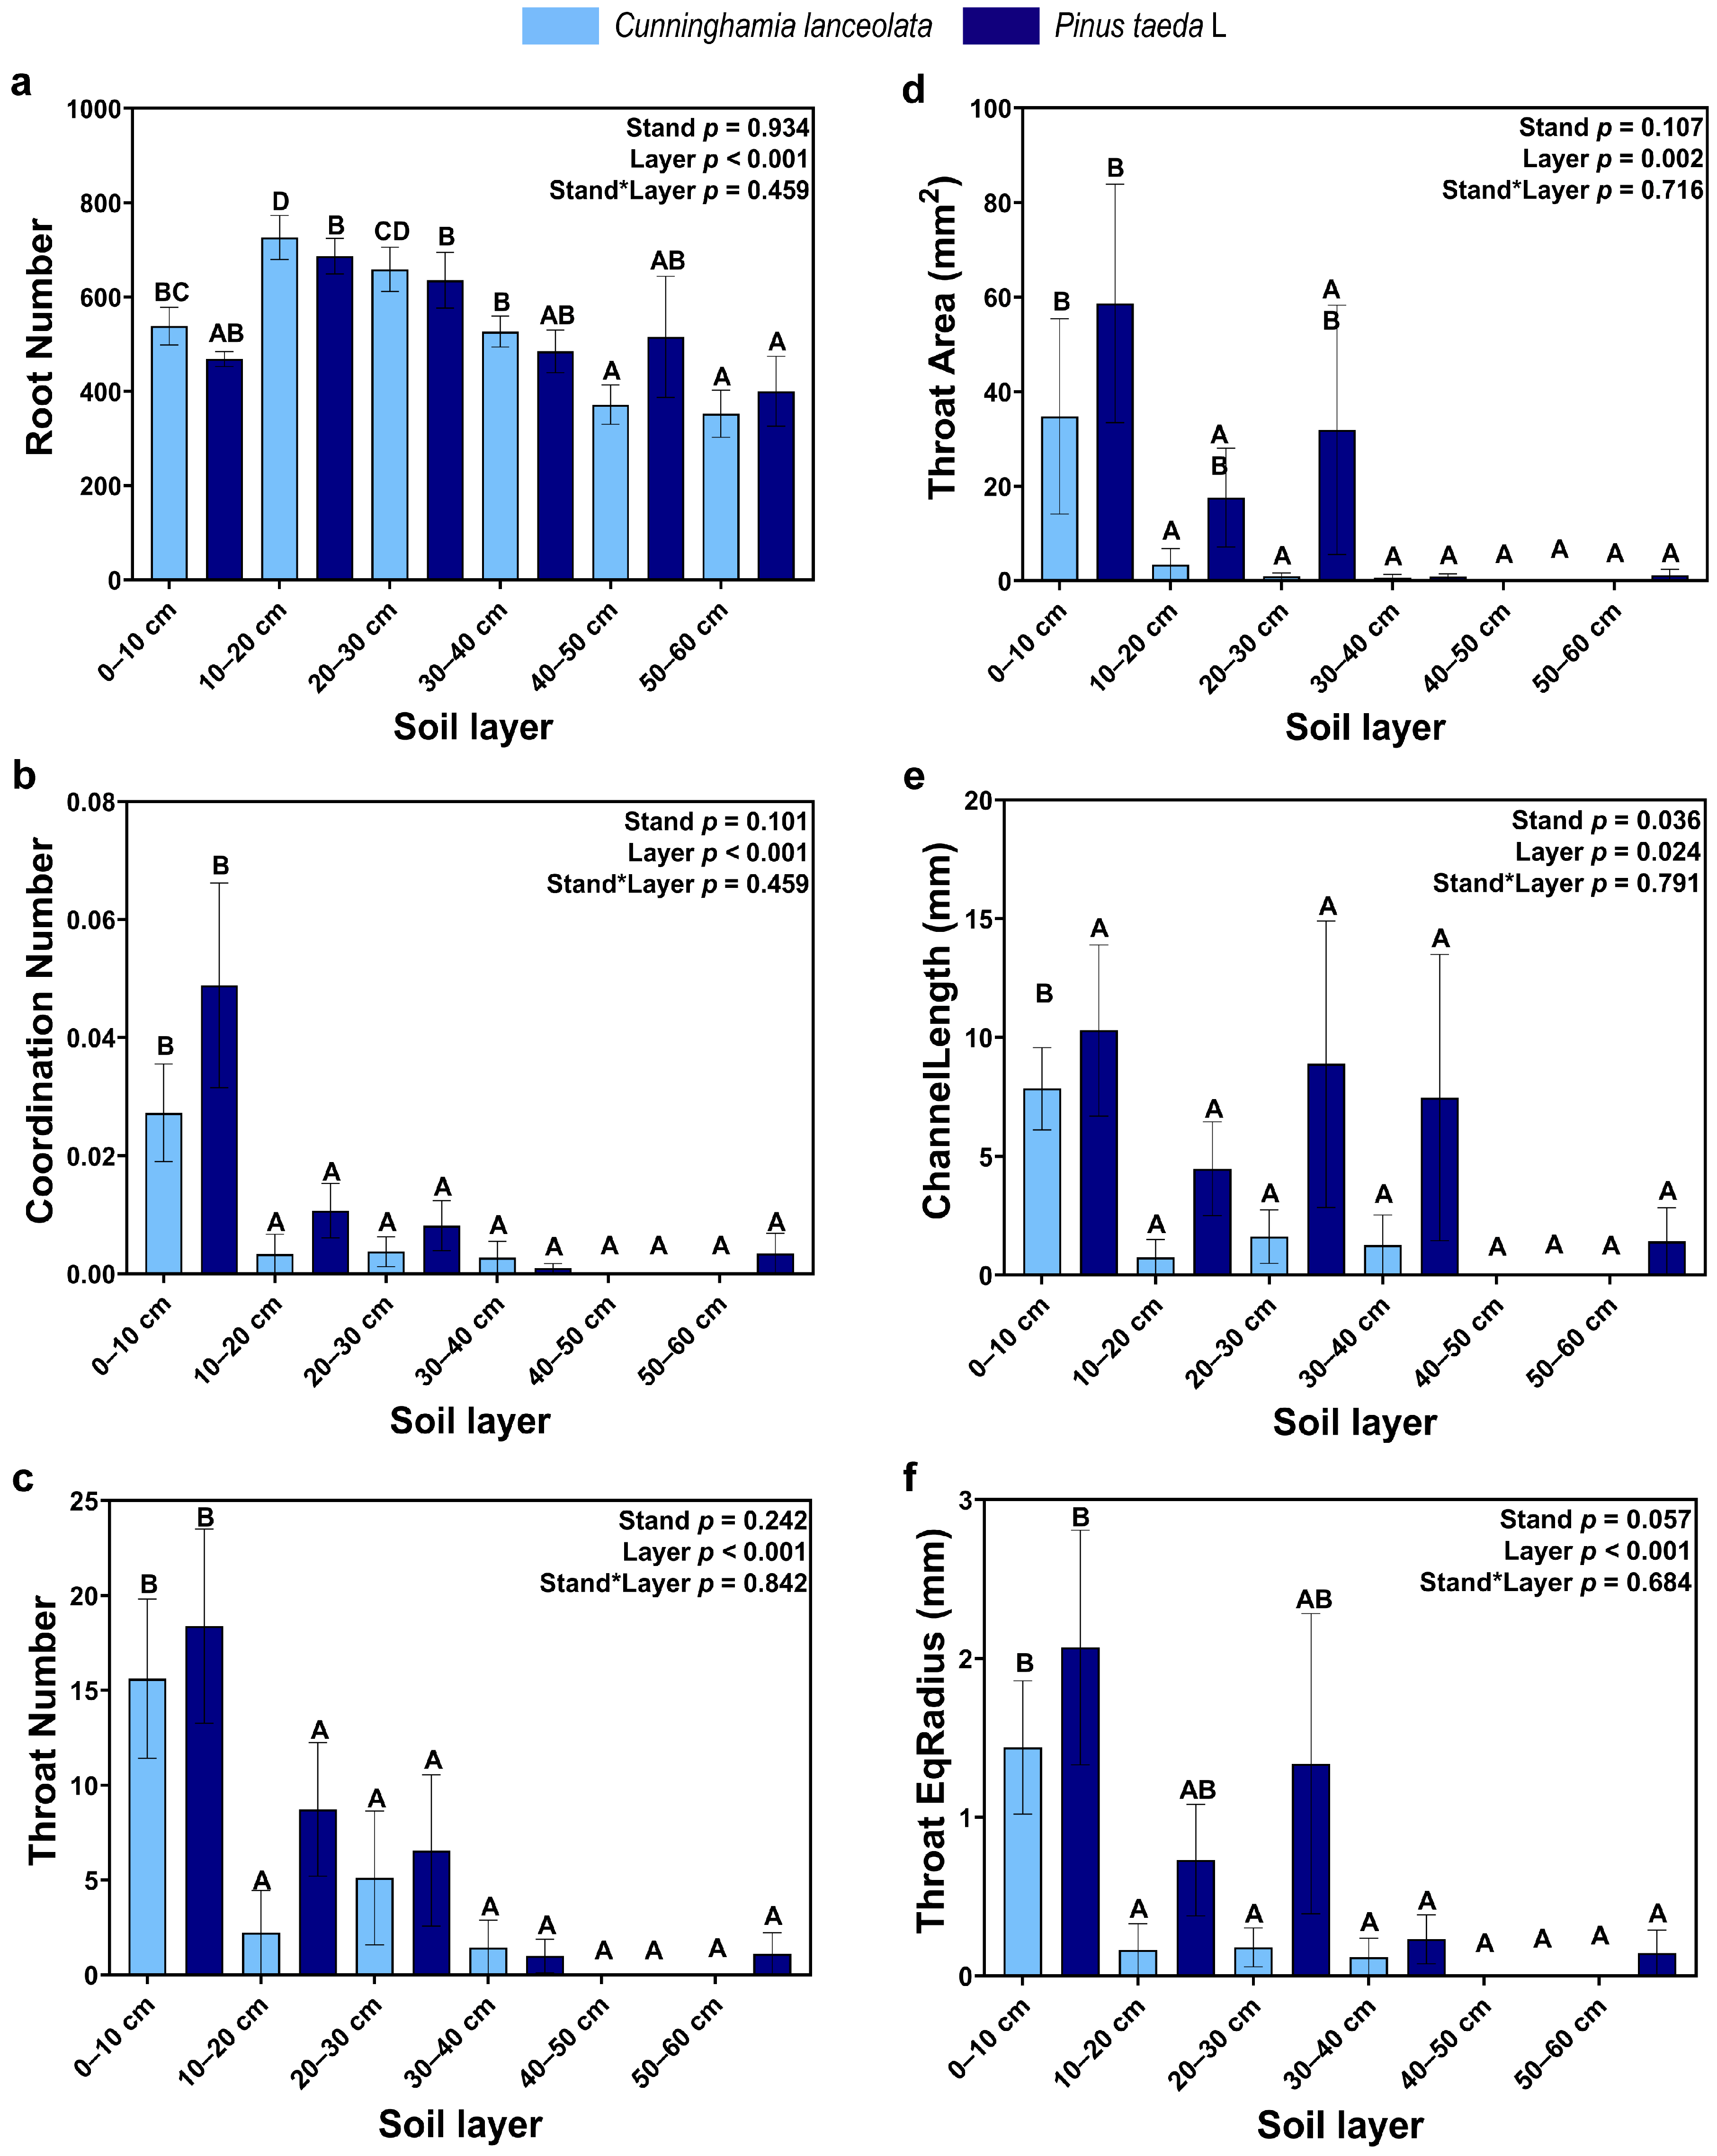
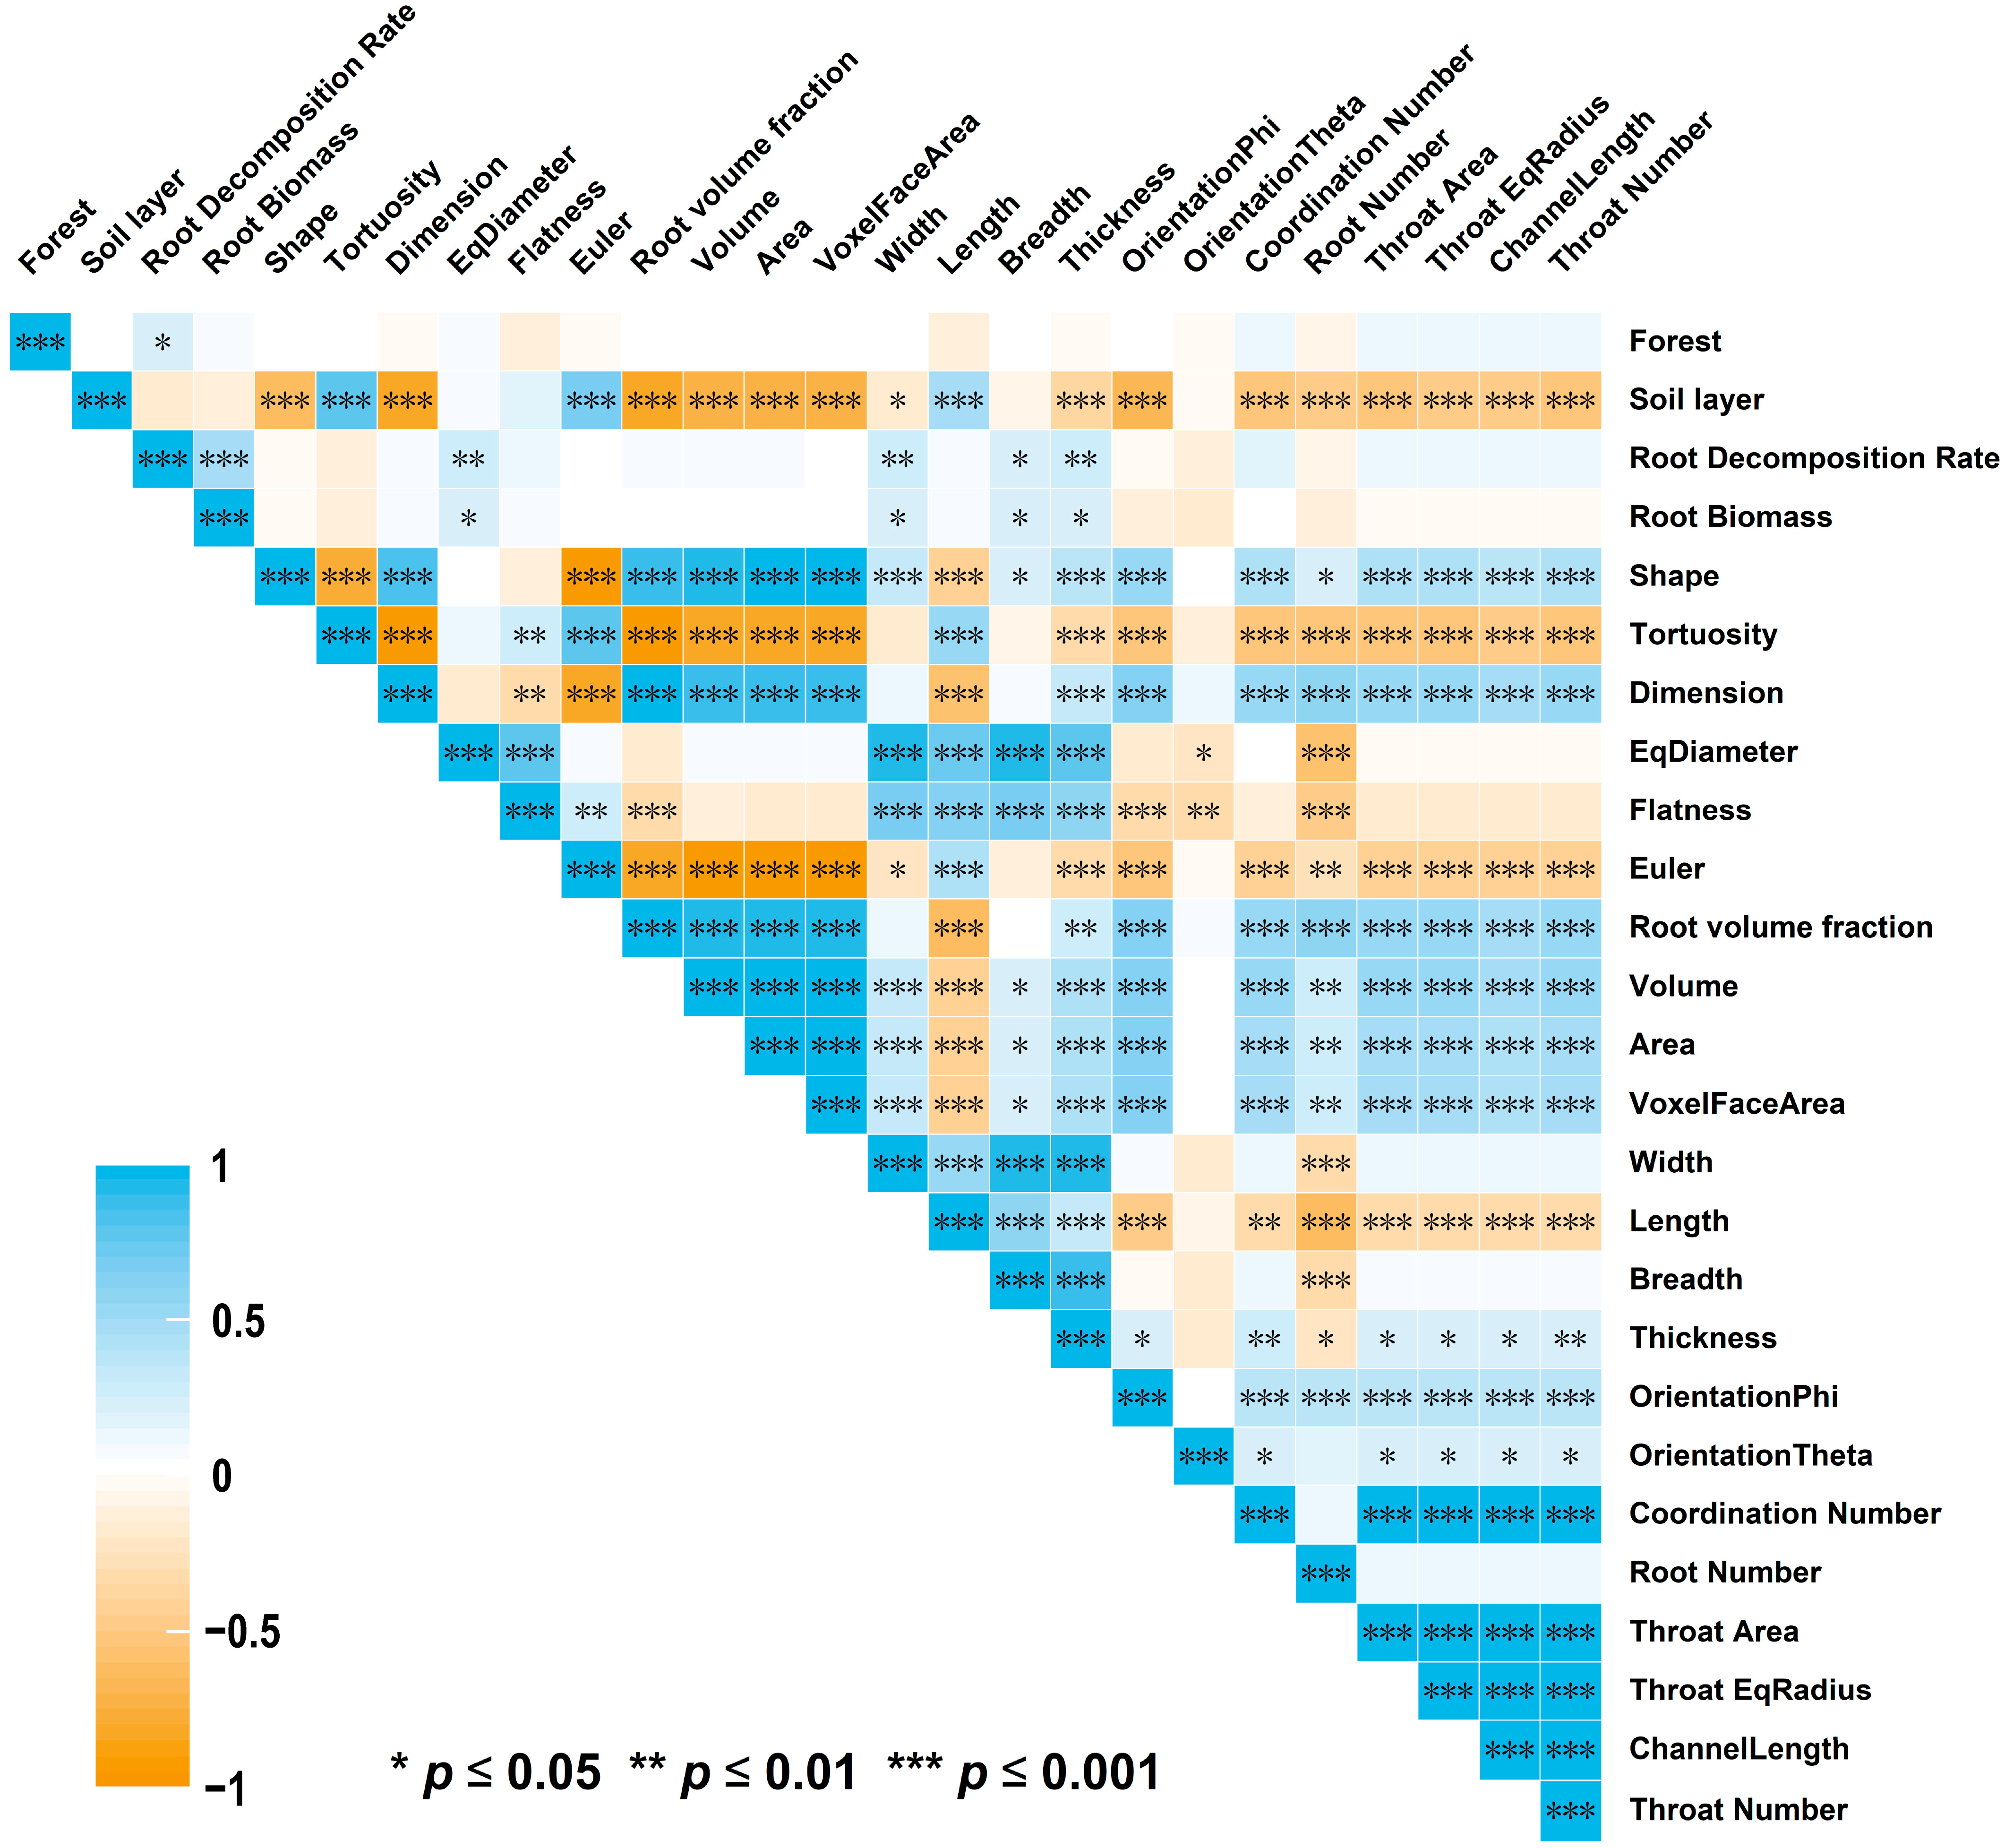
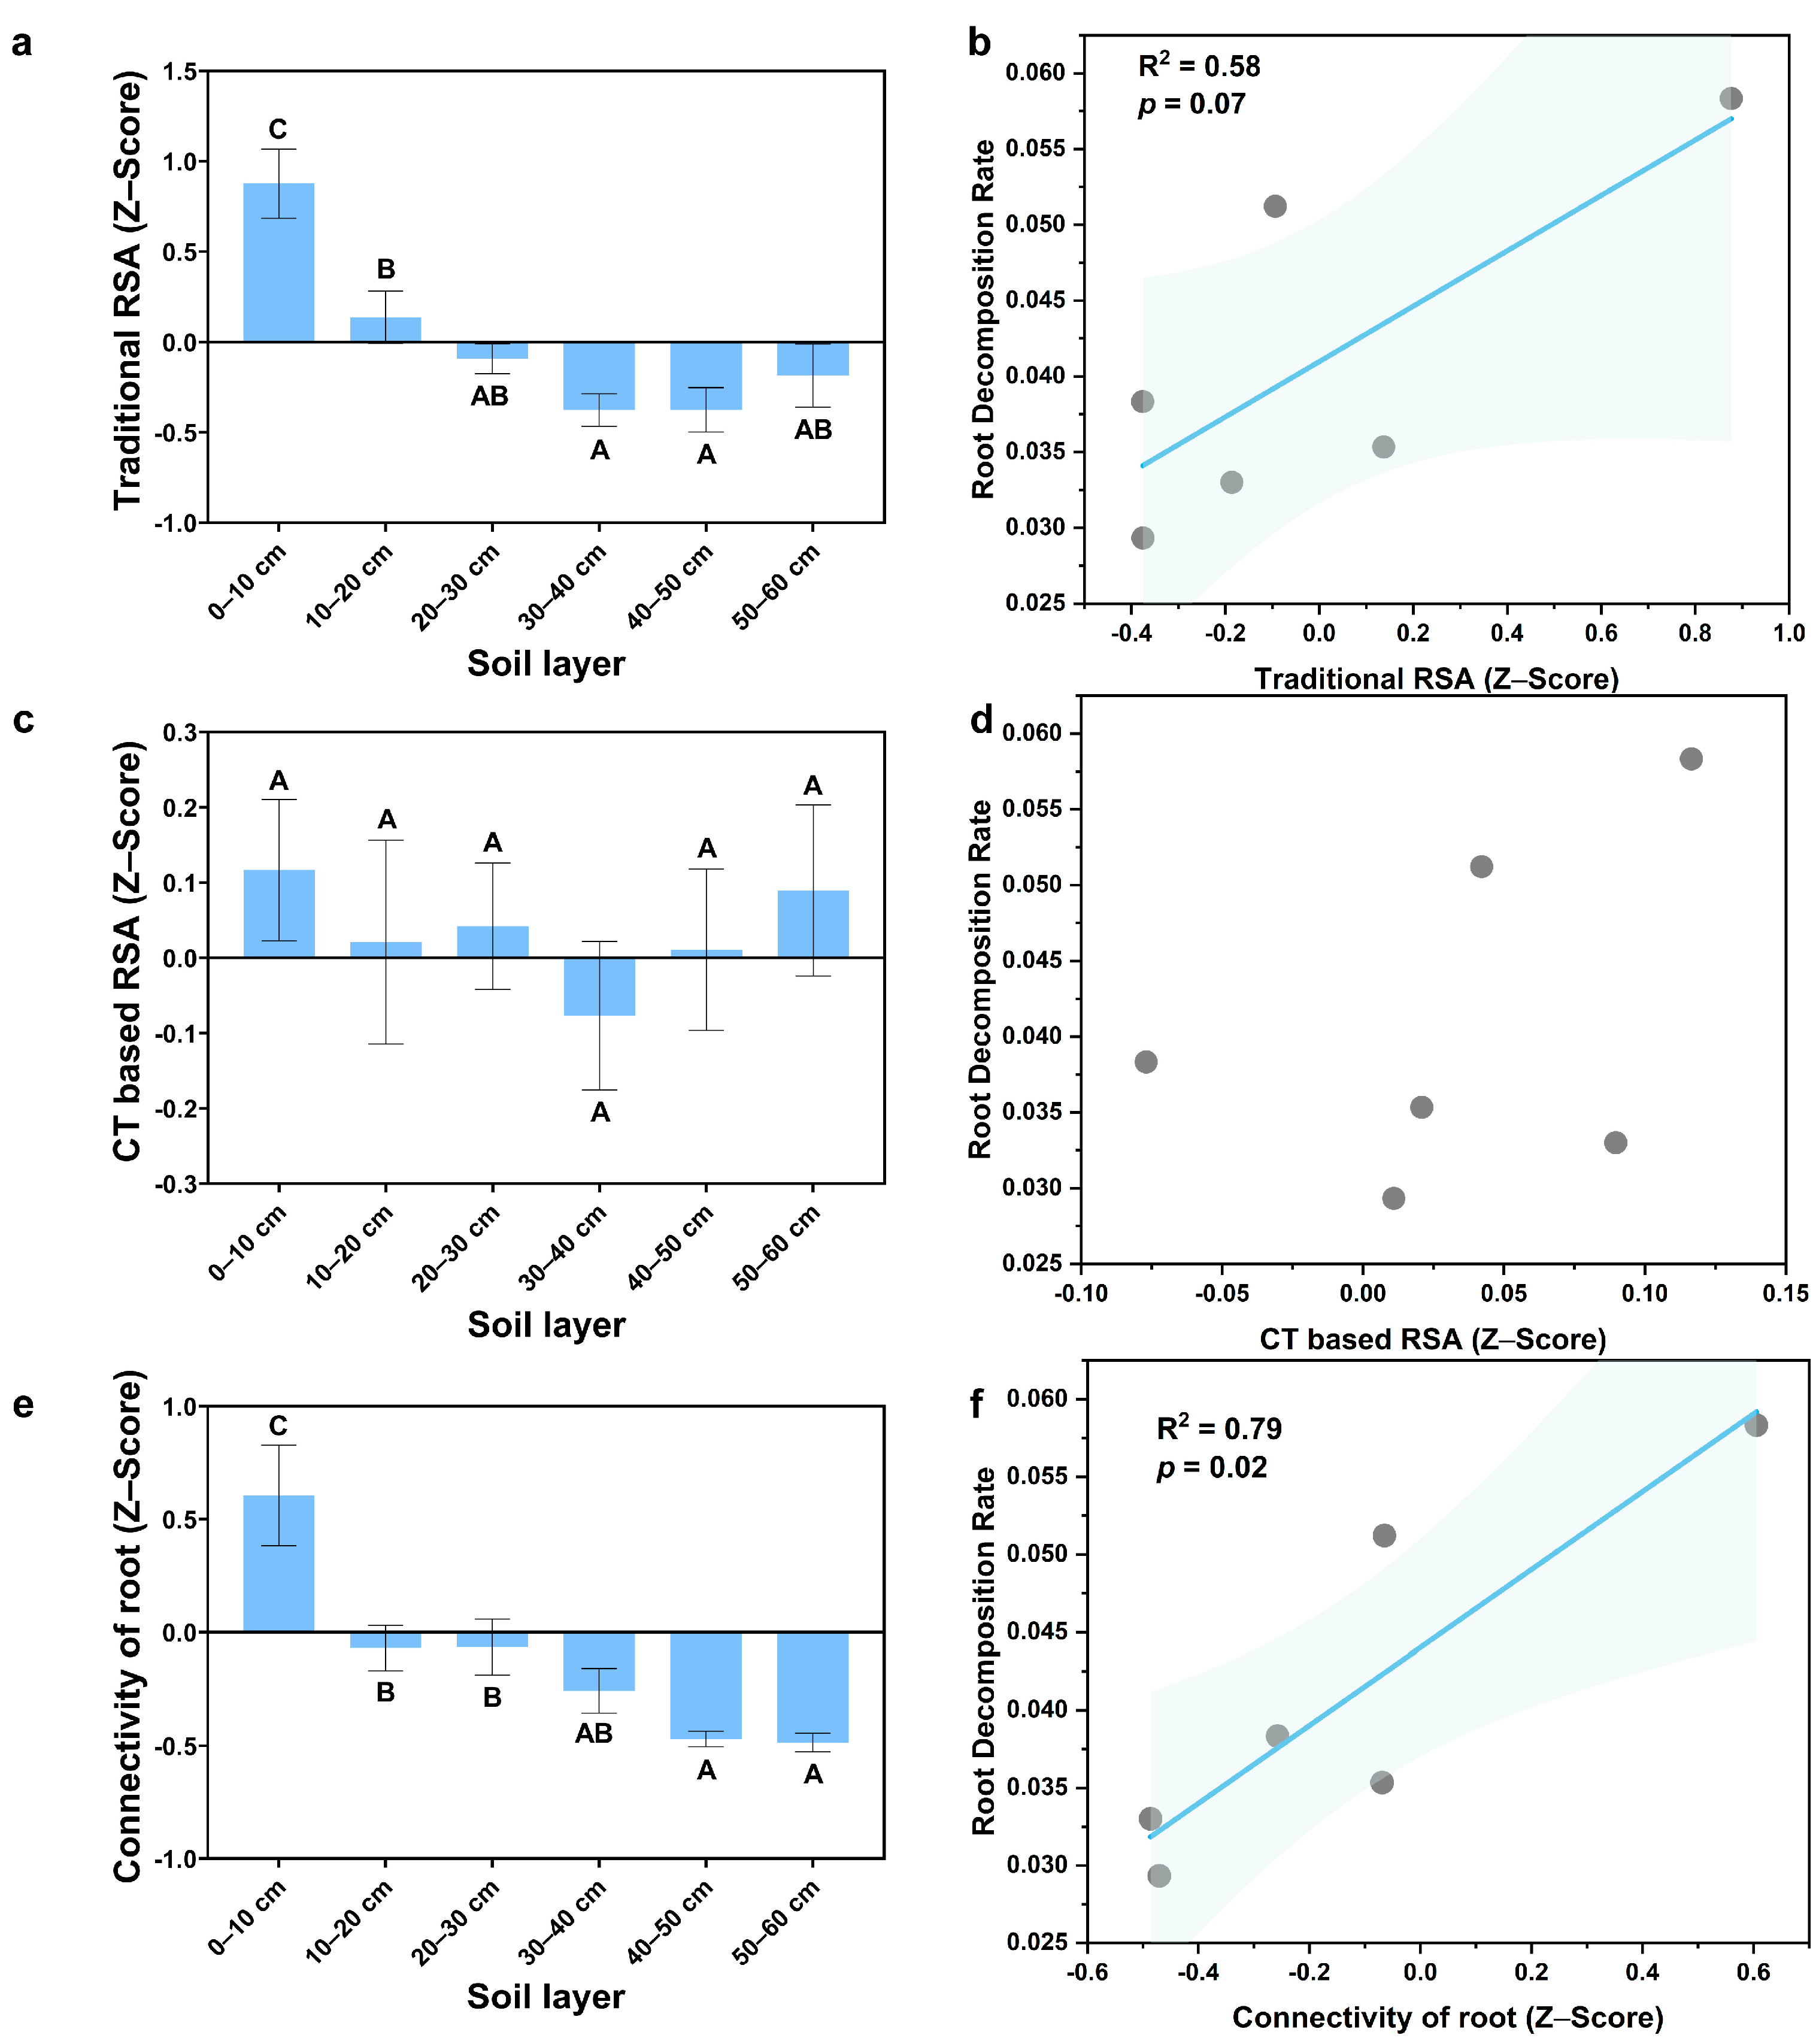
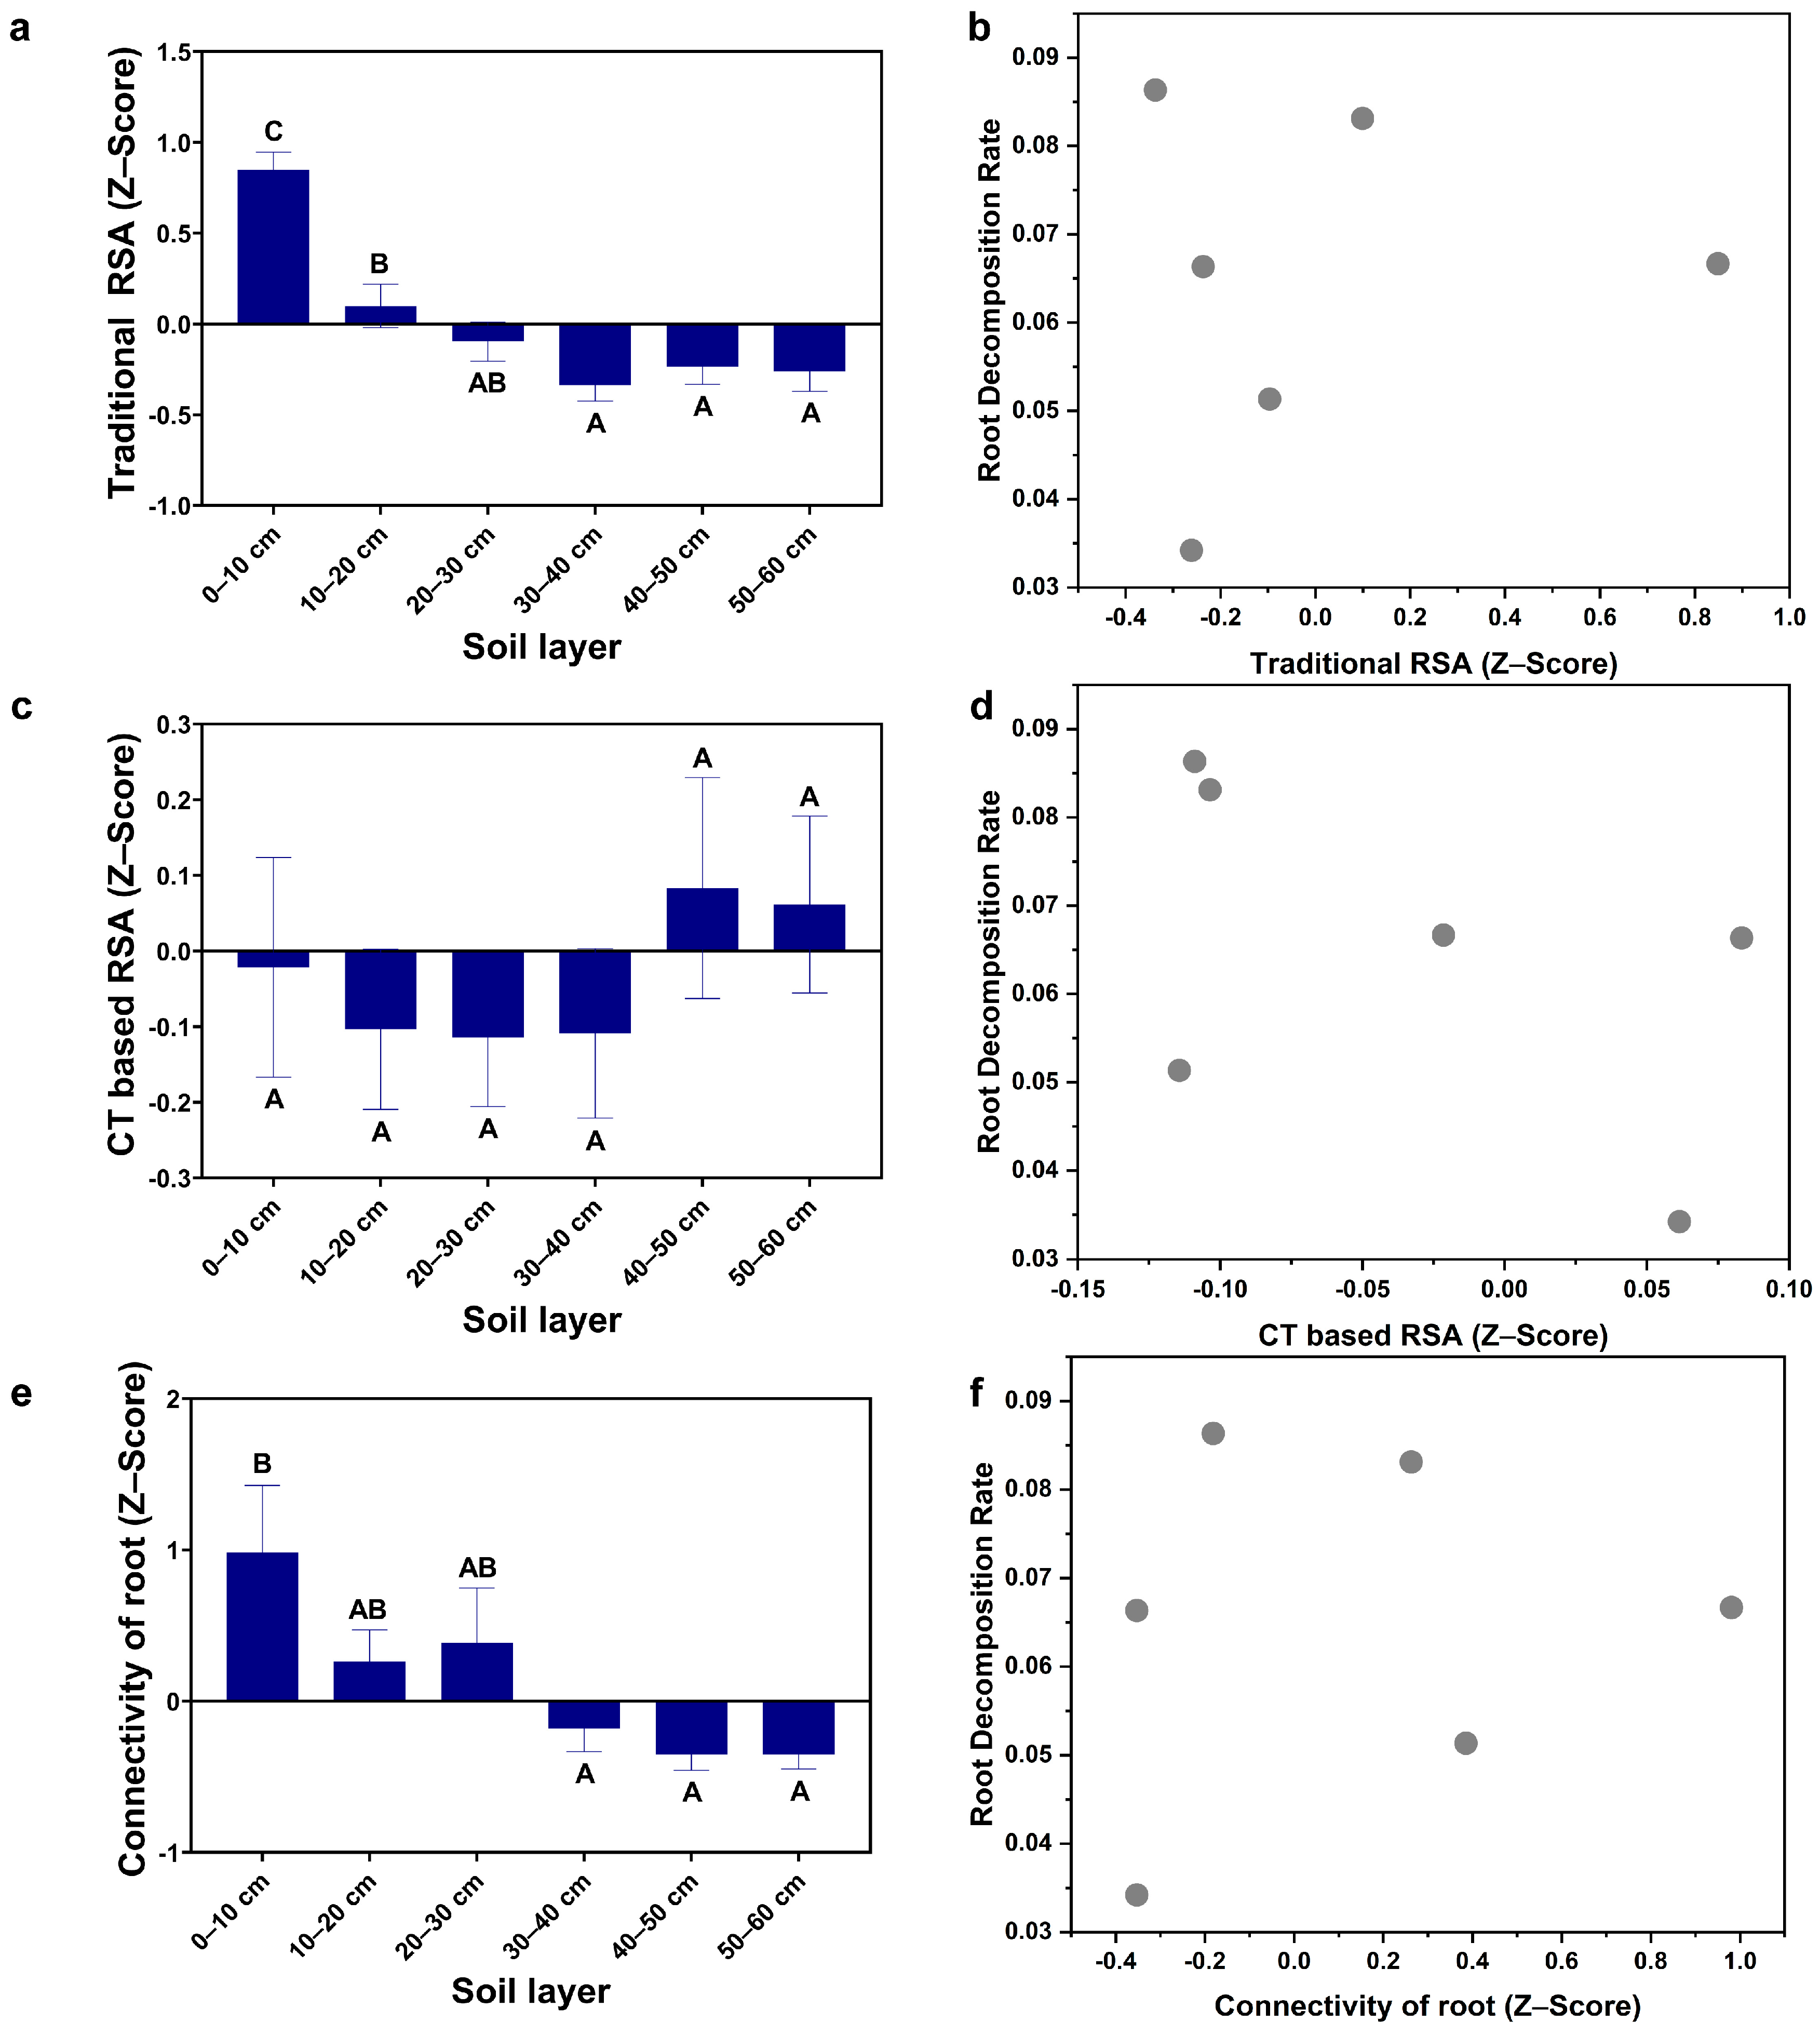
3.1. The Vertical Distribution of RSA

Except for OrientationTheta (Figure 2j), soil depth significantly affected traditional RSA, but none of the effects of tree species on measured RSA was significant. Except for Length (Figure 2b), each traditional RSA variable gradually decreased with soil depth, where the Root volume fraction, Volume, Area, and VoxelFaceArea were significantly higher in the topsoil (0–10 cm) than at other soil depths (Figure 2a,f,g,h).
There was no significant effect of tree species on CT-based RSA, and EqDiameter (Figure 3d) and Flatness (Figure 3e) did not differ significantly between soil depths. Shape (Figure 3a) and Dimension (Figure 3c) decreased with soil depth, and Euler was significantly higher in the topsoil (0–10 cm) than at other soil depths. Tortuosity and Euler, on the other hand, increased with soil depth, and Euler was significantly lower in the topsoil (0–10 cm) than at the other soil depths.
Root connectivity was significantly different among soil depths, but the effect of tree species was not significant. Except for Root number, which increased and then decreased with soil depth, all other variables decreased gradually with soil depth, among which the coordination number and throat number were significantly higher in the topsoil (0–10 cm) than at other soil depths (Figure 4).

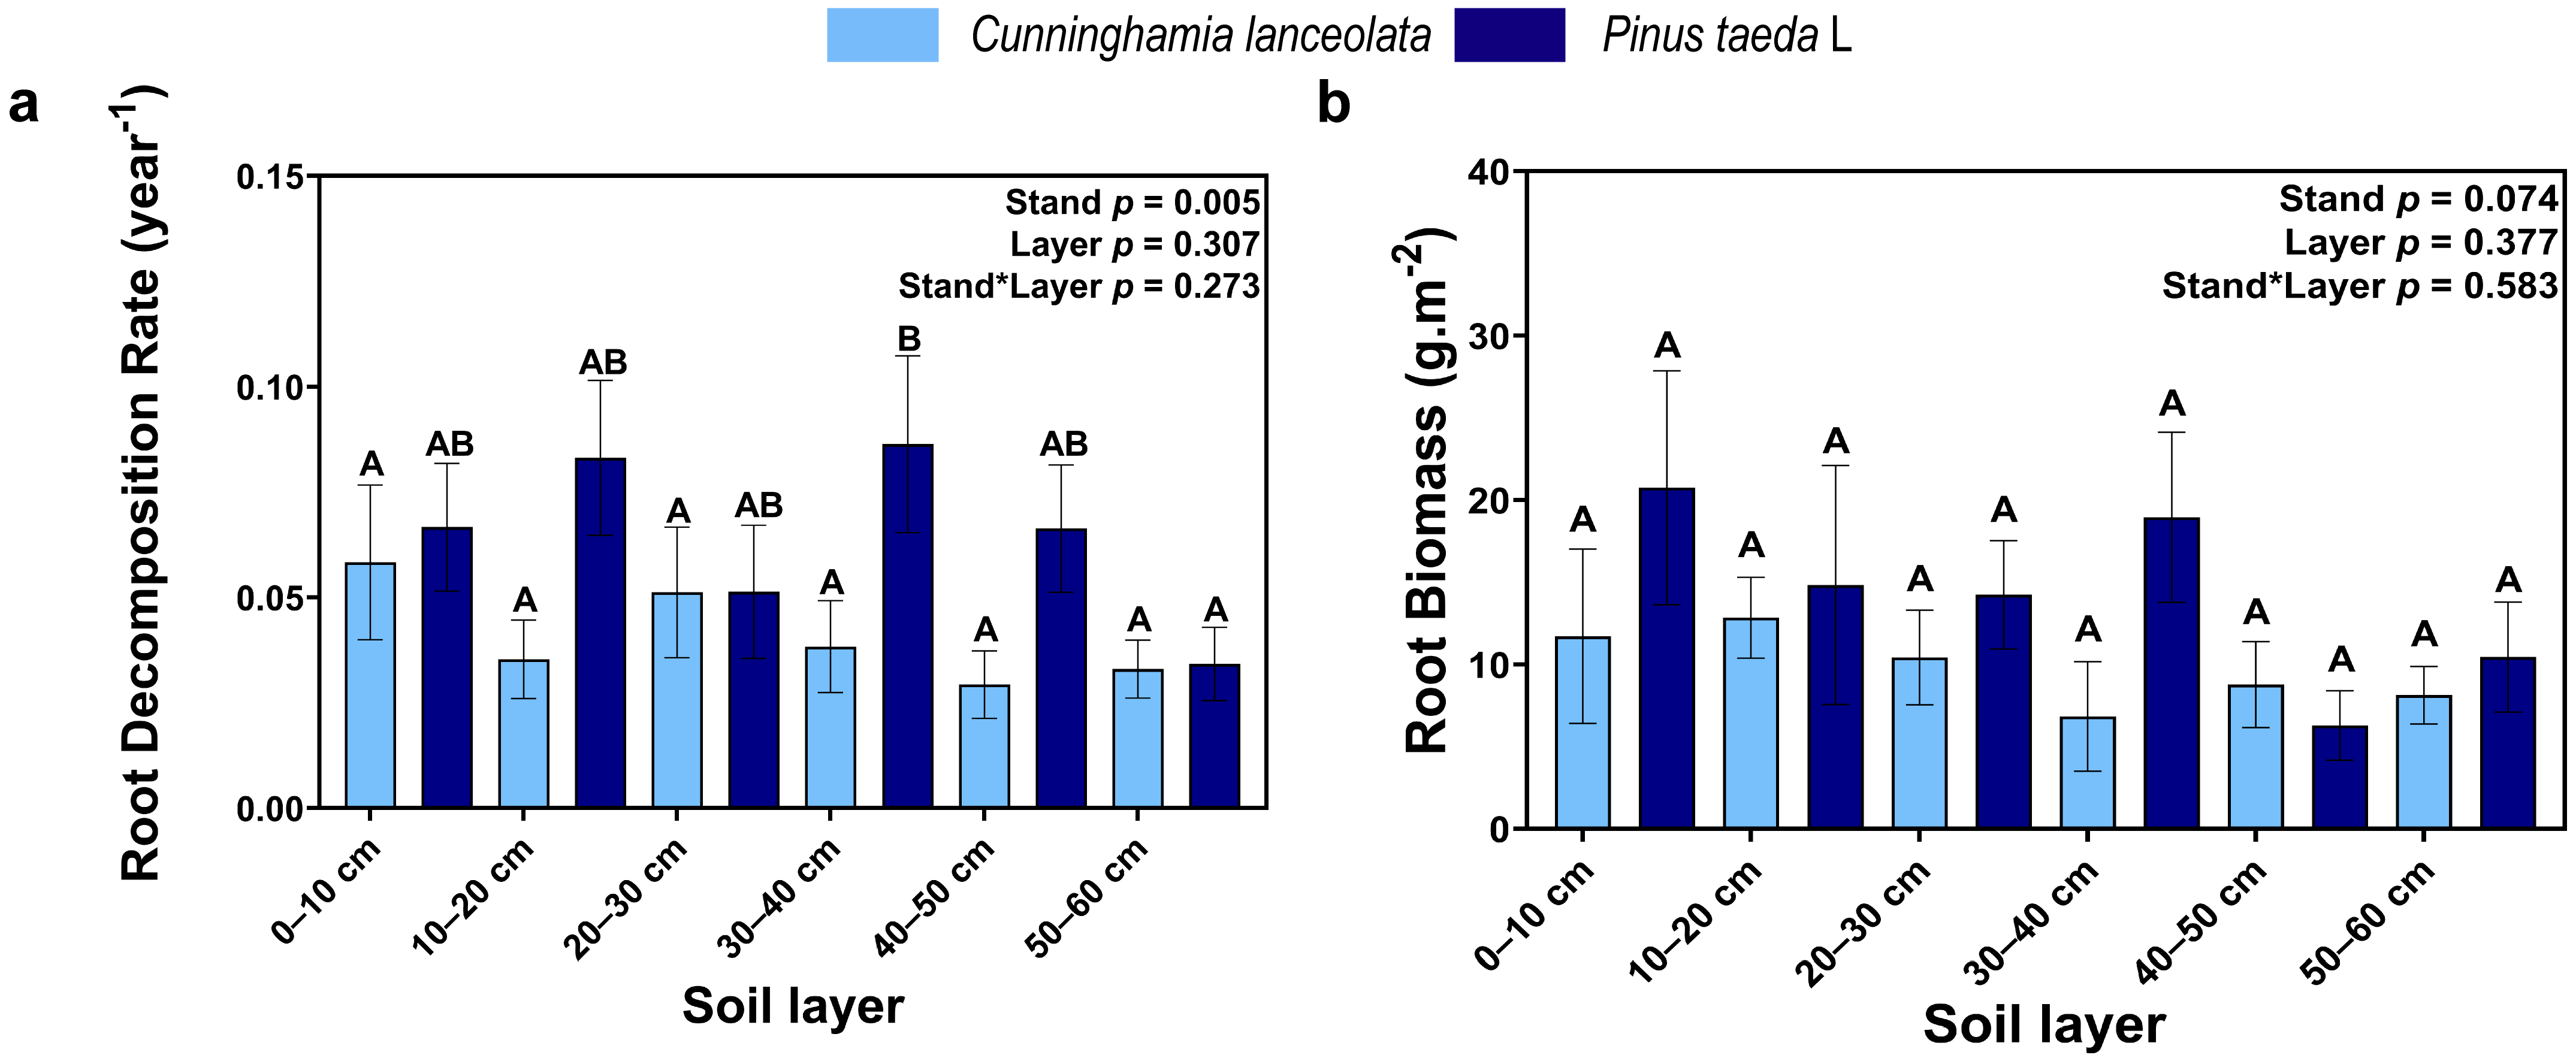
3.2. Root Decomposition Rate and Root Biomass

Tree species had a significant effect on the root decomposition rate, but there was no significant difference in the root decomposition rate among different soil depths in the Cunninghamia lanceolata plantation. In contrast, the root decomposition rate was significantly higher at the 30–40 cm soil depth than at the 50–60 cm soil depth in the Pinus taeda plantation (Figure 5a). Root biomass gradually decreased with increasing soil depth, but there was no significant difference between the different tree species and among the different soil depths (Figure 5b).
The decomposition rate of roots in the 0–10 cm, 10–20 cm, 30–40 cm, and 50–60 cm soil layers of the Cunninghamia lanceolata plantation and the 10–20 cm, 20–30 cm, and 30–40 cm soil layers of the Pinus taeda plantation decreased gradually with increasing decomposition time (Table 1; p < 0.05). During the first four-month cycle of the experiment, the root mass loss rate in the Cunninghamia lanceolata and Pinus taeda plantations did not show significant differences among soil layers (Table 1; p < 0.05). However, during the second 4-month cycle of the experiment, the root mass loss rate in the shallow soil layer of the Cunninghamia lanceolata plantation and Pinus taeda plantation was significantly higher than that in the deep soil layer (Table 1; p < 0.05). In contrast, when the experiment proceeded to the last four-month cycle, the root mass loss rate in the Cunninghamia lanceolata plantation did not differ significantly among soil layers. However, in the Pinus taeda plantation, the root mass loss rate remained significantly higher in the shallow soil layer than in the deep soil layer based on Table 1 (p < 0.05).

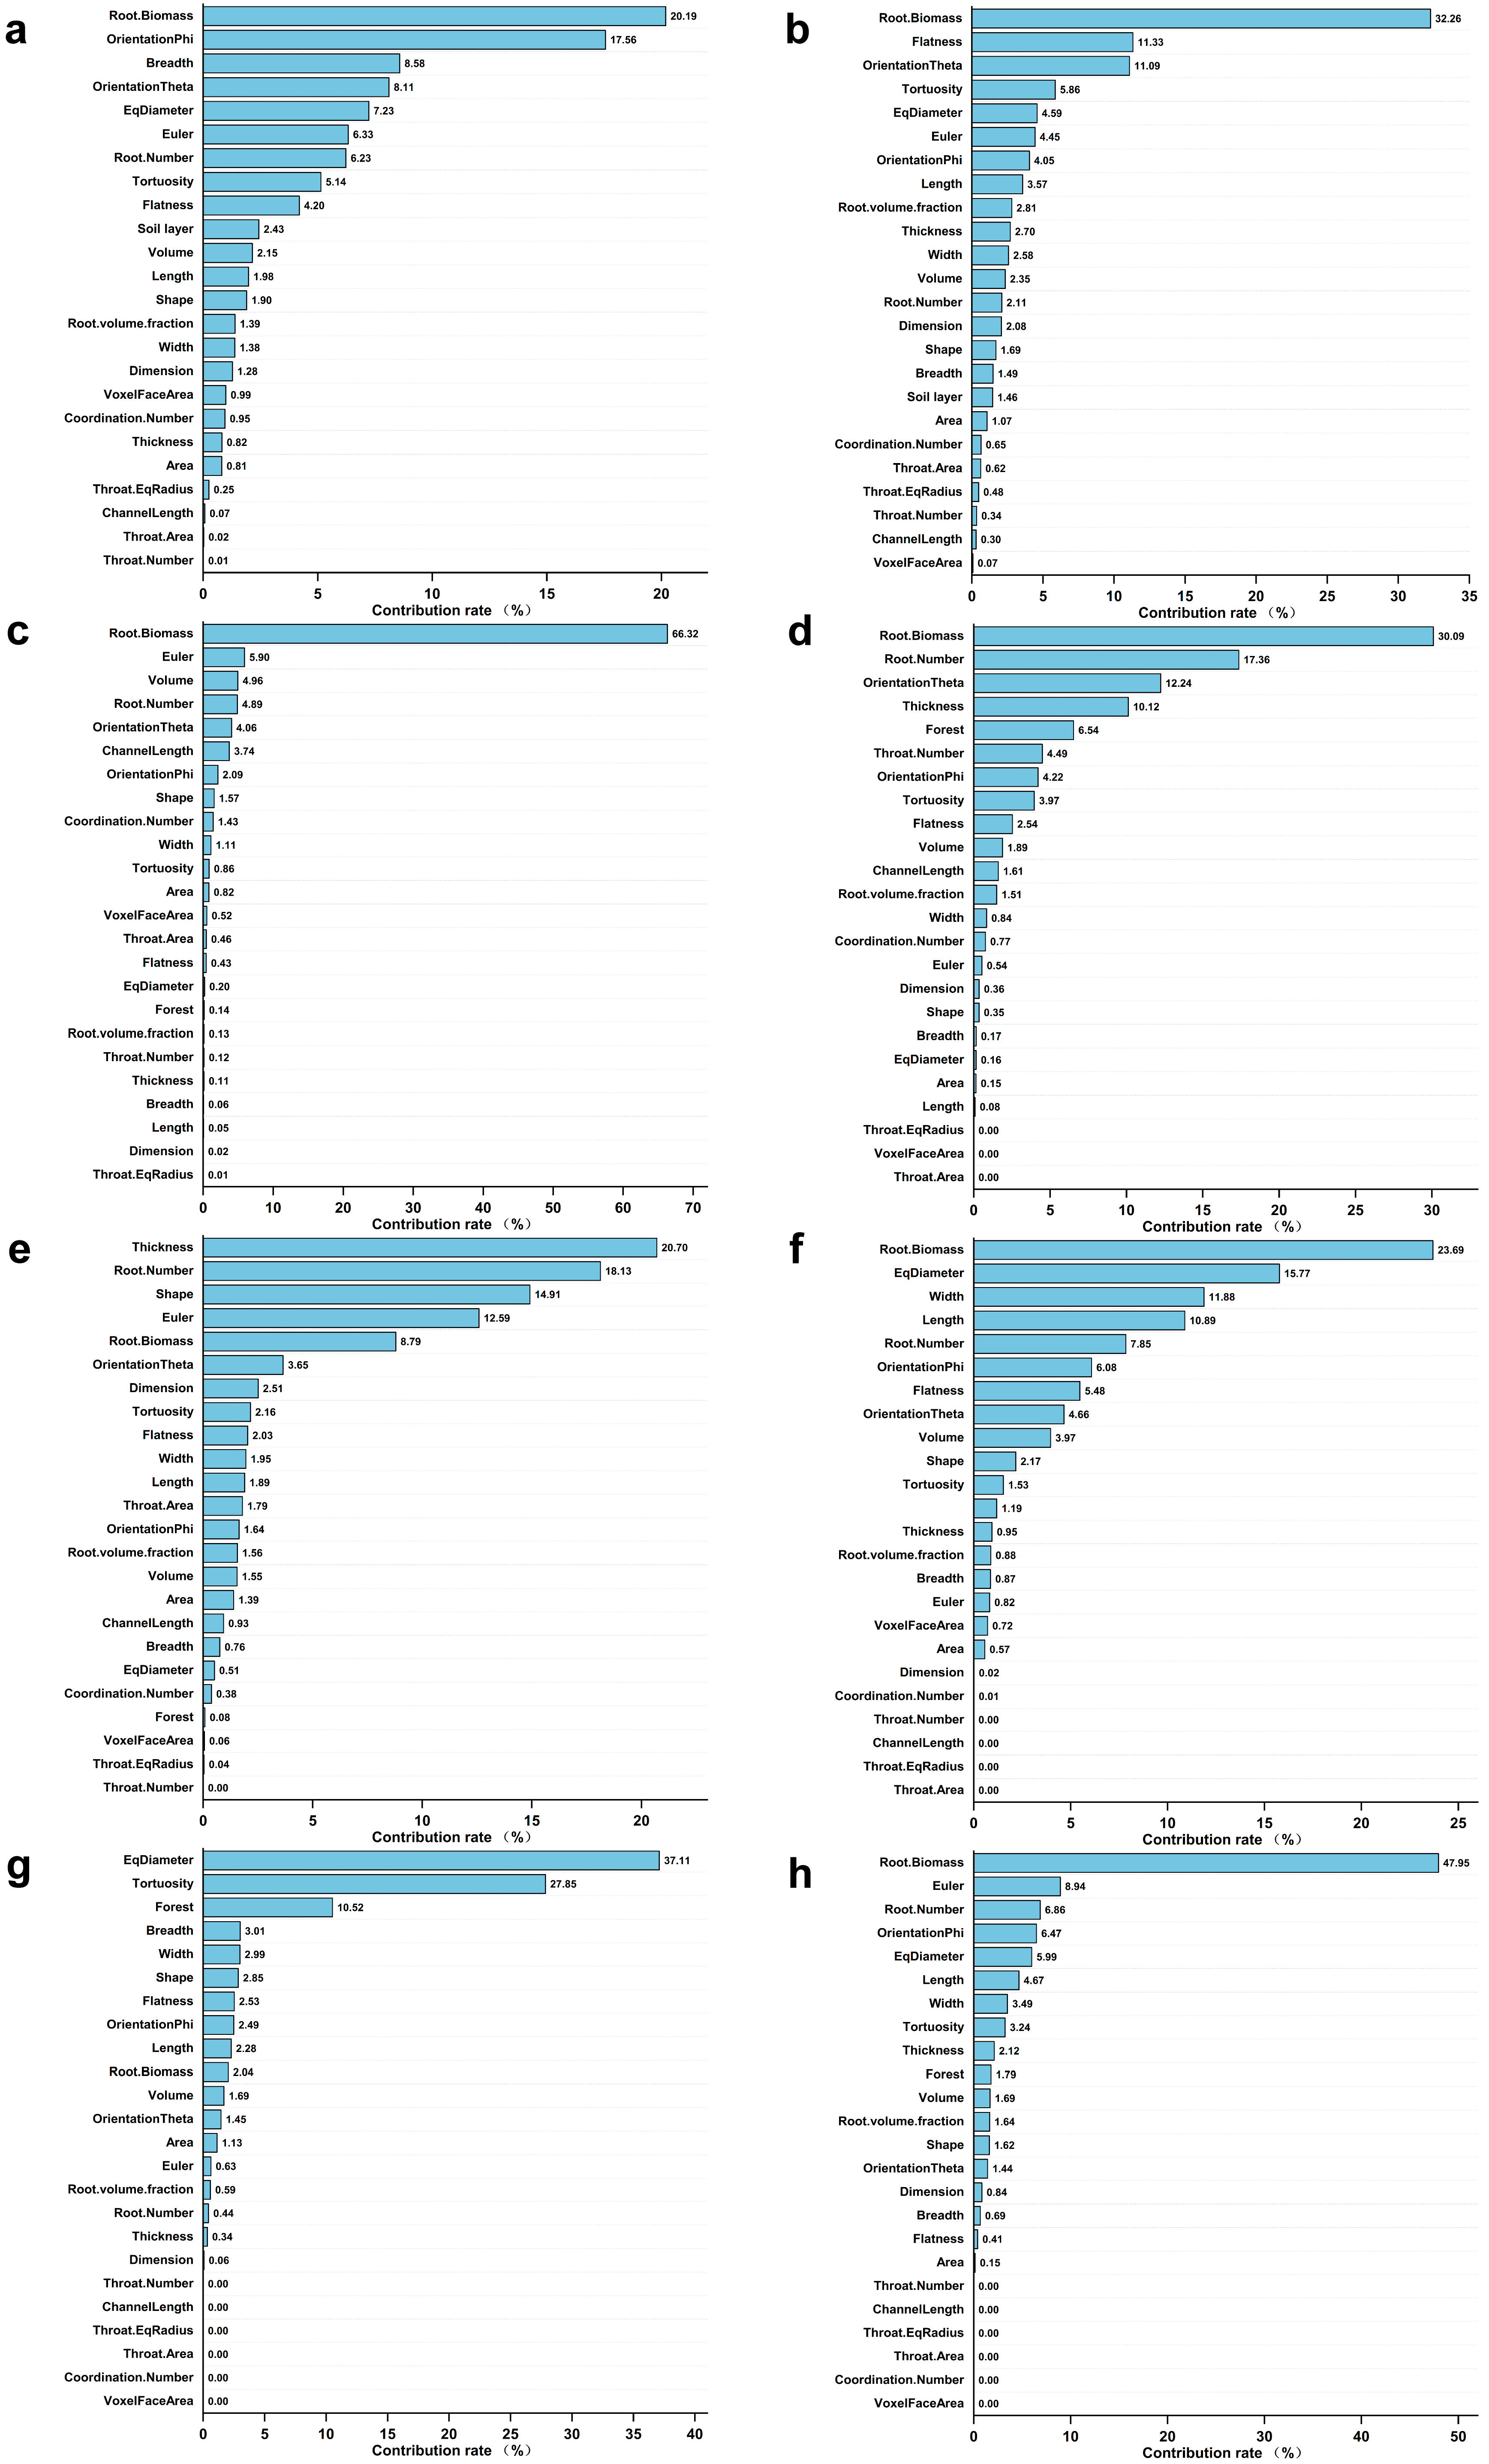
3.3. Major Factors Affecting the Root Decomposition Rate in Different Stand Types and Soil Depths
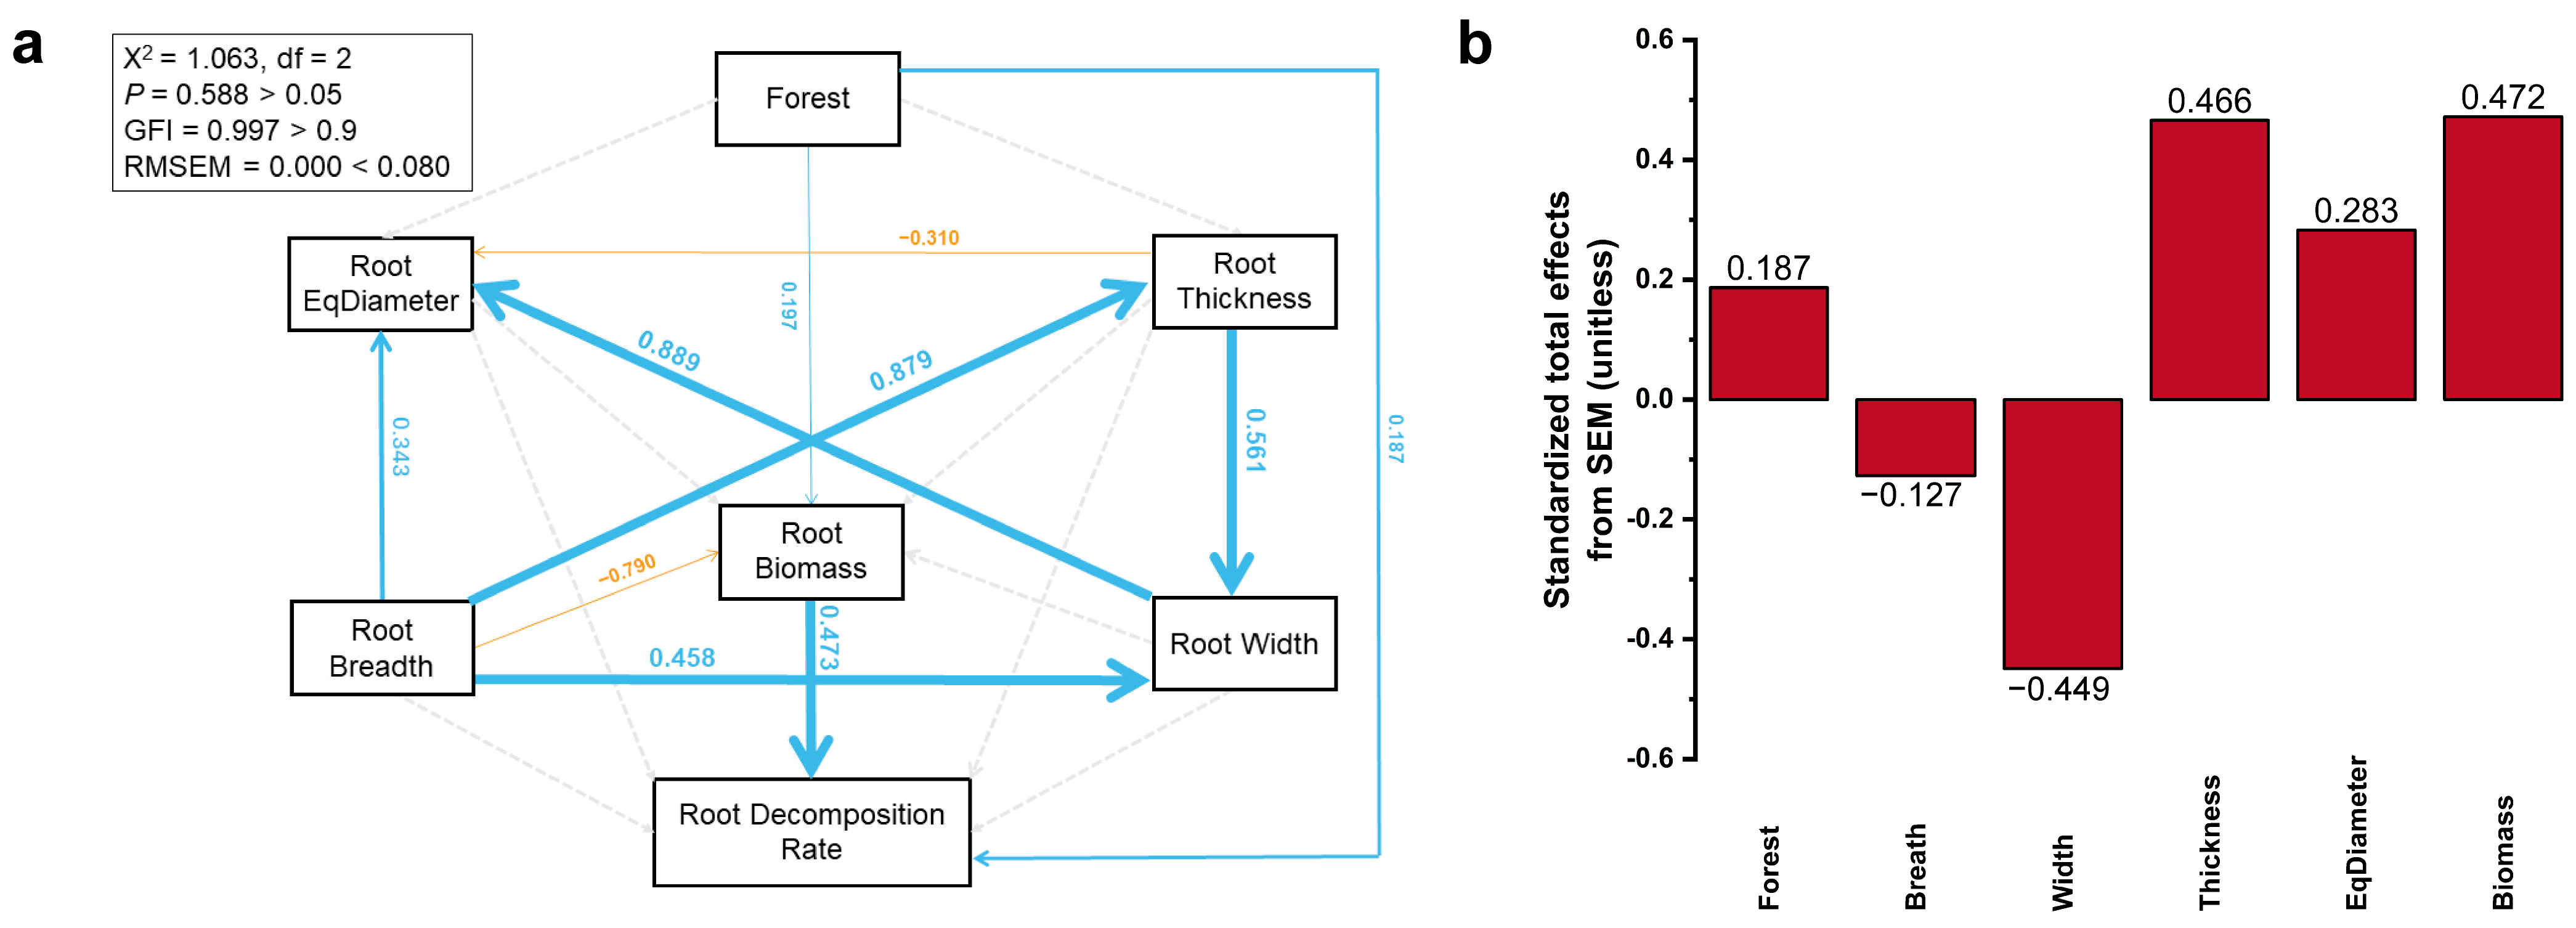
Tortuosity, Euler, and Length were significantly and positively correlated with soil depth (p < 0.05). The root decomposition rate was significantly correlated only with stand type, root biomass, EqDiameter, Width, Breadth, and thickness (p < 0.05) (Figure 6).
The enhanced regression tree (BRT) model analyzed the contribution of RSA variables to the root decomposition rate in different stand types and at different soil depths. The results showed that the most significant contributor to the root decomposition rate was root biomass in both Cunninghamia lanceolata (Figure 7a) and Pinus taeda plantations (Figure 7b), with values of 20.19% and 32.26%, respectively.
The analysis of the main factors affecting the root decomposition rate at different soil depths revealed that only Root Biomass contributed more than 10% to the root decomposition rate at the 0–10 cm soil depth and 50–60 cm soil depth, i.e., 66.32% (Figure 7c) and 47.95% (Figure 7h), respectively. With increasing soil depth, the contribution of RSA variables such as the root number, shape, and width to the root decomposition rate first increased and then decreased, and the contribution of root biomass first decreased and then increased (Figure 7c–h).

3.4. SEM Analysis

Root biomass (path coefficient = 0.473; p < 0.001) and tree species (path coefficient = 0.187; p < 0.05) had a direct positive effect on the root decomposition rate, while tree species also indirectly affected the root decomposition rate by affecting root biomass (path coefficient = 0.197; p < 0.05) (Figure 8a).
To further assess the main factors affecting the root decomposition rate, the standardized total effects of different parameters were analyzed. The results showed that root biomass had the largest positive effect on the root decomposition rate, followed by Thickness, EqDiameter, and stand type. Root width had the largest negative effect on the root decomposition rate, followed by root breadth (Figure 8b).

4. Discussion

4.1. Vertical Distribution of the RSA

We found that root volume and area were significantly greater in the 0–10 cm soil depth than at the other depths and accounted for nearly 50% of the total volume of the in situ soil core. The topsoil contains more nutrients that promote root growth in upper soils, and as the soil depth increases, nutrients gradually decrease, limiting root development. Root length, however, is the opposite of the above, as upper soils provide roots with easy access to nutrients. However, with increasing soil depth, nutrient acquisition becomes difficult and roots have to grow toward the nutrient-rich areas by increasing their length to obtain nutrients [43]. The thickness of the root was also significantly greater in 0–10 cm soils than at other soil depths. The reason for this is that coarse roots have a greater thickness and are rarely found in deeper soils. Roots in deeper soils are mainly in the form of fine roots [44].
The analysis of all RSA variables analyzed by the Avizo model showed that all variables except EqDiameter and Flatness were significantly correlated with soil depth. Tortuosity and Euler were significantly and positively correlated with depth soil depth, while shape and dimension were significantly and negatively correlated with soil depth. Tortuosity reflects the variation of the nutrient content in the soil. Root Tortuosity results from a specific growth response, which depends mainly on soil matrix properties. Deeper soils have lower and unevenly distributed water and nutrient concentrations, forcing the roots to grow and meander with the location of the water and nutrients. As a result, a significantly higher tortuosity was found in deeper soils [45]. At the same time, the mechanical strength of deeper soils is greater, and roots have to grow by constantly meandering around dense soil areas to obtain nutrients. It has been shown that the fractal dimension of the roots is consistent with the reinforcement capacity of the roots [46]. The coarse roots in upper soils have a greater ability to hold the soil, while the fractal dimension of the roots decreases with soil depth, decreasing the ability of the roots to maintain regional soil and water and soil shear strength.
Using CT with a computer model construction of the 3D structure of the roots, we obtained data on the natural growth state of the roots. Based on our innovative measurement of root characteristics, we proposed a root connectivity index. We found that all six variables used to derive the root connectivity index were significantly and negatively correlated with soil depth. Our analysis suggests that the number of roots was higher in upper soils, and roots were interspersed with each other, so there were more channels and connections between roots. As the soil depth increased, the number of roots decreased significantly. At the same time, due to the increase in the density and mechanical strength of the deeper soil depths, the channels of connection between the roots disappeared. The roots grew and developed more as independent individuals.

4.2. Vertical Distribution of the Root Decomposition Rate

During the first 4 months of the root decomposition rate, the amount of root mass lost did not decrease significantly with increasing soil depth, supporting the previous findings [47] (Table 1). This may be due to favorable conditions for the root decomposition rate at the initial stage when both the roots and soil nutrient content were adequate. Over time, the rate of root decomposition began to slow down with increasing soil depth, suggesting the conditions for the root decomposition rate were being depleted. Higher levels of SM, CEC, and SOM were present in the surface soils, indicating a greater decomposition potential than in the deeper soils. High levels of SM, CEC, and SOM increase enzyme activity and thus stimulate the root decomposition rate and promote microbial uptake of unstable C and N [48]. With changes in soil depth, bulk density, temperature, and moisture [49], nutrient availability and microbial communities are also changing, affecting the root decomposition rate [50,51,52,53]. Furthermore, the lack of soil animal activity can also result in a lower root decomposition rate in deeper soils than in surface soils [47].
The mass loss rate of the root decomposition rate did not decrease linearly with increasing soil depth but tended to be much faster at the 10–20 cm depth [54]. This is related to the complexity of factors influencing the root decomposition rate. The root decomposition rate is influenced by both the structures and chemical characteristics of roots and the environment [55]. As a result, the root decomposition rates may vary considerably even for the same species in different environments [56,57]. Site-specific conditions (e.g., temperature, precipitation, different forest floor types, and different nutrient interactions between plants and belowground communities) can also affect the root decomposition rate [58,59]. Although our studied stands were coniferous and occurred at the same location, their soil temperature and humidity were found to differ significantly. Changes in temperature and humidity cause a series of chain reactions in nutrient distribution and microbial community composition and distribution, which result in differences in the root decomposition rate in time and space. At the same time, we believe that this may be the result of a water deficit in mid-summer in the 0–10 cm layer, leading to decrease in the decomposition rate of dead roots.

4.3. Major Factors Affecting the Root Decomposition Rate in Different Stand Types and at Different Soil Depths

Throughout the study period, there was a significant positive correlation between the root decomposition rate and indicators such as root thickness, which is reflected by root diameter. We found that the root decomposition rate increased with the root diameter and length (Figure A3b). The effects of root length on the decomposition rate supported previous studies [60,61]. Carbon in thicker roots may be present as carbohydrates, amino acids, and other substances that are more easily decomposed than the finer diameter roots, which causes the larger diameter roots to be more easily decomposed [62]. The slowing effect of fine roots on the nutrient supply also leads to a slower decomposition of fine roots than coarse roots [63]. Although larger diameter roots contain higher levels of N and stimulate the formation of N-lignin complexes to retard decomposition [64], our study was conducted on coniferous species, which usually have lower N and P contents [65,66]. It has also been shown that the root decomposition rate capacity of roots varies with the root morphology [67]. However, we found that RSA variables reflected the nutrient acquisition capacity of root growth and, to some extent, soil nutrient distribution [52,68]. A significant linear correlation was found between the root decomposition rate and root connectivity in the Cunninghamia lanceolata plantation (Figure A3f). We did not find any correlation between RSA characteristics (tortuosity, etc.) and the root decomposition rate in the Pinus taeda plantation (Figure A4). The SEM results also confirmed our conjecture that root biomass and stand type directly affect the root decomposition rate. Root Breadth indirectly but negatively changed root biomass and thus the root decomposition rate. Roots with smaller breadth contributed to lower root biomass, and the decomposition was therefore also slower.
Through the analysis of RSA and the root decomposition rate, we observed that the effects were inconsistent across stand type and soil depth. Therefore, we needed to investigate the influential factors that affect the root decomposition rate of each stand type at each soil depth. In both Cunninghamia lanceolata and Pinus taeda plantations, root biomass contributed the most to the root decomposition rate, which reached 20.19% and 32.26%, respectively. This result further validates the SEM results that root biomass directly influences the root decomposition rate while other variables indirectly influence root biomass and thus the root decomposition rate. Further analysis revealed that differences between Cunninghamia lanceolata and Pinus taeda plantations, the second most important variable, were likely due to the difference in RSA and root element contents between species.
Various conditions in upper soils are more favorable to the root decomposition rate. Roots in upper soils are also more susceptible to external environmental influences (e.g., trampling by forest animals, gnawing by soil animals, rainfall erosion, etc.) [63]. Therefore, the effect of RSA on the root decomposition rate was overshadowed by other factors, and root biomass became the decisive factor affecting the root decomposition rate in upper soils (66.32%). As soil depth increased, the contribution of RSA variables to the root decomposition rate gradually increased. However, when the soil depth reached 50–60 cm, the largest contributor to the root decomposition rate was once again the root biomass, which accounted for nearly half (47.95%) of the total contribution. In deeper soils, the number of roots was lower and the conditions were less favorable to the root decomposition rate. Consequently, root biomass plays a decisive role in the root decomposition rate [60,69].

5. Conclusions

RSA variables varied with soil depth but did not differ significantly between the two stand types. Root volume, root surface area, and root thickness were greater and inter-root connectivity was higher in upper soils. Root length gradually increased with depth, and root tortuosity also increased with increasing soil depth. Roots of different stand types directly influenced the root decomposition rate through tree species’ composition. Structural variables such as root thickness positively affected the root decomposition rate indirectly by changing the root biomass. Root biomass was the main contributor affecting the root decomposition rate. Finally, the contribution of RSA variables to the root decomposition rate gradually increased with increasing soil depth. However, when the soil depth reached 50–60 cm, root biomass was again the largest contributor affecting the root decomposition rate.

Author Contributions

Conception and design of the research: Y.T.; Acquisition of data: Y.T., J.L., X.C. and X.L.; Analysis and interpretation of data: Y.T. and J.L.; Statistical analysis: Y.T. and J.L.; Drafting the manuscript: Y.T.; Revision of manuscript for important intellectual content: Y.T., X.L., G.G.W. and J.Z. All authors have read and agreed to the published version of the manuscript.

Funding

This research was funded by the Jiangsu Science and Technology Plan Project [BE2022420]; Innovation and Promotion of Forestry Science and Technology Program of Jiangsu Province [LYKJ (2021) 30] Scientific Research Project of Baishanzu National Park [2021ZDLY01]; Jiangsu Province Science Foundation for Youths (BK20200785); and Priority Academic Program Development of Jiangsu Higher Education Institutions [PAPD].

Data Availability Statement

The data presented in this study are available on request from the corresponding author.

Acknowledgments

Yingzhou Tang would especially like to thank Jingwei Lian for her patience, care, support, and company over the years. Let’s get married!

Conflicts of Interest

The authors declare no conflict of interests.

Appendix A

Figure A1. Meteorological data for the study area: (a) Air Temperature; (b) Relative Humidity; (c) Rainfall; (d) Wind Speed; (e) Atmospheric Pressure; (f) Solar Irradiance.
Forests 14 01092 g0a1
Figure A2. Heat map showing the change in root factors. The coefficient of variation (CV) indicated the sensitivity of root factors.
Forests 14 01092 g0a2
Figure A3. RSA in the Cunninghamia lanceolata plantation: (a) Traditional RSA; (b) Relationship between traditional RSA and the root decomposition rate; (c) CT-based RSA; (d) Relationship between CT-based RSA and the root decomposition rate; (e) Connectivity of roots; (f) Relationship between the connectivity of roots and the root decomposition rate; (Note: uppercase letters indicate significant differences between different soil layers (p ≤ 0.05)).
Forests 14 01092 g0a3
Figure A4. RSA in the Pinus taeda L. plantation: (a) Traditional RSA; (b) Relationship between traditional RSA and the root decomposition rate; (c) CT-based RSA; (d) Relationship between CT-based RSA and the root decomposition rate; (e) Connectivity of roots; (f) Relationship between the connectivity of roots and the root decomposition rate; (Note: uppercase letters indicate significant differences between different soil layers (p ≤ 0.05)).
Forests 14 01092 g0a4
Table A1. Basic information about the sample site.
Sample TypeAge
(Years)
PlaceAspectSlopeASL
(m)
Density
(Trees ha−2)
Mean DBH
(cm)
Mean TH
(m)
Mean CD
(m)
Crown
Density
Intrusion
Ratio
C. lanceolata C14332°07′17″ N 119°13′03″ E347° N14°10097522.19 (4.83)12.77 (4.33)6.12 (2.16)0.828%
C. lanceolata C24332°07′17″ N 119°13′02″ E350° N15°10087525.38 (6.72)14.39 (4.80)8.11 (3.26)0.8912%
C. lanceolata C34332°07′15″ N 119°13′03″ E214° SW16°10075024.06 (4.75)14.43 (3.19)6.93 (2.20)0.9320%
P. taeda L. P13932°07′15″ N 119°13′16″ E203° SW13°11067528.80 (5.62)15.11 (3.95)7.93 (2.72)0.549%
P. taeda L. P23932°07′17″ N 119°13′18″ E207° SW10°11050029.91 (6.52)13.13 (3.15)7.75 (2.22)0.6117%
P. taeda L. P33932°07′17″ N 119°13′17″ E330° NW11052528.61 (4.98)14.00 (2.66)9.62 (1.83)0.6313%
Table A2. The characteristics of the root system.
ParametersExplanatory Notes
The volume fraction of rootsThe volume of roots/volume of undisturbed soil core (The range is 0 to 1)
LengthMaximum Feret diameter
The Feret diameter is defined as the distance between two tangent planes of a particle in a given direction
BreadthLargest distance between two parallel lines touching the object without intersecting it and lying in a plane orthogonal to the maximum Feret diameter
WidthMinimum Feret Diameter
Thickness The largest segment that touches the object by its endpoints and lying in a plane orthogonal to the maximum Feret diameter and orthogonal to the breadth diameter
OrientationPhiPhi orientation of the particle in degrees [0, +90], computed with the inertia moments. It defines, with OrientationTheta, the eigenvector of the largest eigenvalue of the covariance matrix
OrientationThetaTheta orientation of the particle in degrees [−180, 180], computed with the inertia moments. It defines, with OrientationPhi, the eigenvector of the largest eigenvalue of the covariance matrix
ShapeThe shape factor is defined as shape = area3/(36 × π × volume2)
Tortuosity Tortuosity is defined as the ratio between the length of the path and the distance between its ends along the z-axis. In our case, the distance between the ends of the curve is given by the number of planes along the z-axis
Fractal dimensionA fractal dimension is a number greater than 2 and strictly lower than 3. The result is 2 in the case of standard geometric surfaces. Applied to 3D images, the fractal dimension is an effective indicator to measure and compare the roughness of a surface. It is also a good indicator to evaluate how the curve fills the space. The less smooth the surface, the greater the fractal dimension. It can also be interpreted as a quantification of how complex the surface is and how it fills the space
Flatness The ratio of the smallest to the medium eigenvalue of the covariance matrix
EqDiameterThe equivalent diameter is the diameter of the sphere of the same volume
VoxelFaceAreaThis value is the sum of voxel surfaces that are on the outside of each connected component
EulerConnectedness indicator. It is an indicator of the connectivity of a 3D complex structure

References

  1. Teramoto, S.; Takayasu, S.; Kitomi, Y.; Arai-Sanoh, Y.; Tanabata, T.; Uga, Y. High-Throughput Three-Dimensional Visualization of Root System Architecture of Rice Using X-ray Computed Tomography. Plant Methods 2020, 16, 66. [Google Scholar] [CrossRef]
  2. Gregory, P.J. Plant Roots: Growth, Activity and Interactions with the Soil; John Wiley & Sons: Hoboken, NJ, USA, 2008; ISBN 978-1-4051-7308-7. [Google Scholar]
  3. Barton, C.V.M.; Montagu, K.D. Detection of Tree Roots and Determination of Root Diameters by Ground Penetrating Radar under Optimal Conditions. Tree Physiol. 2004, 24, 1323–1331. [Google Scholar] [CrossRef]
  4. Bert, D.; Danjon, F. Carbon Concentration Variations in the Roots, Stem and Crown of Mature Pinus pinaster (Ait.). For. Ecol. Manag. 2006, 222, 279–295. [Google Scholar] [CrossRef]
  5. Montagnoli, A.; Terzaghi, M.; Miali, A.; Chiatante, D.; Dumroese, R.K. Unusual Late-Fall Wildfire in a Pre-Alpine Fagus Sylvatica Forest Reduced Fine Roots in the Shallower Soil Layer and Shifted Very Fine-Root Growth to Deeper Soil Depth. Sci. Rep. 2023, 13, 6380. [Google Scholar] [CrossRef] [PubMed]
  6. Litton, C.M.; Raich, J.W.; Ryan, M.G. Carbon Allocation in Forest Ecosystems. Glob. Chang. Biol. 2007, 13, 2089–2109. [Google Scholar] [CrossRef]
  7. Montagnoli, A.; Dumroese, R.K.; Terzaghi, M.; Onelli, E.; Scippa, G.S.; Chiatante, D. Seasonality of Fine Root Dynamics and Activity of Root and Shoot Vascular Cambium in a Quercus ilex L. Forest (Italy). For. Ecol. Manag. 2019, 431, 26–34. [Google Scholar] [CrossRef]
  8. Kondori, A.A.; Vajari, K.A.; Feizian, M.; Montagnoli, A.; Di Iorio, A. Gap Size in Hyrcanian Forest Affects the Lignin and N Concentrations of the Oriental Beech (Fagus orientalis Lipsky) Fine Roots but Does Not Change Their Morphological Traits in the Medium Term. Forests 2021, 12, 137. [Google Scholar] [CrossRef]
  9. Bontpart, T.; Concha, C.; Giuffrida, M.V.; Robertson, I.; Admkie, K.; Degefu, T.; Girma, N.; Tesfaye, K.; Haileselassie, T.; Fikre, A.; et al. Affordable and Robust Phenotyping Framework to Analyse Root System Architecture of Soil-Grown Plants. Plant J. 2020, 103, 2330–2343. [Google Scholar] [CrossRef]
  10. Rogers, E.D.; Monaenkova, D.; Mijar, M.; Nori, A.; Goldman, D.I.; Benfey, P.N. X-ray Computed Tomography Reveals the Response of Root System Architecture to Soil Texture. Plant Physiol. 2016, 171, 2028–2040. [Google Scholar] [CrossRef]
  11. Fang, S.; Yan, X.; Liao, H. 3D Reconstruction and Dynamic Modeling of Root Architecture in Situ and Its Application to Crop Phosphorus Research. Plant J. 2009, 60, 1096–1108. [Google Scholar] [CrossRef]
  12. Bauerle, T.L.; Centinari, M. Assessment of Root System Development among Four Ornamental Tree Species through Time via X-ray Computed Tomography. HortScience 2014, 49, 44–50. [Google Scholar] [CrossRef]
  13. Pang, Y.; Tian, J.; Yang, H.; Zhang, K.; Wang, D. Responses of Fine Roots at Different Soil Depths to Different Thinning Intensities in a Secondary Forest in the Qinling Mountains, China. Biology 2022, 11, 351. [Google Scholar] [CrossRef]
  14. Hodge, A. The Plastic Plant: Root Responses to Heterogeneous Supplies of Nutrients. New Phytol. 2004, 162, 9–24. [Google Scholar] [CrossRef]
  15. Montagnoli, A.; Lasserre, B.; Terzaghi, M.; Byambadorj, S.-O.; Nyam-Osor, B.; Scippa, G.S.; Chiatante, D. Fertilization Reduces Root Architecture Plasticity in Ulmus pumila Used for Afforesting Mongolian Semi-Arid Steppe. Front. Plant Sci. 2022, 13, 878299. [Google Scholar] [CrossRef]
  16. Zhou, G.; Zhou, X.; Nie, Y.; Bai, S.H.; Zhou, L.; Shao, J.; Cheng, W.; Wang, J.; Hu, F.; Fu, Y. Drought-Induced Changes in Root Biomass Largely Result from Altered Root Morphological Traits: Evidence from a Synthesis of Global Field Trials. Plant Cell Environ. 2018, 41, 2589–2599. [Google Scholar] [CrossRef] [PubMed]
  17. Ma, Z.; Chen, H.Y.H. Positive Species Mixture Effects on Fine Root Turnover and Mortality in Natural Boreal Forests. Soil Biol. Biochem. 2018, 121, 130–137. [Google Scholar] [CrossRef]
  18. Nyam-Osor, B.; Byambadorj, S.-O.; Park, B.B.; Terzaghi, M.; Scippa, G.S.; Stanturf, J.A.; Chiatante, D.; Montagnoli, A. Root Biomass Distribution of Populus sibirica and Ulmus pumila Afforestation Stands Is Affected by Watering Regimes and Fertilization in the Mongolian Semi-Arid Steppe. Front. Plant Sci. 2021, 12, 638828. [Google Scholar] [CrossRef] [PubMed]
  19. Montagnoli, A.; Chiatante, D.; Godbold, D.L.; Koike, T.; Rewald, B.; Dumroese, R.K. Editorial: Modulation of Growth and Development of Tree Roots in Forest Ecosystems. Front. Plant Sci. 2022, 13, 850163. [Google Scholar] [CrossRef]
  20. Kaestner, A.; Schneebeli, M.; Graf, F. Visualizing Three-Dimensional Root Networks Using Computed Tomography. Geoderma 2006, 136, 459–469. [Google Scholar] [CrossRef]
  21. Peng, S.; Chen, H.Y.H. Global Responses of Fine Root Biomass and Traits to Plant Species Mixtures in Terrestrial Ecosystems. Glob. Ecol. Biogeogr. 2021, 30, 289–304. [Google Scholar] [CrossRef]
  22. Pierret, A.; Doussan, C.; Capowiez, Y.; Bastardie, F.; Pagès, L. Root Functional Architecture: A Framework for Modeling the Interplay between Roots and Soil. Vadose Zone J. 2007, 6, 269–281. [Google Scholar] [CrossRef]
  23. de Graaff, M.-A.; Six, J.; Jastrow, J.D.; Schadt, C.W.; Wullschleger, S.D. Variation in Root Architecture among Switchgrass Cultivars Impacts Root Decomposition Rates. Soil Biol. Biochem. 2013, 58, 198–206. [Google Scholar] [CrossRef]
  24. Lontoc-Roy, M.; Dutilleul, P.; Prasher, S.O.; Han, L.; Brouillet, T.; Smith, D.L. Advances in the Acquisition and Analysis of CT Scan Data to Isolate a Crop Root System from the Soil Medium and Quantify Root System Complexity in 3-D Space. Geoderma 2006, 137, 231–241. [Google Scholar] [CrossRef]
  25. Ding, Y.; Leppälammi-Kujansuu, J.; Helmisaari, H.-S. Fine Root Longevity and Below- and Aboveground Litter Production in a Boreal Betula Pendula Forest. For. Ecol. Manag. 2019, 431, 17–25. [Google Scholar] [CrossRef]
  26. Li, A.; Zhu, L.; Xu, W.; Liu, L.; Teng, G. Recent Advances in Methods for in Situ Root Phenotyping. PeerJ 2022, 10, e13638. [Google Scholar] [CrossRef]
  27. Dupuy, L.X.; Fourcaud, T.; Lac, P.; Stokes, A. A Generic 3D Finite Element Model of Tree Anchorage Integrating Soil Mechanics and Real Root System Architecture. Am. J. Bot. 2007, 94, 1506–1514. [Google Scholar] [CrossRef] [PubMed]
  28. Guo, L.; Chen, J.; Cui, X.; Fan, B.; Lin, H. Application of Ground Penetrating Radar for Coarse Root Detection and Quantification: A Review. Plant Soil 2013, 362, 1–23. [Google Scholar] [CrossRef]
  29. Smith, A.; Astrup, R.; Raumonen, P.; Liski, J.; Krooks, A.; Kaasalainen, S.; Åkerblom, M.; Kaasalainen, M. Tree Root System Characterization and Volume Estimation by Terrestrial Laser Scanning and Quantitative Structure Modeling. Forests 2014, 5, 3274–3294. [Google Scholar] [CrossRef]
  30. Jose, S.; Gillespie, A.R.; Seifert, J.R.; Pope, P.E. Comparison of Minirhizotron and Soil Core Methods for Quantifying Root Biomass in a Temperate Alley Cropping System. Agrofor. Syst. 2001, 52, 161–168. [Google Scholar] [CrossRef]
  31. Saltveit, M.E.; Young, E. A Method for Studying the Three-Dimensional Distribution of Roots Grown in an Artificial Medium. J. Am. Soc. Horticult. Sci. 1983, 108, 1023–1025. [Google Scholar] [CrossRef]
  32. Burr-Hersey, J.E.; Mooney, S.J.; Bengough, A.G.; Mairhofer, S.; Ritz, K. Developmental Morphology of Cover Crop Species Exhibit Contrasting Behaviour to Changes in Soil Bulk Density, Revealed by X-ray Computed Tomography. PLoS ONE 2017, 12, e0181872. [Google Scholar] [CrossRef]
  33. Hu, X.; Li, X.-Y.; Zhao, Y.-D.; Cheng, Y.-Q.; Gao, Z.; Yang, Z.-G. Identification of Water Flow through Non-Root Soil Macropores and along Roots in Shrub-Encroached Grassland. Eur. J. Soil Sci. 2022, 73, e13260. [Google Scholar] [CrossRef]
  34. Suresh, N.; Stephens, S.A.; Adams, L.; Beck, A.N.; McKinney, A.L.; Varga, T. Extracting Metrics for Three-Dimensional Root Systems: Volume and Surface Analysis from In-Soil X-ray Computed Tomography Data. J. Vis. Exp. 2016, 110, 53788. [Google Scholar] [CrossRef]
  35. FAO. World Reference Base for Soil Resources 2014: International Soil Classification System for Naming Soils and Creating Legends for Soil Maps; FAO: Rome, Italy, 2014; ISBN 978-92-5-108369-7.
  36. Dornbush, M.E.; Isenhart, T.M.; Raich, J.W. Quantifying Fine-Root Decomposition: An Alternative to Buried Litterbags. Ecology 2002, 83, 2985–2990. [Google Scholar] [CrossRef]
  37. Li, X.; Zheng, X.; Zhou, Q.; McNulty, S.; King, J.S. Measurements of Fine Root Decomposition Rate: Method Matters. Soil Biol. Biochem. 2022, 164, 108482. [Google Scholar] [CrossRef]
  38. Katuwal, S.; Norgaard, T.; Moldrup, P.; Lamandé, M.; Wildenschild, D.; de Jonge, L.W. Linking Air and Water Transport in Intact Soils to Macropore Characteristics Inferred from X-ray Computed Tomography. Geoderma 2015, 237–238, 9–20. [Google Scholar] [CrossRef]
  39. Olson, J.S. Energy Storage and the Balance of Producers and Decomposers in Ecological Systems. Ecology 1963, 44, 322–331. [Google Scholar] [CrossRef]
  40. Aulen, M.; Shipley, B.; Bradley, R. Prediction of in Situ Root Decomposition Rates in an Interspecific Context from Chemical and Morphological Traits. Ann. Bot. 2012, 109, 287–297. [Google Scholar] [CrossRef] [PubMed]
  41. Han, S.; Delgado-Baquerizo, M.; Luo, X.; Liu, Y.; Van Nostrand, J.D.; Chen, W.; Zhou, J.; Huang, Q. Soil Aggregate Size-Dependent Relationships between Microbial Functional Diversity and Multifunctionality. Soil Biol. Biochem. 2021, 154, 108143. [Google Scholar] [CrossRef]
  42. Li, C.; Yu, Z.; Lin, J.; Meng, M.; Zhao, Y.; Jia, Z.; Peng, X.; Liu, X.; Zhang, J. Forest Conversion and Soil Depth Can Modify the Contributions of Organic and Inorganic Colloids to the Stability of Soil Aggregates. Forests 2022, 13, 546. [Google Scholar] [CrossRef]
  43. Chen, W.; Chen, Y.; Siddique, K.H.M.; Li, S. Root Penetration Ability and Plant Growth in Agroecosystems. Plant Physiol. Biochem. 2022, 183, 160–168. [Google Scholar] [CrossRef]
  44. Materechera, S.A.; Alston, A.M.; Kirby, J.M.; Dexter, A.R. Influence of Root Diameter on the Penetration of Seminal Roots into a Compacted Subsoil. Plant Soil 1992, 144, 297–303. [Google Scholar] [CrossRef]
  45. Popova, L.; van Dusschoten, D.; Nagel, K.A.; Fiorani, F.; Mazzolai, B. Plant Root Tortuosity: An Indicator of Root Path Formation in Soil with Different Composition and Density. Ann. Bot. 2016, 118, 685–698. [Google Scholar] [CrossRef] [PubMed]
  46. Zhou, Z.; Wang, Y.; An, Z.; Li, R.; Xu, Y.; Zhang, P.; Yang, Y.; Wang, T. Deep Root Information “Hidden in the Dark”: A Case Study on the 21-m Soil Profile of Robinia pseudoacacia in the Critical Zone of the Chinese Loess Plateau. CATENA 2022, 213, 106121. [Google Scholar] [CrossRef]
  47. Hicks Pries, C.E.; Sulman, B.N.; West, C.; O’Neill, C.; Poppleton, E.; Porras, R.C.; Castanha, C.; Zhu, B.; Wiedemeier, D.B.; Torn, M.S. Root Litter Decomposition Slows with Soil Depth. Soil Biol. Biochem. 2018, 125, 103–114. [Google Scholar] [CrossRef]
  48. Han, S.H.; Kim, S.; Chang, H.; Kim, H.-J.; Khamzina, A.; Son, Y. Soil Depth- and Root Diameter-Related Variations Affect Root Decomposition in Temperate Pine and Oak Forests. J. Plant Ecol. 2019, 12, 871–881. [Google Scholar] [CrossRef]
  49. Chen, Y.; Zhang, Y.; Cao, J.; Fu, S.; Wang, J.; Lambers, H.; Liu, Z. Divergent Responses of Fine Root Decomposition to Removal of Understory Plants and Overstory Trees in Subtropical Eucalyptus Urophylla Plantations. Plant Soil 2022, 476, 639–652. [Google Scholar] [CrossRef]
  50. Pregitzer, K.S.; Laskowski, M.J.; Burton, A.J.; Lessard, V.C.; Zak, D.R. Variation in Sugar Maple Root Respiration with Root Diameter and Soil Depth. Tree Physiol. 1998, 18, 665–670. [Google Scholar] [CrossRef] [PubMed]
  51. Birouste, M.; Kazakou, E.; Blanchard, A.; Roumet, C. Plant Traits and Decomposition: Are the Relationships for Roots Comparable to Those for Leaves? Ann. Bot. 2012, 109, 463–472. [Google Scholar] [CrossRef]
  52. Donovan, L.A.; Mason, C.M.; Bowsher, A.W.; Goolsby, E.W.; Ishibashi, C.D.A. Ecological and Evolutionary Lability of Plant Traits Affecting Carbon and Nutrient Cycling. J. Ecol. 2014, 102, 302–314. [Google Scholar] [CrossRef]
  53. Smith, S.W.; Woodin, S.J.; Pakeman, R.J.; Johnson, D.; van der Wal, R. Root Traits Predict Decomposition across a Landscape-Scale Grazing Experiment. New Phytol. 2014, 203, 851–862. [Google Scholar] [CrossRef]
  54. Wang, W.; Zhang, X.; Tao, N.; Ao, D.; Zeng, W.; Qian, Y.; Zeng, H. Effects of Litter Types, Microsite and Root Diameters on Litter Decomposition in Pinus sylvestris Plantations of Northern China. Plant Soil 2014, 374, 677–688. [Google Scholar] [CrossRef]
  55. Djukic, I.; Kepfer-Rojas, S.; Schmidt, I.K.; Larsen, K.S.; Beier, C.; Berg, B.; Verheyen, K.; Caliman, A.; Paquette, A.; Gutiérrez-Girón, A.; et al. Early Stage Litter Decomposition across Biomes. Sci. Total Environ. 2018, 628–629, 1369–1394. [Google Scholar] [CrossRef] [PubMed]
  56. Harmon, M.E.; Silver, W.L.; Fasth, B.; Chen, H.; Burke, I.C.; Parton, W.J.; Hart, S.C.; Currie, W.S. Lidet Long-Term Patterns of Mass Loss during the Decomposition of Leaf and Fine Root Litter: An Intersite Comparison. Glob. Chang. Biol. 2009, 15, 1320–1338. [Google Scholar] [CrossRef]
  57. Hobbie, S.E.; Oleksyn, J.; Eissenstat, D.M.; Reich, P.B. Fine Root Decomposition Rates Do Not Mirror Those of Leaf Litter among Temperate Tree Species. Oecologia 2010, 162, 505–513. [Google Scholar] [CrossRef] [PubMed]
  58. Liu, H.; Lin, L.; Wang, H.; Zhang, Z.; Shangguan, Z.; Feng, X.; He, J.-S. Simulating Warmer and Drier Climate Increases Root Production but Decreases Root Decomposition in an Alpine Grassland on the Tibetan Plateau. Plant Soil 2021, 458, 59–73. [Google Scholar] [CrossRef]
  59. Santonja, M.; Milcu, A.; Fromin, N.; Rancon, A.; Shihan, A.; Fernandez, C.; Baldy, V.; Hättenschwiler, S. Temporal Shifts in Plant Diversity Effects on Carbon and Nitrogen Dynamics During Litter Decomposition in a Mediterranean Shrubland Exposed to Reduced Precipitation. Ecosystems 2019, 22, 939–954. [Google Scholar] [CrossRef]
  60. Guerrero-Ramírez, N.R.; Craven, D.; Messier, C.; Potvin, C.; Turner, B.L.; Handa, I.T. Root Quality and Decomposition Environment, but Not Tree Species Richness, Drive Root Decomposition in Tropical Forests. Plant Soil 2016, 404, 125–139. [Google Scholar] [CrossRef]
  61. Prieto, I.; Stokes, A.; Roumet, C. Root Functional Parameters Predict Fine Root Decomposability at the Community Level. J. Ecol. 2016, 104, 725–733. [Google Scholar] [CrossRef]
  62. Chapin, F.S., III; Zavaleta, E.S.; Eviner, V.T.; Naylor, R.L.; Vitousek, P.M.; Reynolds, H.L.; Hooper, D.U.; Lavorel, S.; Sala, O.E.; Hobbie, S.E.; et al. Consequences of Changing Biodiversity. Nature 2000, 405, 234–242. [Google Scholar] [CrossRef]
  63. Ohashi, M.; Makita, N.; Katayama, A.; Kume, T.; Matsumoto, K.; Kumagai, T.; Endo, I.; Kho, L.K. Characteristics of Root Decomposition Based on in Situ Experiments in a Tropical Rainforest in Sarawak, Malaysia: Impacts of Root Diameter and Soil Biota. Plant Soil 2019, 436, 439–448. [Google Scholar] [CrossRef]
  64. Camiré, C.; Côté, B.; Brulotte, S. Decomposition of Roots of Black Alder and Hybrid Poplar in Short-Rotation Plantings: Nitrogen and Lignin Control. Plant Soil 1991, 138, 123–132. [Google Scholar] [CrossRef]
  65. Zhuang, L.; Yang, W.; Wu, F.; Tan, B.; Zhang, L.; Yang, K.; He, R.; Li, Z.; Xu, Z. Diameter-Related Variations in Root Decomposition of Three Common Subalpine Tree Species in Southwestern China. Geoderma 2018, 311, 1–8. [Google Scholar] [CrossRef]
  66. Sun, T.; Mao, Z.; Han, Y. Slow Decomposition of Very Fine Roots and Some Factors Controlling the Process: A 4-Year Experiment in Four Temperate Tree Species. Plant Soil 2013, 372, 445–458. [Google Scholar] [CrossRef]
  67. Wang, P.; Guo, J.; Xu, X.; Yan, X.; Zhang, K.; Qiu, Y.; Zhao, Q.; Huang, K.; Luo, X.; Yang, F.; et al. Soil Acidification Alters Root Morphology, Increases Root Biomass but Reduces Root Decomposition in an Alpine Grassland. Environ. Pollut. 2020, 265, 115016. [Google Scholar] [CrossRef] [PubMed]
  68. Reich, P.B. The World-Wide ‘Fast–Slow’ Plant Economics Spectrum: A Traits Manifesto. J. Ecol. 2014, 102, 275–301. [Google Scholar] [CrossRef]
  69. Sun, T.; Dong, L.; Zhang, L.; Wu, Z.; Wang, Q.; Li, Y.; Zhang, H.; Wang, Z. Early Stage Fine-Root Decomposition and Its Relationship with Root Order and Soil Depth in a Larix Gmelinii Plantation. Forests 2016, 7, 234. [Google Scholar] [CrossRef]
Figure 1. Location map: (a) thumbnail of a map of China; (b) Location map of the Xia Shu Forestry Field; (c) The sample site was located in the Cunninghamia lanceolata and Pinus taeda L. plantations in the old mill area of Xia Shu Forestry.
Forests 14 01092 g001
Figure 2. Traditional RSA: (a) Volume fraction of roots; (b) Length of roots; (c) Width of roots; (d) Breadth of roots; (e) Thickness of roots; (f) Volume of roots; (g) Surface area of roots; (h) Voxel Surface area of roots; (i) OrientationPhi angle of roots; (j) OrientationTheta angle of roots (Note: uppercase letters indicate significant differences between different soil layers (p ≤ 0.05); the light blue columns indicate the Cunninghamia lanceolata plantation; dark blue columns indicate the Pinus taeda L. plantation.
Forests 14 01092 g002
Figure 3. CT-based RSA: (a) Shape factor of roots; (b) Tortuosity of roots; (c) Fractal dimension of roots; (d) EqDiameter of roots; (e) Flatness of roots; (f) Euler of roots. (Note: uppercase letters indicate significant differences between different soil layers (p ≤ 0.05); the light blue columns indicate the Cunninghamia lanceolata plantation; dark blue columns indicate the Pinus taeda L. plantation.
Forests 14 01092 g003
Figure 4. Connectivity of roots: (a) Number of roots; (b) Number of root connections; (c) Number of root throats; (d) Surface area of root throats; (e) Length of root throats; (f) Throat EqDiameter of roots. (Note: uppercase letters indicate significant differences between different soil layers (p ≤ 0.05); the light blue columns indicate the Cunninghamia lanceolata plantation; dark blue columns indicate the Pinus taeda L. plantation.
Forests 14 01092 g004
Figure 5. (a) Root decomposition rate; (b) Root biomass; (Note: uppercase letters indicate significant differences between different soil layers (p ≤ 0.05); the light blue columns indicate the Cunninghamia lanceolata plantation; dark blue columns indicate the Pinus taeda L. plantation.
Forests 14 01092 g005
Figure 6. Pearson correlation between forest type, soil layer, the root decomposition rate, traditional RSA, CT-based RSA, and connectivity of roots, *** indicates a significant correlation at p ≤ 0.001, ** indicates a significant correlation at p ≤ 0.01, * indicates a significant correlation at p ≤ 0.05.
Forests 14 01092 g006
Figure 7. The contribution of soil layers and the root decomposition rate under different forest types and different soil layers: (a) Cunninghamia lanceolata; (b) Pinus taeda; (c) 0–10 cm soil layer; (d) 10–20 cm soil layer; (e) 20–30 cm soil layer; (f) 30–40 cm soil layer; (g) 40–50 cm soil layer; (h) 50–60 cm soil layer.
Forests 14 01092 g007
Figure 8. (a) Structural equation model (SEM) analysis estimating the direct and indirect effects of the CT scan data of the root on the root decomposition rate. Boxes show variables included in the model. Test results of the goodness-of-model fit Chi-square (2) = 1.063, p-value = 0.588 > 0.05, goodness-of-fit index (GFI) = 0.997 > 0.9, and root square mean error of approximation (RMSEA) = 0.000 < 0.08. Numbers on arrows are standardized path coefficients. The widths of the arrows represent the strength of the relationships. Blue arrows indicate positive relationships, and yellow arrows indicate negative relationships. Solid arrows indicate significance (p < 0.05) and dashed arrows represent non-significance (p > 0.05) (the p-value was calculated in terms of the nonnormalized path). (b) Standardized total effects (direct plus indirect effects) derived from the structural equation models depicted above.
Forests 14 01092 g008
Table 1. Root mass loss rate in different decomposition periods and the root decomposition rate in the test period (Note: uppercase letters indicate significant differences between different soil layers, lowercase letters indicate significant differences between decomposition times (p ≤ 0.05)).
Forest TypeSoil Layer4 Months8 Months12 Months Root Decomposition Rate (Year−1)
Cunninghamia
lanceolata
0–10 cm8.17% (±8.19%) Aa5.78% (±3.80%) Ba4.93% (±4.37%) Aa0.058 (±0.06) A
10–20 cm11.00% (±8.16%) Ab4.66% (±3.73%) Bab4.23% (±3.22%) Aa0.035 (±0.028) A
20–30 cm8.10% (±8.16%) Aa3.83% (±3.73%) ABa4.33% (±3.22%) Aa0.051 (±0.047) A
30–40 cm8.37% (±6.55%) Ab3.33% (±1.44%) ABa2.11% (±1.41%) Aa0.038 (±0.033) A
40–50 cm8.32% (±8.47%) Aa1.25% (±1.36%) Aa4.45% (±7.29%) Aa0.029 (±0.024) A
50–60 cm8.91% (±8.95%) Ab1.65% (±1.13%) Aa 1.05% (±1.47%) Aa0.033 (±0.021) A
Pinus
taeda
0–10 cm14.79% (±9.28%) Ab4.8% (±2.66%) ABa9.92% (±6.04%) Bab0.067 (±0.046) AB
10–20 cm12.00% (±8.73%) Aa8.84% (±5.91%) Ba5.74% (±2.75%) ABa0.083 (±0.055) AB
20–30 cm11.31% (±10.92%) Aa7.91% (±7.53%) Ba4.41% (±3.99%) ABa0.051 (±0.047) AB
30–40 cm7.18% (±9.77%) Aa3.97% (±3.24%) ABa2.07% (±2.64%) Aa0.086 (±0.063) B
40–50 cm4.40% (±3.54%) Aa1.65% (±1.71%) Aa2.76% (±1.98%) Aa0.066 (±0.045) B
50–60 cm5.82% (±6.34%) Aa5.87% (±6.21%) ABa4.14% (±9.37%) ABa0.034 (±0.026) A
Disclaimer/Publisher’s Note: The statements, opinions and data contained in all publications are solely those of the individual author(s) and contributor(s) and not of MDPI and/or the editor(s). MDPI and/or the editor(s) disclaim responsibility for any injury to people or property resulting from any ideas, methods, instructions or products referred to in the content.

