Article

Evolutionary Processes Shaping Postglacial Gene Pools of High-Altitude Forests: Evidence from the Endemic Eucalypts of Tasmania

by
Rebecca C. Jones
1,2,*,
Peter A. Harrison
1,2,
Corey J. Hudson
1,†,
Cate A. Hirst
1,‡,
Alexander T. Matthews
1,§,
Romuald Rouger
1,‖,
Sascha L. Wise
1,
Julianne M. O’Reilly-Wapstra
1,2,
Robert J. E. Wiltshire
1,
Gregory J. Jordan
1,
René E. Vaillancourt
1,2 and
Brad M. Potts
1,2,*
1
School of Natural Sciences, University of Tasmania, Private Bag 55, Hobart, TAS 7001, Australia
2
Australian Research Council Centre for Forest Value, Private Bag 55, Hobart, TAS 7001, Australia
*
Authors to whom correspondence should be addressed.
Current address: Sun Pharmaceutical Industries (Australia) Pty Ltd., 14 Henry St, Latrobe, TAS 7307, Australia.
Current address: Tasmania Health Service, GPO Box 125, Hobart, TAS 7001, Australia.
§
Current address: Department of Primary Industries, Parks, Water and Environment, P.O. Box 303, Devonport, TAS 7310, Australia.
Current address: Syndicat des Sélectionneurs Avicoles et Aquacoles Français, Centre INRA Val-de-Loire, UMR Biologie des Oiseaux et Aviculture, 37380 Nouzilly, France.
Forests 2023, 14(6), 1072; https://doi.org/10.3390/f14061072
Submission received: 31 March 2023 / Revised: 10 May 2023 / Accepted: 12 May 2023 / Published: 23 May 2023
(This article belongs to the Special Issue Population Genetic and Morphological Diversity of Woody Plants)

Abstract

:
Climatic changes during the Pleistocene were responsible for dramatic redistributions of plant species worldwide. On the rugged southern hemisphere island of Tasmania, temperature increases following the last glaciation saw upslope migration of climatically suitable species from lowland refugia and the expansion of eucalypt-dominated forests and woodlands in the Central Highlands. We integrate multiple lines of evidence (chloroplast and nuclear DNA markers, seedling morphology, and survival in common garden experiments) from a group of closely related endemic eucalypts (the alpine white gums) to argue that (i) the Central Highlands of the island were colonised by multiple glacial refugia with hybridisation among species and previously separated populations, and (ii) natural selection has filtered the admixed populations, resulting in local adaptation to the harsh sub-alpine environment. Chloroplast haplotype diversity decreased and nuclear microsatellite diversity increased with altitude, chloroplast sharing among taxa was common, and nuclear DNA differentiation of morphologically distinct taxa was lower in the Central Highlands compared with lowland regions. Local adaptation in the highlands was signalled by evidence from (i) a glasshouse trial in which directional selection (QST > FST) had shaped seedling morphological trait variation and (ii) population survival differences in 35-year-old reciprocal plantings along the major environmental gradients. We conclude that the evolutionary response of these island endemic trees to past climate change has involved the interplay of both hybridisation and natural selection, highlighting the importance of maintaining species interactions under future climate change.

1. Introduction

Climatic change associated with the Pleistocene glaciations was associated with dramatic redistributions of forest tree species in temperate regions of the world [1]. Contemporary species distributions and patterns of genetic diversity in many forest species are well explained by migration to higher altitudes and higher latitudes from the Last Glacial Maximum (LGM; ~30 to 17 ka) forest refugia [1,2,3,4,5,6], though some species do persist in historically stable or conserved niches [7]. Such range shifts are likely to have involved different evolutionary dynamics at the leading and trailing edges of the species distribution, particularly when the leading edge involved the colonisation of treeless landscapes [2,3,8,9,10]. While drift and selection are clearly important in both the leading and trailing edge scenarios in numerous plant and animal species, in forest trees, hybridisation is also commonly involved [4,11,12,13]. Forest tree species often form hybridising networks of multiple species [14,15], and postglacial hybridisation may occur following secondary contact of previously isolated populations [16,17,18,19] and species [20,21]. Hybridisation may also become more significant due to climate-driven changes in the fitness of parapatric species at the trailing and leading edges of the species distribution [22,23,24]. In such cases, introgression may introduce novel adaptations [4,13,25,26], and in more extreme cases may result in the complete introgressive displacement of the least fit species [27,28], especially when seed dispersal is limited compared with pollen dispersal [29].
Molecular studies, particularly those tracking maternally inherited chloroplast DNA markers, have long been used to provide evidence for glacial refugia, postglacial migration routes, and hybridisation in forest trees in temperate regions of the world (involving, for example, multiple species [30] such as Acer [31], Juglans [16], Picea [19], Populus [20], and Quercus [6,27,32,33] in the northern hemisphere, and Nothofagus [34,35] and Eucalyptus [36,37,38] in the southern hemisphere). In addition, there is increasing evidence of the role of natural selection in shaping contemporary patterns of genetic variation in forest tree species, including from quantitative genetic studies performed in common garden field trials [4,39,40]. Such evidence for directional selection acting on functional traits may come from studies showing higher population divergence than expected due to drift (i.e., QST > FST, [41]) or from genetic–environment associations [8,42,43]. Evidence for adaptive differences among populations, as well as local adaptation, may come from differences in performance and ultimately fitness in common garden trials, ideally planted along environmental gradients [4,44,45]. While there are many forest tree studies utilising one or other of these approaches to understand the contemporary patterns of genetic variation in forest tree species, there are few integrative studies combining molecular and quantitative approaches.
The present study uses these diverse approaches to provide insights into the evolutionary processes that have shaped the postglacial patterns of variation in populations of a closely related complex of eucalypt species, the alpine white gums, which are endemic to the island of Tasmania, Australia. Current vegetation patterns in Tasmania have been strongly influenced by past climate change [46,47,48], leading to both the redistribution and extinction of species [36,49]. The Central Highlands region of Tasmania was subject to glacial and periglacial activity during the Pleistocene [50], and during the LGM, it is thought that most of this region was uninhabitable by trees [36,48]. Eucalypt species are thought to have been restricted to climatically suitable lowland glacial refugia [51], such as the southeastern glacial refugia, which is supported by molecular data [36,38]. The retreat of the Tasmanian icecap with rising temperatures and precipitation at the end of the last glaciation would have facilitated the migration of eucalypts out of refugial areas, potentially allowing secondary contact in central regions of the island between previously isolated populations and taxa [52]. The patterns of eucalypt distribution and genetic variation seen today in the Central Highlands of Tasmania are therefore likely the result of recent (beginning approximately 13,000 years ago) postglacial population expansion and migration into this newly available habitat.
The alpine white gum group of eucalypts (Eucalyptus subg. Symphyomyrtus sect. Maidenaria ser. Tasmaniae D.Nicolle & R.Jones [53]) studied here consists of seven taxa endemic to Tasmania: E. archeri Maiden & Blakely, E. gunnii Hook.f. subsp. gunnii, E. gunnii subsp. divaricata (McAulay & Brett) B.M.Potts, E. urnigera Hook.f., E. cordata Labill. subsp. cordata, E. cordata subsp. quadrangulosa D.Nicolle, B.M.Potts & McKinnon, and E. morrisbyi Brett. These taxa are currently distributed in both the newly occupied Central Highlands region at an average altitude above 1000 m a.s.l. (E. archeri, E. gunnii and E. urnigera) and in putative lowland glacial refugial areas in southeastern (E. cordata, E. morrisbyi, E. gunnii, E. urnigera) and northern (E. gunnii) Tasmania (Figure 1). The relationships between these taxa are poorly resolved even when using high-coverage molecular markers such as AFLP [54] or DArT [55,56]. In a phylogenetic analysis [56], these taxa were found not to be monophyletic, with, for example, several samples morphologically affiliated with E. urnigera showing closer molecular affinities to samples of E. gunnii subsp. divaricata than to E. urnigera. There are also complex patterns of clinal morphological variation involving E. archeri and E. gunnii intergrading along a latitudinal gradient in the Central Highlands [57]. Parallel clines in several characters, most notably leaf and stem waxy glaucousness, result in a north–south continuum between high-altitude E. archeri (green phenotype) and E. gunnii subsp. divaricata (glaucous phenotype), while an east–west altitudinal cline in leaf form connects E. gunnii subsp. divaricata (high-altitude form, with smaller, thicker leaves) and lower-altitude E. gunnii subsp. gunnii [57]. These complex clines linking taxa in the Central Highlands contrast with the patterns of variation in the southeast lowlands of Tasmania, where locally co-occurring alpine white gum species are usually morphologically and ecologically well-differentiated. In the southeast, these species occupy distinct ecological habitats, with the more frost-resistant E. gunnii occurring in poorly drained, frost-prone habitats, whereas E. urnigera and E. cordata occur on the better-drained, less-frost-prone surrounding slopes [58].
Here, we compare the patterns of variation in chloroplast and nuclear DNA markers within and between species of the alpine white gum complex in the Central Highlands with that in lowland glacial refugia of southeastern Tasmania. These molecular data are then combined with quantitative data from a glasshouse trial and a 35-year-old reciprocal common garden experiment to better understand the role of hybridisation and selection in shaping the current patterns of variation in the alpine white gum species complex in the Tasmanian Central Highlands.

2. Materials and Methods

2.1. Molecular Markers

Both nuclear and maternally inherited chloroplast (cpDNA) markers were used to study population diversity and affinities, and spatial patterns of variation were compared to provide evidence for hybridisation. Leaf tissue for molecular studies was sampled from 20 to 30 trees at each of the 55 populations, representing the seven terminal taxa of the alpine white gum complex (Figure 2, Supplementary Table S1). The sampled trees were separated from each other by a distance of at least twice the average canopy height of mature trees within a population to avoid sampling family groups. Leaf tissue was ground in liquid nitrogen using either a mortar and pestle or a single tungsten carbide bead in a 1.2 mL sample tube in a Mixer Mill MM400 (Retsch Ltd., Haan, Germany). Total genomic DNA was then extracted using either a DNeasy Plant Mini-kit (Qiagen, Melbourne, Vic., Australia) or the CTAB method of Doyle and Doyle [59] with several modifications [60].

2.2. Chloroplast Sequencing

Of the 20 to 30 trees sampled, around 5 (mode 5, minimum 3, maximum 12, see Supplementary Table S1) random but geographically well-spaced trees from each of the 55 populations were chosen for sequencing the hypervariable JLA+ region of cpDNA (~630 bp) [61], which is maternally inherited [62]. Polymerase chain reactions (PCRs) were performed as in Freeman et al. [61] except using 2.5 mM MgCl2, 0.15 µM of each primer, 1 unit of MangoTaq polymerase (Bioline, Alexandria, NSW, Australia), and deionised MilliQ water to 25 μL, and the following program: 95 °C for 5 min; 30 cycles consisting of 94 °C for 60 s, 61 °C for 60 s, and 72 °C for 60 s; 72 °C for 5 min. Purification and sequencing of PCR products were performed by Macrogen Inc. (Seoul, Republic of Korea) using an AB3730 DNA Analyser (Applied Biosystems, Foster City, CA, USA) and analysed using Sequencher version 4.7 (Gene Codes Corp., Ann Arbor, MI, USA) and CLC Workbench version 4 (CLC Bio, Aarhus, Denmark). JLA+ sequences from McKinnon et al. [60] were used for some populations. Haplotype scoring and phylogenetic relationships among haplotypes followed Freeman et al. [61], and new haplotype sequences were lodged in GenBank (JQ713790-JQ713807). A haplotype character matrix was used to generate a distance matrix among haplotypes using PAUP version 4.0a169 [63], which was used to generate a haplotype network using TCS 1.21 [64]. Four of the JLA+ characters were either too variable to be phylogenetically informative in these species, or were homoplasious. These characters enabled fine discrimination among haplotypes, but their inclusion produced a complicated cross-linked haplotype network (data not shown). Removing such characters gave an overly simplified representation of the variation, meaning that haplotypes could not be clearly assigned as “tip” (derived) haplotypes. However, whether these characters were retained or removed, common haplotypes such as JCc56 and JS43 were always interior (basal) in the network, consistent with previous studies [60], and JCc36 appeared to be a “tip” haplotype (data not shown).

2.3. Nuclear Affinities and Diversity

Microsatellite primer pairs developed in E. grandis (prefix EMBRA; [65,66,67]) and E. globulus (prefix EMCRC; [68]) were used. For each sample, 13 microsatellite loci (Supplementary Table S2) were amplified by PCR in three multiplex mixes using a QIAGEN Multiplex PCR kit (QIAGEN, Clayton, Victoria, Australia) as in Harrison et al. [55]. PCR products were diluted 1 in 10, and 1 µL of diluted PCR product was dried and sent to the Australian Genome Research Facility, South Australia, for sizing using an AB3730 DNA Analyser (Applied Biosystems, Foster City, CA, USA). Allele sizes at each locus were estimated in GeneMapper version 3.7 (Applied Biosystems, USA) using GS-500(-250) LIZ as a size standard. Data for E. cordata came from Harrison et al. [55]. In the rare cases where clonal genotypes were detected (due to fracturing of the underground lignotuber in E. morrisbyi, data not shown), one sample from each clonal patch was retained, resulting in a total sample size of 1313 individual genotypes. One hundred and four samples were repeated to estimate repeatability of microsatellite sizing, with an error rate of 2.8% detected (data not shown). These microsatellite loci had been tested for null allele frequency previously in E. cordata [55].
Population genetic diversity parameters were calculated using GenAlEx [69,70] and averaged across populations and loci. These included the observed number of alleles (A), observed heterozygosity (Ho), and expected heterozygosity (He). Wright’s Fixation Index (F) was also calculated for each population. Allelic richness (Rt), a measure of the number of alleles per locus rarefied to a minimum sample size of 12 individuals per population, was calculated in FSTAT version 2.9.3.2 [71], and averaged across each population. To test whether the hypothesised recolonisation of the Central Highlands region was accompanied by a loss (or otherwise) of genetic diversity, allelic richness per population was plotted against altitude, with Pearson’s correlation coefficient calculated using the cor.test function in R (R Core Team 2019). F-statistics [72] per locus were also calculated in FSTAT, with 95% confidence intervals derived from 1000 bootstraps. Pairwise FST was also calculated between populations within each species, and separately among the 13 central highland populations (E. gunnii, E. urnigera and E. archeri) and 6 refugial populations of these taxa, as well as for the 10 central highland populations for which nuclear molecular and morphological data were available (see Supplementary Table S1) for comparison with QST (see below). To compare the molecular differences between E. gunnii and E. urnigera in locations where morphologically distinctive populations co-occur in proximal habitats, pairwise FST was calculated at four sites: (1) E. gunnii subsp. divaricata vs. E. urnigera at Jemmy’s Marsh (G18 vs. U3); (2) E. gunnii subsp. gunnii vs. E. urnigera at Lake Echo (G7 vs. U1); (3) E. gunnii subsp. gunnii vs. E. urnigera at Broad River Marshes (G9 vs. U7); (4) E. gunnii subsp. gunnii vs. E. urnigera at Snug Plains (G10 vs. U12) (Figure 2).
Focusing on the taxa co-occurring in the Central Highlands, the genetic affinities of individuals and populations of E. archeri, E. gunnii, and E. urnigera (32 populations; 746 individuals) were investigated using STRUCTURE version 2.3.4 [73,74,75,76], to elucidate the number of ancestral clusters (K) and the proportion of each individual’s genome assigned to each of the K groups (q). Assuming no a priori population groupings, the Bayesian model was run for 200,000 MCMC iterations (following a burn-in of 200,000 MCMC iterations) using the admixture model and correlated allele frequencies, from K = 1 to K = 14, with 10 independent runs for each value of K. Due to multimodality across runs at K = 4 (data not shown), an additional 10 runs were conducted for this K. The five highest likelihood runs were used to estimate the number of ancestral clusters by examining the log probability of the data (ln Pr(X|K)) and ΔK in STRUCTURE HARVESTER [77,78]. The Greedy algorithm of CLUMPP [79] was used to derive a single output from the five independent runs at each K from K = 2 to K = 7 and visualised using DISTRUCT [80].
Since the above STRUCTURE analyses revealed low differentiation among individuals and populations in the Central Highlands, and a small but significant FST among 13 Central Highlands populations had been revealed in earlier statistical tests, additional STRUCTURE analyses were conducted using the LOCPRIOR model as recommended for datasets with a weak population structure [75]. Using the above dataset but excluding geographic outliers and genetically divergent populations of E. gunnii and E. urnigera at Mt Arthur, Mt Seymour, Den Hill, Mt Bounty, Weilangta Hill, and Maria Island (i.e., 26 populations; 614 individuals), analyses were run using the same parameters outlined above but with the LOCPRIOR model. The number of clusters was estimated by examining the log probability of the data (ln Pr(X|K)) and ΔK in STRUCTURE HARVESTER [77,78]. The Greedy algorithm in CLUMPP [79] was used to derive a single output from the five independent runs at each K from K = 2 to K = 7, and these were visualised using CLUMPAK [81]. The population affinities (i.e., average of the individual Q-values in each population) for K = 3 were also spatially visualised.

2.4. Glasshouse Progeny Trial

To examine the quantitative genetic differences among (QST) and within the populations in the Central Highlands and test for signals of selection and local adaptation, we grew progeny collected from 15 natural Central Highlands populations of the three focal species including both subspecies of E. gunnii (Supplementary Table S1) in the glasshouse and measured morphological traits. Open-pollinated seed was collected from 9 to 11 adult trees per population. Seedlings were potted into individual pots (5 cm × 5 cm × 12 cm) and arranged into 10 randomised blocks with each mother represented once per block where possible. All plants were grown in a glasshouse under natural light conditions with daily watering. At 2 months, the seedling cotyledons were scored for anthocyanin expression by visually categorising the degree of red pigmentation (0 = green; 4 = deep purple) on the abaxial surface of the cotyledon. The leaf node at which the expression of anthocyanin was no longer evident was also recorded for each seedling. At 4 months, up to 5 seedlings per family were measured for 10 leaf traits, 5 stem traits, and 7 other overall plant traits (see Table 1). Leaf traits were estimated using the WinFOLIA program (Regent Instruments Inc., Quebec, QC, Canada) (Supplementary Figure S1).
Quantitative genetic variation in morphological traits determined by growing seedlings in a common environment (glasshouse) was analysed using individual seedling data for the ten populations for which microsatellite data were available (see Supplementary Table S1). Traits were transformed where necessary to better meet linearity and normality assumptions or treated as binary traits (Table 1). To test for differences among the 10 populations and estimate least-squares means, a mixed model was fitted to the data, treating population as a fixed effect and glasshouse block and additive genetic effects within populations as random effects using ASReml [82]. Following Gauli et al. [83], the additive genetic variance was estimated using a pedigree file to define the numerator relationship matrix for parents and their open-pollinated progeny. In our case, the relationship matrix was modified to allow for an average outcrossing rate of 70% (common when using open-pollinated eucalypt families [84]; see also discussion in [85]) and a base population level inbreeding equivalent to the average microsatellite FIS estimate for 10 populations. Binary traits were analysed by fitting the same model with a logit link function. The difference among populations was tested using a Wald F test.
To evaluate whether seedling morphological traits exhibit a signal of spatially divergent selection (i.e., QST > FST; [41]) and estimate population divergence in quantitative traits, the population quantitative inbreeding coefficient QST was calculated following Latta [86] and Yang et al. [87]. This was undertaken using ASReml and the mixed model described above but with population fitted as a random term. The estimate of the additive and residual variances obtained from these models was used to calculate within-population, narrow-sense heritabilities (h2op), following Gauli et al. [83]. Standard errors for QST and h2op were calculated using an expanded Taylor series [82]. One-tailed likelihood ratio tests (LRTs) were used to test whether the additive genetic variance estimates exceeded 1 and whether QST exceeded the maximum FST (0.044, calculated using the microsatellite data for the same 10 populations). The LRTs for QST > FST followed Dutkowski and Potts [42] and were applied to all but the binary traits, which were tested using a Z test [88].
A discriminant analysis based on individual data and 9 key discriminating variables (with P[QST > FST] < 0.01) was undertaken using PROC DISCRIM of SAS (version 9.4) to summarise the pattern of putative adaptive phenotypic variation among populations, which was displayed by ordination of the first two discriminant axes (CV1 and CV2). Climatic (see below) and morphological (Table 1) variables were fitted into this ordination space using the “envfit” function of the vegan package [89] in R (R Core Team, 2019), and significant vectors were plotted to visualise co-occurring patterns of variation.
Genetic correlations between pairs of traits were calculated at the population and additive genetic levels using bivariate models fitted in ASReml following Gauli et al. [83]. The genetic correlations were only calculated for the traits where QST significantly (p < 0.01) exceeded the maximum FST, and within-population additive genetic variance was significant (p < 0.05). The variance components and correlations were estimated with the fully random model used for QST calculations, with the exception that all 15 populations with quantitative data were included. Two-tailed LRTs were used to test whether correlations were significantly different from zero, undertaken by constraining the specific correlation being tested to zero and comparing with the unconstrained model.

2.5. Mantel Association Analyses

To determine the association between distance matrices derived from pairwise FST, taxon affinities, population seedling phenotypes, and geographic and climate distance, Mantel tests were undertaken using the “mantel” function of the ecodist package in R [90]. The significance of the Mantel correlation between these distance matrices was determined using a permutation test by permuting one of the original distance matrices 100,000 times. To derive the climate distance matrix, four bioclimatic variables that reflected temperature extremes (maximum temperature of the warmest week, minimum temperature of the coldest week), precipitation (mean annual precipitation), and light (mean annual solar radiation) were obtained for each population using the geographic coordinates and altitude (Supplementary Table S1) in ANUClim version 6.1 [91]. Bioclimatic variables were standardised to a unit variance prior to calculating the Euclidean distance between populations. The geographic distance between populations was also estimated as the great circle distance using the geographic coordinates and the Haversine method implemented by the “rdist.earth” function in the fields package in R [92]. The seedling phenotype distance matrix was derived as the Euclidean distance between populations using all CV axes from the discriminant analysis (see above), which effectively reflects the Mahalanobis distance between populations. The taxon affinities matrix was generated by assigning populations based on field treatment of the population (based mainly on visual assessment of adult leaf and capsule morphology as well as foliage glaucousness; e.g., [57]) rather than the seedling phenotype, where populations from the same species were assigned the value of 1 irrespective of subspecies treatment and a 0 if they were from different species or intermediate populations.

2.6. Reciprocal Common Garden Trials

In 1979, two-year old seedlings were transplanted into fenced reciprocal experimental gardens established at the extremes of the altitudinal (Liawenee High—1150 m vs. Pensford—960 m) and latitudinal (Shannon Lagoon—1050 m vs. Projection Bluff High—1100 m) clines in the Central Highlands to test for local adaptation. At each site, 12 seedlings originating from 6 mother trees (two per mother) from each of the same 4 sites (E. archeri from Projection Bluff High (A4), E. gunnii subsp. divaricata from Liawenee High (G13), and Shannon Lagoon (G15), E. gunnii subsp. gunnii from Pensford (G6) plus E. archeri from a lower-altitude (990 m) site at Projection Bluff Low (A5)) were planted 1 m apart in two 6 × 6 Latin squares (see [93]). The populations are the phenotypic extremes of two clines within the E. gunniiE. archeri complex: a north–south cline between E. archeri (Projection Bluff) and E. gunnii subsp. divaricata (Shannon Lagoon) that is associated with the transition from a subalpine, mixed eucalypt/rainforest on the northern scarp of the Central Highlands (Western Tiers) to the open woodland habitat bordering “frost hollows” around Great Lake within the Central Highlands. The altitudinal cline is an east–west cline associated with exposure to the alpine environment (i.e., from the low-altitude Pensford population to the high-altitude Liawenee High population) [93]. The survival of each individual was monitored 14 times between 1979 and 2015.

3. Results

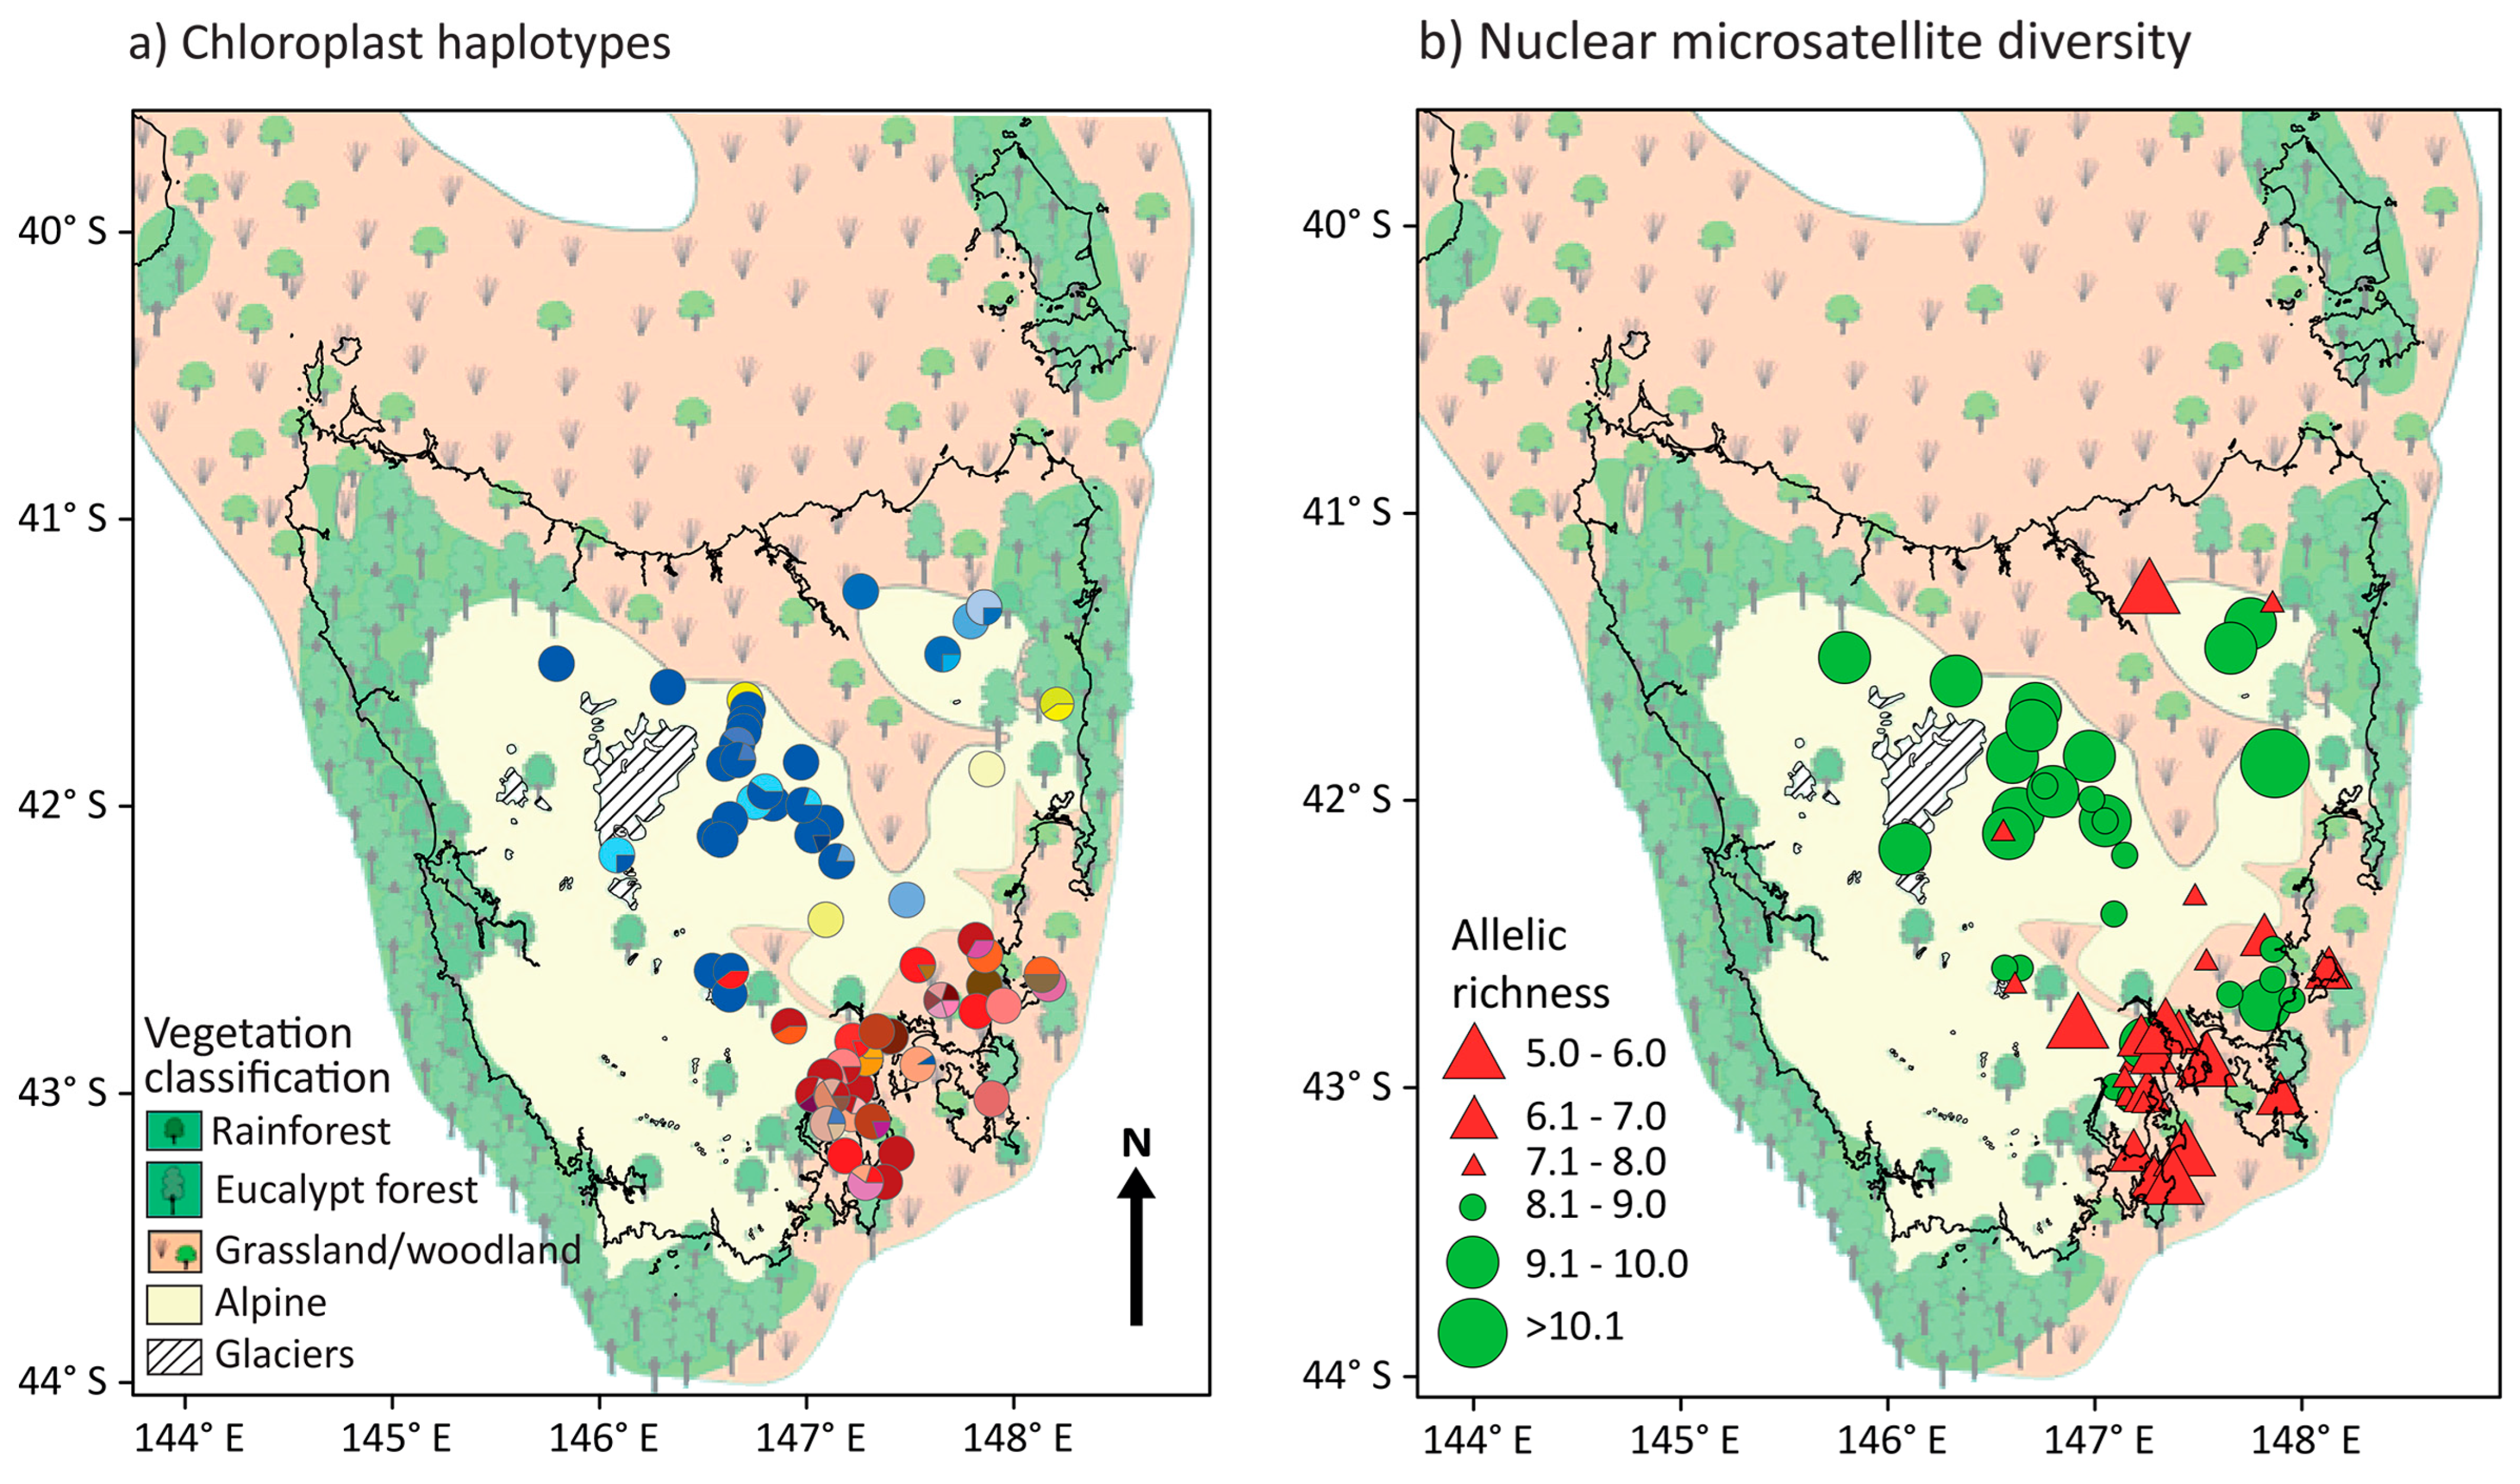
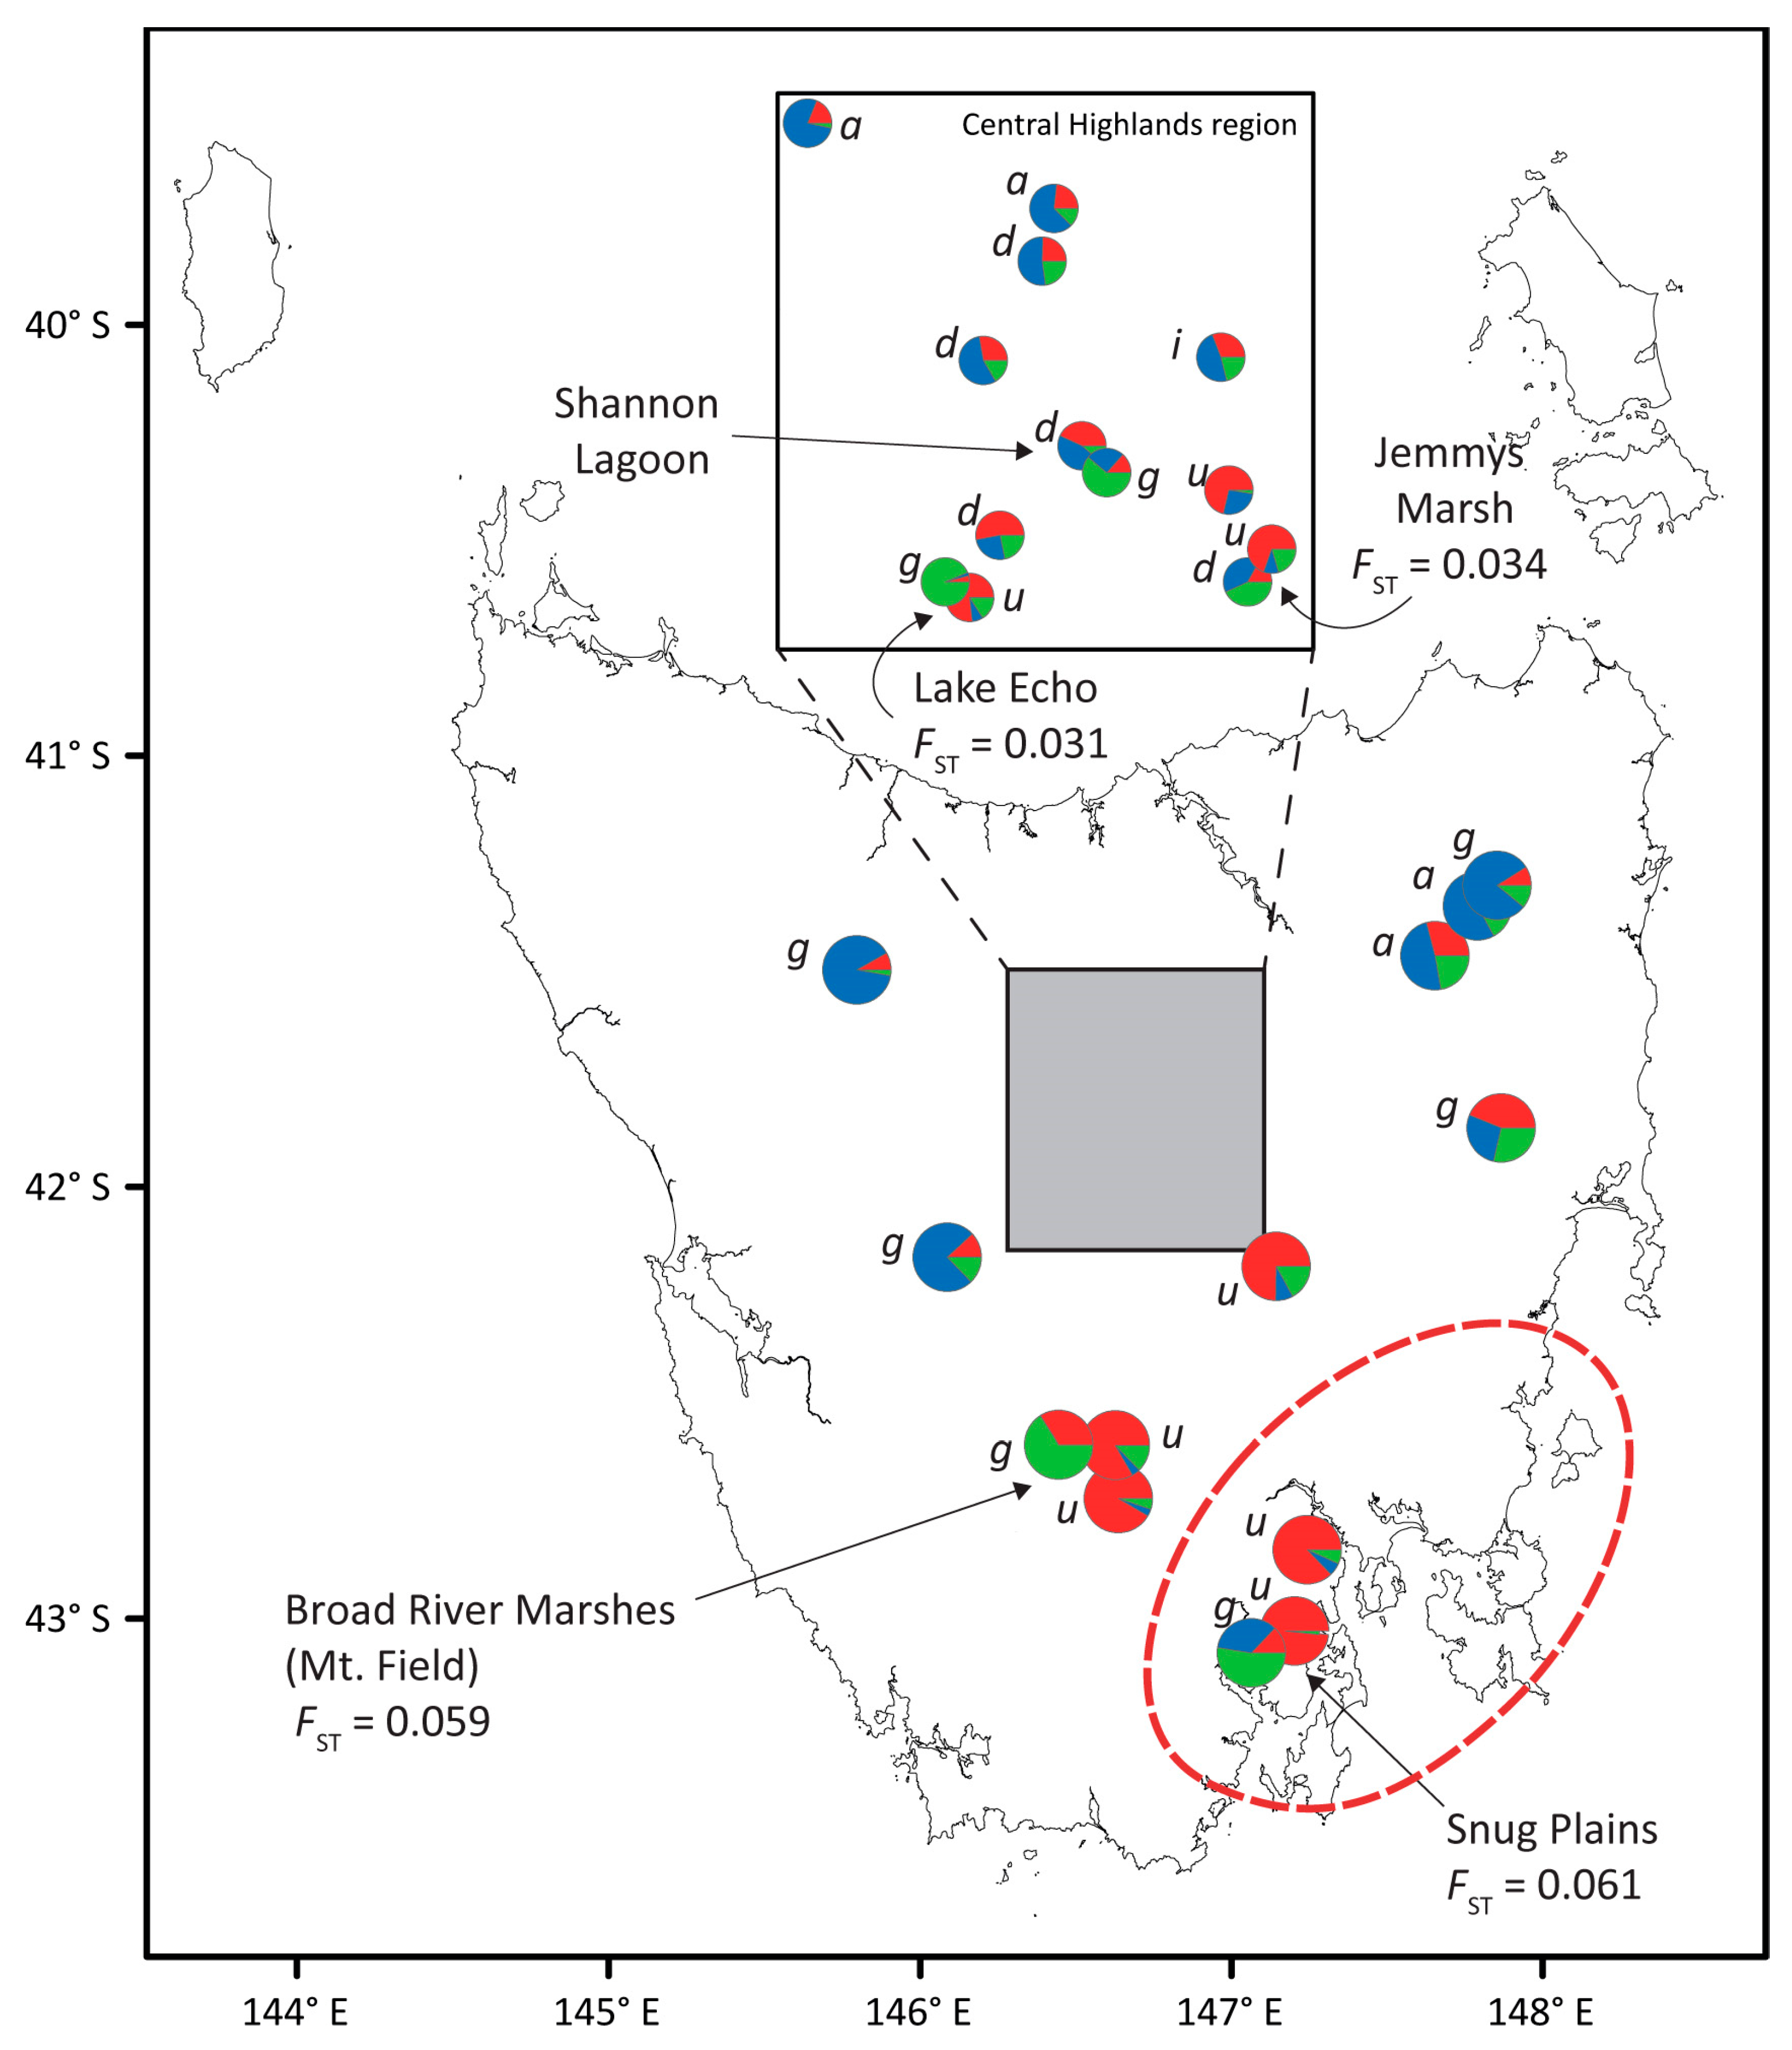
3.1. Chloroplast Haplotype Diversity

We sequenced the hypervariable JLA+ region of the maternally inherited chloroplast genome to compare the alpine white gum populations of two areas: putative glacial refugia (mostly lowlands, see Supplementary Table S1) vs. those in the putative newly colonised Central Highlands. This resulted in the identification and characterisation of 51 unique haplotypes (Figure 3a, Supplementary Table S3). Four notable results emerged from the chloroplast data.
First, we found little overlap in broad haplotype groups between the two areas. Regardless of species, haplotypes of the “Southern” (JS) clade were restricted to the putative glacial refugia in southeastern Tasmania, whereas haplotypes in the rest of Tasmania belonged to the “Central” (JC) or the rarer “Eastern Tasmanian” (JET) clades (Figure 3a). The only noteworthy case of inland overlap between these clades was in the Mt Field area, where the lower-altitude population of E. urnigera (U7, Broad River Marshes in Figure 4) was polymorphic for a Southern haplotype (JS41, red in Figure 3a) and the most widespread haplotype in the Central Highlands JCc56 (blue in Figure 3a) (Supplementary Table S3). We also found there were no shared haplotypes between the Central Highlands, the southeastern refugium, and the northeastern region of Tasmania. While the northeastern region was dominated by haplotypes of the Central clade, it had no shared haplotypes with individuals from populations across the Central Highlands.
Second, chloroplast DNA haplotype diversity was higher in the putative south-eastern glacial refugium than in the expansive Central Highlands (Figure 3a). This reduced haplotype diversity occurred at both the regional and population level, despite populations in the highlands tending to be larger and more continuously distributed than populations in the southeastern refugium. We found 39 haplotypes (2 JC and 37 JS) in the southeastern glacial refugium but only 5 haplotypes (4 JC and 1 Jet) in the Central Highlands, with a large portion of this area dominated by a single haplotype (JCc56) (Supplementary Table S3). While many populations in both areas appeared fixed for a single haplotype, the maximum haplotype diversity was markedly different, with at most two haplotypes observed per population in the Central Highlands, compared with up to five haplotypes in populations from the putative southeast refugium (Supplementary Table S1). This pattern of reduced haplotype diversity in the Central Highlands is consistent with a historical population bottleneck and subsequent postglacial colonisation of highland areas by seed dispersal.
Third, the spatial distribution of the Central (JC) and Southern (JS) chloroplast clades within the alpine white gums means that the JC haplotypes are dominant in E. gunnii and E. archeri, whereas the JS clade predominates in E. cordata, E. morrisbyi and southern populations of E. urnigera (Supplementary Table S3). The Central clade was represented by eight haplotypes in E. gunnii/archeri but only three haplotypes in E. urnigera and was not found in E. cordata (Supplementary Table S3). The Central haplotypes in E. urnigera were found in northern populations (Mt Field (U7, U8), Mt Seymour (U5), and the Central Highlands (U1–U4)), and in two cases, these are shared with co-occurring (the common JCc56) or proximal (rare haplotype JCc36) E. gunnii populations. In contrast, the Southern clade is represented by 27 haplotypes in E. cordata and 12 haplotypes in E. urnigera, four of which are shared with proximal E. cordata (JS05, JS41, JS43, and JS77). Only two Southern haplotypes were found in E. gunnii. These were rare haplotypes overall, and occur in the southern population at Snug Plains (G10), one of which was only found in this local area (JS84) and is shared with the co-occurring E. cordata (C21 Snug Plains). The E. gunnii population at Snug Plains (G10) also contains a Central haplotype only found in the Central Highlands E. gunnii, which in combination with the more southern and western distribution of the Central clade reported in this taxon by McKinnon et al. [94], signals a historic seed-mediated link to more northern populations.
Fourth, sharing of haplotypes was common in cases where multiple alpine white gum species co-occur in the Central Highlands. For example, at Jemmy’s Marsh, where E. gunnii subsp. divaricata (G18) and E. urnigera (U3) co-occur, the JCc56 haplotype was shared among individuals of both species (Supplementary Table S3). Similarly, JCc56 was also shared among samples of E. gunnii subsp. Gunnii (G7), E. aff. gunnii subsp. divaricata (G17), and E. urnigera (U1) from Lake Echo. This haplotype was widely distributed and commonly shared in the Central Highlands. It was also shared between E. urnigera and E. gunnii subsp. gunnii further south at Mt Field (U7, U8, and G9). Despite sharing the southern clade, no specific haplotype sharing was detected between E. gunnii and E. urnigera in southeast Tasmania, i.e., at Snug Plains (U12 and G10). Proximal populations of E. archeri and E. gunnii occurring in the Central Highlands or the northeastern mountains often shared the same haplotype, but this was a different haplotype in each region (JCc56 and JCc25, respectively). In most cases when haplotype-sharing was detected, it involved the common haplotype JCc56, except in the northeast, where JCc25 was shared in one E. archeri and one E. gunnii population. Sharing of a common haplotype such as JCc56 could arise by incomplete lineage sorting or selection; however, we cannot dismiss chloroplast capture through hybridisation, especially when rare haplotypes are involved. Indeed, chloroplast capture may well explain the sharing of the rare JCc36 among samples of E. gunnii subsp. gunnii (G8), E. gunnii subsp. divaricata (G15 and G16), and E. urnigera (U2) in the southern Central Highlands (Supplementary Table S3), as this is a haplotype (Figure 3a) only found in one population of northern E. urnigera.

3.2. Nuclear Microsatellite Diversity

In contrast to the patterns observed in the chloroplast DNA, putatively neutral nuclear diversity (especially as measured by allelic richness) was generally higher in the more recently colonised Central Highlands than in most lowland areas of southeastern Tasmania (Figure 3b). Across all populations, allelic richness significantly increased linearly with altitude (Supplementary Figure S2; Pearson r = 0.73, p < 0.001) and this same trend was consistent within E. urnigera (Pearson r = 0.67, p = 0.012) and E. gunnii individually (Pearson r = 0.71, p = 0.005). The increase in nuclear diversity in populations of all taxa in the Central Highlands was also associated with poor nuclear differentiation between populations, regardless of the species. For example, the average FST (FST = 0.025 [95% CI 0.020 to 0.030]) calculated for the 13 Central Highlands populations of E. archeri, E. gunnii, and E. urnigera was significantly lower than the average FST (FST = 0.075, [95% CI 0.054–0.100]) for the six populations of E. gunnii and E. urnigera in the southeast glacial refugium and for all 29 refugial populations (defined in Supplementary Table S1), including related species E. morrisbyi and E. cordata (FST = 0.096, [95% CI 0.089–0.103]).
For the Central Highlands populations that had been genotyped with microsatellites (n = 13, Supplementary Table S1), there was no significant association of pairwise FST among populations with their pairwise climatic or geographic distances (climate distance Mantel r = 0.35, p = 0.11; geographic distance Mantel r = −0.15, p = 0.89). The pairwise FST between the central highland populations of the same species were not significantly lower than those observed between populations of different species (Mantel Pearson r = −0.20, p = 0.11, see Section 2). Together, the lack of isolation-by-distance, isolation-by-environment, and isolation-by-taxon indicates little evidence of historic genetic isolation of the species in this area. Additionally, the pairwise FST between populations of different species (i.e., clearly differentiated morphology) co-occurring at the same site in the Central Highlands but in different habitats (E. gunnii subsp. divaricata and E. urnigera at Jemmy’s Marsh FST = 0.034; E. gunnii subsp. gunnii and E. urnigera at Lake Echo FST = 0.031) were nearly half compared to similar comparisons in or bordering southeastern refugial regions (E. gunnii subsp. gunnii and E. urnigera at Broad River Marshes FST = 0.059, E. gunnii subsp. gunnii and E. urnigera at Snug Plains FST = 0.061) (Figure 4).
The populations of the four morphologically distinct taxa across the Central Highlands region were only weakly differentiated and virtually all individuals showed signs of admixture in the STRUCTURE results. Analyses testing K = 1 to 14 with no a priori assumptions did reveal two genetic clusters (Supplementary Figure S3a,b) broadly corresponding to the E. urnigera and E. archeri/gunnii gene pools (Supplementary Figure S4), though these were weakly differentiated. The isolated populations of E. gunnii at Snow Hill (G5) and E. urnigera at Den Hill (U6) appeared to have mixed ancestry (Supplementary Figure S4). As K increased, the genetic clusters that emerged corresponded to other geographically isolated populations such as Mt Arthur (G2), Maria Island (U10), and Den Hill (U6), but morphologically distinct populations of E. archeri and E. gunnii in the central highland region were virtually indistinguishable when fitting a model that assumed no a priori population information (Supplementary Figure S4). Testing K = 1 to 14 using the LOCPRIOR model, which excluded outlying populations and focused on Central Highlands populations, also suggested K = 2 (Supplementary Figure S3c,d) corresponding to the E. urnigera and E. archeri/gunnii gene pools (Supplementary Figure S5), but with a secondary peak at K = 3 (Supplementary Figure S3c,d). The genetic clusters at K = 3 corresponded to (1) northern E. archeri and E. gunnii, (2) southern E. gunnii, and (3) E. urnigera (Figure 4). Consistent with the low pairwise FST values noted above, the average ancestry attributed to E. gunnii was slightly higher in the E. urnigera populations in the Central Highlands compared to the southern populations. The LOCPRIOR analysis showed that the E. gunnii subsp. divaricata gene pool at Shannon Lagoon (G15) and Lake Echo (G17) (both marked “d” in Figure 4) had atypically high levels of admixture with E. urnigera compared with surrounding E. gunnii populations. While less evident in the STRUCTURE analysis with all populations included, the elevated E. urnigera ancestry in the Shannon Lagoon populations was also evident when the STRUCTURE analysis was restricted to just the Central Highlands populations (data not shown). Combined with the sharing of the rare haplotype JCc36 noted above, these results raise the possibility that the designated type locality of E. gunnii subsp. divaricata (Shannon Lagoon also referred to as Miena—[95]) could be of hybrid origin.
The two ancestral gene pools of E. gunnii/archeri identified in the LOCPRIOR analysis exhibit geographic structure (Figure 4). The E. gunnii subsp. gunnii populations in the west (G8) and north (G1) and E. archeri (A1–A4) are predominantly of northern ancestry, whereas the lower-altitude E. gunnii populations of the southern Central Highlands (G6, G7), Broad River Marshes (G9), and Snug Plains (G10) are mainly of southern ancestry (Figure 4). Historic isolation of these northern and southern gene pools of E. gunnii in central Tasmania is suggested by the marked differentiation between the lower-altitude populations at Lake St Clair (G8) and more eastern populations at Lake Echo (G7) and Mt Field/Broad River Marshes (G9). However, the chloroplast (Cc36) and microsatellite affinities of the Lake St Clair population with higher-altitude E. gunnii subsp. divaricata populations (G13, G11) in the Central Highlands signals a putative postglacial colonisation of higher-altitude regions of the Central Highlands from a western direction. Nevertheless, most higher-altitude populations in the Central Highlands appear to be of mixed ancestry, with those in the southeast of the highlands (G6 and G18) have greater affinities to southern E. gunnii than populations further north (G11, G13, G15, and I2).
Overall, the chloroplast-sharing, high nuclear microsatellite diversity, and weak species differentiation in the newly colonised areas of the Central Highlands are consistent with postglacial admixture not only of populations of E. gunnii and E. archeri isolated at lower altitudes around the base of the highlands during the last glacial, but also potentially involving the northern E. urnigera.

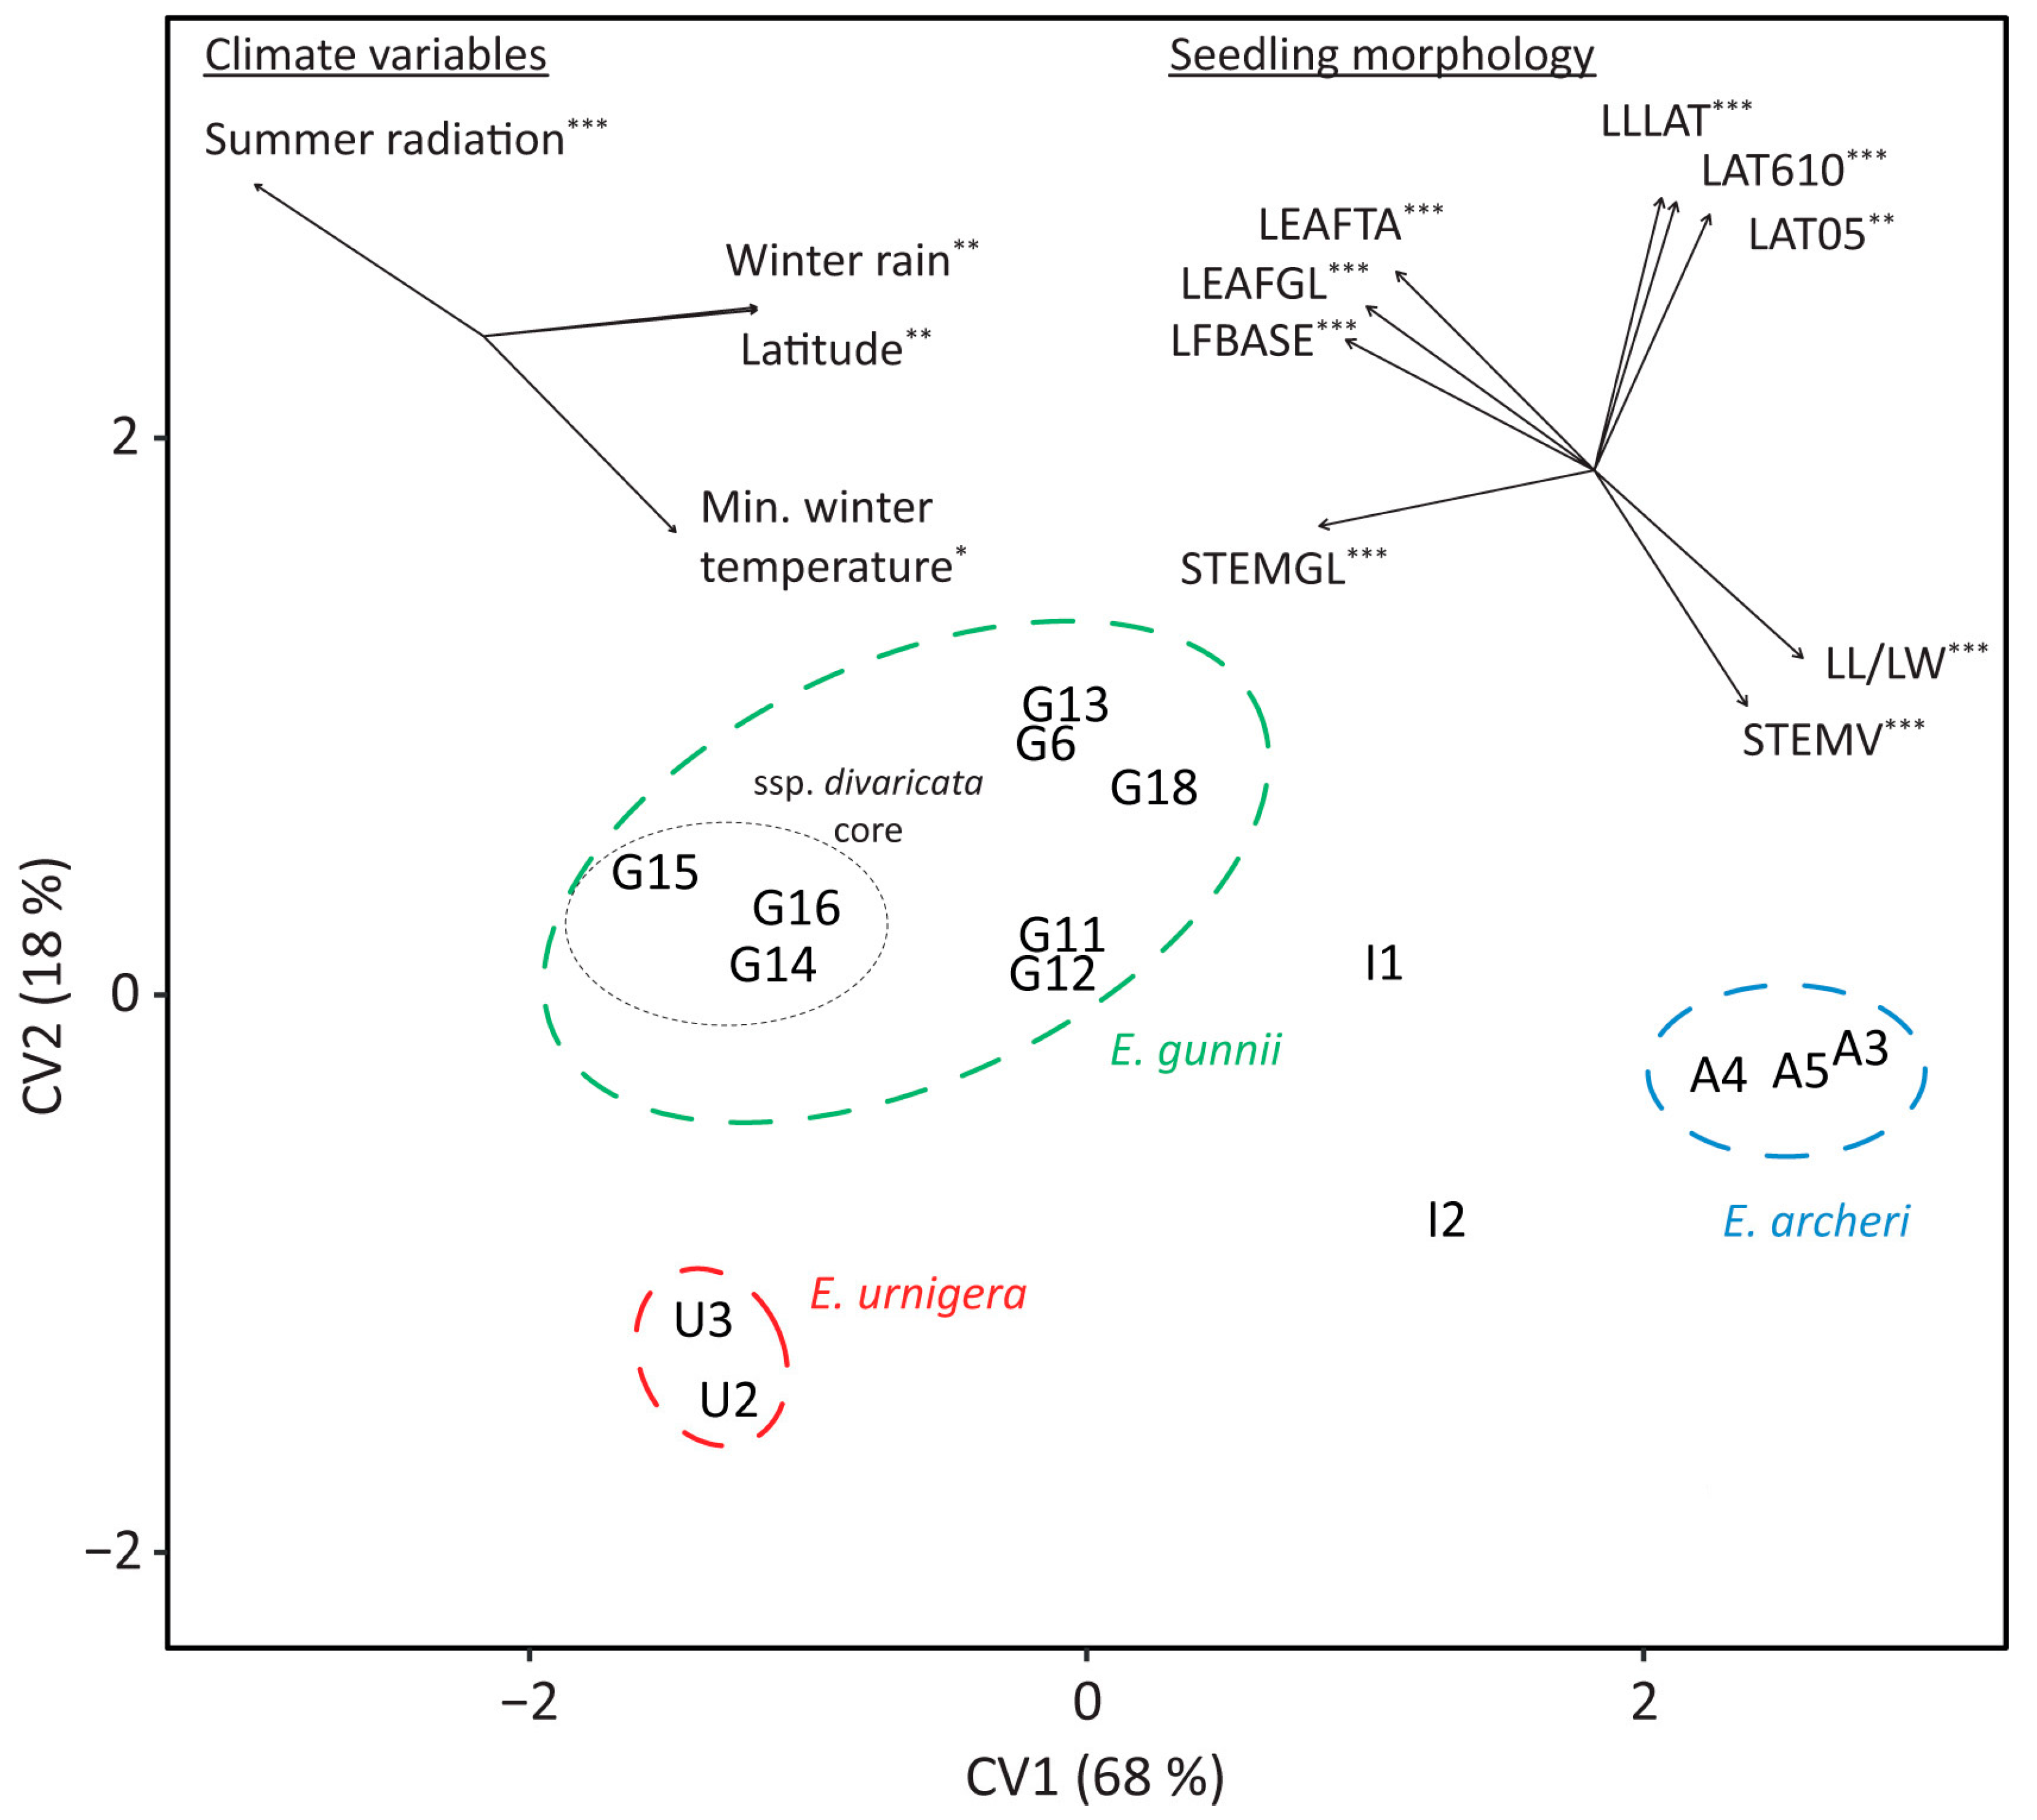
3.3. Morphological Differentiation between Populations (Glasshouse Trial)

Despite the low molecular differentiation among populations and the high degree of admixture in the Central Highlands, the species maintained clear morphological differentiation when seedlings were grown in a glasshouse trial (Figure 5). The morphological variation between populations had a strong genetic basis, with significant population variation observed in 18 of the 22 traits measured (Table 1). There were also significant genetic-based differences in seedling morphology between taxa for all but four traits (leaf crenulation, midrib redness, stem redness, and number of nodes with anthocyanin on the leaf undersurface; data not shown). The discrepancy between the microsatellite and genetic-based morphological differentiation among populations provided our first line of evidence of spatially divergent selection playing a key role in maintaining phenotypic differences among populations and species in the Central Highlands. The quantitative inbreeding coefficient (QST) for the significant morphological traits averaged 0.23 and was significantly greater than the observed maximum FST estimated for the 13 microsatellite loci (FST = 0.044) for 11 of 18 traits that had significant population differentiation (Table 1). This result suggested that the observed phenotypic differences between populations and species is maintained by spatially divergent selection. With only one exception, the pattern of trait divergence among populations was not significantly correlated with putative neutral marker divergence as may be expected under drift (Mantel test for FST shown in Table 1). Rather, trait divergence appeared more associated with the climatic differences among populations (Mantel test for climate shown in Table 1 (significance levels were similar after partialling out neutral differentiation, data not shown)). Based on (i) QST values significantly (p < 0.01) exceeding the maximum FST, (ii) the lack of correlation between population trait divergence and FST, and (iii) the significant (p < 0.05) correlation with climatic differences, the seedling traits showing the strongest evidence of spatially divergent selection were the ratio of the lamina length to lamina width (LL/LW), leaf tip angle (LEAFTA), leaf base lobing (LFBASE), stem glaucousness (STEMGL), and stem oil gland density (STEMV) (Table 1).
The discriminant analysis based on the putative adaptive traits exhibiting significant (p < 0.01) signatures of divergent selection clearly differentiated species, with populations of E. gunnii and E. archeri differentiated along CV1 and populations of E. gunnii and E. urnigera differentiated along CV2 (Figure 5). However, as previously noted [96], intermediate populations do occur, at least between E. gunnii and E. archeri (e.g., I1 and I2). Indeed, CV1 of the discriminant analysis showed a cline in seedling morphology from the E. gunnii subspecies divaricata core populations at the southern end of Great Lake in the middle of the Central Highlands (G15 and G16) through northern populations (G11 and G12) and the intermediate populations (I1, I2) to the E. archeri populations on the far northern scarp of the Central Highlands (A3–A5). This significant latitudinal cline in morphology from E. gunnii to E. archeri was associated with decreasing summer radiation and increasing winter temperature and precipitation. While less marked, there was a trend for CV2 to differentiate the E. gunnii subspecies divaricata populations around Great Lake (G11, G12, G14–G16) from the other E. gunnii populations at higher and lower altitudes (G6, G13, and G18) in the direction of E. urnigera (U2 and U3). CV2 was not strongly aligned with the fitted climate variables, which is consistent with both species often co-occurring in the southern Central Highlands but in different microhabitats.
Table 1. Population differentiation and associations for 22 seedling morphological characters scored for glasshouse-grown progeny of 10 populations of Eucalyptus gunnii, E. archeri, and E. urnigera populations of the Central Highlands of Tasmania. Brief description, units, transformations, and sample size for each trait are given; full descriptions are given below. The differentiation between populations for each trait is summarised in terms of the F value and its significance (P), QST estimate (standard error), and whether the QST estimate significantly exceeds the maximum FST (0.044) calculated for the same 10 populations using microsatellite data. Mantel tests of the correlation between (i) pairwise morphological distance and FST and (ii) pairwise morphological distance and climatic distance are shown using Pearson’s correlation coefficient. All probabilities are based on likelihood ratio tests, except for binary traits, which were tested using a Z test. * p < 0.05; ** p < 0.01; *** p < 0.001; ns, not significant.
Between 10 PopulationsMantel Correlation
Trait Brief DescriptionUnitsTransformationNF9,89–90pQSTSEpTrait vs. FSTTrait vs. Climate
Leaf traits (node 10 leaf)
LAMLLamina lengthmmnone4834.52***0.110.06ns0.05 ns0.81 *
LL/LWLamina length/widthratiolog1047511.59***0.280.12***−0.12 ns0.46 *
LL/LWPLL/widest pointratiolog104753.88***0.150.10ns0.21 ns0.40 ns
LEAFTALeaf tip angledegreessquare47510.07***0.250.11***−0.24 ns0.52 *
LFBASELeaf base lobingmmlog104759.64***0.240.11***−0.07 ns0.38 *
LEAFALeaf angle to stemdegreeslog104832.83*0.060.05ns0.17 ns0.03 ns
LEAFPLeaf plane orientationdegreessqrt4831.92ns0.080.09ns0.04 ns0.02 ns
CRENMLeaf crenulation0–1binary4831.43ns0.290.46ns0.06 ns0.08 ns
LEAFGLLeaf glaucousness0–7none48325.56***0.540.14***−0.13 ns0.23 ns
MRREDMidrib redness0–1binary4830.77ns−0.090.21ns−0.18 ns−0.16 ns
Plant traits
HT10Height to node 10cmnone4833.11**0.070.05ns0.27 ns0.03 ns
LAT05Branching node 0–5countlog104836.21***0.200.10**0.25 ns−0.10 ns
LAT610Branching node 6–10countlog1048318.03***0.380.13***0.42 *−0.15 ns
LLLATLength longest lateralcmnone48314.08***0.310.12***0.30 ns−0.14 ns
COTCOLCotyledon colour0–1binary3103.47***0.590.36ns−0.25 ns0.15 ns
NODEREDLeaf colour changecountnone3102.98**0.110.08ns−0.19 ns0.17 ns
INTER10Internode 10 lengthmmnone4833.41***0.080.05ns−0.05 ns−0.23 ns
Stem traits
STEMGLStem glaucousness0–2none48353.32***0.790.11***0.32 ns0.46 *
STEMREDStem redness0–1binary4831.14ns−0.090.21ns0.04 ns0.35 ns
STEMVOil gland density0–2none4836.56***0.230.12**0.21 ns0.44 *
STEMRECStem rectangularityrationone4834.54***0.170.10*0.25 ns−0.16 ns
STEMROStem roundnessrationone4834.51***0.270.19*0.17 ns0.79 *
 LAML, length of lamina; LL/LW, ratio of the lamina length to lamina width; LL/LWP, ratio of the lamina length to length to widest point; LEAFTA, leaf tip angle, the angle at the tip of the leaf; LFBASE, measure of lobing at leaf base; LEAFA, leaf angle, the axillary angle made by the midrib and the stem; LEAFP, leaf plane, cross-sectional angle of the leaf from horizontal; CRENM, crenulate margins (0/1, 0 = none, 1 = crenulate); LEAFGL, degree of leaf glaucousness (0–7, 0 = green, 7 = heavily glaucous); MRRED, midrib redness (0/1, 0 = green–slightly red, 1 = red). HT10, seedling height to node 10; LAT05, number of laterals from node 0 to 5; LAT610, number of laterals from node 6 to 10; LLLAT, length of the longest lateral; COTCOL, Degree of purple colouration on the abaxial surface of the cotyledons (0/1, 0 = green or intermediate, 1 = deep purple); NODERED, node at which anthocyanin ceases to be expressed on the abaxial surface of the leaf; INTER10, internode length between nodes 9 and 10; STEMGL, degree of stem glaucousness (0–2, 0 = absent, 2 = heavily glaucous); STEMRED, stem redness (0 = absent, 1 = present); STEMV, density of stem verrucae (oil glands) on seedling stem (0–2, 0 = smooth, 2 = high density); STEMREC, stem rectangularity (SD1/SD2, see [97]); STEMRO, stem roundness (SD1/SD3, see [97]).
In many cases, the divergence among populations involved multiple traits and likely reflects genetically independent responses to spatially divergent selection (i.e., is due to selective covariance sensu Armbruster and Schwaegerle [98]). For example, many of the morphological traits identified as showing signals of diversifying selection also exhibited parallel patterns of inter-population variation (e.g., STEMV, STEMGL, LEAFGL, LFBASE, LL/LW, and LEAFTA; Supplementary Table S4). However, despite significant additive genetic variation being detected within populations (Supplementary Table S5), in many cases, there was no evidence that these traits were genetically correlated at this level (Supplementary Table S4). This finding would argue against parallel patterns of inter-population variation in the Central Highlands being a correlated response to selection due to linkage or pleiotropy.

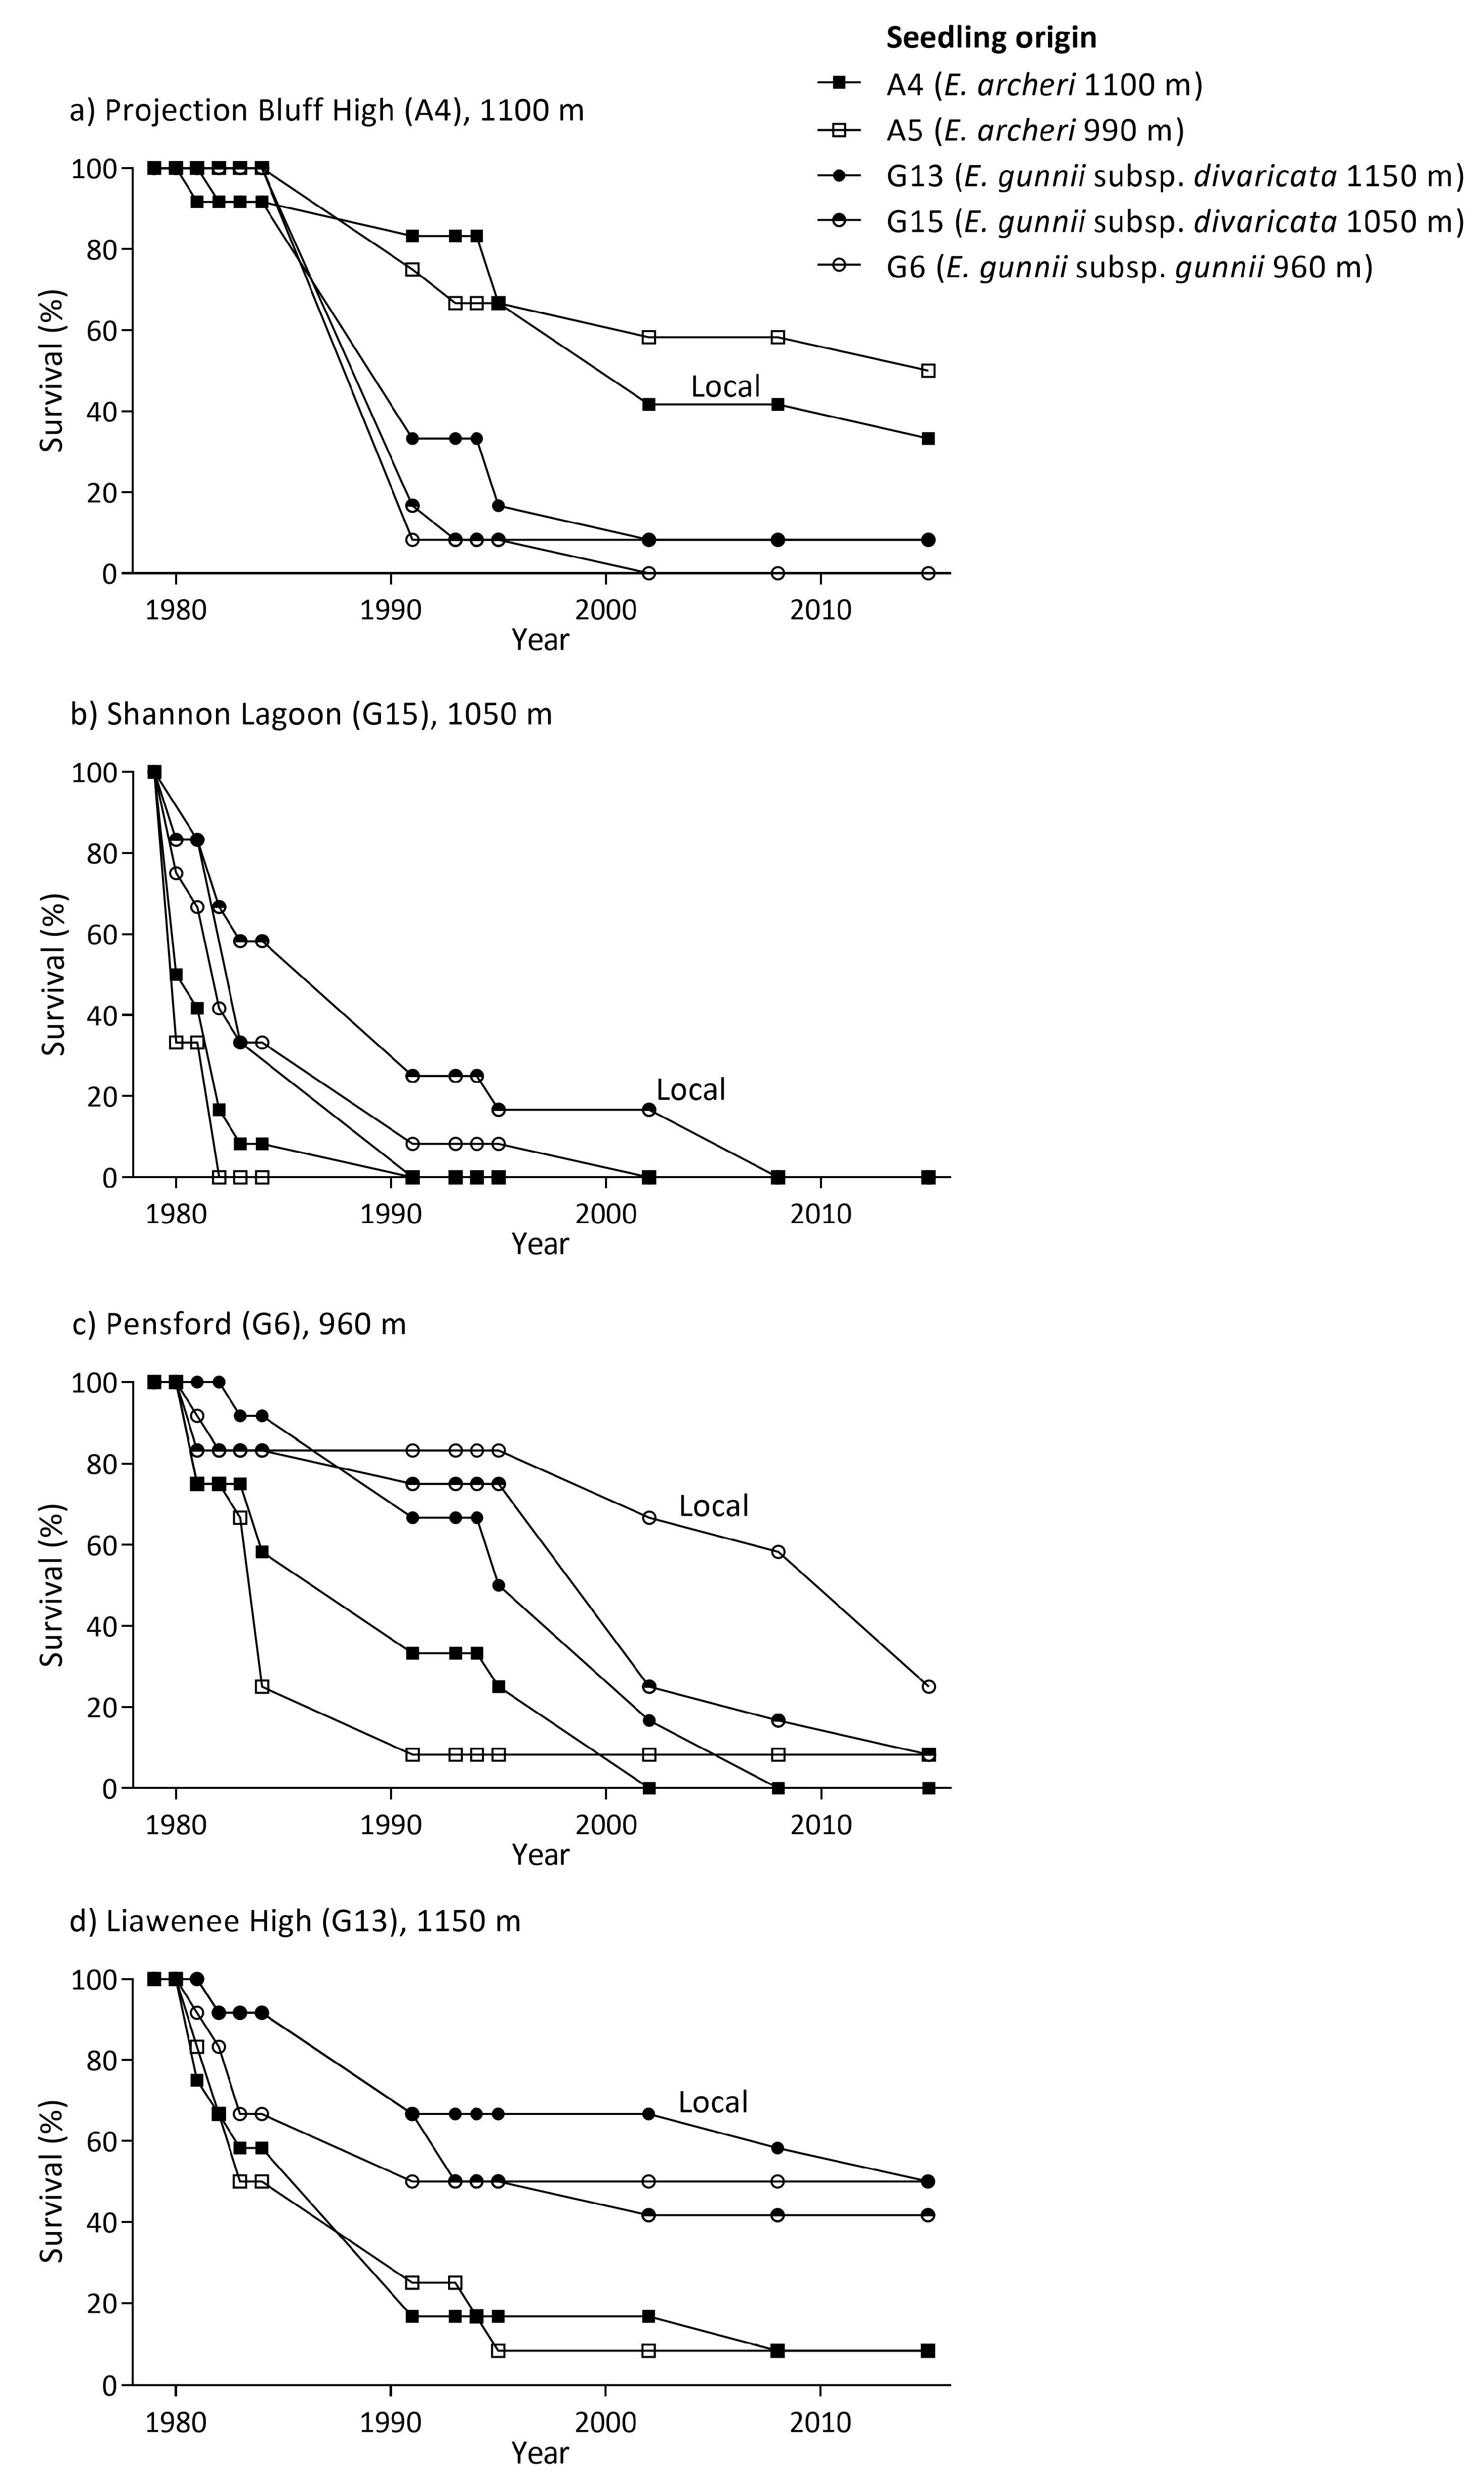
3.4. Reciprocal Common Garden Trials

The final evidence for spatially divergent selection shaping the spatial patterns of genetic variation among populations in the Central Highlands comes from the common garden trials. Evidence for local adaptation was detected in population survival patterns from 1979 to 2015 across the four reciprocal trials in the Central Highlands. The local provenances tended to have a greater proportion of individuals surviving compared with the four non-local provenances from the Central Highlands (Figure 6). Selection along the E. archeri-gunnii cline was relatively symmetrical: at Projection Bluff (at which E. archeri (A4) is local), E. archeri provenances outperformed E. gunnii (Figure 6a) and were the only provenances that were reproductive in 2015 (33% of planted trees of both provenances). In the trials at the E. gunnii end of this cline, E. gunnii persisted longer (Shannon Lagoon, Figure 6b; Pensford, Figure 6c) or had more surviving individuals after 35 years (Liawenee High, Figure 6d) than E. archeri. Selection along the E. gunnii altitudinal gradient was, however, asymmetrical, with upslope rather than downslope translocation of populations more favoured. High-altitude E. gunnii planted at the lowest altitude site, Pensford (960 m), died more rapidly than lower-altitude forms (Figure 6c), while at Liawenee High (1150 m), the selection against low-altitude forms of E. gunnii was less marked, and 35 years after planting, the survival of the local and low-altitude populations (Pensford) was equivalent (Figure 6d), although only the local provenance was reproductive in 2015 (17% of planted trees).

4. Discussion

We integrated multiple lines of evidence (chloroplast and nuclear DNA markers, seedling morphology, and survival in common garden experiments) from a group of closely related endemic eucalypts to argue that (i) the Central Highlands of the island of Tasmania were colonised by a small number of founder populations, (ii) the patterns of genetic diversity have subsequently been shaped by pollen flow from multiple glacial refugia and involved hybridisation among species and previously isolated populations, and (iii) natural selection has filtered the admixed populations, resulting in local adaptation to the harsh sub-alpine environment.

4.1. Colonisation of the Central Highlands

For forest trees with limited seed dispersal, the initial glacial refugial distribution and postglacial colonisation track can be strongly preserved in the maternal lineage [30], but may rapidly erode at the nuclear level due to pollen-mediated gene flow (e.g., Quercus, [4,99]). The Central Highlands region of Tasmania is dominated by a single chloroplast haplotype (Figure 3) (JCc56), which, given the high chloroplast haplotype diversity in the southeast glacial refugium, suggests postglacial colonisation by seed dispersal from limited seed sources. Eucalypts are thought to have been largely absent from the central highland region at the height of the last glaciation [51], but, given the rugged topography of the Central Highlands, the persistence of small populations with the JCc56 haplotype cannot be entirely ruled out. Pollen records indicate that eucalypts were present in lower-altitude areas immediately to the west of the Central Highlands at the end of the last glaciation (Lake St Clair (739 m), [100]), with the major postglacial expansion of eucalypt forest in the southern Central Highlands appearing to have occurred approximately 10,000 years ago (Brown Marsh pollen core from near Lake Echo (750 m), [101]). The rugged topography and marked climate gradients across the island, coupled with changing rainfall patterns associated with the El Niño Southern Oscillation [102], would have affected the suitability of habitat for alpine white gum colonisation over this period. The alpine white gums probably colonised the Central Highlands by seed-mediated dispersal from the regions surrounding the highlands, most likely from the west following prevailing winds.
The lower-altitude distributions of the JCc56 and less common JCc36 haplotypes are consistent with upslope seed-mediated colonisation of the Central Highlands from northwestern and westerly directions, respectively. Such upslope migration would have been relatively slow given that eucalypts have no specialised seed dispersal mechanisms and thus limited seed dispersal rates (1 to 2 m per year), although rare long-distance dispersal events cannot be ruled out [103]. An eastward colonisation of the Central Highlands would be favoured by the prevailing westerly airflow over this high-latitude island [104,105], which would have existed for at least the past 6000 to 8000 years [102]. This westerly airflow pattern may have prevented seed-mediated migration from the east as there is no evidence of historical seed-mediated upslope migration of the alpine white gums onto the Central Highlands from southeastern populations dominated by the JS haplotypes (Figure 3). Instead, the high proportion of southern E. gunnii ancestry in some highland populations of E. gunnii provides evidence for pollen-mediated gene flow from this direction.
We cannot completely dismiss the hypothesis that the near-fixation of JCc56 in the Central Highlands is due to its selection at high altitudes, as there is evidence of functional significance to intra-specific SNP variation within the eucalypt chloroplast genome (e.g., rbcL, which encodes part of the key photosynthesis enzyme RuBisCo [106]). If this was the case, we would expect that this haplotype may also dominate the high-altitude populations of northeast Tasmania; however, it is absent in that region. In addition, this haplotype commonly occurs in populations of lowland eucalypt species on the island, including E. globulus [60], E. viminalis, and E. ovata [107]. Similarly, we cannot completely dismiss the possibility that selection limits the southeast distribution of the JS haplotypes in this complex (present study) and many Tasmanian Symphyomyrtus species [36]. However, the limited seed dispersal scenario is more likely to have restricted the north-westward expansion of the JS chloroplast haplotypes.
The pattern of increased nuclear diversity in the postglacial, newly colonised region compared with the southeast glacial refugial region is in contrast to the concept that glacial refugia harbour higher genetic diversity within populations than newly colonised areas, attributable to selection and bottlenecks within the expanding founding front [30,108]. While we did find low diversity in chloroplast haplotypes in the Central Highlands, consistent with studies of a number of genera, including Quercus [99], Nothofagus [34] (but see [35]), and Eucalyptus [37,109], and a scenario of recent colonisation (or expansion from small populations that persisted in suitable microclimates during glacial periods) by seed dispersal, high nuclear and morphological diversity were found in this region. Similar trends in chloroplast and nuclear marker diversity were reported for a species of eucalypt from a different subgenus growing in the same region (E. pauciflora, [109]), consistent with patterns reported for some tree taxa on other continents [110,111]. In most forest tree species, comparisons of nuclear and chloroplast DNA differentiation among populations suggest that pollen-mediated gene flow is an order of magnitude greater than seed-mediated gene flow [4,112], and eucalypts are no exception [113]. In such cases, founder populations may rapidly recover nuclear genetic diversity through pollen-mediated gene flow [11,114]. In the present case, the best explanation for the high nuclear marker diversity in the highlands populations is pollen-mediated gene flow from previously isolated low-altitude populations combined with interspecific hybridisation among E. gunnii, E. urnigera, and E. archeri in the Central Highlands.

4.2. Chloroplast Haplotype Sharing Implicates Hybridisation

The depauperate chloroplast diversity and high chloroplast sharing among the alpine white gum species in the central highland region is similar to that reported for three eucalypt species (all related in the subgenus EucalyptusE. delegatensis, E. obliqua and E. regnans), where diversity was lower and interspecific sharing was most common in the highland areas in mainland Australia and Tasmania that were hypothesised to have been treeless during the LGM compared with refugial areas [38]. Consistent with our study, they found complete or near-complete fixation of the same regional haplotypes across the three species in areas believed to have been recently colonised and suggested that chloroplast capture following hybridisation during the colonisation process is a probable explanation. This is likely given that non-recombining, maternally inherited (i.e., seed dispersed) genetic markers are more readily (i) fixed in small founder populations as they are more susceptible to drift [115] and (ii) transferred to an invading species [116] than nuclear markers. Such chloroplast capture would entail extensive pollen-mediated invasion of a founding gene pool through hybridisation followed by species resurrection through natural selection and reinforced by recurrent backcrossing [26,29]. This process has been reported as important in the colonisation of deglaciated landscapes in Europe by oaks ([27], reviewed in [4]).
Hybridisation resulting in chloroplast capture at different times through the evolutionary history of the alpine white gum complex would explain some of the interspecific sharing of the JS group of haplotypes in the southeast or the JC sharing in the Central Highlands region, depending upon whether the JS and/or JC haplotypes are derived. These chloroplast clades are estimated to have diverged between 0.8 and 3 million years ago and it is argued that the JS haplotypes evolved in southeast Tasmania [94]. As such, the JS haplotypes could have been restricted to the southeast of Tasmania during the glacial periods which impacted the island of Tasmania over this period [47]. The dated eucalypt phylogeny reported by Thornhill et al. [117] suggests that the alpine white gum group evolved over a similar timeframe (<2–3 million years ago). However, species evolution does not appear to be monophyletic in this group, signalling incomplete lineage sorting or reticulate evolution [56]. Reticulate evolution is possible at lower phylogenetic levels in the uniformly diploid eucalypts, where morphological species often form complex multi-species networks involving nuclear and chloroplast gene exchange among recognised taxa [118,119], as also noted in other forest tree genera [14,15]. While artificial hybridisation studies of eucalypts indicate post-zygotic barriers occur [120,121], these do not appear to be strong among closely related species [122,123], including those crossed with maternal E. gunnii [124].
There is well-established molecular evidence of widespread genetic exchange between eucalypt species, including the alpine white gum species, in and around the lowland glacial forest refugium in the southeast of Tasmania [94]. However, there is little molecular evidence so far that hybridisation was involved in the postglacial expansion into highland areas thought to be uninhabitable by eucalypts during the LGM. There are other processes and scenarios which may contribute to the observed patterns of chloroplast haplotype or clade sharing, including (i) the retention of ancestral polymorphisms leading to incomplete lineage sorting, (ii) past or recent chloroplast haplotype selection, and (iii) replicated evolution (sensu James et al. [125]) of morphological traits (i.e., morphologically defined taxa are not monophyletic) [38,94]. Chloroplast capture through hybridisation is certainly the most parsimonious explanation for the chloroplast clade or haplotype sharing in the southeast glacial forest refugium involving most of the Tasmanian eucalypt species from the subgenus Symphyomyrtus [36,94]. This LGM forest refugium appears relatively well defined by the limits of the JS haplotypes in the alpine white gums (Figure 3). For many eucalypt species in Tasmania from the subgenus Symphyomyrtus, individuals in the southeast usually have JS haplotypes, while elsewhere, individuals usually have JC haplotypes [36,61,94]. As noted by McKinnon et al. [94], such spatially localised chloroplast sharing across diverse species is unlikely to occur through lineage sorting without differential haplotype selection. However, the hypothesis of hybridisation is reinforced by detailed studies involving the alpine white gum, E. cordata [60,126], which is confined to the southeastern glacial forest refugium and is fixed for JS haplotypes. Most of its disjunct populations are fixed for unique haplotypes [55], which are sometimes shared with the co-occurring widespread congeners E. globulus and E. viminalis [60]. In contrast to the pattern in E. cordata, the widespread JC clade is the dominant clade in E. gunnii (present study; [94]), and chloroplast capture would best explain the single detected occurrence of the JS clade in E. gunnii, as the specific haplotype (JS84) is shared with E. cordata from the same locality (Snug Plains).
Outside of the southeast glacial refugium, interspecific sharing of haplotypes of the JC clade also occurs ([94]; present study), but this often involves widespread common haplotypes, which makes it difficult to rule out selection or lineage sorting. This is certainly the case with E. archeri and E. gunnii, where the widespread sharing of JCc56 could simply reflect retention of the ancestral polymorphisms as this haplotype occurs in other species of the subgenus Symphyomyrtus in Tasmania and in mainland Australia [36,107,127]. However, the fact that this sharing involves different JC haplotypes in the Central Highlands (JCc56) and the northeast of Tasmania (JCc25) argues for replicated evolution of the E. archeri phenotype or hybridisation.
Interpreting the chloroplast haplotype distribution and sharing in E. urnigera is also complex. All southern populations of E. urnigera are fixed for the JS clade, and endemic diversity is high but some haplotypes (e.g., JS05) are shared with proximal E. cordata populations. Most northern populations of E. urnigera are fixed for haplotypes of the JC clade, usually the widespread JCc56, which it shares with all co-occurring E. gunnii populations. Given that these northern populations have a shared nuclear co-ancestry with southern E. urnigera (Figure 4), this could represent a case of widespread capture of the E. gunnii haplotypes by E. urnigera in the north of its range by pollen-mediated gene flow, as reported, for example, in walnut species migrating from southern and northern glacial refugia in China [16]. Such chloroplast capture is consistent with hybridisation being more successful when large-flowered eucalypt species (e.g., E. urnigera) pollinate small-flowered species (e.g., E. gunnii) than vice versa [122,128]. However, the possibility that the northern populations of E. urnigera are the remnants of an ancestral lineage with the JC clade cannot be dismissed (e.g., [55]). Regardless, even if the northern populations are less-differentiated remnants of an ancestral E. urnigera lineage which subsequently evolved or captured the southern haplotype in the south, the admixture levels of some of the E. gunnii populations would still argue that hybridisation has contributed to the elevated nuclear diversity in populations in the Central Highlands. In the latter case, there is a signal in the microsatellite data that historic hybridisation with E. urnigera may have contributed to the evolution of the rare E. gunnii subsp. divaricata (Figure 4), the designated type locality (G15) of which represents a form of E. gunnii adapted to a cold, dry environment [95].
The pattern of genetic diversity and differentiation that we observe in the Central Highlands is more consistent with a “suture zone”, first described for areas in North America where multiple pairs of taxa hybridised in broad zones of geographical overlap following migration out of Pleistocene refugia [21], and subsequently described in other regions [129], including Australia [130]. Hybridisation is thought to be more frequent where species contact in marginal or newly opened environments [131,132], such as the Central Highlands, and may be enhanced through plasticity in flowering time [133]. In the case of intraspecific gene flow, pollen dispersal can increase in fragmented landscapes [134,135,136], such as in a newly colonised landscape. Studies in trees have shown that once a few individuals are established, even low levels of gene flow can restore genetic diversity lost during founder events, with continued pollen flow and purging of inbred individuals [11,114]. Our hypothesis of initial postglacial seed invasion of the Central Highlands followed by inter-population and interspecific pollen flow is therefore conceivable and is consistent with the chloroplast and nuclear genetic patterns we observed and the documented phenotypic clines in the Central Highlands, which, for example, link E. archeri and E. gunnii (Figure 5; [57,96,137]).

4.3. Natural Selection Filters the Admixed Populations

Regardless of the cause of the weak molecular differentiation of species and populations in the Central Highlands, there is strong evidence that the phenotypic differences between species and populations are genetically based and result from spatially divergent selection operating along climatic and other more localised environmental gradients. Such selective filtering (sensu Martinsen et al. [138]) has similarly been described to underlie postglacial recolonisation of European landscapes in oaks in the face of inter-population and interspecific gene flow [4,139]. Our evidence for local adaptation (due to spatially divergent selection) comes from (i) strong climate-associated differentiation in quantitative traits (mean QST = 0.23) despite populations and even taxa being virtually indistinguishable using putatively neutral nuclear markers (mean FST = 0.025), and (ii) our long-term reciprocal translocation experiments, where the local or nearby provenances out-performed non-local provenances in all common garden sites (see also [93]). The latitudinal cline in seedling and adult phenotype that links the green E. archeri on the northern scarp of the Central Highlands (A4 and A5) to the highly glaucous E. gunnii subsp. divaricata populations in the south is associated with increasing summer radiation and decreasing minimum winter temperature and winter rainfall (Figure 5). Multiple seedling traits vary along this cline, some of which have clear adaptive value in the different environments. Leaf glaucousness, for example, has adaptive value in highly insolated, frost-prone environments for avoidance of damage through freezing and photoinhibition, but is deleterious in less extreme, wet environments where light for photosynthesis is more limiting [140]. Glaucousness is a key taxonomic trait differentiating E. gunnii and E. archeri, and at the species level, the long-term common garden trials indicate that local adaptation at the holistic level is maintained in the face of gene flow, providing a mechanism for replicated evolution or species resurrection in similar habitats in the northeastern mountains where the species share different haplotypes to those in the Central Highlands, signalling different colonisation histories.
The altitudinal cline at the southern end of the Central Highlands encompasses the transition from the forest form of E. gunnii subsp. gunnii of mainly southern E. gunnii ancestry (population G6), through the open woodland (G14–G16) to treeline-stunted tree/mallee forms classified as E. gunnii subsp. divaricata (G13) and of northern E. gunnii ancestry ([57,96]; Figure 4). Results from the reciprocal garden experiment show that selection at the extremes of this cline appears asymmetric with the rapid elimination of the treeline form at the lower-altitude site where intra-tree competition was high but weak selection against the low-altitude population when transferred to the treeline site where growth was slow [93]. Such asymmetric performance or selection is consistent with an adaptational lag [141], which could be due to the absence of a rare extreme selection event over the growing period studied [142] or, more likely, an increase in growing period temperatures due to climate change [143,144]. If the latter, our reciprocal garden results predict an upslope shift in the southern E. gunnii co-ancestry of populations in the southern regions of the Central Highlands. The intermediate garden at Shannon Lagoon (G15) was planted within the designated type locality of E. gunnii subsp. divaricata. This was clearly the most stressful site studied, with seedlings of even the local population unable to survive over the duration of the trial. The mortality of all planted trees by 2008 coincided with the death of most adult wild trees in the population over this period, commencing in the early 1990s [95,145], linked with a trend for increasing maximum temperatures, frost days and rainfall seasonality in the area over the past 50 years [144], and prolonged rainfall deficits in the late 1980s and early 2000s [145]. The stressful nature of this environment may have favoured a combination of frost resistance of E. gunnii and greater drought resistance of E. urnigera during postglacial colonisation of the Central Highlands, explaining the increased levels of E. urnigera co-ancestry observed in this E. gunnii population. If so, such adaptation appears to have been insufficient for either adult or seedling survival under the contemporary climate regime, resulting in a shift in stand dominance towards a co-occurring eucalypt E. pauciflora [144], with which the alpine white gums cannot hybridise as it belongs to a different subgenus [146].

5. Conclusions

In summary, our data suggest that hybridisation and selection have been important in shaping the response of the alpine white gum taxa to past climate change in the Central Highlands of Tasmania. We argue that contemporary patterns of variation have been strongly influenced by interpopulation and interspecific hybridisation via pollen dispersal accompanied by strong selective filtering, in some cases potentially contributing to the generation of new adaptive variants (e.g., E. gunnii subsp. divaricata) and clinal continua (e.g., between E. archeri and E. gunnii subsp. divaricata), and in other cases maintaining morphologically differentiated species, leading to chloroplast capture. However, in situ common gardens signal that ongoing change in the central highland populations of alpine white gums with climate change is likely to push specific populations beyond their adaptive limits, and in other cases, favour upslope gene flow, even within the same species (e.g., E. gunnii).
Climate change is predicted to adversely affect most Eucalyptus species [147], but these models make many assumptions, including niche conservatism, which may be overly pessimistic for plant species with strong local adaptation and long distance dispersal mechanisms. For example, models that incorporate pollen dispersal indicate that ecological niche shifts or niche evolution may be accelerated with increasing pollen dispersal [148]. Increasingly complex frameworks for predicting population extinction risk in the face of climate change are being developed, which integrate diverse evolutionary processes such as adaptive gene flow [149]. In many forest tree systems, the most effective adaptive gene flow will most likely be gene flow among locally adapted populations and entail long-distance dispersal, which is more a function of pollen than seed [4,112,113]. However, it may also be facilitated when pollen-mediated gene flow extends to networks of proximal hybridising species [15,150], as is likely in the present case. The present and other studies suggest that such historical interspecific gene flow has been an important part of the evolutionary response to climate change in many forest tree systems [15]. Accordingly, such hybridisation is increasingly recognised as an evolutionary process to consider when assessing population and species vulnerability to climate change [151,152,153] as well as a mitigation option [23,154]. It similarly emphasises the importance of accounting for the adaptive differences between populations, which may be independent of maternal lineages ([99]; present study), masked in global admixture estimates, and affect vulnerability risk at a population level [155,156].
From a conservation perspective, our study highlights the complexities of defining conservation units. Phenotypically defined units or patterns of adaptive variation may be at odds with genomic or neutral marker diversity, respectively [157,158]. In Eucalyptus, for example, lineages warranting species recognition were initially detected using genome-wide molecular makers [159,160]. In the present case, populations that are phenotypically assigned to the threatened E. gunnii subsp. divaricata have quite different global admixture levels, and the designated type locality shows signals of introgression. There is also extensive chloroplast sharing and more or less continuous variation in phenotype and global admixture levels at the individual and population level in the Central Highlands encompassing E. archeri and both subspecies of E. gunnii, superimposed on clear adaptative differences between extreme populations. Such complex patterns of variation within a more or less continuous distribution highlights the blurred lines between populations, subspecies, and species in forest tree genera and the challenges in defining uniform and pragmatic criteria to define conservation units which adequately capture the genetic diversity and evolutionary processes in many systems [150,158].

Supplementary Materials

The following supporting information can be downloaded at: https://www.mdpi.com/article/10.3390/f14061072/s1, Table S1: Alpine white gum populations sampled in this study; Table S2: Microsatellite loci used in this study [161]; Table S3: JLA+ chloroplast haplotypes identified in each alpine white gum population; Table S4: Genetic correlation coefficients among six seedling morphological traits scored for 15 populations of Eucalyptus archeri, E. archeri-E. gunnii intermediate, E. gunnii subsp. gunnii, E. gunnii subsp. divaricata, and E. urnigera of the Central Highlands region of Tasmania; Table S5: Within-population narrow-sense heritability (h2op) estimates and their standard errors (SE) for 22 seedling morphological characters scored for glasshouse-grown progeny of 10 populations of E. gunnii, E. archeri, and E. urnigera populations of the Central Highlands of Tasmania; Figure S1: Morphometric measurements of tenth node leaves undertaken using WinFOLIA software; Figure S2: Relationship between altitude and allelic richness for populations of the alpine white gum complex; Figure S3: Estimation of the number of genetic clusters using STRUCTURE and the ΔK method of Evanno et al. [78]; Figure S4: Proportion of membership (q) into each of the K genetic clusters for 746 E. archeri, E. gunnii, and E. urnigera individuals based on STRUCTURE analyses assuming no a priori population groupings; Figure S5: Proportion of membership (q) into each of the K genetic clusters for a subset of 614 E. archeri, E. gunnii, and E. urnigera individuals (excluding E. cordata and E. morrisbyi populations and geographically outlying/genetically divergent E. gunnii/E. urnigera populations) based on STRUCTURE analyses using the LOCPRIOR model.

Author Contributions

R.C.J., J.M.O.-W., R.J.E.W., R.E.V. and B.M.P. designed the research; R.C.J., P.A.H., C.J.H., C.A.H., A.T.M., R.R. and S.L.W. performed the research; R.C.J., P.A.H. and B.M.P. analysed the data; G.J.J. contributed palaeobotanical mapping and associated insights; R.C.J. and B.M.P. wrote the first draft of the paper; all authors contributed to writing and/or review of the manuscript. All authors have read and agreed to the published version of the manuscript.

Funding

This work was supported by the Australian Research Council (grant numbers DP0986491, DP130104220, DP160101650) and utilised UTAS Central Science Laboratory facilities.

Data Availability Statement

An example of each chloroplast haplotype sequence is available on GenBank (new sequences obtained in this study are at JQ713790-JQ713807).

Acknowledgments

The authors thank the Tasmanian Department of Primary Industries Parks Water and Environment, Sustainable Timbers Tasmania, and private landholders for access to sampling sites, and acknowledge the traditional owners of the lands from which all samples were collected. We thank Justin Bloomfield, James Marthick, Paul Tilyard, Hugh Fitzgerald, Ian Cummings, Tracey Winterbottom, and Adam Smolenski for technical assistance, and James Worth, Jim Reid, and Gay McKinnon for other assistance and discussion.

Conflicts of Interest

The authors declare no conflict of interest. The funders had no role in the design of the study; in the collection, analyses, or interpretation of data; in the writing of the manuscript; or in the decision to publish the results.

References

  1. Gavin, D.G.; Fitzpatrick, M.C.; Gugger, P.F.; Heath, K.D.; Rodriguez-Sanchez, F.; Dobrowski, S.Z.; Hampe, A.; Hu, F.S.; Ashcroft, M.B.; Bartlein, P.J.; et al. Climate refugia: Joint inference from fossil records, species distribution models and phylogeography. New Phytol. 2014, 204, 37–54. [Google Scholar] [CrossRef] [PubMed]
  2. Brewer, S.; Cheddadi, R.; de Beaulieu, J.L.; Reille, M. The spread of deciduous Quercus throughout Europe since the last glacial period. For. Ecol. Manag. 2002, 156, 27–48. [Google Scholar] [CrossRef]
  3. Davis, M.B.; Shaw, R.G. Range shifts and adaptive responses to Quaternary climate change. Science 2001, 292, 673–679. [Google Scholar] [CrossRef] [PubMed]
  4. Kremer, A.; Hipp, A.L. Oaks: An evolutionary success story. New Phytol. 2020, 226, 987–1011. [Google Scholar] [CrossRef]
  5. Payette, S.; Couillard, P.-L.; Frégeau, M.; Laflamme, J.; Lavoie, M. The velocity of postglacial migration of fire-adapted boreal tree species in eastern North America. Proc. Natl. Acad. Sci. USA 2022, 119, e2210496119. [Google Scholar] [CrossRef]
  6. Petit, R.J.; Brewer, S.; Bordacs, S.; Burg, K.; Cheddadi, R.; Coart, E.; Cottrell, J.; Csaikl, U.M.; van Dam, B.; Deans, J.D.; et al. Identification of refugia and post-glacial colonisation routes of European white oaks based on chloroplast DNA and fossil pollen evidence. For. Ecol. Manag. 2002, 156, 49–74. [Google Scholar] [CrossRef]
  7. Jordan, G.J.; Harrison, P.A.; Worth, J.R.P.; Williamson, G.J.; Kirkpatrick, J.B. Palaeoendemic plants provide evidence for persistence of open, well-watered vegetation since the Cretaceous. Glob. Ecol. Biogeogr. 2016, 25, 127–140. [Google Scholar] [CrossRef]
  8. Alberto, F.J.; Aitken, S.N.; Alia, R.; Gonzalez-Martinez, S.C.; Hanninen, H.; Kremer, A.; Lefevre, F.; Lenormand, T.; Yeaman, S.; Whetten, R.; et al. Potential for evolutionary responses to climate change evidence from tree populations. Glob. Change Biol. 2013, 19, 1645–1661. [Google Scholar] [CrossRef]
  9. Kremer, A.; Potts, B.M.; Delzon, S. Genetic divergence in forest trees: Understanding the consequences of climate change. Funct. Ecol. 2014, 28, 22–36. [Google Scholar] [CrossRef]
  10. Kremer, A.; Ronce, O.; Robledo-Arnuncio, J.J.; Guillaume, F.; Bohrer, G.; Nathan, R.; Bridle, J.R.; Gomulkiewicz, R.; Klein, E.K.; Ritland, K.; et al. Long-distance gene flow and adaptation of forest trees to rapid climate change. Ecol. Lett. 2012, 15, 378–392. [Google Scholar] [CrossRef]
  11. Hampe, A.; Pemonge, M.-H.; Petit, R.J. Efficient mitigation of founder effects during the establishment of a leading-edge oak population. Proc. R. Soc. B-Biol. Sci. 2013, 280, 20131070. [Google Scholar] [CrossRef] [PubMed]
  12. Petit, R.J.; Pineau, E.; Demesure, B.; Bacilieri, R.; Ducousso, A.; Kremer, A. Chloroplast DNA footprints of postglacial recolonization by oaks. Proc. Natl. Acad. Sci. USA 1997, 94, 9996–10001. [Google Scholar] [CrossRef] [PubMed]
  13. Pfennig, K.S.; Kelly, A.L.; Pierce, A.A. Hybridization as a facilitator of species range expansion. Proc. R. Soc. B Biol. Sci. 2016, 283, 20161329. [Google Scholar] [CrossRef] [PubMed]
  14. Buck, R.; Flores-Rentería, L. The syngameon enigma. Plants 2022, 11, 895. [Google Scholar] [CrossRef] [PubMed]
  15. Cannon, C.H.; Petit, R.J. The oak syngameon: More than the sum of its parts. New Phytol. 2020, 226, 978–983. [Google Scholar] [CrossRef] [PubMed]
  16. Bai, W.N.; Liao, W.J.; Zhang, D.Y. Nuclear and chloroplast DNA phylogeography reveal two refuge areas with asymmetrical gene flow in a temperate walnut tree from East Asia. New Phytol. 2010, 188, 892–901. [Google Scholar] [CrossRef] [PubMed]
  17. Callahan, C.M.; Rowe, C.A.; Ryel, R.J.; Shaw, J.D.; Madritch, M.D.; Mock, K.E. Continental-scale assessment of genetic diversity and population structure in quaking aspen (Populus tremuloides). J. Biogeogr. 2013, 40, 1780–1791. [Google Scholar] [CrossRef]
  18. Latta, R.G.; Mitton, J.B. Historical separation and present gene flow through a zone of secondary contact in ponderosa pine. Evolution 1999, 53, 769–776. [Google Scholar] [CrossRef]
  19. Li, L.L.; Milesi, P.; Tiret, M.; Chen, J.; Sendrowski, J.; Baison, J.; Chen, Z.Q.; Zhou, L.H.; Karlsson, B.; Berlin, M.; et al. Teasing apart the joint effect of demography and natural selection in the birth of a contact zone. New Phytol. 2022, 236, 1976–1987. [Google Scholar] [CrossRef]
  20. Fussi, B.; Lexer, C.; Heinze, B. Phylogeography of Populus alba (L.) and Populus tremula (L.) in Central Europe: Secondary contact and hybridisation during recolonisation from disconnected refugia. Tree Genet. Genomes 2010, 6, 439–450. [Google Scholar] [CrossRef]
  21. Remington, C.L. Suture-zones of hybrid interaction between recently joined biotas. In Evolutionary Biology; Dobzhansky, T., Hecht, M.K., Steere, W.C., Eds.; Plenum: New York, NY, USA, 1968. [Google Scholar]
  22. Hunter, E.A.; Matocq, M.D.; Murphy, P.J.; Shoemaker, K.T. Differential effects of climate on survival rates drive hybrid zone movement. Curr. Biol. 2017, 27, 3898–3903.e3894. [Google Scholar] [CrossRef] [PubMed]
  23. Pfeilsticker, T.R.; Jones, R.C.; Steane, D.A.; Harrison, P.A.; Vaillancourt, R.E.; Potts, B.M. Expansion of the rare Eucalyptus risdonii under climate change through hybridization with a closely related species despite hybrid inferiority. Ann. Bot. 2022, 129, 1–14. [Google Scholar] [CrossRef] [PubMed]
  24. Wielstra, B. Historical hybrid zone movement: More pervasive than appreciated. J. Biogeogr. 2019, 46, 1300–1305. [Google Scholar] [CrossRef]
  25. Chunco, A.J. Hybridization in a warmer world. Ecol. Evol. 2014, 4, 2019–2031. [Google Scholar] [CrossRef] [PubMed]
  26. Leroy, T.; Louvet, J.M.; Lalanne, C.; Le Provost, G.; Labadie, K.; Aury, J.M.; Delzon, S.; Plomion, C.; Kremer, A. Adaptive introgression as a driver of local adaptation to climate in European white oaks. New Phytol. 2019, 226, 1171–1182. [Google Scholar] [CrossRef]
  27. Petit, R.J.; Bodenes, C.; Ducousso, A.; Roussel, G.; Kremer, A. Hybridization as a mechanism of invasion in oaks. New Phytol. 2004, 161, 151–164. [Google Scholar] [CrossRef]
  28. Todesco, M.; Pascual, M.A.; Owens, G.L.; Ostevik, K.L.; Moyers, B.T.; Hubner, S.; Heredia, S.M.; Hahn, M.A.; Caseys, C.; Bock, D.G.; et al. Hybridization and extinction. Evol. Appl. 2016, 9, 892–908. [Google Scholar] [CrossRef]
  29. Potts, B.M.; Reid, J.B. Hybridization as a dispersal mechanism. Evolution 1988, 42, 1245–1255. [Google Scholar] [CrossRef]
  30. Petit, R.J.; Aguinagalde, I.; de Beaulieu, J.L.; Bittkau, C.; Brewer, S.; Cheddadi, R.; Ennos, R.; Fineschi, S.; Grivet, D.; Lascoux, M.; et al. Glacial refugia: Hotspots but not melting pots of genetic diversity. Science 2003, 300, 1563–1565. [Google Scholar] [CrossRef]
  31. Saeki, I.; Dick, C.W.; Barnes, B.V.; Murakami, N. Comparative phylogeography of red maple (Acer rubrum L.) and silver maple (Acer saccharinum L.): Impacts of habitat specialization, hybridization and glacial history. J. Biogeogr. 2011, 38, 992–1005. [Google Scholar] [CrossRef]
  32. Kelleher, C.T.; Hodkinson, T.R.; Douglas, G.C.; Kelly, D.L. Species distinction in Irish populations of Quercus petraea and Q. robur: Morphological versus molecular analyses. Ann. Bot. 2005, 96, 1237–1246. [Google Scholar] [CrossRef] [PubMed]
  33. Manos, P.S.; Doyle, J.J.; Nixon, K.C. Phylogeny, biogeography, and processes of molecular differentiation in Quercus subgenus Quercus (Fagaceae). Mol. Phylogenet. Evol. 1999, 12, 333–349. [Google Scholar] [CrossRef] [PubMed]
  34. Soliani, C.; Gallo, L.; Marchelli, P. Phylogeography of two hybridizing southern beeches (Nothofagus spp.) with different adaptive abilities. Tree Genet. Genomes 2012, 8, 659–673. [Google Scholar] [CrossRef]
  35. Worth, J.R.P.; Jordan, G.J.; McKinnon, G.E.; Vaillancourt, R.E. The major Australian cool temperate rainforest tree Nothofagus cunninghamii withstood Pleistocene glacial aridity within multiple regions: Evidence from the chloroplast. New Phytol. 2009, 182, 519–532. [Google Scholar] [CrossRef]
  36. McKinnon, G.E.; Jordan, G.J.; Vaillancourt, R.E.; Steane, D.A.; Potts, B.M. Glacial refugia and reticulate evolution: The case of the Tasmanian eucalypts. Philos. Trans. R. Soc. Lond. Ser. B-Biol. Sci. 2004, 359, 275–284. [Google Scholar] [CrossRef]
  37. Nevill, P.G.; Bossinger, G.; Ades, P.K. Phylogeography of the world’s tallest angiosperm, Eucalyptus regnans: Evidence for multiple isolated Quaternary refugia. J. Biogeogr. 2010, 37, 179–192. [Google Scholar] [CrossRef]
  38. Nevill, P.G.; Despres, T.; Bayly, M.J.; Bossinger, G.; Ades, P.K. Shared phylogeographic patterns and widespread chloroplast haplotype sharing in Eucalyptus species with different ecological tolerances. Tree Genet. Genomes 2014, 10, 1079–1092. [Google Scholar] [CrossRef]
  39. Capblancq, T.; Lachmuth, S.; Fitzpatrick, M.C.; Keller, S.R. From common gardens to candidate genes: Exploring local adaptation to climate in red spruce. New Phytol. 2023, 237, 1590–1605. [Google Scholar] [CrossRef]
  40. Sork, V.L. Genomic studies of local adaptation in natural plant populations. J. Hered. 2018, 109, 3–15. [Google Scholar] [CrossRef]
  41. Leinonen, T.; McCairns, R.J.S.; O’Hara, R.B.; Merila, J. QST-FST comparisons: Evolutionary and ecological insights from genomic heterogeneity. Nat. Rev. Genet. 2013, 14, 179–190. [Google Scholar] [CrossRef]
  42. Dutkowski, G.W.; Potts, B.M. Genetic variation in the susceptibility of Eucalyptus globulus to drought damage. Tree Genet. Genomes 2012, 8, 757–773. [Google Scholar] [CrossRef]
  43. Prober, S.M.; Potts, B.M.; Harrison, P.A.; Wiehl, G.; Bailey, T.G.; Silva, J.C.E.; Price, M.R.; Speijers, J.; Steane, D.A.; Vaillancourt, R.E. Leaf economic and hydraulic traits signal disparate climate adaptation patterns in two co-occurring woodland eucalypts. Plants 2022, 11, 1846. [Google Scholar] [CrossRef] [PubMed]
  44. Boshier, D.; Buggs, R.J.A. The potential for field studies and genomic technologies to enhance resistance and resilience of British tree populations to pests and pathogens. Forestry 2015, 88, 27–40. [Google Scholar] [CrossRef]
  45. Saenz-Romero, C.; O’Neill, G.; Aitken, S.N.; Lindig-Cisneros, R. Assisted migration field tests in Canada and Mexico: Lessons, limitations, and challenges. Forests 2021, 12, 9. [Google Scholar] [CrossRef]
  46. Colhoun, E.A. Vegetation and climate change during the Last Interglacial-Glacial cycle in western Tasmania, Australia. Palaeogeogr. Palaeoclimatol. Palaeoecol. 2000, 155, 195–209. [Google Scholar] [CrossRef]
  47. Jackson, W.D. Vegetation types. In Vegetation of Tasmania; Reid, J.B., Hill, R.S., Brown, M.J., Hovenden, M.J., Eds.; Australian Biological Resource Study: Melbourne, Australia, 1999; pp. 89–124. [Google Scholar]
  48. Mokany, K.; Jordan, G.J.; Harwood, T.D.; Harrison, P.A.; Keppel, G.; Gilfedder, L.; Carter, O.; Ferrier, S. Past, present and future refugia for Tasmania’s palaeoendemic flora. J. Biogeogr. 2017, 44, 1537–1546. [Google Scholar] [CrossRef]
  49. Jordan, G.J. Evidence of Pleistocene plant extinction and diversity from Regatta Point, western Tasmania, Australia. Bot. J. Linn. Soc. 1997, 123, 45–71. [Google Scholar] [CrossRef]
  50. Colhoun, E.A.; Hannan, D.; Kiernan, K. Late Wisconsin glaciation of Tasmania. Pap. Proc. R. Soc. Tasman. 1996, 130, 33–45. [Google Scholar] [CrossRef]
  51. Kirkpatrick, J.B.; Fowler, M. Locating likely glacial forest refugia in Tasmania using palynological and ecological information to test alternative climatic models. Biol. Conserv. 1998, 85, 171–182. [Google Scholar] [CrossRef]
  52. Potts, B.M.; Jackson, W.D. Evolutionary processes in the Tasmanian high altitude eucalypts. In Flora and Fauna of Alpine Australasia. Ages and Origins; Barlow, B.A., Ed.; CSIRO: Melbourne, Australia, 1986; pp. 511–527. [Google Scholar]
  53. Nicolle, D.; Jones, R.C. A revised classification for the predominantly eastern Australian Eucalyptus subgenus Symphyomyrtus sections Maidenaria, Exsertaria, Latoangulatae and related smaller sections (Myrtaceae). Telopea 2018, 21, 129–145. [Google Scholar] [CrossRef]
  54. McKinnon, G.E.; Vaillancourt, R.E.; Steane, D.A.; Potts, B.M. An AFLP marker approach to lower-level systematics in Eucalyptus (Myrtaceae). Am. J. Bot. 2008, 95, 368–380. [Google Scholar] [CrossRef] [PubMed]
  55. Harrison, P.A.; Jones, R.C.; Vaillancourt, R.E.; Wiltshire, R.J.E.; Potts, B.M. Unravelling the evolutionary history of Eucalyptus cordata (Myrtaceae) using molecular markers. Aust. J. Bot. 2014, 62, 114–131. [Google Scholar] [CrossRef]
  56. Jones, R.C.; Nicolle, D.; Steane, D.A.; Vaillancourt, R.E.; Potts, B.M. High density, genome-wide markers and intra-specific replication yield an unprecedented phylogenetic reconstruction of a globally significant, speciose lineage of Eucalyptus. Mol. Phylogenet. Evol. 2016, 105, 63–85. [Google Scholar] [CrossRef] [PubMed]
  57. Potts, B.M.; Reid, J.B. Variation in the Eucalyptus gunnii-archeri complex in Tasmania. I. Variation in the adult phenotype. Aust. J. Bot. 1985, 33, 337–359. [Google Scholar] [CrossRef]
  58. Davidson, N.J. Ecophysiological studies of factors determining the distribution of sub-alpine eucalypts at Snug Plains, southern Tasmania. Aust. J. Ecol. 1987, 12, 197–199. [Google Scholar]
  59. Doyle, J.J.; Doyle, J.L. Extraction of plant DNA from fresh tissue. Focus 1990, 12, 13–15. [Google Scholar]
  60. McKinnon, G.E.; Vaillancourt, R.E.; Steane, D.A.; Potts, B.M. The rare silver gum, Eucalyptus cordata, is leaving its trace in the organellar gene pool of Eucalyptus globulus. Mol. Ecol. 2004, 13, 3751–3762. [Google Scholar] [CrossRef]
  61. Freeman, J.S.; Jackson, H.D.; Steane, D.A.; McKinnon, G.E.; Dutkowski, G.W.; Potts, B.M.; Vaillancourt, R.E. Chloroplast DNA phylogeography of Eucalyptus globulus. Aust. J. Bot. 2001, 49, 585–596. [Google Scholar] [CrossRef]
  62. McKinnon, G.E.; Vaillancourt, R.E.; Tilyard, P.A.; Potts, B.M. Maternal inheritance of the chloroplast genome in Eucalyptus globulus and interspecific hybrids. Genome 2001, 44, 831–835. [Google Scholar] [CrossRef]
  63. Swofford, D.L. PAUP*. Phylogenetic Analysis Using Parsimony (*and Other Methods). Version 4; Sinauer Associates: Sunderland, MA, USA, 2002. [Google Scholar]
  64. Templeton, A.R.; Crandall, K.A.; Sing, C.F. A cladistic analysis of phenotypic associations with haplotypes inferred from restriction endonuclease mapping and DNA sequence data. III. Cladogram estimation. Genetics 1992, 132, 619–633. [Google Scholar] [CrossRef]
  65. Brondani, R.P.V.; Brondani, C.; Grattapaglia, D. Towards a genus-wide reference linkage map for Eucalyptus based exclusively on highly informative microsatellite markers. Mol. Genet. Genom. 2002, 267, 338–347. [Google Scholar] [CrossRef] [PubMed]
  66. Brondani, R.P.V.; Williams, E.R.; Brondani, C.; Grattapaglia, D. A microsatellite-based consensus linkage map for species of Eucalyptus and a novel set of 230 microsatellite markers for the genus. BMC Plant Biol. 2006, 6, 20. [Google Scholar] [CrossRef] [PubMed]
  67. Brondani, R.P.V.; Brondani, C.; Tarchini, R.; Grattapaglia, D. Development, characterization and mapping of microsatellite markers in Eucalyptus grandis and E. urophylla. Theor. Appl. Genet. 1998, 97, 816–827. [Google Scholar] [CrossRef]
  68. Steane, D.A.; Vaillancourt, R.E.; Russell, J.; Powell, W.; Marshall, D.; Potts, B.M. Development and characterisation of microsatellite loci in Eucalyptus globulus (Myrtaceae). Silvae Genet. 2001, 50, 89–91. [Google Scholar]
  69. Peakall, R.; Smouse, P.E. GENALEX 6: Genetic analysis in Excel. Population genetic software for teaching and research. Mol. Ecol. Notes 2006, 6, 288–295. [Google Scholar] [CrossRef]
  70. Peakall, R.; Smouse, P.E. GenAlEx 6.5: Genetic analysis in Excel. Population genetic software for teaching and research—An update. Bioinformatics 2012, 28, 2537–2539. [Google Scholar] [CrossRef] [PubMed]
  71. Goudet, J. FSTAT, a Program to Estimate and Test Gene Diversities and Fixation Indices. Version 2.9.3.2. Available online: http://www2.unil.ch/popgen/softwares/fstat.htm (accessed on 31 March 2023).
  72. Weir, B.S.; Cockerham, C.C. Estimating F-statistics for the analysis of population structure. Evolution 1984, 38, 1358–1370. [Google Scholar]
  73. Falush, D.; Stephens, M.; Pritchard, J.K. Inference of population structure using multilocus genotype data: Linked loci and correlated allele frequencies. Genetics 2003, 164, 1567–1587. [Google Scholar] [CrossRef]
  74. Falush, D.; Stephens, M.; Pritchard, J.K. Inference of population structure using multilocus genotype data: Dominant markers and null alleles. Mol. Ecol. Notes 2007, 7, 574–578. [Google Scholar] [CrossRef]
  75. Hubisz, M.J.; Falush, D.; Stephens, M.; Pritchard, J.K. Inferring weak population structure with the assistance of sample group information. Mol. Ecol. Resour. 2009, 9, 1322–1332. [Google Scholar] [CrossRef]
  76. Pritchard, J.K.; Stephens, M.; Donnelly, P. Inference of population structure using multilocus genotype data. Genetics 2000, 155, 945–959. [Google Scholar] [CrossRef] [PubMed]
  77. Earl, D.; vonHoldt, B. Structure Harvester: A website and program for visualizing STRUCTURE output and implementing the Evanno method. Conserv. Genet. Resour. 2011, 4, 359–361. [Google Scholar] [CrossRef]
  78. Evanno, G.; Regnaut, S.; Goudet, J. Detecting the number of clusters of individuals using the software Structure: A simulation study. Mol. Ecol. 2005, 14, 2611–2620. [Google Scholar] [CrossRef]
  79. Jakobsson, M.; Rosenberg, N.A. Clumpp: A cluster matching and permutation program for dealing with label switching and multimodality in analysis of population structure. Bioinformatics 2007, 23, 1801–1806. [Google Scholar] [CrossRef] [PubMed]
  80. Rosenberg, N.A. Distruct: A program for the graphical display of population structure. Mol. Ecol. Notes 2004, 4, 137–138. [Google Scholar] [CrossRef]
  81. Kopelman, N.M.; Mayzel, J.; Jakobsson, M.; Rosenberg, N.A.; Mayrose, I. CLUMPAK: A program for identifying clustering modes and packaging population structure inferences across K. Mol. Ecol. Resour. 2015, 15, 1179–1191. [Google Scholar] [CrossRef] [PubMed]
  82. Gilmour, A.R.; Gogel, B.J.; Cullis, B.R.; Welham, S.J.; Thompson, R. ASReml User Guide Release 4.1 Structural Specification; VSN International Ltd.: Hemel Hempstead, UK, 2015. [Google Scholar]
  83. Gauli, A.; Vaillancourt, R.E.; Bailey, T.G.; Steane, D.A.; Potts, B.M. Evidence for local climate adaptation in early-life traits of Tasmanian populations of Eucalyptus pauciflora. Tree Genet. Genomes 2015, 11, 104. [Google Scholar] [CrossRef]
  84. Jordan, G.J.; Potts, B.M.; Wiltshire, R.J.E. Strong, independent, quantitative genetic control of the timing of vegetative phase change and first flowering in Eucalyptus globulus ssp. globulus (Tasmanian Blue Gum). Heredity 1999, 83, 179–187. [Google Scholar]
  85. Bush, D.; Kain, D.; Kanowski, P.; Matheson, C. Genetic parameter estimates informed by a marker-based pedigree: A case study with Eucalyptus cladocalyx in southern Australia. Tree Genet. Genomes 2015, 11, 16. [Google Scholar] [CrossRef]
  86. Latta, R.G. Differentiation of allelic frequencies at quantitative trait loci affecting locally adaptive traits. Am. Nat. 1998, 151, 283–292. [Google Scholar] [CrossRef]
  87. Yang, R.C.; Yeh, F.C.; Yanchuk, A.D. A comparison of isozyme and quantitative genetic variation in Pinus contorta ssp latifolia by FST. Genetics 1996, 142, 1045–1052. [Google Scholar] [CrossRef]
  88. Zar, J.H. Statistical significance of mutation frequencies, and the power of statistical testing, using the Poisson-distribution. Biom. J. 1984, 26, 83–88. [Google Scholar] [CrossRef]
  89. Oksanen, J.; Blanchet, F.; Friendly, M.; Kindt, R.; Legendre, P.; McGlinn, D.; Minchin, P.; O’Hara, R.; Simpson, G.; Solymos, P.; et al. Vegan: Community Ecology Package in R. Version 2.4-2. Available online: https://CRAN.R-project.org/package=vegan (accessed on 31 March 2023).
  90. Goslee, S.C.; Urban, D.L. The ecodist package for dissimilarity-based analysis of ecological data. J. Stat. Softw. 2007, 22, 1–19. [Google Scholar] [CrossRef]
  91. Xu, T.B.; Hutchinson, M.F. New developments and applications in the ANUCLIM spatial climatic and bioclimatic modelling package. Environ. Model. Softw. 2013, 40, 267–279. [Google Scholar] [CrossRef]
  92. Nychka, D.; Furrer, R.; Paige, J.; Sain, S. Fields: Tools for Spatial Data. Available online: https://github.com/NCAR/Fields (accessed on 31 March 2023).
  93. Potts, B.M. Variation in the Eucalyptus gunnii-archeri complex. III. Reciprocal transplant trials. Aust. J. Bot. 1985, 33, 687–704. [Google Scholar] [CrossRef]
  94. McKinnon, G.E.; Vaillancourt, R.E.; Jackson, H.D.; Potts, B.M. Chloroplast sharing in the Tasmanian eucalypts. Evolution 2001, 55, 703–711. [Google Scholar] [CrossRef]
  95. Potts, B.M.; Potts, W.C.; Kantvilas, G. The Miena cider gum, Eucalyptus gunnii subsp. divaricata (Myrtaceae): A taxon in rapid decline. Pap. Proc. R. Soc. Tasman. 2001, 135, 57–61. [Google Scholar]
  96. Potts, B.M.; Reid, J.B. Variation in the Eucalyptus gunnii-archeri complex in Tasmania. II. The origin of variation. Aust. J. Bot. 1985, 33, 519–541. [Google Scholar] [CrossRef]
  97. Tibbits, W.N. Germination and morphology of progeny from controlled pollinations of Eucalyptus nitens (Deane and Maiden) Maiden. Aust. J. Bot. 1988, 36, 677–691. [Google Scholar] [CrossRef]
  98. Armbruster, W.S.; Schwaegerle, K.E. Causes of covariation of phenotypic traits among populations. J. Evol. Biol. 1996, 9, 261–276. [Google Scholar] [CrossRef]
  99. Kremer, A.; Kleinschmit, J.; Cottrell, J.; Cundall, E.P.; Deans, J.D.; Ducousso, A.; Konig, A.O.; Lowe, A.J.; Munro, R.C.; Petit, R.J.; et al. Is there a correlation between chloroplastic and nuclear divergence, or what are the roles of history and selection on genetic diversity in European oaks? For. Ecol. Manag. 2002, 156, 75–87. [Google Scholar] [CrossRef]
  100. Hopf, F.V.L.; Colhoun, E.A.; Barton, C.E. Late-glacial and Holocene record of vegetation and climate from Cynthia Bay, Lake St Clair, Tasmania. J. Quat. Sci. 2000, 15, 725–732. [Google Scholar] [CrossRef]
  101. Macphail, M.K. Vegetation and climates in southern Tasmania since the last glaciation. Quat. Res. 1979, 11, 306–341. [Google Scholar] [CrossRef]
  102. Fletcher, M.S.; Bowman, D.M.J.S.; Whitlock, C.; Mariani, M.; Stahle, L. The changing role of fire in conifer-dominated temperate rainforest through the last 14,000 years. Quat. Sci. Rev. 2018, 182, 37–47. [Google Scholar] [CrossRef]
  103. Booth, T.H. Going nowhere fast: A review of seed dispersal in eucalypts. Aust. J. Bot. 2017, 65, 401–410. [Google Scholar] [CrossRef]
  104. Jones, T.H.; Vaillancourt, R.E.; Potts, B.M. Detection and visualization of spatial genetic structure in continuous Eucalyptus globulus forest. Mol. Ecol. 2007, 16, 697–707. [Google Scholar] [CrossRef]
  105. Potts, B.M.; Wiltshire, R.J.E. Eucalypt genetics and genecology. In Eucalypt Ecology: Individuals to Ecosystems; Williams, J., Woinarski, J., Eds.; Cambridge University Press: Cambridge, UK, 1997; pp. 56–91. [Google Scholar]
  106. Kahrood, H.; Rigault, P.; Spokevicius, A.; Bossinger, G.; Tibbits, J. RuBisCo evolution in eucalypts. In Proceedings of the IUFRO Tree Biotechnology 2015 Conference, Florence, Italy, 8–12 June 2015; pp. 228–229. [Google Scholar]
  107. Marthick, J.R. The Phylogeography of Two Eucalypts. Honours Thesis, University of Tasmania, Hobart, Australia, 2005. [Google Scholar]
  108. Hewitt, G.M. Some genetic consequences of ice ages, and their role in divergence and speciation. Biol. J. Linn. Soc. 1996, 58, 247–276. [Google Scholar] [CrossRef]
  109. Gauli, A.; Steane, D.A.; Vaillancourt, R.E.; Potts, B.M. Molecular genetic diversity and population structure in Eucalyptus pauciflora subsp. pauciflora (Myrtaceae) on the island of Tasmania. Aust. J. Bot. 2014, 62, 175–188. [Google Scholar] [CrossRef]
  110. Havrdova, A.; Douda, J.; Krak, K.; Vit, P.; Hadincova, V.; Zakravsky, P.; Mandak, B. Higher genetic diversity in recolonized areas than in refugia of Alnus glutinosa triggered by continent-wide lineage admixture. Mol. Ecol. 2015, 24, 4759–4777. [Google Scholar] [CrossRef]
  111. Sakaguchi, S.; Takeuchi, Y.; Yamasaki, M.; Sakurai, S.; Isagi, Y. Lineage admixture during postglacial range expansion is responsible for the increased gene diversity of Kalopanax septemlobus in a recently colonised territory. Heredity 2011, 107, 338–348. [Google Scholar] [CrossRef]
  112. Petit, R.J.; Duminil, J.; Fineschi, S.; Hampe, A.; Salvini, D.; Vendramin, G.G. Comparative organization of chloroplast, mitochondrial and nuclear diversity in plant populations. Mol. Ecol. 2005, 14, 689–701. [Google Scholar] [CrossRef]
  113. Byrne, M. Phylogeny, diversity and evolution of eucalypts. In Plant Genome: Biodiversity and Evolution. Volume 1, Part E: Phanerogams-Angiosperm; Sharma, A.K., Sharma, A., Eds.; Science Publishers: London, UK, 2008; Volume 1, pp. 303–346. [Google Scholar]
  114. Lesser, M.R.; Jackson, S.T. Contributions of long-distance dispersal to population growth in colonising Pinus ponderosa populations. Ecol. Lett. 2013, 16, 380–389. [Google Scholar] [CrossRef] [PubMed]
  115. Birky, C.W., Jr.; Maruyama, T.; Fuerst, P. An approach to population and evolutionary genetic theory for genes in mitochondria and chloroplasts, and some results. Genetics 1983, 103, 513–527. [Google Scholar] [CrossRef]
  116. Currat, M.; Ruedi, M.; Petit, R.J.; Excoffier, L. The hidden side of invasions: Massive introgression by local genes. Evolution 2008, 62, 1908–1920. [Google Scholar] [CrossRef] [PubMed]
  117. Thornhill, A.H.; Crisp, M.D.; Kulheim, C.; Lam, K.E.; Nelson, L.A.; Yeates, D.K.; Miller, J.T. A dated molecular perspective of eucalypt taxonomy, evolution and diversification. Aust. Syst. Bot. 2019, 32, 29–48. [Google Scholar] [CrossRef]
  118. Jordan, R.; Prober, S.M.; Andrew, R.L.; Freeman, J.S.; Kerr, R.; Steane, D.A.; Vaillancourt, R.E.; Potts, B.M. Population genomic research in eucalypts. In Population Genomics: Forest Trees; Rajora, O.P., Ed.; Springer Nauture: Cham, Switzerland, 2023. [Google Scholar]
  119. Mostert-O’Neill, M.M.; Reynolds, S.M.; Acosta, J.J.; Lee, D.J.; Borevitz, J.O.; Myburg, A.A. Genomic evidence of introgression and adaptation in a model subtropical tree species, Eucalyptus grandis. Mol. Ecol. 2021, 30, 625–638. [Google Scholar] [CrossRef]
  120. Costa e Silva, J.; Potts, B.M.; Tilyard, P. Epistasis causes outbreeding depression in eucalypt hybrids. Tree Genet. Genomes 2012, 8, 249–265. [Google Scholar] [CrossRef]
  121. Larcombe, M.J.; Silva, J.C.E.; Tilyard, P.; Gore, P.; Potts, B.M. On the persistence of reproductive barriers in Eucalyptus: The bridging of mechanical barriers to zygote formation by F1 hybrids is counteracted by intrinsic post-zygotic incompatibilities. Ann. Bot. 2016, 118, 431–444. [Google Scholar] [CrossRef]
  122. Larcombe, M.J.; Barbour, R.C.; Jones, R.C.; Vaillancourt, R.E.; Potts, B.M. Postmating barriers to hybridization between an island’s native eucalypts and an introduced congener. Tree Genet. Genomes 2016, 12, 26. [Google Scholar] [CrossRef]
  123. Larcombe, M.J.; Holland, B.; Steane, D.A.; Jones, R.C.; Nicolle, D.; Vaillancourt, R.E.; Potts, B.M. Patterns of reproductive isolation in Eucalyptus—A phylogenetic perspective. Mol. Biol. Evol. 2015, 32, 1833–1846. [Google Scholar] [CrossRef]
  124. Cauvin, B.; Potts, B.M.; Potts, W.C. Eucalyptus: Hybridation artificielle-barrieres et hérédité des caracteres. In Annales de Recherches Sylvicoles; Association Forêt-Cellulose: Paris, France, 1997; pp. 255–303. [Google Scholar]
  125. James, M.E.; Brodribb, T.; Wright, I.J.; Rieseberg, L.H.; Ortiz-Barrientos, D. Replicated Evolution in Plants. Annu. Rev. Plant Biol. 2023, 74, 1367–1380. [Google Scholar] [CrossRef] [PubMed]
  126. McKinnon, G.E.; Smith, J.J.; Potts, B.M. Recurrent nuclear DNA introgression accompanies chloroplast DNA exchange between two eucalypt species. Mol. Ecol. 2010, 19, 1367–1380. [Google Scholar] [CrossRef] [PubMed]
  127. Yost, J.M.; Wise, S.L.; Love, N.L.R.; Steane, D.A.; Jones, R.C.; Ritter, M.K.; Potts, B.M. Origins, diversity and naturalization of Eucalyptus globulus (Myrtaceae) in California. Forests 2021, 12, 1129. [Google Scholar] [CrossRef]
  128. Gore, P.L.; Potts, B.M.; Volker, P.W.; Megalos, J. Unilateral cross-incompatibility in Eucalyptus-the case of hybridization between Eucalyptus globulus and Eucalyptus nitens. Aust. J. Bot. 1990, 38, 383–394. [Google Scholar] [CrossRef]
  129. Hewitt, G. The genetic legacy of the Quaternary ice ages. Nature 2000, 405, 907–913. [Google Scholar] [CrossRef]
  130. Byrne, M.; Yeates, D.K.; Joseph, L.; Kearney, M.; Bowler, J.; Williams, M.A.J.; Cooper, S.; Donnellan, S.C.; Keogh, J.S.; Leys, R.; et al. Birth of a biome: Insights into the assembly and maintenance of the Australian arid zone biota. Mol. Ecol. 2008, 17, 4398–4417. [Google Scholar] [CrossRef]
  131. Anderson, E.; Stebbins, G.L. Hybridization as an evolutionary stimulus. Evolution 1954, 8, 378–388. [Google Scholar] [CrossRef]
  132. Stebbins, G.L. The role of hybridization in evolution. Proc. Am. Philos. Soc. 1959, 103, 231–251. [Google Scholar]
  133. Levin, D.A. Flowering-time plasticity facilitates niche shifts in adjacent populations. New Phytol. 2009, 183, 661–666. [Google Scholar] [CrossRef]
  134. Buschbom, J.; Yanbaev, Y.; Degen, B. Efficient long-distance gene flow into an isolated relict oak stand. J. Hered. 2011, 102, 464–472. [Google Scholar] [CrossRef]
  135. Kramer, A.T.; Ison, J.L.; Ashley, M.V.; Howe, H.F. The paradox of forest fragmentation genetics. Conserv. Biol. 2008, 22, 878–885. [Google Scholar] [CrossRef] [PubMed]
  136. Mimura, M.; Barbour, R.C.; Potts, B.M.; Vaillancourt, R.E.; Watanabe, K.N. Comparison of contemporary mating patterns in continuous and fragmented Eucalyptus globulus native forests. Mol. Ecol. 2009, 18, 4180–4192. [Google Scholar] [CrossRef] [PubMed]
  137. Barber, H.N. Adaptive gene substitutions in Tasmanian eucalypts: I. Genes controlling the development of glaucousness. Evolution 1955, 9, 1–15. [Google Scholar] [CrossRef]
  138. Martinsen, G.D.; Whitham, T.G.; Turek, R.J.; Keim, P. Hybrid populations selectively filter gene introgression between species. Evolution 2001, 55, 1325–1335. [Google Scholar] [PubMed]
  139. Gailing, O.; Hipp, A.L.; Plomion, C.; Carlson, J.E. Oak population genomics. In Population Genomics; Springer International Publishing: Cham, Switzerland, 2021; pp. 1–37. [Google Scholar]
  140. Close, D.C.; Davidson, N.J.; Shields, C.B.; Wiltshire, R. Reflectance and phenolics of green and glaucous leaves of Eucalyptus urnigera. Aust. J. Bot. 2007, 55, 561–567. [Google Scholar] [CrossRef]
  141. Aitken, S.N.; Yeaman, S.; Holliday, J.A.; Wang, T.; Curtis-McLane, S. Adaptation, migration or extirpation: Climate change outcomes for tree populations. Evol. Appl. 2008, 1, 95–111. [Google Scholar] [CrossRef]
  142. Davidson, N.J.; Reid, J.B. Frost as a factor influencing the growth and distribution of subalpine eucalypts. Aust. J. Bot. 1985, 33, 657–667. [Google Scholar] [CrossRef]
  143. Harrison, P.A. Climate change and the suitability of local and non-local species for ecosystem restoration. Ecol. Manag. Restor. 2021, 22, 75–91. [Google Scholar] [CrossRef]
  144. Sanger, J.C.; Davidson, N.J.; O’Grady, A.P.; Close, D.C. Are the patterns of regeneration in the endangered Eucalyptus gunnii ssp divaricata shifting in response to climate? Austral. Ecol. 2011, 36, 612–620. [Google Scholar] [CrossRef]
  145. Calder, J.A.; Kirkpatrick, J.B. Climate change and other factors influencing the decline of the Tasmanian cider gum (Eucalyptus gunnii). Aust. J. Bot. 2008, 56, 684–692. [Google Scholar] [CrossRef]
  146. Griffin, A.R.; Burgess, I.P.; Wolf, L. Patterns of natural and manipulated hybridization in the genus Eucalyptus L’Herit—A review. Aust. J. Bot. 1988, 36, 41–66. [Google Scholar] [CrossRef]
  147. González-Orozco, C.E.; Pollock, L.J.; Thornhill, A.H.; Mishler, B.D.; Knerr, N.; Laffan, S.W.; Miller, J.T.; Rosauer, D.F.; Faith, D.P.; Nipperess, D.A.; et al. Phylogenetic approaches reveal biodiversity threats under climate change. Nat. Clim. Chang. 2016, 6, 1110. [Google Scholar] [CrossRef]
  148. Aguilee, R.; Raoul, G.; Rousset, F.; Ronce, O. Pollen dispersal slows geographical range shift and accelerates ecological niche shift under climate change. Proc. Natl. Acad. Sci. USA 2016, 113, E5741–E5748. [Google Scholar] [CrossRef] [PubMed]
  149. Aguirre-Liguori, J.A.; Ramírez-Barahona, S.; Gaut, B.S. The evolutionary genomics of species’ responses to climate change. Nat. Ecol. Evol. 2021, 5, 1350–1360. [Google Scholar] [CrossRef] [PubMed]
  150. Pfeilsticker, T.R.; Jones, R.C.; Steane, D.A.; Vaillancourt, R.E.; Potts, B.M. Molecular insights into the dynamics of species invasion by hybridisation in Tasmanian eucalypts. Mol. Ecol. 2023, 1–17. [Google Scholar] [CrossRef] [PubMed]
  151. Brennan, A.C.; Woodward, G.; Seehausen, O.; Munoz-Fuentes, V.; Moritz, C.; Guelmami, A.; Abbott, R.J.; Edelaar, P. Hybridization due to changing species distributions: Adding problems or solutions to conservation of biodiversity during global change? Evol. Ecol. Res. 2014, 16, 475–491. [Google Scholar]
  152. Hamilton, J.A.; Miller, J.M. Adaptive introgression as a resource for management and genetic conservation in a changing climate. Conserv. Biol. 2016, 30, 33–41. [Google Scholar] [CrossRef]
  153. Janes, J.K.; Hamilton, J.A. Mixing it up: The role of hybridization in forest management and conservation under climate change. Forests 2017, 8, 237. [Google Scholar] [CrossRef]
  154. Baskett, M.L.; Gomulkiewicz, R. Introgressive hybridization as a mechanism for species rescue. Theor. Ecol. 2011, 4, 223–239. [Google Scholar] [CrossRef]
  155. DeMarche, M.L.; Doak, D.F.; Morris, W.F. Incorporating local adaptation into forecasts of species’ distribution and abundance under climate change. Glob. Change Biol. 2019, 25, 775–793. [Google Scholar] [CrossRef]
  156. Drake, J.E.; Aspinwall, M.J.; Pfautsch, S.; Rymer, P.D.; Reich, P.B.; Smith, R.A.; Crous, K.Y.; Tissue, D.T.; Ghannoum, O.; Tjoelker, M.G. The capacity to cope with climate warming declines from temperate to tropical latitudes in two widely distributed Eucalyptus species. Glob. Change Biol. 2015, 21, 459–472. [Google Scholar] [CrossRef] [PubMed]
  157. Allendorf, F.W.; Hohenlohe, P.A.; Luikart, G. Genomics and the future of conservation genetics. Nat. Rev. Genet. 2010, 11, 697–709. [Google Scholar] [CrossRef] [PubMed]
  158. Coates, D.J.; Byrne, M.; Moritz, C. Genetic diversity and conservation units: Dealing with the species-population continuum in the age of genomics. Front. Ecol. Evol. 2018, 6, 165. [Google Scholar] [CrossRef]
  159. Binks, R.M.; Steane, D.A.; Byrne, M. Genomic divergence in sympatry indicates strong reproductive barriers and cryptic species within Eucalyptus salubris. Ecol. Evol. 2021, 11, 5096–5110. [Google Scholar] [CrossRef]
  160. Steane, D.A.; Potts, B.M.; McLean, E.; Collins, L.; Prober, S.M.; Stock, W.D.; Vaillancourt, R.E.; Byrne, M. Genome-wide scans reveal cryptic population structure in a dry-adapted eucalypt. Tree Genet. Genomes 2015, 11, 33. [Google Scholar] [CrossRef]
  161. Hudson, C.J.; Kullan, A.R.K.; Freeman, J.S.; Faria, D.A.; Grattapaglia, D.; Kilian, A.; Myburg, A.A.; Potts, B.M.; Vaillancourt, R.E. High synteny and colinearity among Eucalyptus genomes revealed by high-density comparative genetic mapping. Tree Genet. Genomes 2012, 8, 339–352. [Google Scholar] [CrossRef]
Figure 1. Typical habitat of four of the alpine white gum taxa sampled in this study. (a) Eucalyptus archeri at Projection Bluff, (b) E. gunnii subsp. divaricata near Great Lake, (c) E. urnigera at Mt Field and (d) E. cordata subsp. cordata on Maria Island overlooking submerged parts of the lowland glacial refugium in southeastern Tasmania, Australia.
Forests 14 01072 g001
Figure 2. Populations of the alpine white gum complex sampled in this study. Population codes have a prefix designating the phenotypic class observed in the field (A = Eucalyptus archeri; I = E. archeriE. gunnii intermediate; G = E. gunnii subsp. gunnii (G1–G10) and E. gunnii subsp. divaricata (G11–G18); U = E. urnigera; C = E. cordata subsp. cordata (C1–C14), E. cordata “intermediate” (C15–C18) and E. cordata subsp. quadrangulosa (C19–C21); M = E. morrisbyi). For population details see Supplementary Table S1. Dashed circle indicates the lowland southeast refugial populations.
Forests 14 01072 g002
Figure 3. (a) Chloroplast haplotypes and (b) nuclear microsatellite diversity (allelic richness, Rt) of populations of the alpine white gum on maps showing the current coastline and the estimated distribution of vegetation types and glacial extent at the Last Glacial Maximum in Tasmania. For the pie diagrams showing the relative frequency of chloroplast DNA haplotypes, each colour is a different haplotype; blue shades are haplotypes belonging to the central (JC) lineage, yellow/cream shades are three haplotypes belonging to the eastern Tasmania (Jet) lineage, and remaining haplotypes belong to the southern (JS) lineage (see Supplementary Table S3). Note that populations U10 (E. urnigera Maria Island) and C15 (E. cordata Moogara) each consist of two subpopulations which are fixed for a single haplotype, but these are each shown in a single pie chart in the figure. Vegetation distribution on the maps is according to Kirkpatrick and Fowler [51] and the distribution of ice is derived from Colhoun et al. [50].
Forests 14 01072 g003
Figure 4. Molecular affinities of populations of Eucalyptus archeri, E. gunnii, and E. urnigera. STRUCTURE affinities are shown using the LOCPRIOR model and K = 3 for a subset of 26 populations (excluding E. cordata and E. morrisbyi populations and geographically outlying/genetically divergent E. gunnii/E. urnigera populations). Population affinities are obtained by averaging the individual Q-values in each population; individual results for K = 2 to 7 are shown in Supplementary Figure S5; analyses using 32 populations of E. archeri, E. gunnii and E. urnigera and no a priori population groupings for K = 2 to 7 are shown in Supplementary Figure S4. Pie charts are labelled with a letter designating the phenotypic class observed in the field (a = E. archeri; i = E. archeriE. gunnii intermediate; g = E. gunnii subsp. gunnii; d = E. gunnii subsp. divaricata; u = E. urnigera. Dashed circle indicates the lowland south-east refugial populations.
Forests 14 01072 g004
Figure 5. Morphological affinities of populations of the alpine white gum complex in the Central Highlands of Tasmania. Shown are the first two axes from the canonical discriminant analysis among 15 populations defined using nine seedling morphological traits that exhibited evidence (p < 0.01) of spatially divergent selection. The proportion of variation explained by each axis is shown in parentheses. Vectors show the fit of the geographic/climatic variables and significant seedling morphological traits in the two-dimensional discriminant space (*p < 0.05; ** p < 0.01; *** p < 0.001), with the length of the vector proportional to the correlation within this two-dimensional space. Climate variables correspond to Radiation of the warmest quarter (“Summer radiation”), Precipitation of coldest quarter (“Winter rain”), and Minimum temperature of the coldest month (“Min. winter temperature”) predicted using ANUClim version 6.1 [91]. The Latitude vector is pointing northward. Population codes are given in Supplementary Table S1.
Forests 14 01072 g005
Figure 6. The percentage of alpine white gum seedlings surviving between 1979 and 2015 at four common gardens in the central highlands of Tasmania. (a) Projection Bluff High (A4, 1100 m), (b) Shannon Lagoon (G15, 1050 m), (c) Pensford (G6, 960 m), and (d) Liawenee High (G13,1150 m). Seedlings originated from the same four sites, plus a lower-altitude (990 m) site at Projection Bluff (Projection Bluff Low, A5). No records of survival were undertaken between 1985 and 1990, 1996 and 2001, 2002 and 2007, or 2009 and 2012. On each plot, the local provenance is indicated.
Forests 14 01072 g006
Disclaimer/Publisher’s Note: The statements, opinions and data contained in all publications are solely those of the individual author(s) and contributor(s) and not of MDPI and/or the editor(s). MDPI and/or the editor(s) disclaim responsibility for any injury to people or property resulting from any ideas, methods, instructions or products referred to in the content.

