Article

Enhanced Photosynthetic Efficiency for Increased Carbon Assimilation and Woody Biomass Production in Engineered Hybrid Poplar

1
Research & Development, Living Carbon PBC, Hayward, CA 94544, USA
2
Research & Development, Living Carbon PBC, Charleston, SC 29403, USA
3
The Plant Transformation Research Center, University of California Riverside, Riverside, CA 92521, USA
*
Author to whom correspondence should be addressed.
Forests 2023, 14(4), 827; https://doi.org/10.3390/f14040827
Submission received: 1 March 2023 / Revised: 12 April 2023 / Accepted: 13 April 2023 / Published: 18 April 2023
(This article belongs to the Special Issue Application of Biotechnology Techniques on Tree Species—Series II)

Abstract

:
Increasing CO2 levels in the atmosphere and the resulting negative impacts of climate change have compelled global efforts to achieve carbon neutrality or negativity. Most such efforts focus on carbon sequestration through chemical or physical approaches. Harnessing the power of synthetic biology to enhance the natural ability of carbon sequestration in plants, especially non-annuals, provides a biological approach to further reduce CO2 levels in the air. Here, we selected a photorespiration bypass pathway and tested its effectiveness on photosynthetic enhancement in a hybrid poplar, INRA717-IB4. The design includes an RNAi strategy to reduce the transportation of the photorespiration byproduct, glycolate, out of chloroplast and a shunt pathway to metabolize the retained glycolate back to CO2 for fixation through the Calvin-Benson cycle. Molecular and physiological data collected from two separate growth experiments indicate that transgenic plants expressing genes in the photorespiration bypass pathway have increased photosynthetic efficiency, leading to faster plant growth and elevated biomass production. One lead transgenic event accumulated 35%–53% more above-ground dry biomass over four months of growth in a controlled environment. Our results provide a proof of concept for engineering trees to help combat climate change.

1. Introduction

Originating from single-celled prokaryotes in the ocean approximately 2.5 billion years ago, photosynthesis is a natural process in plants consisting of a series of well-coordinated biochemical reactions that use sunlight energy to reduce atmospheric CO2 into energy-rich carbohydrates in chloroplasts. In the stroma of a chloroplast, CO2 is fixed into carbohydrates via the Calvin-Benson cycle utilizing the ATP and NADPH produced by photosynthesis in the thylakoid membrane. The first step of the Calvin-Benson cycle is catalyzed by the enzyme ribulose-1,5-bisphosphate carboxylase/oxygenase (RuBisCO) which, as the name suggests, can accept either CO2 or O2 as substrates to carry out either a carboxylation or oxygenation reaction, respectively. The carboxylation reaction leads to carbon fixation while the oxygenation reaction leads to photorespiration. The fixed CO2 molecule moves on to anabolic pathways for sucrose and starch biosynthesis. The oxygenation product phosphoglycolate must be converted in a series of reactions that consume energy and CO2, eventually generating one molecule of 3-phosphoglycerate [1]. This energy consumption and the loss of previously fixed CO2 have made the photorespiration pathway a target for improving photosynthetic efficiency in C3 plants.
Plants grown at elevated CO2 concentrations, that is, with low RuBisCO oxygenation activity, have been shown to have increased productivity [2]. Such results have boosted the belief that engineering the RuBisCO enzyme for increasing substrate specificity toward CO2 could substantially improve photosynthetic efficiency leading to higher productivity [3,4,5]. However, enzyme engineering approaches to improve RuBisCO catalysis by random or site-directed mutagenesis or directed evolution have largely failed to yield substantial kinetic enhancements [4,6,7,8]. The lack of considerable improvements from these studies is potentially due to the existence of a trade-off between CO2 specificity and carboxylation velocity—such that carboxylation activity decreases when CO2 specificity is increased [9,10]. However, no statistically significant relationship between carboxylase efficiencies and CO2 specificities of RuBisCO were found between 11 diatom species [11]. A computational modeling analysis of RuBisCO kinetics also challenged the trade-off idea [12]. It remains a possibility that RuBisCO can be improved via enzyme engineering with a better designed screening system. For instance, the successful expression of a functional simplified α-carboxysome from cyanobacteria in tobacco chloroplasts led to an increase in biomass production [13]. Other attempts have aimed to improve enzymes in the Calvin-Benson cycle to enhance the rate of ribulose 1,5-bisphosphate (RuBP) regeneration which limits carbon fixation under certain conditions. Computational models have suggested that the natural distribution of enzymes within the Calvin-Benson cycle is suboptimal, especially under elevated CO2 concentrations [14]. Overexpression of sedoheptulose 1,7-bisphosphatase or fructose-1,6-bisphosphate aldolase in N. tabacum resulted in a higher carbon fixation rate and increased biomass at elevated CO2 levels [15,16]. Even at ambient CO2 concentration, overexpression of limiting enzymes in the Calvin cycle was shown to boost carbon fixation in tobacco [17,18,19].
The next obvious approach centered around engineering photorespiration bypass pathways to metabolize the byproduct of RuBisCO oxygenation, phosphoglycolate, preventing it from entering the natural photorespiratory pathway thus minimizing the loss of CO2 and energy. The first such bypass pathway involved engineering an E. coli glycolate catabolic pathway consisting of three enzymes: glycolate dehydrogenase, glyoxylate carboligase, and tartronic semialdehyde reductase into Arabidopsis [20]. The design aimed to mimic the natural photorespiration process of returning 75% glycolate to the Calvin-Benson cycle without ammonia production. Increases in photosynthesis rate and biomass were observed in these transgenic Arabidopsis. A second bypass aimed to convert glycolate into hydroxypyruvate in peroxisomes by two enzymes from E. coli: glyoxylate carboligase and hydroxypyruvate isomerase [21]. This bypass releases CO2 in the peroxisome and does not produce extra ammonia. However, transgenic tobacco showed stunted growth in ambient air [21].
Another bypass was designed to completely convert glycolate into CO2 in the chloroplast [22]. The pathway consisted of three new enzymes: Arabidopsis glycolate oxidase (directing the transgenic enzyme into the chloroplast instead of the peroxisome as for the endogenous one), pumpkin malate synthase, and E. coli catalase. Together with two endogenous enzymes (NADP-malic enzyme and pyruvate dehydrogenase), this pathway mimics the E. coli glycolate oxidative cycle in Arabidopsis chloroplasts. Increased photosynthesis rate and dry weight biomass were observed [22]. A polyprotein comprising all three subunits of E. coli glycolate dehydrogenase was expressed in plastids of transgenic potato, resulting in significantly higher carbohydrate production and a substantial increase in shoot and leaf biomass, as well as tuber yield [23]. Recently, South et al. reported yet another bypass design that not only has a shunt pathway to metabolize glycolate utilizing the glycolate dehydrogenase from Chlamydomonas reinhardtii and malate synthase from Cucurbita maxima, but also includes an RNAi design to inhibit the plastidial glycolate transporter, plastidial glycolate glycerate translocator 1 (PLGG1), in an attempt to limit the introduction of glycolate into the photorespiration pathway [24]. With a successful reduction in the expression of tobacco PLGG1, transgenic plants showed biomass increases as high as 40% in field conditions [24].
The effectiveness of photorespiration bypass pathway designs to enhance photosynthesis efficiency has recently been tested in one crop species, rice. The first design, called the GOC bypass, consists of three rice enzymes: glycolate oxidase, oxalate oxidase, and catalase [25] and, similar to Maier et al., aimed to completely metabolize glycolate into CO2 in the chloroplast [22]. Increases in photosynthetic rate and biomass were observed in transgenic rice, especially under high light conditions, but seed setting was reduced [25]. A GCGT bypass design with four genes: a rice glycolate oxidase and three E. coli enzymes, including catalase, glyoxylate carboligase, and tartronic semialdehyde reductase, was expected to lead to a greater increase in photosynthetic rate and grain yield by mimicking the natural 75% return of glycolate to the Calvin cycle as opposed to 100% conversion into CO2 [26]. Indeed, increases in photosynthesis rate, biomass, and grain yield were observed. However, like the GOC bypass, seed setting was reduced in transgenic rice. Interestingly, despite compromise on grain chalkiness, both GOC and GCGT grain showed higher nutritional value, including protein content and better cooking quality [27].
In trees, however, there have rarely been any attempts to increase woody biomass via manipulations of enzymes or metabolic pathways for photosynthesis enhancement. In an attempt to create the next generation of trees using synthetic biology approaches to help combat the looming consequences of climate change, we selected a bypass design based on the work of South et al. to test the impact on photosynthetic efficiency in the poplar [
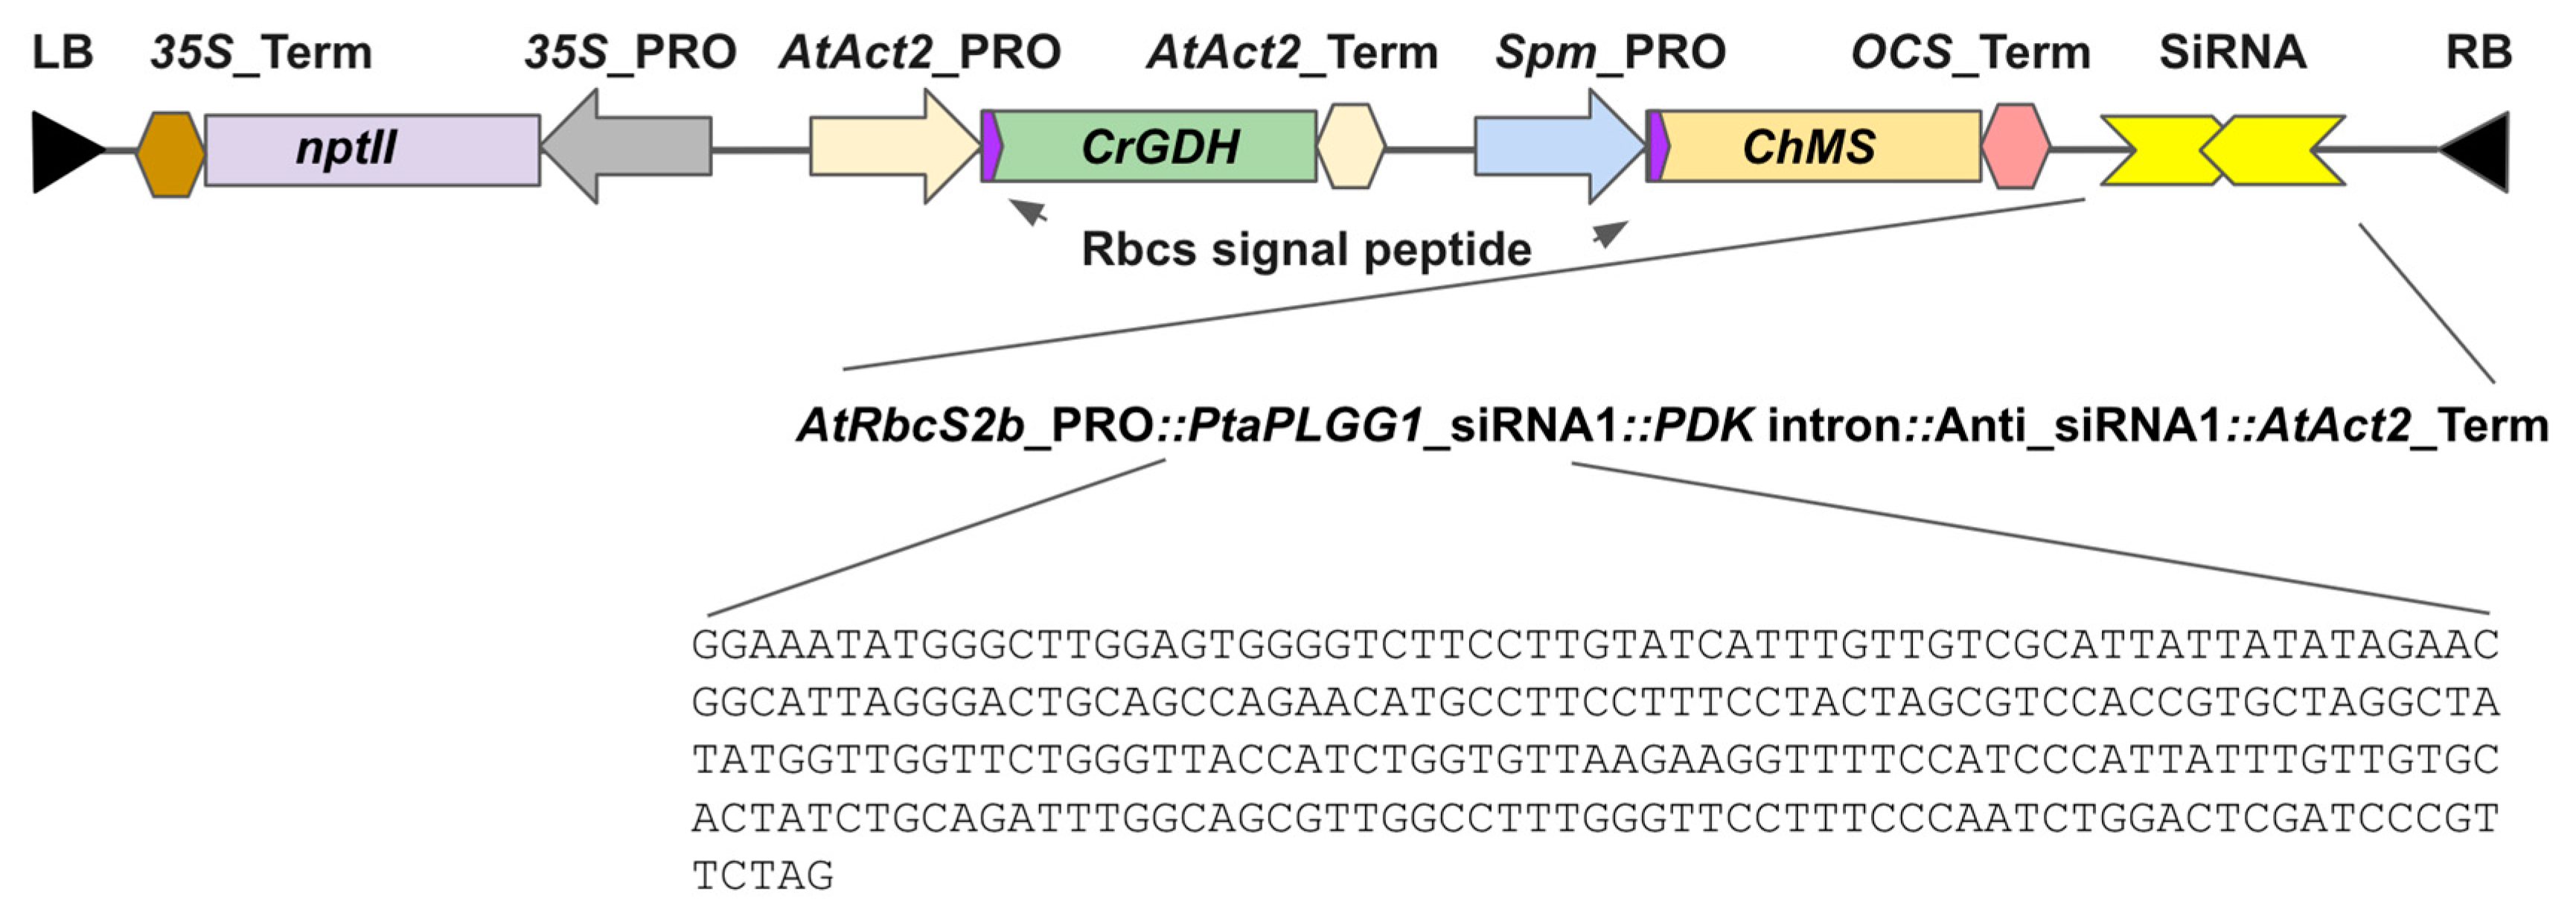
24]. This design includes an RNAi to reduce PLGG1 expression to limit glycolate transport out of the chloroplast, a transgenic chloroplast-targeted glycolate dehydrogenase to convert the retained glycolate into glyoxylate, and a transgenic chloroplast-targeted malate synthase to convert glyoxylate to malate [24,28]. Malate is then sequentially converted to pyruvate and acetyl-CoA. These reactions result in the release of CO2 in the chloroplast, rather than the peroxisome as in the endogenous photorespiration pathway, allowing the released CO2 to be fixed by RuBisCO carboxylation. While the growth performance of poplar plants harboring this design is under a multi-year field trial, this paper summarized the construct impact on transgenic plants grown in a controlled environment. If proven effective in the field and implemented on a large scale, the engineered trees could have the potential for substantial drawdown of CO2, helping to counter the effects of climate change.

2. Materials and Methods

2.1. Poplar Plant Growth and Propagation

Hybrid Populus tremula × Populus alba, clone INRA 717-1B4, a widely-used laboratory clone, was a gift received from Dr. Steve Strauss of Oregon State University. Plants were kept in a growth room using horticultural LED lighting at a constant photosynthetic photon flux density (PPFD) of 120 μmol m−2s−1, with a 25 °C/22 °C day/night temperature, and humidity levels of 60% relative humidity. Parental plants were shaped to allow each plant to produce a minimum of 10 axillary shoots approximately 10–13 cm in length from which ramets would be collected. A number of cuttings were taken from each parental plant to create sister plants or ramets. Ramets were given a 0.35% IBA (indole-3-butyric acid) treatment then placed in rockwool plugs in trays containing water. Trays were kept in a controlled environment at a constant 24 °C temperature, 60% relative humidity, and a PPFD of 100 μmol m−2s−1 for root initiation. Ramets were given 14 days for root formation.
Once the ramets had sufficient root growth they were transplanted into 2-gallon pots and randomly distributed within the growth room. Similar growth conditions to the parental plants were applied to the ramets through the duration of the experiment. The growth room was maintained at a constant photosynthetic photon flux density (PPFD) of 120 or 280 μmol m−2s−1 measured at a 90 cm height, with a 25 °C/22 °C day/night temperature, and 60% relative humidity. Ramets were supplemented with 100 ppm nitrogen solution throughout the experiment. Plants were transplanted again after 10 weeks in the 2-gallon pots into 3-gallon pots and moved to a high ceiling growth room for biomass accumulation experiments.

2.2. Growth and Biomass Analysis

From one week post potting, phenotype evaluation was carried out on a weekly basis. This evaluation included height measurement, root collar diameter (RCD) measurement, leaf number counting, SPAD reading (soil plant analysis development: an instrument to measure chlorophyll content, used to determine the relative health of the plant), and morphology recording. Plant height and RCD were measured weekly. From these measurements we calculated plant volume as a proxy to above-ground biomass, using the formula:
Volume = area of root collar × (height/3)
For biomass analysis, the plants were harvested at 15 or 21 weeks. Plant material was separated into stems, leaves, and roots. Roots were removed from pots and washed with a gentle massage to remove residual soil, after which they were tapped dry on paper towels. The fresh weight of each material was recorded, then the material was dried in an oven at 60 °C for 7 days, after which dry weight was recorded.

2.3. Agrobacterium-Mediated Transformation of Poplar Hybrid Clone 717-1B4

Agrobacterium tumefaciens strain MP90 transformed with the binary vector pLC0102 was cultured in LB media with 200 µM acetosyringone for 24 h at 28 °C and shaken at 220 rpm. Stem explants isolated from in vitro propagated plants of hybrid Populus tremula × Populus alba, clone INRA 717-1B4, were used for Agrobacterium-mediated transformation. The explants were swirled in the Agrobacterium suspensions for 20 min, and then co-cultured on callus induction medium (CIM) [Murashige-Skoog (MS) medium supplemented with 10 µM NAA, 5 µM 2iP, 0.7% micropropagation Type I agar (Caisson Labs, Smithfield, UT, USA)] and incubated at 27 °C for 48 h in the dark. Explants were washed four times with deionized water with 250 mg/L cefotaxime, transferred to CIM with 100 mg/L Kanamycin, 250 mg/L cefotaxime and incubated for 21 days at 27 °C in the dark. Stem explants were then incubated under light (16 h light/8 h dark). Developing green calli were transferred to a shoot induction medium (SIM) [MS medium supplemented with 0.2 µM thidiazuron (TDZ), 100 mg/L Kanamycin, 250 mg/L cefotaxime, and 0.7% agar] for selection of transformed shoots and to control Agrobacterium overgrowth. Regenerated shoots were excised when they were approximately 1 cm long and transferred to rooting medium supplemented with ½ MS salts with vitamins, 0.5 µM indole-3-butyric acid (IBA), 50 mg/L kanamycin, and 250 mg/L cefotaxime. After 5–8 weeks, rooted and elongated shoots were propagated on the same medium in Magenta boxes. Rooted LC0102 transgenic plants were transferred into soil pots, acclimated, and grown under an inverted diurnal cycle. Eight weeks post potting, T0 plants went through a vegetative propagation cycle using a stem-cutting method frequently used in horticulture practice. Briefly, the apical meristem was removed to release the apical dominance to stimulate the formation of axillary buds for ramet propagation. To track the genetic lineage of transgenic lines, cuttings from the T0 plant are called C1 plants. Cuttings from C1 plants are called C2 plants.

2.4. RNAi Design, Vector Construction, and Sequence Information

Poplar PLGG1 and various reference genes were identified through search of various databases including JGI’s Phytozome (https://phytozome-next.jgi.doe.gov/, accessed on 7 December 2019), NCBI’s Populus nr database (https://www.ncbi.nlm.nih.gov/, accessed on 6 July 2020), Popgenie (https://popgenie.org, accessed on 6 July 2020), and AspenDB (http://aspendb.uga.edu/, accessed on 1 May 2021). Using the amino acid sequence of plastidal glycolate/glycerate translocator in Arabidopsis (AtPLGG1) as the query led to the identification of PLGG1 homologs in P. trichocarpa (Potri.003G099600.1) and P. alba × P. tremula (XM_035032358 and Potra000595g04516.1, details described in results). To minimize the likelihood of off-target down-regulation, a region of PotriPLGG1 with minimal paralogy was selected. The RNAi region is 256 bp in length, 886–1142 of the transcript and 750–1006 measured from the start codon. RNAi element was designed as an intronic hairpin RNA interference system (ihRNAi) as in the pKANNIBAL plasmid series, which utilizes the PDK intron between a sense-antisense sequence of the previously defined target region [29].
Construct LC0102 was designed computationally to resemble the bypass design of South et al. for expression in the poplar using Geneious Prime software (Boston, MA, USA), synthesized at GenScript (Piscataway, NJ, USA), and cloned into a binary vector pCambia3200 that was then introduced into Agrobacterium MP90 for poplar transformation.
GenBank, AspenDB, and Popgenie accession number of gene sequences in this work: AtAct2, U41998.1; AtPLGG1, AT1G32080; AtRbcS, NM_105379.4; AtRbcS2b, X14564.1; ChMS, X56948.1; CrGDH, XP_001695381.1; FtPDK, X79095.1; OCS_Ter, CP033030.1; PaPLGG1, XM_035032358; PotriPLGG1, Potri.003G099600.1; PtaAct, Potri.001G309500, sPta717, v1.1; PtaEF1B-1, Potri.001G224700, sPta717, v1.1; PtaPP2A-2, Potri.015G068300, sPta717, v1.1; PtaRP, Potri.001G342500, sPta717, v1.1; PtrPLGG1, Potra000595g04516.1; Spm_PRO, M25427.1.

2.5. Nucleic Acid Extraction and Quantification

Approximately 100 mg of leaf tissue from the second to fourth fully emerged leaf from the apical bud was used for DNA extraction using the NucleoSpin Plant II kit (Macherey-Nagel, Allentown, PA, USA). Leaf tissue was disrupted with 400 µL PL1 from the kit using BeadBeater (BioSpec, Bartlesville, OK, USA) at 2400 rpm, 1 min with four 2.3 mm steel beads 6 times until the tissue was fully homogenized. 10 µL of RNase was added to the homogenized tissues then incubated at 65 °C for 10 min. Samples then proceeded with filtration, binding, washing, and elution steps according to the manufacturer’s protocol.
For RNA extraction, 30 mg of leaf tissue was collected from plants that were at the end of 8 weeks after being transplanted to the 2-gallon pot. Tissues were soaked with 110 µL lysis buffer containing 100 µL PFL and 10 µL PFR from the NucleoSpin RNA Plant and Fungi kit (Macherey-Nagel, Allentown, PA, USA) and disrupted using BeadBeater (BioSpec, Bartlesville, OK, USA) at 2400 rpm, 30 s with four 2.3 mm steel beads 2–3 times until fully homogenized. An amount of 440 µL of lysis buffer containing 400 µL PFL and 40 µL PFR were added into the homogenized sample and incubated at 56 °C for 5 min. Samples were then treated with 95 µL DNase for 15 min at RT after PFW1.
DNA and RNA concentrations were measured using Cytation 1 plate reader with Take3Trio plates (Agilent, Santa Clara, CA, USA) in 2 µL volume.

2.6. Primer Design and Evaluation

Primers and probes were designed using PrimerQuest Tool (Integrated DNA Technologies, Coralville, IA, USA) with default settings. Gene sequences were obtained from NCBI or AspenDB. Each primer set was mapped to the P. tremula and P. alba sequences obtained from AspenDB using Geneious Prime and manually adjusted to ensure primer specificity and universal amplification from both alleles. The specificity of the primers was further validated using PCR and DNA gel electrophoresis on 1% (w/v) agarose gels containing 1× SYBR Green I Nucleic Acid Gel Stain (Thermo Fisher Scientific, Waltham, MA, USA) in 1× TAE buffer. Primer efficiencies were evaluated with qPCR or qRT-PCR in singleplex condition using DNA or RNA purified from transgenic plants as standard with 5× dilution series starting from 100 ng and 1 µg respectively. Standard curves were generated using CFX Maestro software (Bio-Rad, Hercules, CA, USA) to calculate the primer efficiency. Primer sequence, concentration, and amplicon length are listed in Table S1.

2.7. PCR, qPCR, and qRT-PCR

PCR analysis was performed to provide quick validation of transgenic status or primer specificity (Table S1). The 20 µL reaction contains 20 ng genomic DNA, 1× GoTaq Master Mix (Promega, Madison, WI, USA), and 500 nM each of forward and reverse primers. PCR program: 2 min 95 °C initial denaturation; 35 cycles (95 °C, 30 s; 54.1 °C, 30 s; 72 °C, 2 min); 5 min 72 °C final extension.
Multiplex qPCR analysis with technical quadruplicates in each event was used for copy number estimation using a CFX Opus 96 machine (Bio-Rad). Multiplex condition was validated by comparing singleplex and multiplex results to see if the Cq value changes according to the standard mentioned in the primer design section. The 20 µL reaction contains 20 ng genomic DNA, 1× TaqPath ProAmp Multiplex Master Mix (Thermo Fisher Scientific, Waltham, MA, USA), primers, and probes (Table S1). qPCR was performed with the following conditions: 95 °C, 10 min; 40 cycles (95 °C, 15 s; 60 °C, 30 s). RP was selected as the reference gene with a copy number of 2. The estimated copy number of the target was calculated using CopyCaller (Thermo Fisher Scientific, Waltham, USA). The copy number was calculated based on 2(−ΔΔCq)×copy number of the target gene in the calibrator, where ΔCq = Cqtarget gene − Cqreference gene, and ΔΔCq = ΔCqsample − ΔCqcalibrator.
Multiplex qRT-PCR analysis with technical duplicates for each event using CFX Opus 96 machine (Bio-Rad, Hercules, CA, USA) was used for gene expression analysis, with multiplex conditions validated as described previously. The 20 µL reaction contains 200 ng total RNA, 1× custom-made One-Step RT-qPCR Master Mix with a lower amount of DTT (Launchworks, Bothell, WA, USA), primers, and probes (
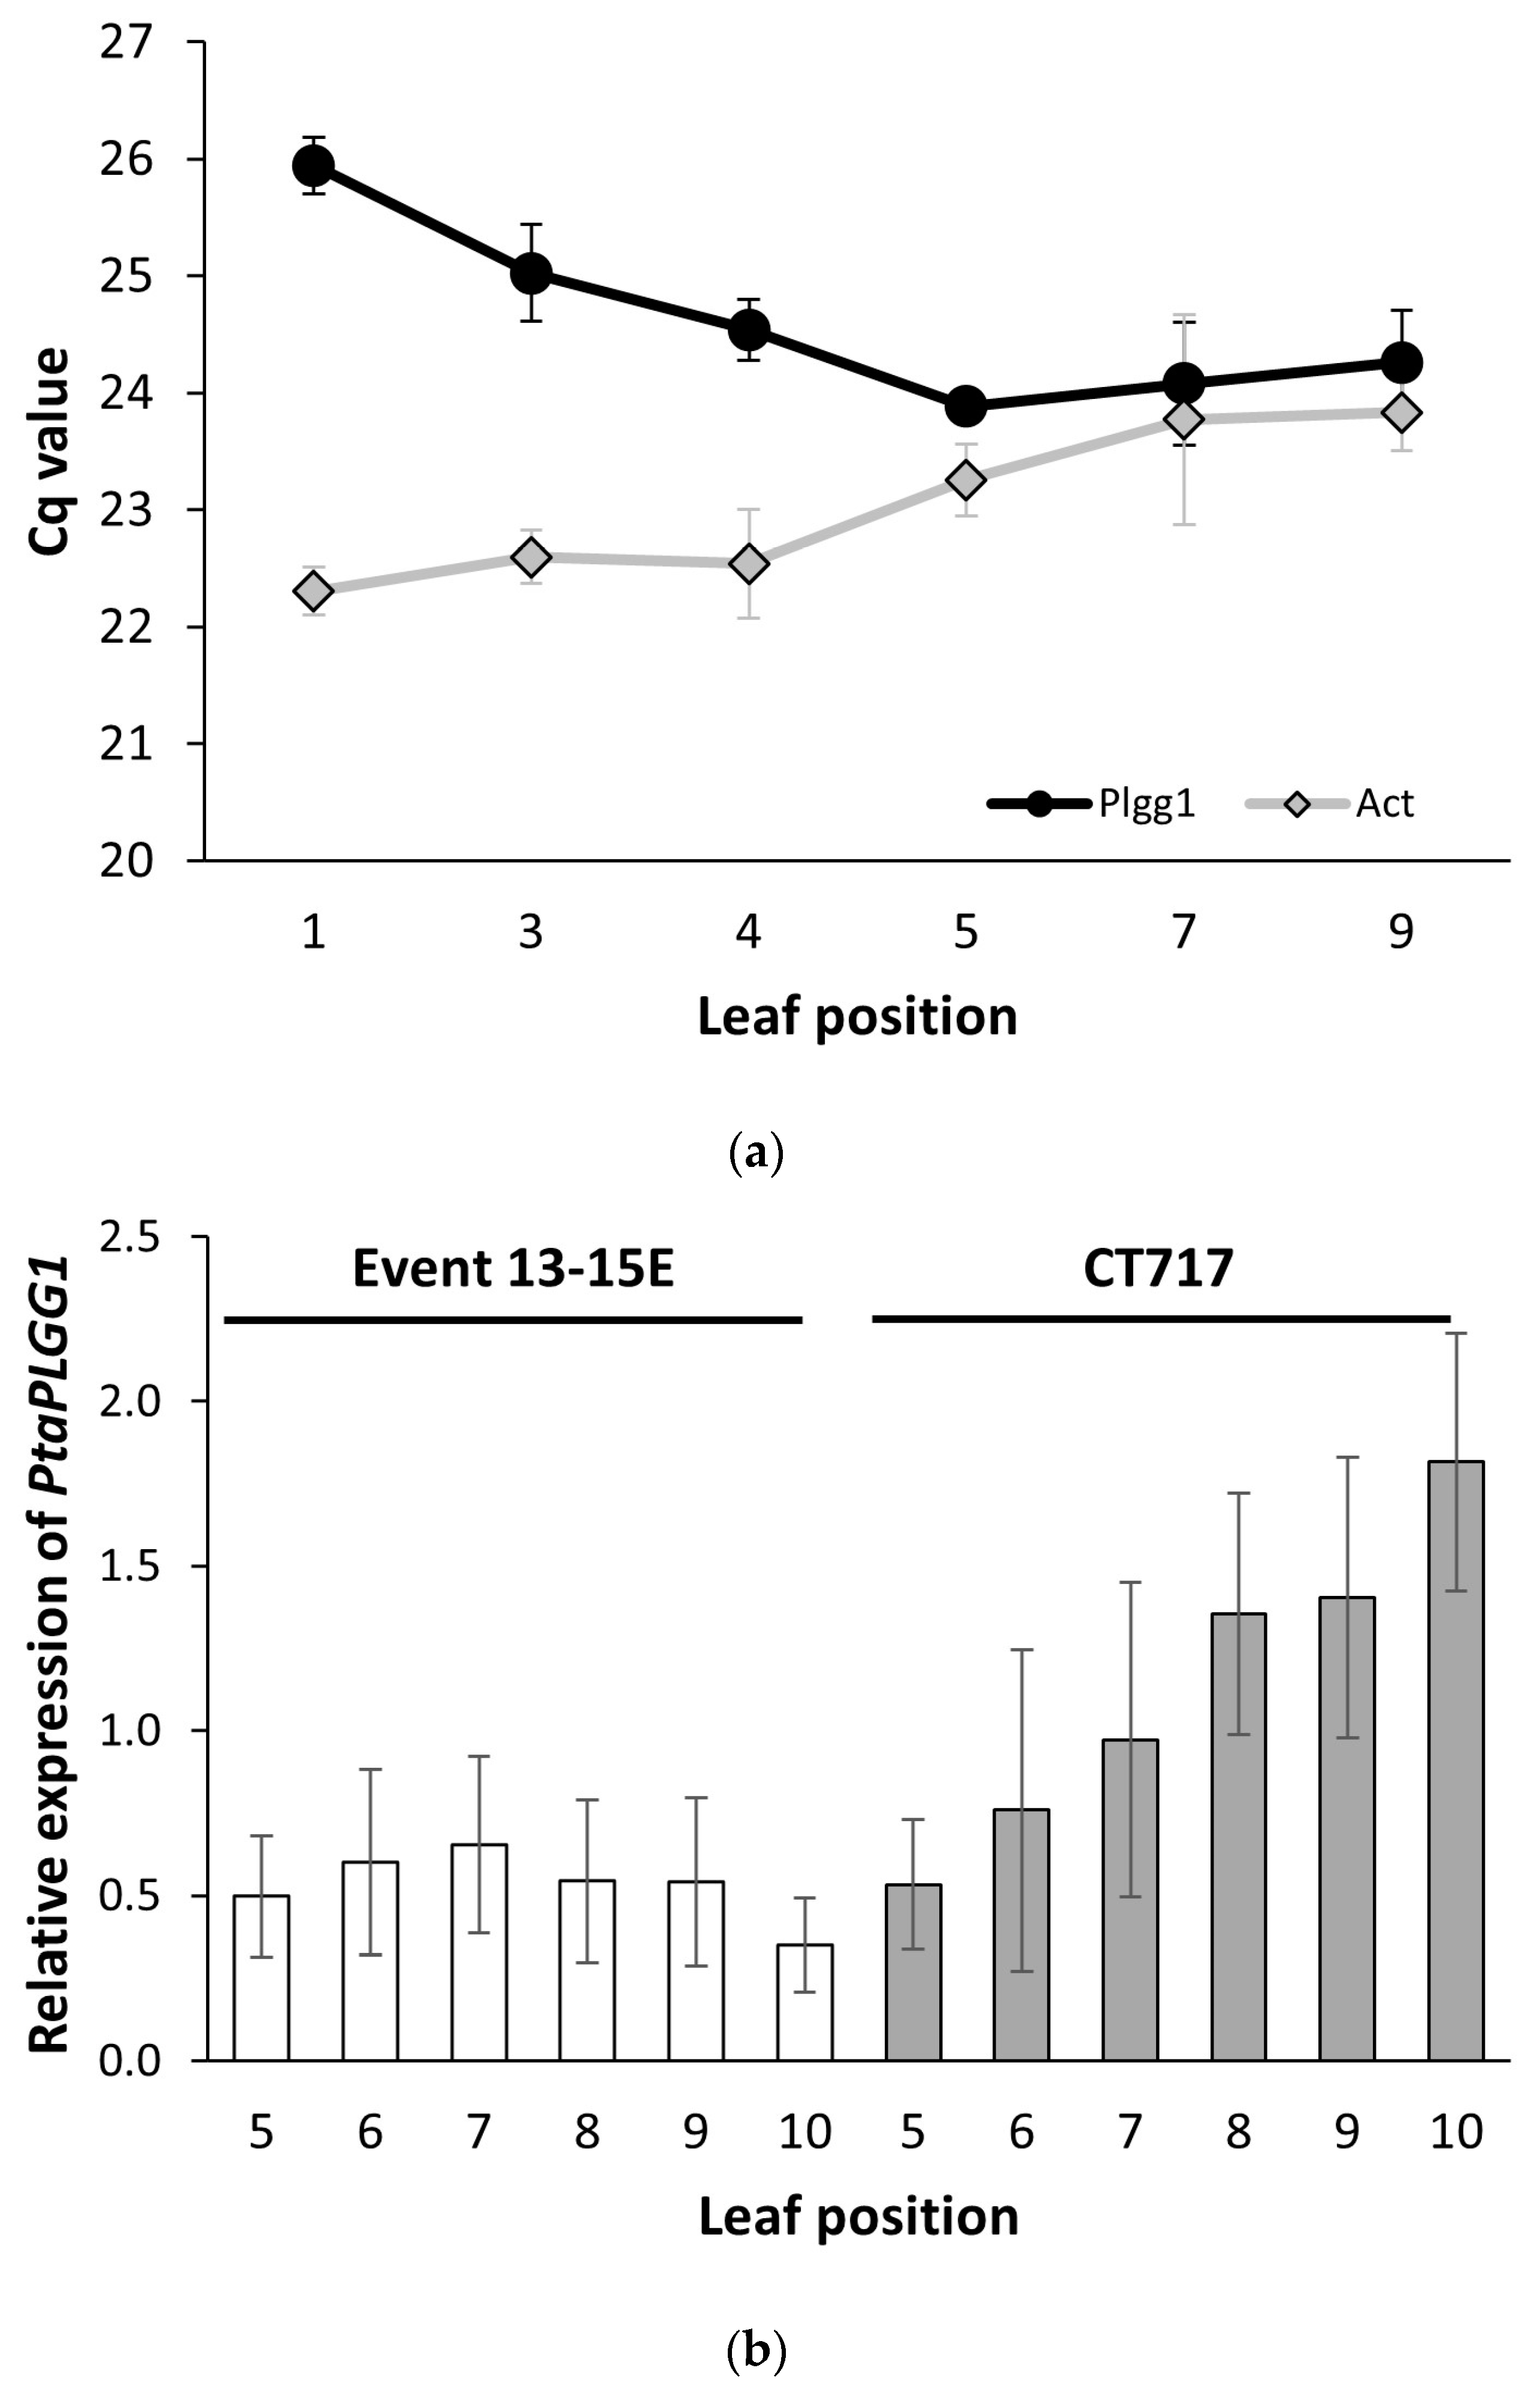
Table S1). qRT-PCR was performed with the following conditions: 53 °C, 10 min, reverse transcription; 95 °C, 2 min, initial denaturation; 40 cycles amplification (15 s 95 °C denaturation; 30 s 60 °C annealing/ extension). Reference genes were selected based on expression evaluation in leaves of various developmental stages. PtaAct, PtaEF1B-1, PtaRP, and PtaPP2A-2 were selected for testing based on previous reports [30,31,32,33,34,35]. The average Cq of the selected reference genes were used for ΔCq calculation. The 2(−ΔΔCq) method was used to analyze the expression data.

2.8. Gas-Exchange Measurements

Photosynthesis activity was measured using a Li-Cor 6800 infrared gas analyzer (Li-Cor Biosciences, Lincoln, NE, USA) on poplar plants grown in a controlled environment as described in the plant growth and propagation section. Measurements were performed on various developmental stages of poplar plants depending on the experimental plan. Generally Leaf 8 or 9, counting from the first leaf with a petiole separated from the apical bud, was selected for these measurements and all measurements were taken between 8 am and 2 pm. The leaves were maintained at 25 °C, 1500 PAR, with VPD fixed at 1.3 kPa. For photosynthetic CO2 response curves or A-Ci curves, before starting the measurements leaves were acclimated at 410 ppm CO2 for a minimum of 8 min until a steady state was reached. Once steady state had been achieved, two data points were logged with a 1.5 min interval to record ambient Anet (net CO2 assimilation under ambient 410 ppm CO2). Following these ambient measurements, the leaf was subjected to a series of CO2 concentrations ranging from 0–2000 ppm CO2 (400, 300, 200, 100, 50, 0, 400, 600, 800, 1000, 1200, 1500, 2000), and measurements were taken when assimilation reached a steady-state rate at each CO2 setting. Jmax and Vccmax were derived from an A-Ci curve fitted using the R package “plantecophys” [36]. Jmax is the maximum rate of photosynthetic electron transport, Vcmax is the maximum rate of carboxylation), and Amax is the CO2 assimilation rate at 2000 ppm CO2.

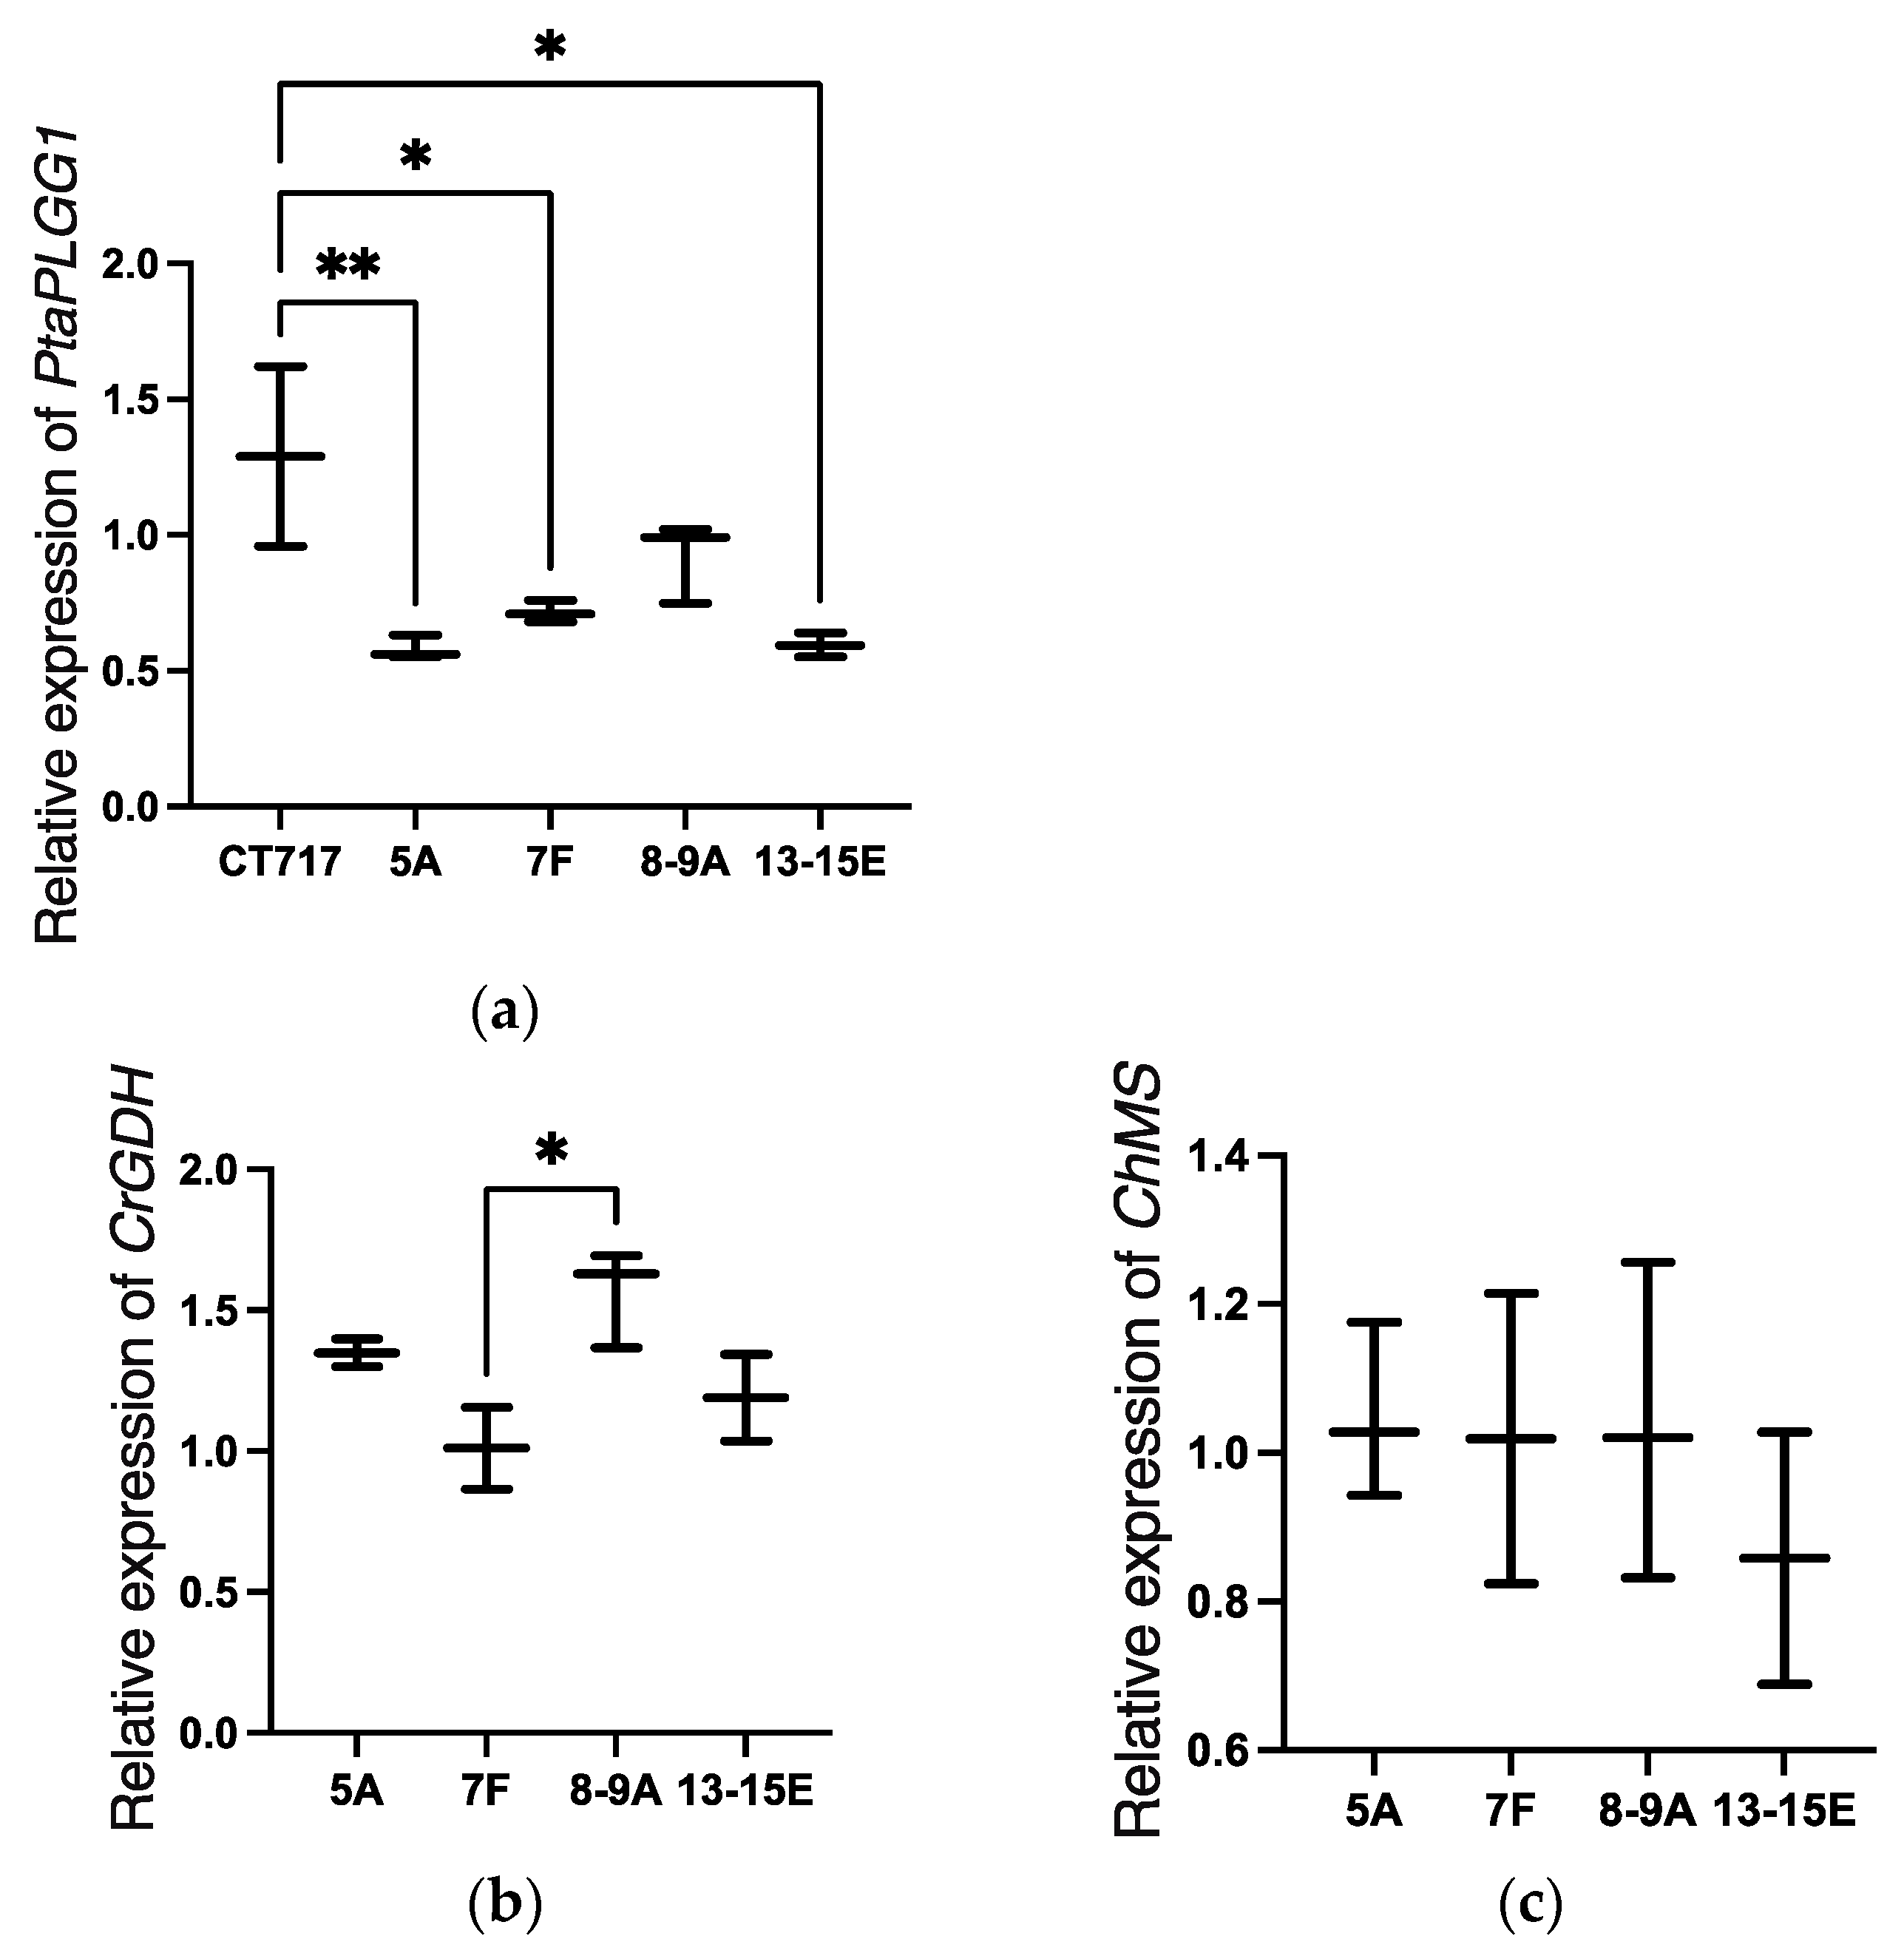
2.9. Statistical Analyses

Statistical analysis of gene expression data was performed using Prism (GraphPad, Boston, MA, USA). Statistical significance was reported based on ANOVA followed by Tukey’s multiple comparison tests. *, **, and **** represent a significant difference at p < 0.05, p < 0.01 and p < 0.0001 respectively. Statistical significance of gas exchange, growth rate, and biomass data was reported based on one-tailed t-tests, comparing each transgenic event to the non-transgenic controls. Significance is represented by * (p < 0.05) and ** (p < 0.01).

3. Results

3.1. Construct Design and Transgenic Line Generation and Propagation

Construct LC0102 was designed to resemble the photorespiration bypass pathway described in South et al. [24] (Figure 1). It consists of four poplar expression cassettes. Cassette 1 includes the sequence encoding glycolate dehydrogenase from Chlamydomonas reinhardtii (CrGDH,) under the control of the Arabidopsis thaliana Actin 2 (“Act2”) promoter and terminator (AtAct2). A cDNA sequence encoding the Arabidopsis thaliana RuBisCO Small Subunit (AtRbcS) signal peptide is translationally fused to the coding sequence of CrGDH so that the AtRbcS chloroplast targeting signal peptide will direct the CrGDH protein to the poplar chloroplast. Cassette 2 consists of the sequence encoding malate synthase from Cucurbita hybrid species Cucurbita sp. Kurokawa Amakuri Nankin (ChMS) operably linked to the Zea mays Suppressor Mutator promoter (Spm_PRO) and the Agrobacterium tumefaciens octopine synthase terminator (OCS_Ter). Similarly, the ChMS coding sequence is fused with the coding sequence for AtRbcS chloroplast targeting signal peptide. Cassette 3 is a transcriptional unit expressing a small interference RNA design 1 (siRNA1) to target the mRNA of the poplar PLGG1 gene. Cassette 4 consists of the 35S promoter-driven expression of the selectable marker gene nptII for selection of transgenic events.
Hybrid poplar INRA 717-1B4 is a hybrid clone of P. tremula × P. alba. In the diploid genome of the hybrid, any given locus would be present as one allele from P. alba and one allele from P. tremula. Pta, standing for Populus tremula × alba, is used to distinguish the hybrid gene from the parental genes. For example, the PLGG1 gene of INRA 717-1B4 is named PtaPLGG1 representing PLGG1 gene sequences from both parental genomes. A database search using the amino acid sequence of Arabidopsis PLGG1 as a query against NCBI’s Populus nr database revealed a single hit from P. alba with 69.85% AA sequence identity. Using the sequence of PaPLGG1 as a query to search for P. tremula homologs in the Popgenie database, a genome and transcriptome database focused on Populus, resulted in a single hit from P. tremula which shares 99.24% AA identity with PaPLGG1. Comparison of the coding sequences between P. alba and P. tremula reveals 10 allelic differences including a 6 bp gap and 9 SNPs. The 256 nucleotide siRNA1 design avoided sequences containing the 6 bp gap. To drive the expression of siRNA1, the Arabidopsis thaliana RuBisCO Small Subunit 2b promoter was selected (AtRbcS2b) (Figure 1).

3.2. T0 Evaluation of Transgenic Events

We generated 41 independent transgenic events via Agrobacterium-mediated transformation of poplar hybrid 717. Rooted transgenic plants, designated as T0 following conventional nomenclature, were transferred out of tissue culture into soil pots, acclimated, and grown in a controlled environment. Preliminary analysis was carried out on 717 poplar plants to determine the acclimation time of the plants to soil, determined by the stability of Vcmax (the maximum rate of carboxylation by RuBisCO), which occurred six weeks post transplant (Figure S1).
A PCR analysis was performed to validate the transgenic status of T0 plants as they came out of tissue culture. Among the 41 T0 events, three were identified as transformation escapes as they did not contain any of the four transgenes. Some T0 events showed undesired growth phenotypes such as dwarfing, possibly due to the random insertion of transgenes in the genome that disrupted essential genes. These events were not carried forward for growth evaluation.
The remaining 25 T0 transgenic events along with two transformation escape lines were shaped for vegetative propagation. Three to five seedlings were produced from each shaped T0 mother line for C1 growth performance evaluation (Table S2). Based on growth rate at Week 4 post soil, 11 transgenic events were selected and shaped. The mothers were propagated to produce 30–40 seedlings for multi-year field testing. Four transgenic events, including 13-15E and 5 A that are among the 11 selected for field trial, were moved to a small high ceiling growth room where the additional tree growth could be accommodated. These events were evaluated on growth performance, transgene expression, and CO2 assimilation. Estimated copy numbers from qPCR analysis of transgenes in the selected transgenic events are varied but in general not very complex (Table S2). The top performing event from C1 and a non-transgenic control were then analyzed in a repeat experiment using the next generation of vegetatively propagated C2 ramets.

3.3. C1 Evaluation of Selected Transgenic Events

3.3.1. Developmental Variation in the Expression Level of Endogenous PtaPLGG1 Gene

To evaluate the effectiveness of the RNAi design in reducing PtaPLGG1 expression in transgenic events, we first chose to examine the endogenous expression levels of PtaPLGG1 in leaves of various developmental stages. As shown in Figure 2a, the absolute Cq value of PtaPLGG1 was higher in younger leaves and decreased in older ones (Figure 2a), indicating significantly higher and relatively stabilized expression levels in older but still transcriptionally active leaves, leaf position 5–9. We then used transgenic Event 13-15E to examine the dynamics of PtaPLGG1 expression reduction in various leaf positions where PtaPLGG1 achieves stabilized expression. Comparing relative expression levels of PtaPLGG1 across different leaf developmental stages revealed more effective reduction of PtaPLGG1 in transgenic plants in older leaves, leaf number 8–10 (Figure 2b). We next examined the expression of transgenes CrGDH and ChMS in leaf position 5–10 of transgenic Event 13-15E (Figure 2c,d). Variations in the expression levels were also observed, although the level of variation was not as high as that of PtaPLGG1 (Figure 2b). Leaf number 8 was then selected for more accurate gene expression analysis in experiment C2.

3.3.2. The Levels of Transgene Expression and RNAi Inhibition Are Varied among Selected Transgenic Events

Gene expression analysis was performed with selected transgenic Events 13-15E, 5 A, 7F, and 8-9 A. The degree of reduction in PtaPLGG1 expression varies from event to event, representing the variation in the expression level of transgenic RNAi among independent transgenic events. A significant reduction in the expression level of PtaPLGG1 was observed in Events 13-15E (p < 0.05), 5 A (p < 0.01), and 7F (p < 0.05) compared to the non-transgenic control (Figure 3a) indicating that the RNAi design in construct LC0102 functions properly in these Events. All four transgenic events showed strong expression of CrGDH and ChMS (Figure 3b,c). As control plants lack these transgenes and thus have zero transgene expression, a transgenic event was chosen for normalization, in this case, Event 7F. Reduction of PtaPLGG1 expression would result in lower amounts of glycolate being transported out of chloroplast, a key strategy to inhibit photorespiration. This, coupled with strong expression of genes in the shunt pathway, is a promising sign that we have successfully introduced an alternative photorespiration pathway in poplar.

3.3.3. Increased Photosynthetic Activity in Transgenic Events 13-15E and 7F

Photosynthetic activity was measured through the production of A-Ci curves; plots of photosynthetic CO2 assimilation versus CO2 concentrations inside the leaf (to remove any influence of stomata). Transgenic Events 13-15E and 7F showed a higher rate of photosynthesis than controls when not limited by light or CO2 (Figure 4a and Figure S2). A photosynthetic activity increase in transgenic Events 13-15E and 7F is also seen in the increase in Jmax, the maximum rate of photosynthetic electron transport for a given light intensity (Figure S2a). The other two C1 transgenic Events 5A and 8-9A showed no significant difference in photosynthesis rates when compared to non-transgenic controls (data not shown).

3.3.4. Increased Stem Volume Growth Rate in Transgenic Events 13-15E and 7F

Following our results that showed successful PtaPLGG1 reduction and expression of CrGDH and ChMS (Figure 3), and an enhanced rate of photosynthesis in 13-15E and 7F (Figure 4a and Figure S2), we expected to see growth rate increases and biomass production enhancement in plants of these transgenic events.
Stem volume (V = root collar diameter × height 1/3) was calculated to estimate differences of biomass accumulation in a young plant. At nine weeks post transplanting, plants of transgenic Events 7F and 13-15E started to show growth advantage (Figure S3). As the plants grew older, the growth advantage of 7F and 13-15E plants became more apparent compared to non-transgenic plants, reflecting the increase of photosynthetic activity in these events (Figure 4). The plants of 13-15E started to gain more stem volume and outgrew the 7F plants at Week 12 (Figure S4).
At Week 21, transgenic Events 13-15E and 7F were taller than non-transgenic controls (Figure 4b) with 18.4% and 14.6% increases, respectively. These plants also deposited more carbon in the stem with the increased RCD resulting in significantly higher stem volume (Figure 4c). The respective stem volume increases over non-transgenic plants at 54% (Event 13-15E) and 31% (Event 7F) are significantly higher than the percentage increase in sheer height. The other two transgenic Events, 5A and 8-9A, did not show significantly higher stem volumes (Figure 4c).

3.3.5. Biomass Production Increase in Transgenic Events

Events 13-15E, 7F, and non-transgenic control CT717 were harvested for biomass measurements after 21 weeks of growth. Leaf, root, and stem tissue of each plant was harvested separately and the fresh weight (FW) was recorded. Dry weights (DW) were recorded after drying at 60 °C for 7 days to completely remove all water and volatiles. Transgenic Event 13-15E had significantly higher biomass production in all tissue types in both FW and DW, with a 53% increase in above-ground (AG) leaf and stem tissue DW over that of non-transgenic CT717 control plants (Figure 4d and Figure S5). Transgenic Event 7F also displayed significantly higher biomass production in stem and roots with both FW and DW, but not in the leaves (Figure 4d and Figure S5). This is approximately in line with earlier estimations using stem volume growth, demonstrating this is a reasonable proxy for biomass (Figure 4c and Figure S4) or projections for young trees.

3.4. C2 Evaluation of Top Performing Event and Non-Transgenic Control

We selected the highest-performing event from the C1 evaluation to run an independent repeat experiment using an increased number of replicates. In C1 evaluation, 13-15E showed strong expression of GDH and MS (Figure 3b,c), as well as a significant reduction in PLGG1 (Figure 3a). This corresponded with the greatest increase in stem volume and biomass (Figure 4c,d), as well as improved photosynthetic characteristics (Figure 4a and Figure S3), therefore 13-15E was selected for repeat experiments.
In the C2 repeat experiment, Event 13-15E again showed strong expression of CrGDH and ChMS (Figure S6) and a strong reduction of PtaPLGG1 (Figure 5a). The degree of expression reduction was slightly greater compared to that in the C1 experiment (Figure 3a). This is likely due to the increase in light intensity in the C2 experiment (280 μmol m−2s−1 compared to 120 μmol m−2s−1 in the C1 experiment).
Equally, Event 13-15E again showed higher photosynthetic activity (Figure 5b,c,g) compared to the control. This increase in photosynthetic activity can be seen in significantly increased Amax, CO2 assimilation rate at maximum CO2 concentration, 2000 ppm, (Figure 5b; p = 0.033) and Jmax (Figure 5c; p = 0.017) values. No significant differences in Vcmax (the maximum rate of carboxylation activity of RuBisCO) between 13-15E and control were observed (Figure 5d).
The ratio of Jmax:Vcmax was greater in 13-15E but not significantly so (p = 0.065; Figure 5e) probably due to the variation in Vcmax (Figure 5d). A second repeat C2 experiment (Figure S7) found a significant increase in the Jmax:Vcmax ratio in Event 13-15E compared to the control, leading to the possibility of using the value of the Jmax:Vcmax ratio as an indicator of photosynthesis activity. This was coupled with repeated significant increases in Jmax and Amax in 13-15E (Figure S7).
Event 13-15E again showed an increase in stem volume (+35%, Figure 5f) compared to the control. This increase was not as large as the increase seen in the C1 evaluation, and we attribute this to variations in growth conditions; C2 evaluation had increased light intensity of 280 μmol m−2s−1 and the higher light intensity led to faster plant growth. C2 experimental plants gained similar stem volume in a shorter amount of growth time (14 weeks vs 17 weeks; Figure S4 compared to Figure S8).
Plants were harvested at Week 15 for biomass measurement. A significant increase in above-ground biomass was again observed in Event 13-15E compared to control (35%; Figure 5h). The biomass increased in all tissue types (Figure 5h).

4. Discussion

A number of photorespiration bypass pathways have been conceived and tested in C3 annuals thanks to the advancement of knowledge in synthetic biology [20,21,22,23,24,25,26]. Significant increases in photosynthetic efficiency and crop grain yield have been observed [25,26]. After evaluation of design principles, we elected to test a pathway in conjunction with glycolate transporter inhibition in the poplar hybrid INRA 717-1B4 [
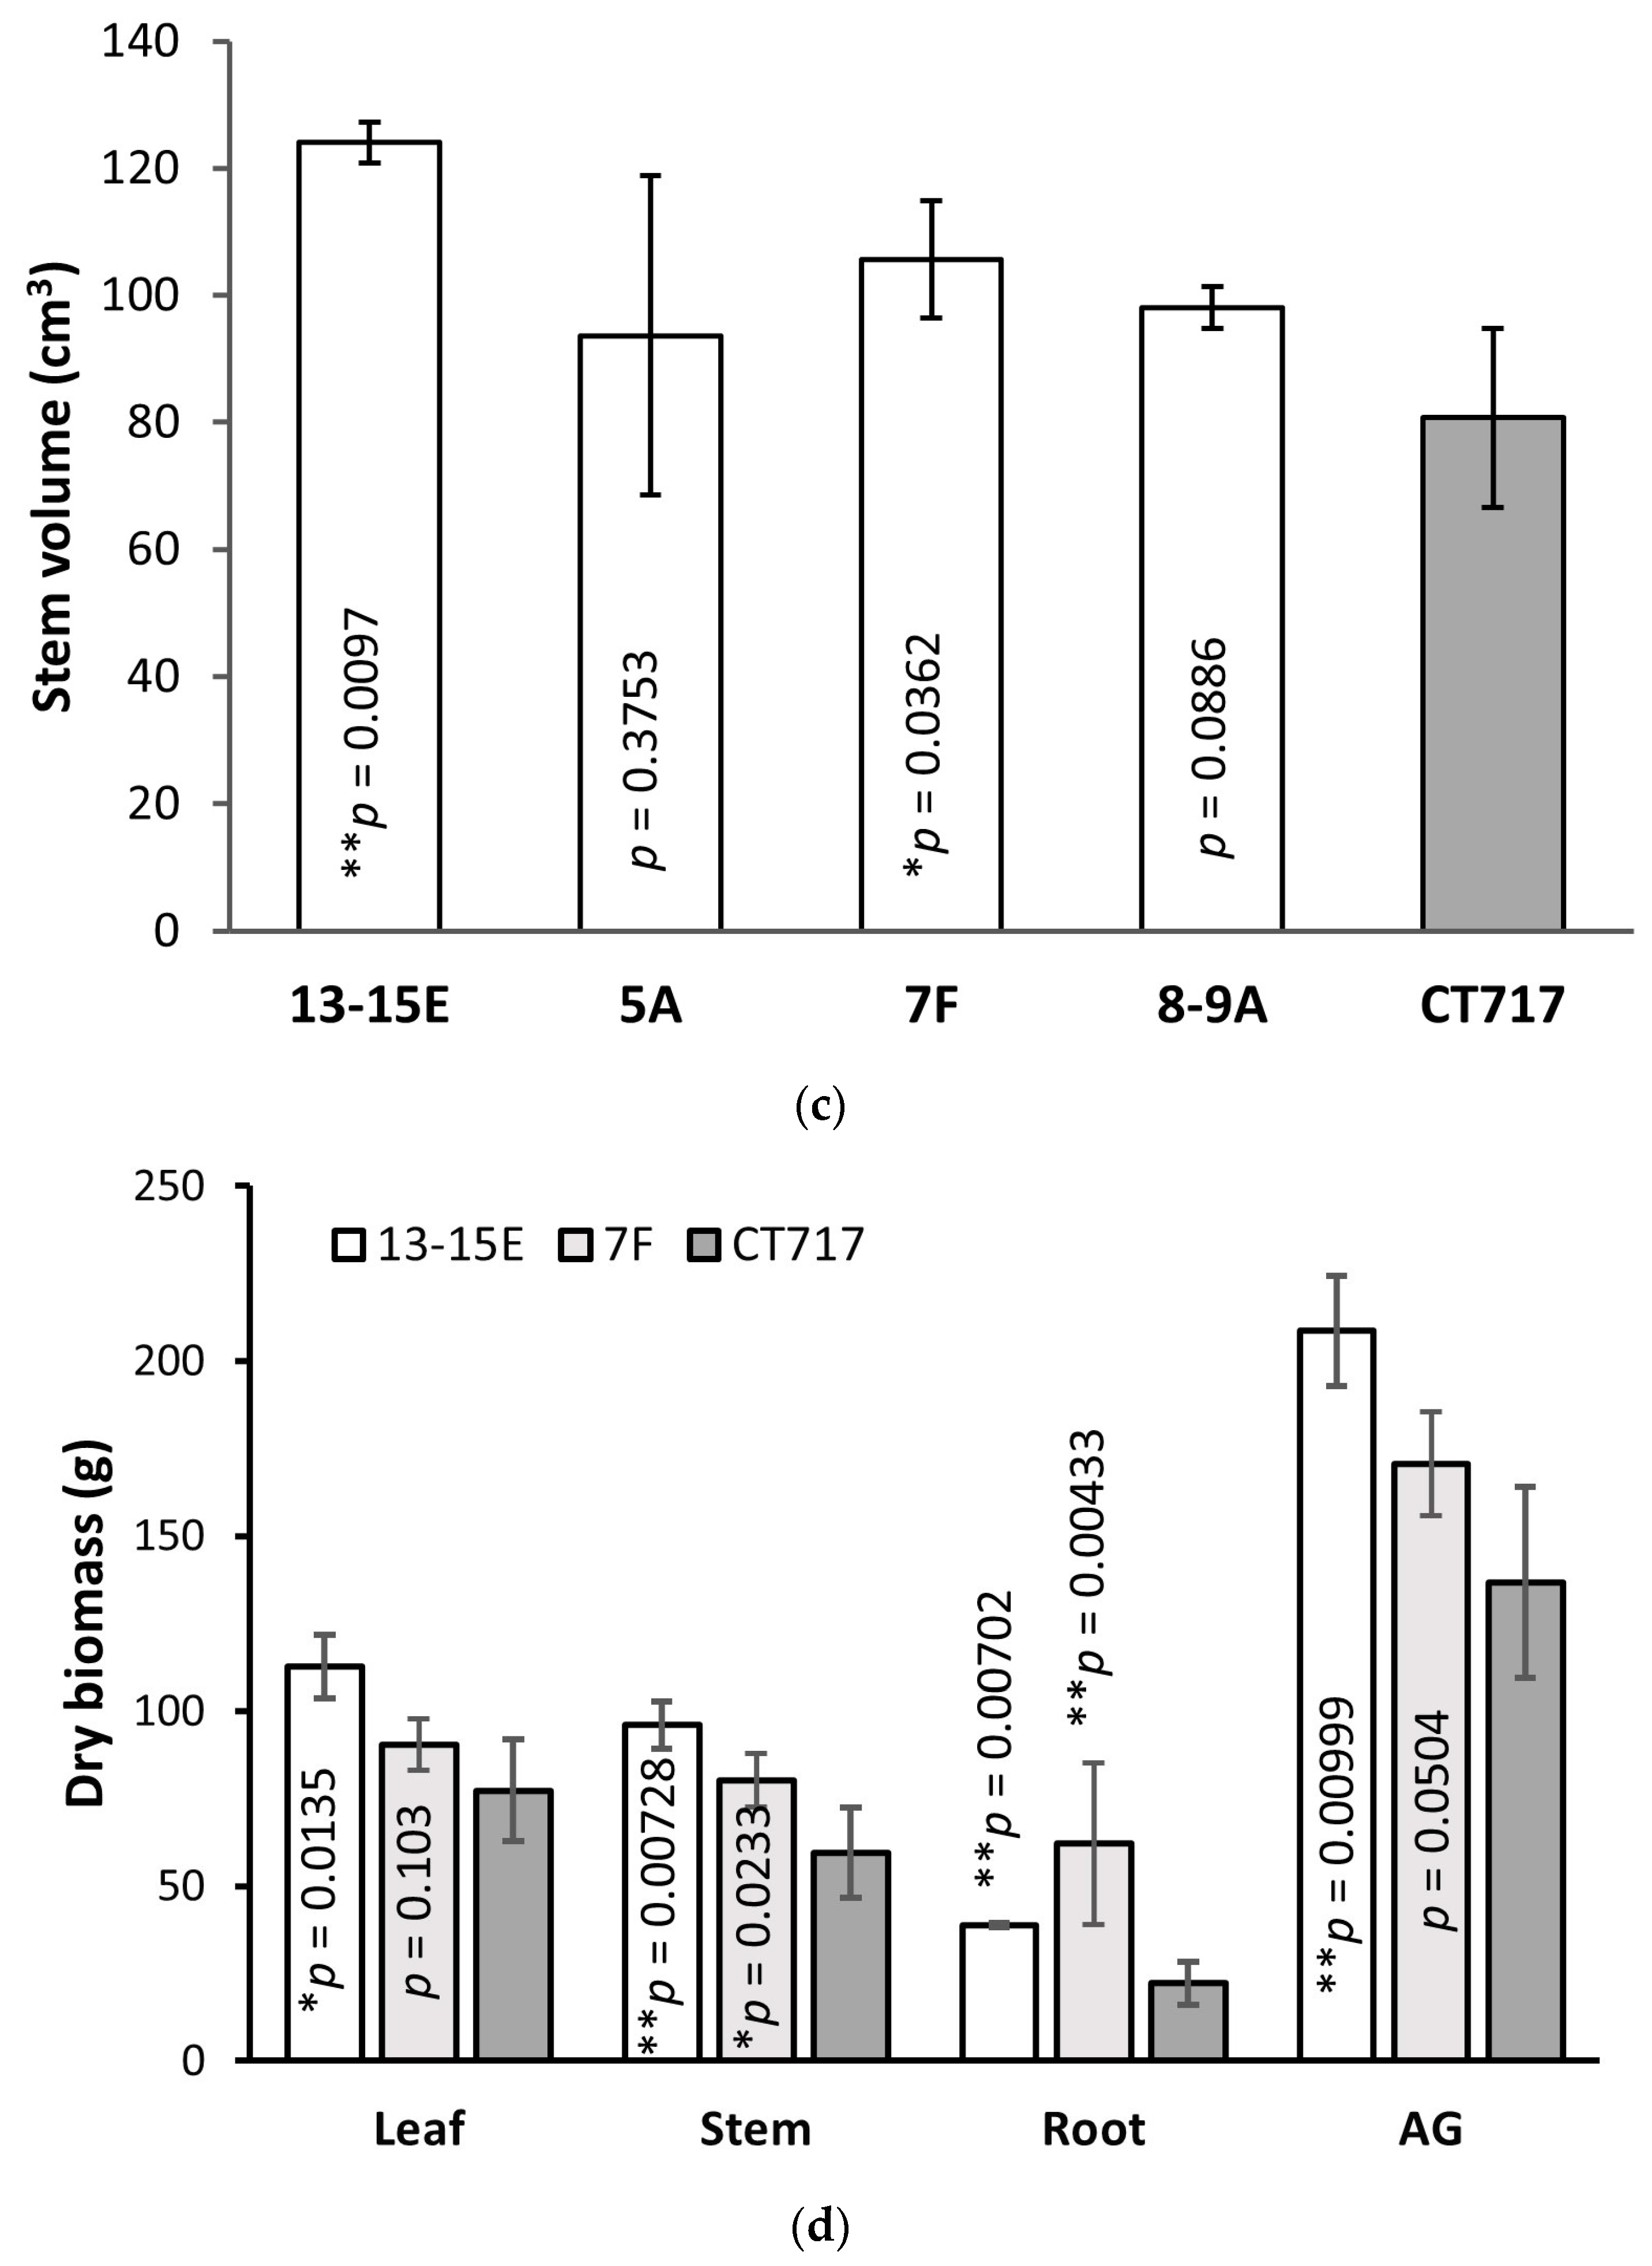
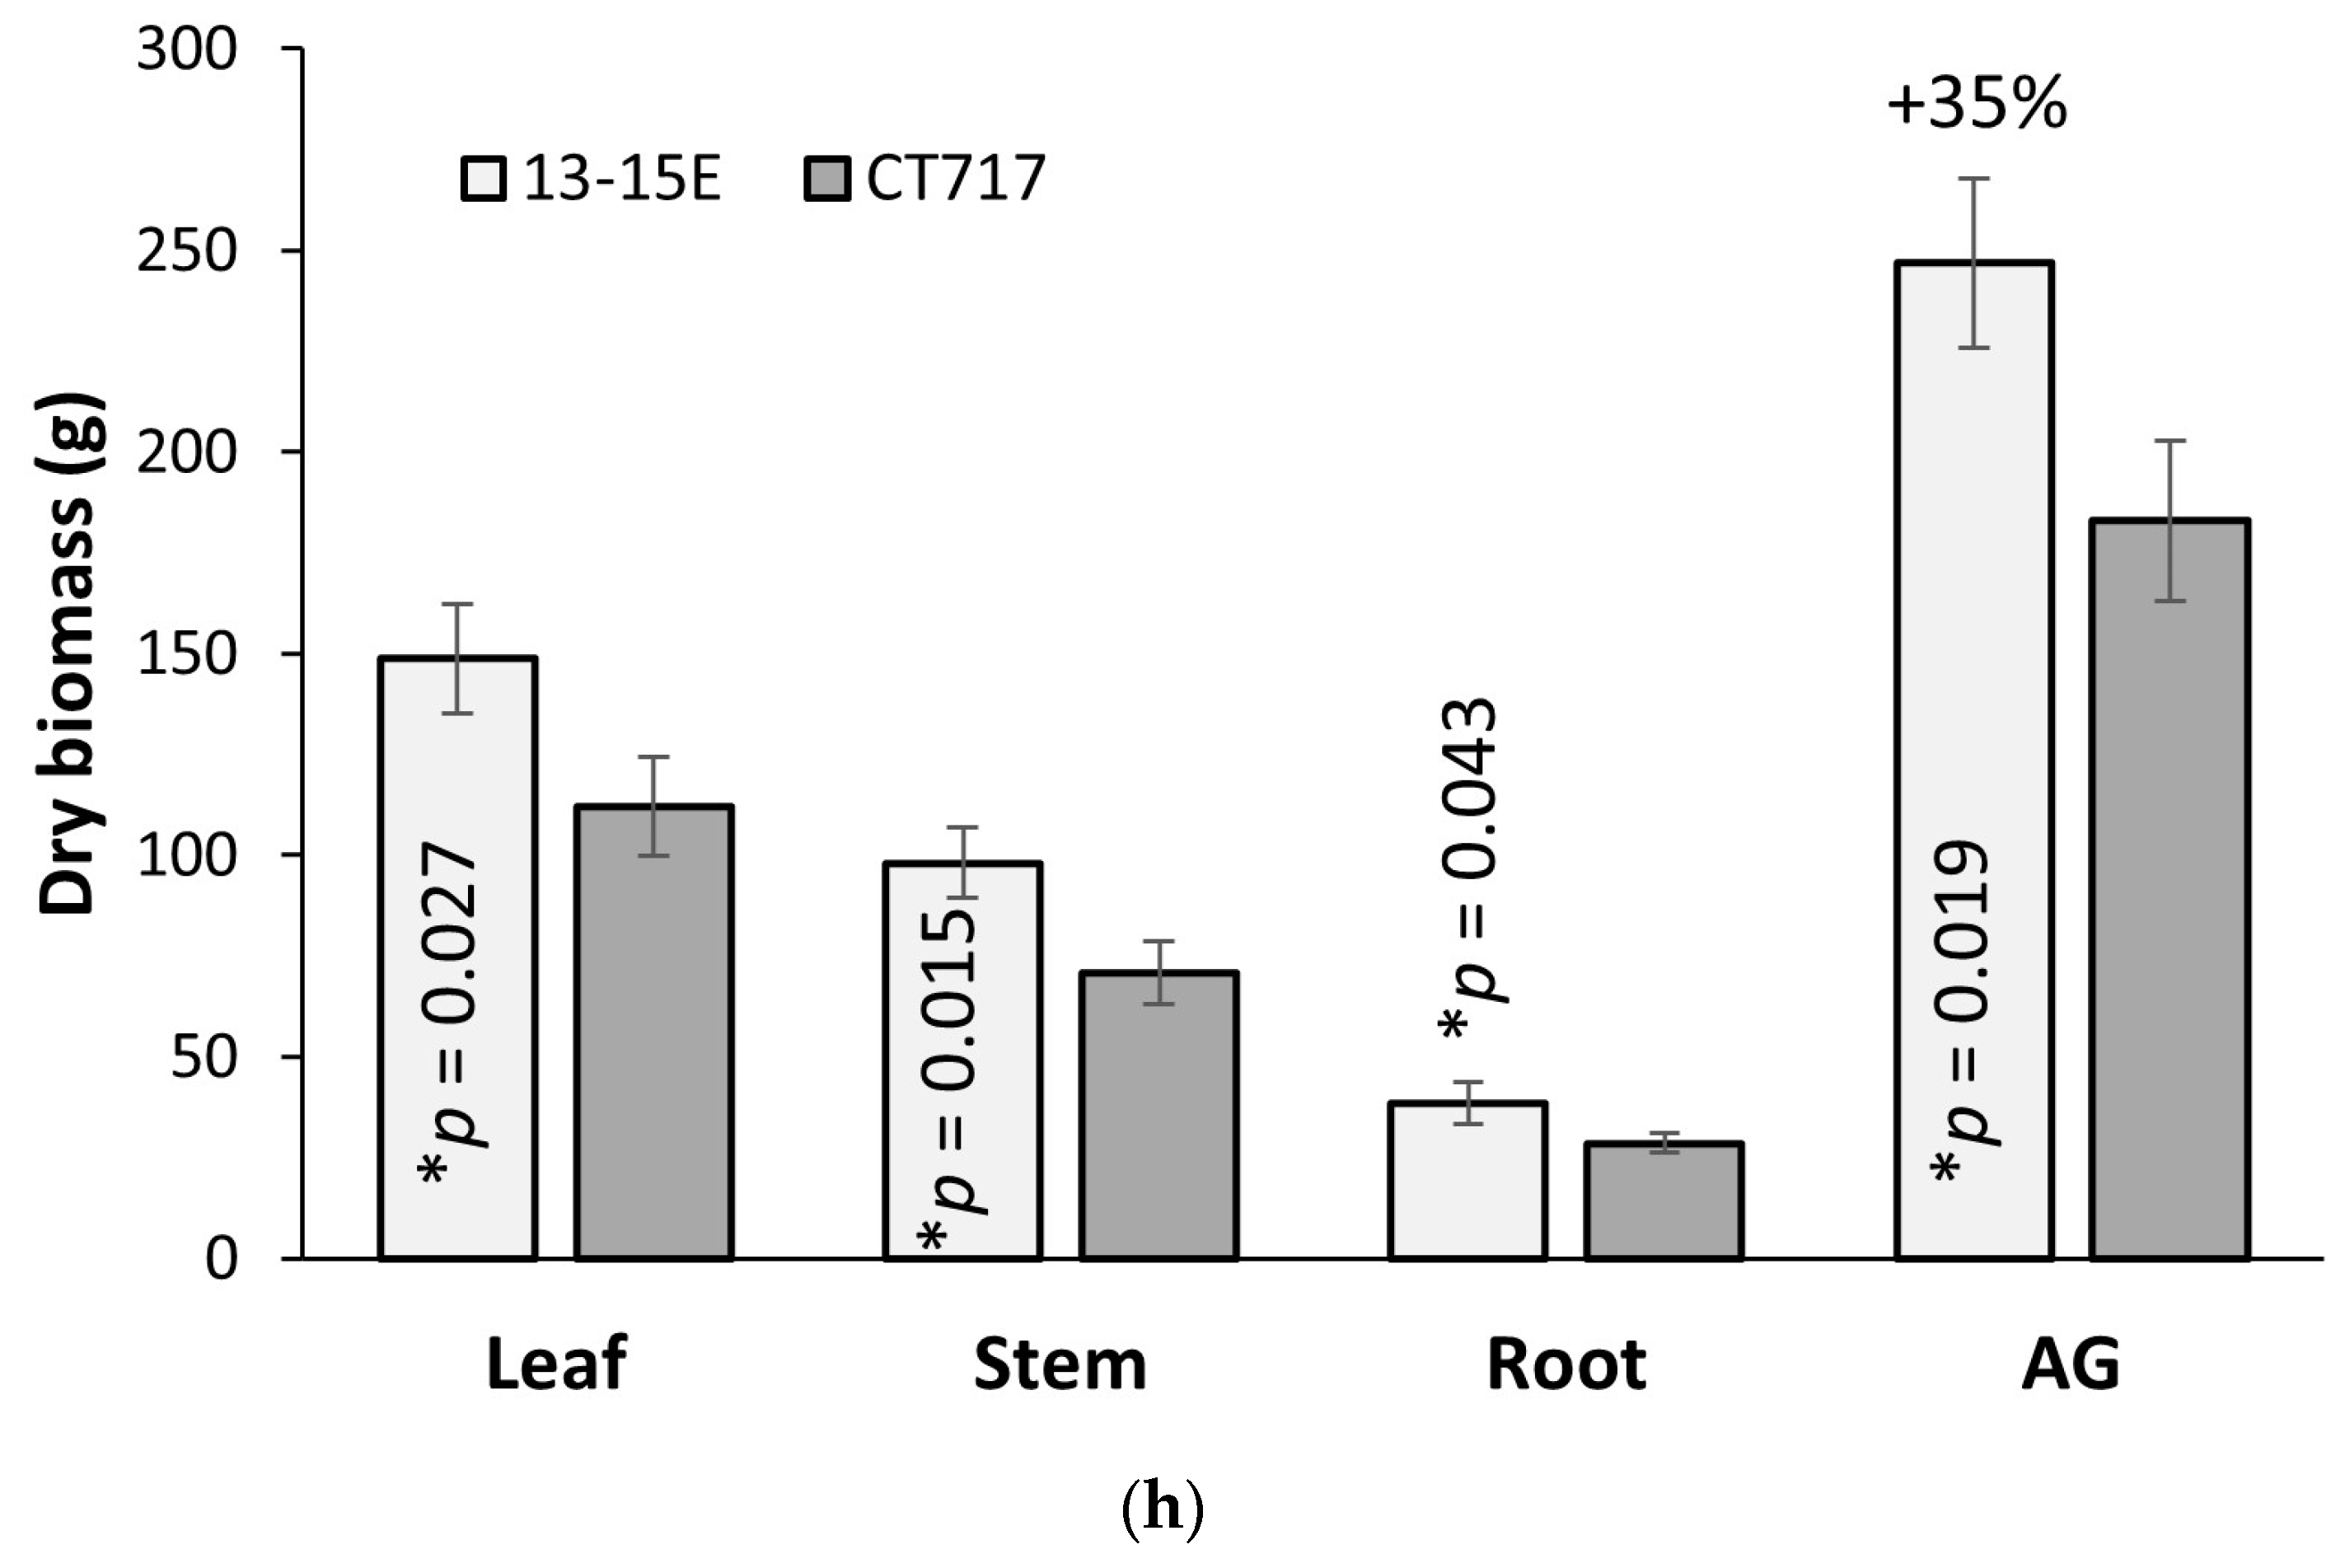
24]. The results of molecular analysis and photobiology measurements support our observation that this bypass increased biomass production in the poplars by 35%–53% compared to the control plants that do not have the functional bypass pathway (Figure 4 and Figure 5). To our knowledge, this is the first time that photosynthetic efficiency has been enhanced in a tree species by such a magnitude.
We reasoned that for this photorespiration bypass to work in poplars, a reduction in the expression level of the glycolate transporter is critical. As stated before, INRA 717-1B4 is a hybrid clone of P. alba × P. tremula. Comparison of the coding sequences of PLGG1 between P. alba and P. tremula revealed 10 allelic differences with a 6 bp gap and 9 SNPs. Our RNAi design avoided sequences containing the 6 bp gap. The various levels of 
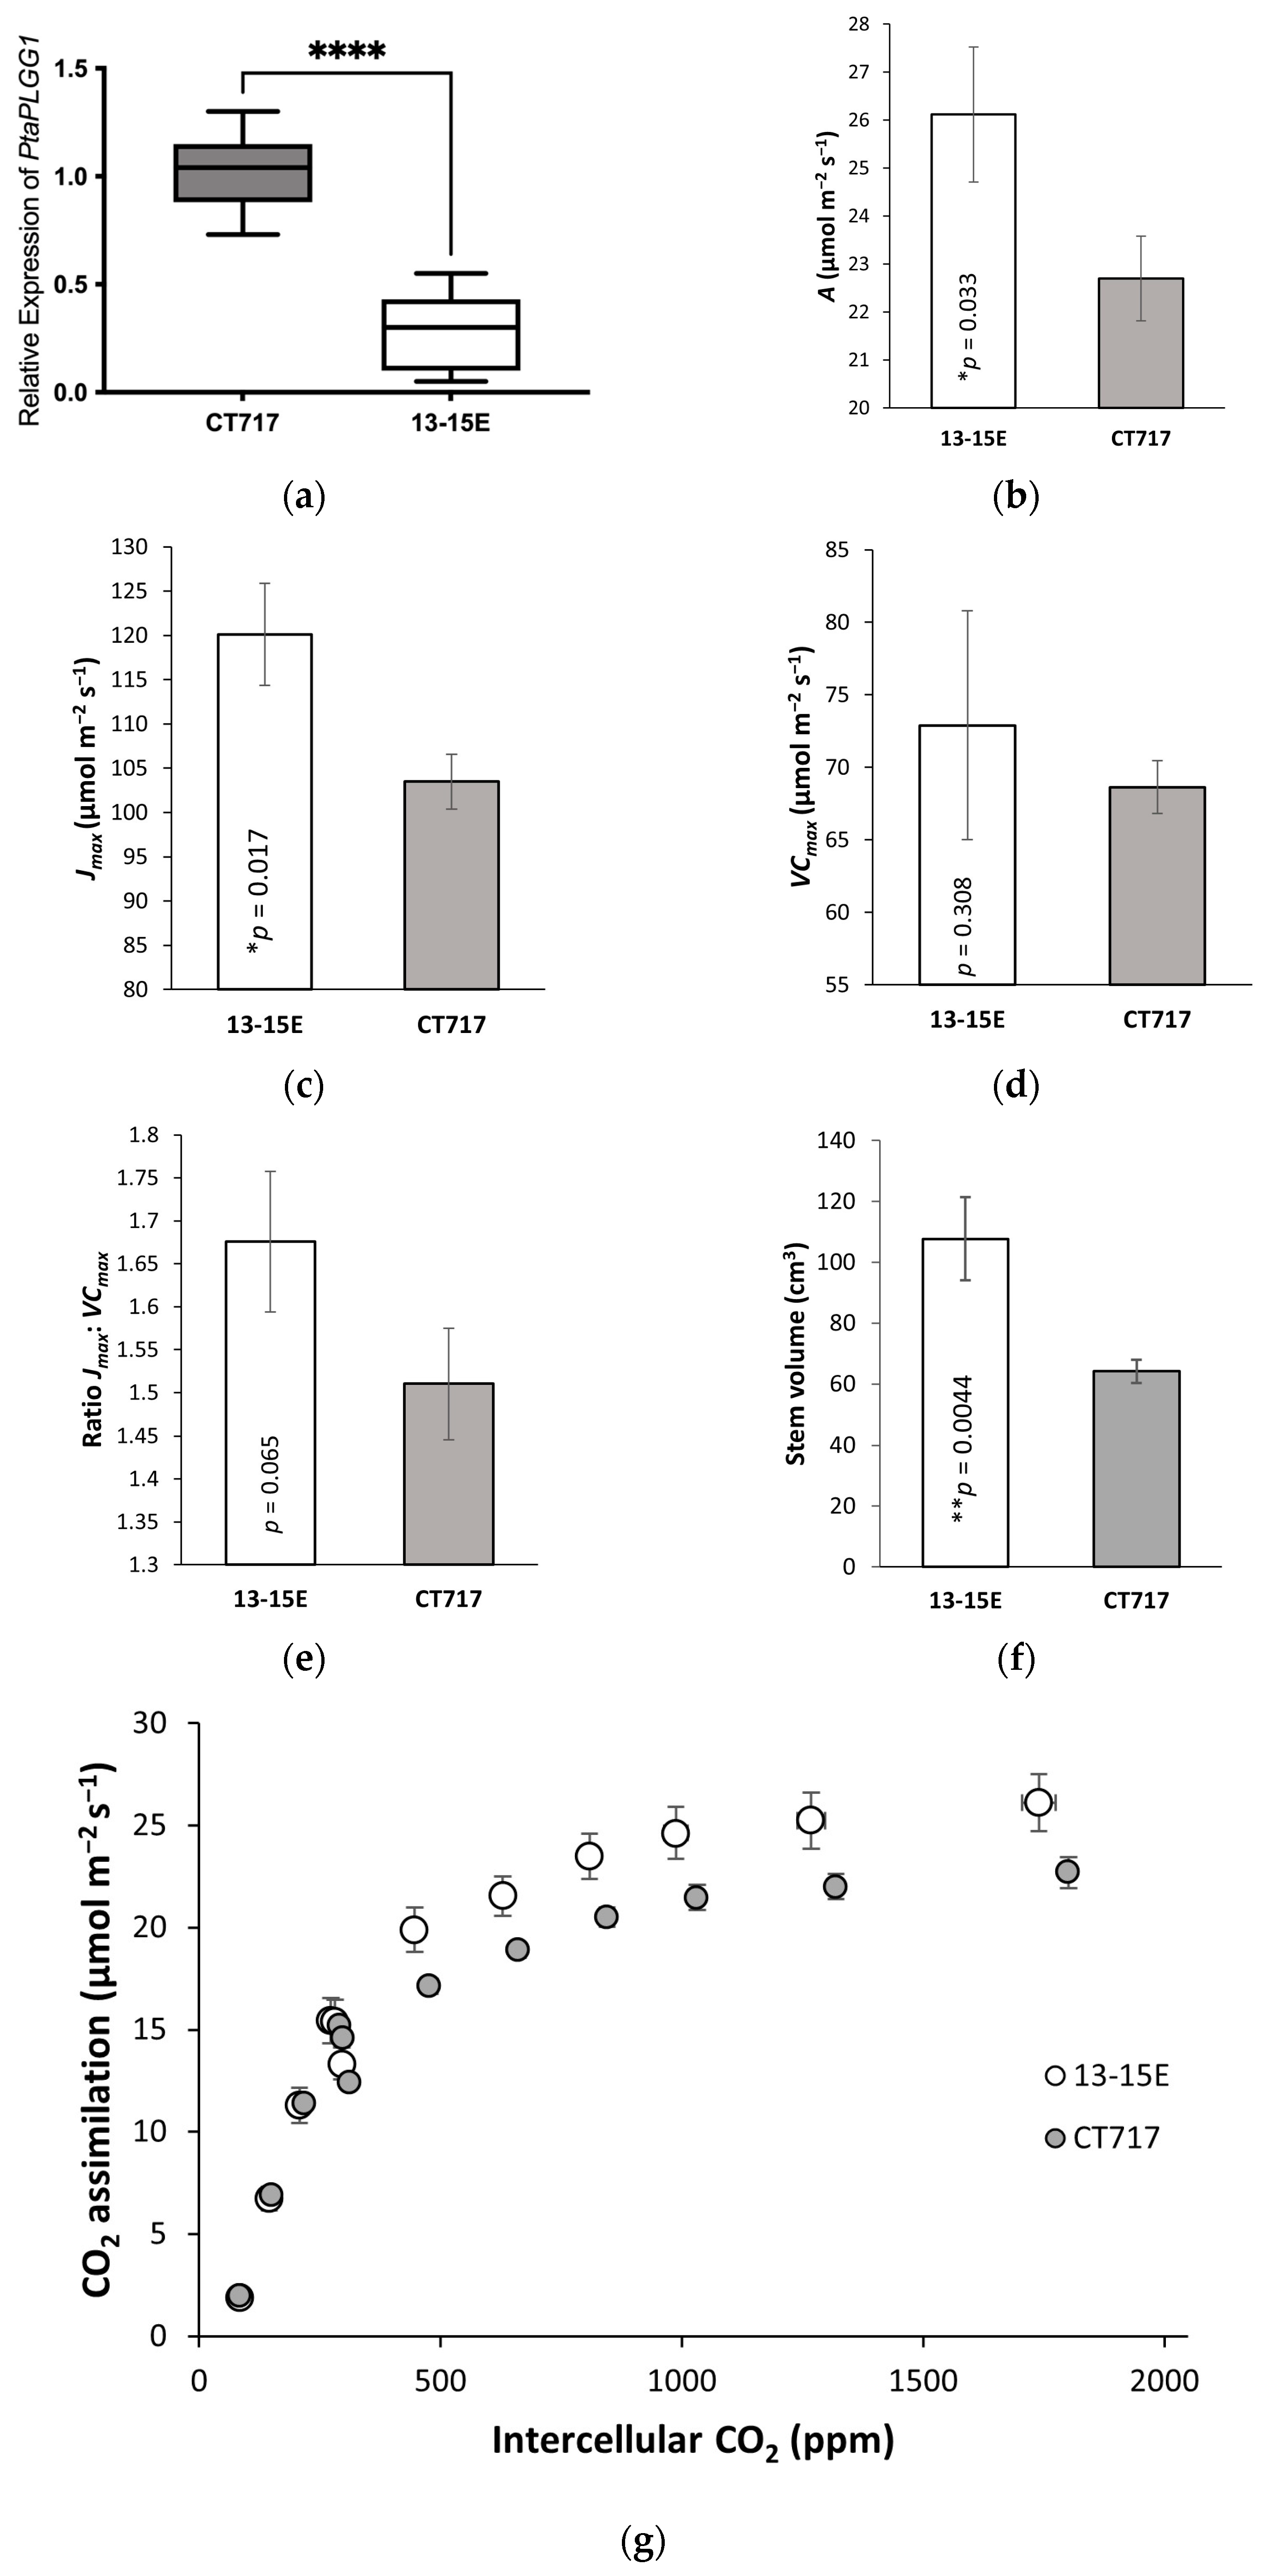
PtaPLGG1 reduction in our transgenic events (Figure 3a) validated the RNAi design principle. The wide range in reduction of the PtaPLGG1 expression in transgenic events would also allow for the selection of events with the appropriate amount of glycolate transportation inhibition. However, plant gene expression is well known to vary with growth and developmental stages as well as physiological changes due to (a)biotic environmental changes. Our qRT-PCR analysis was established and optimized through consideration of various factors including the choice of reference genes, the age of plants when samples were collected, and growth conditions, especially light intensity, etc. This analysis protocol enabled minimization of plant-to-plant variation.
In addition to the range of 
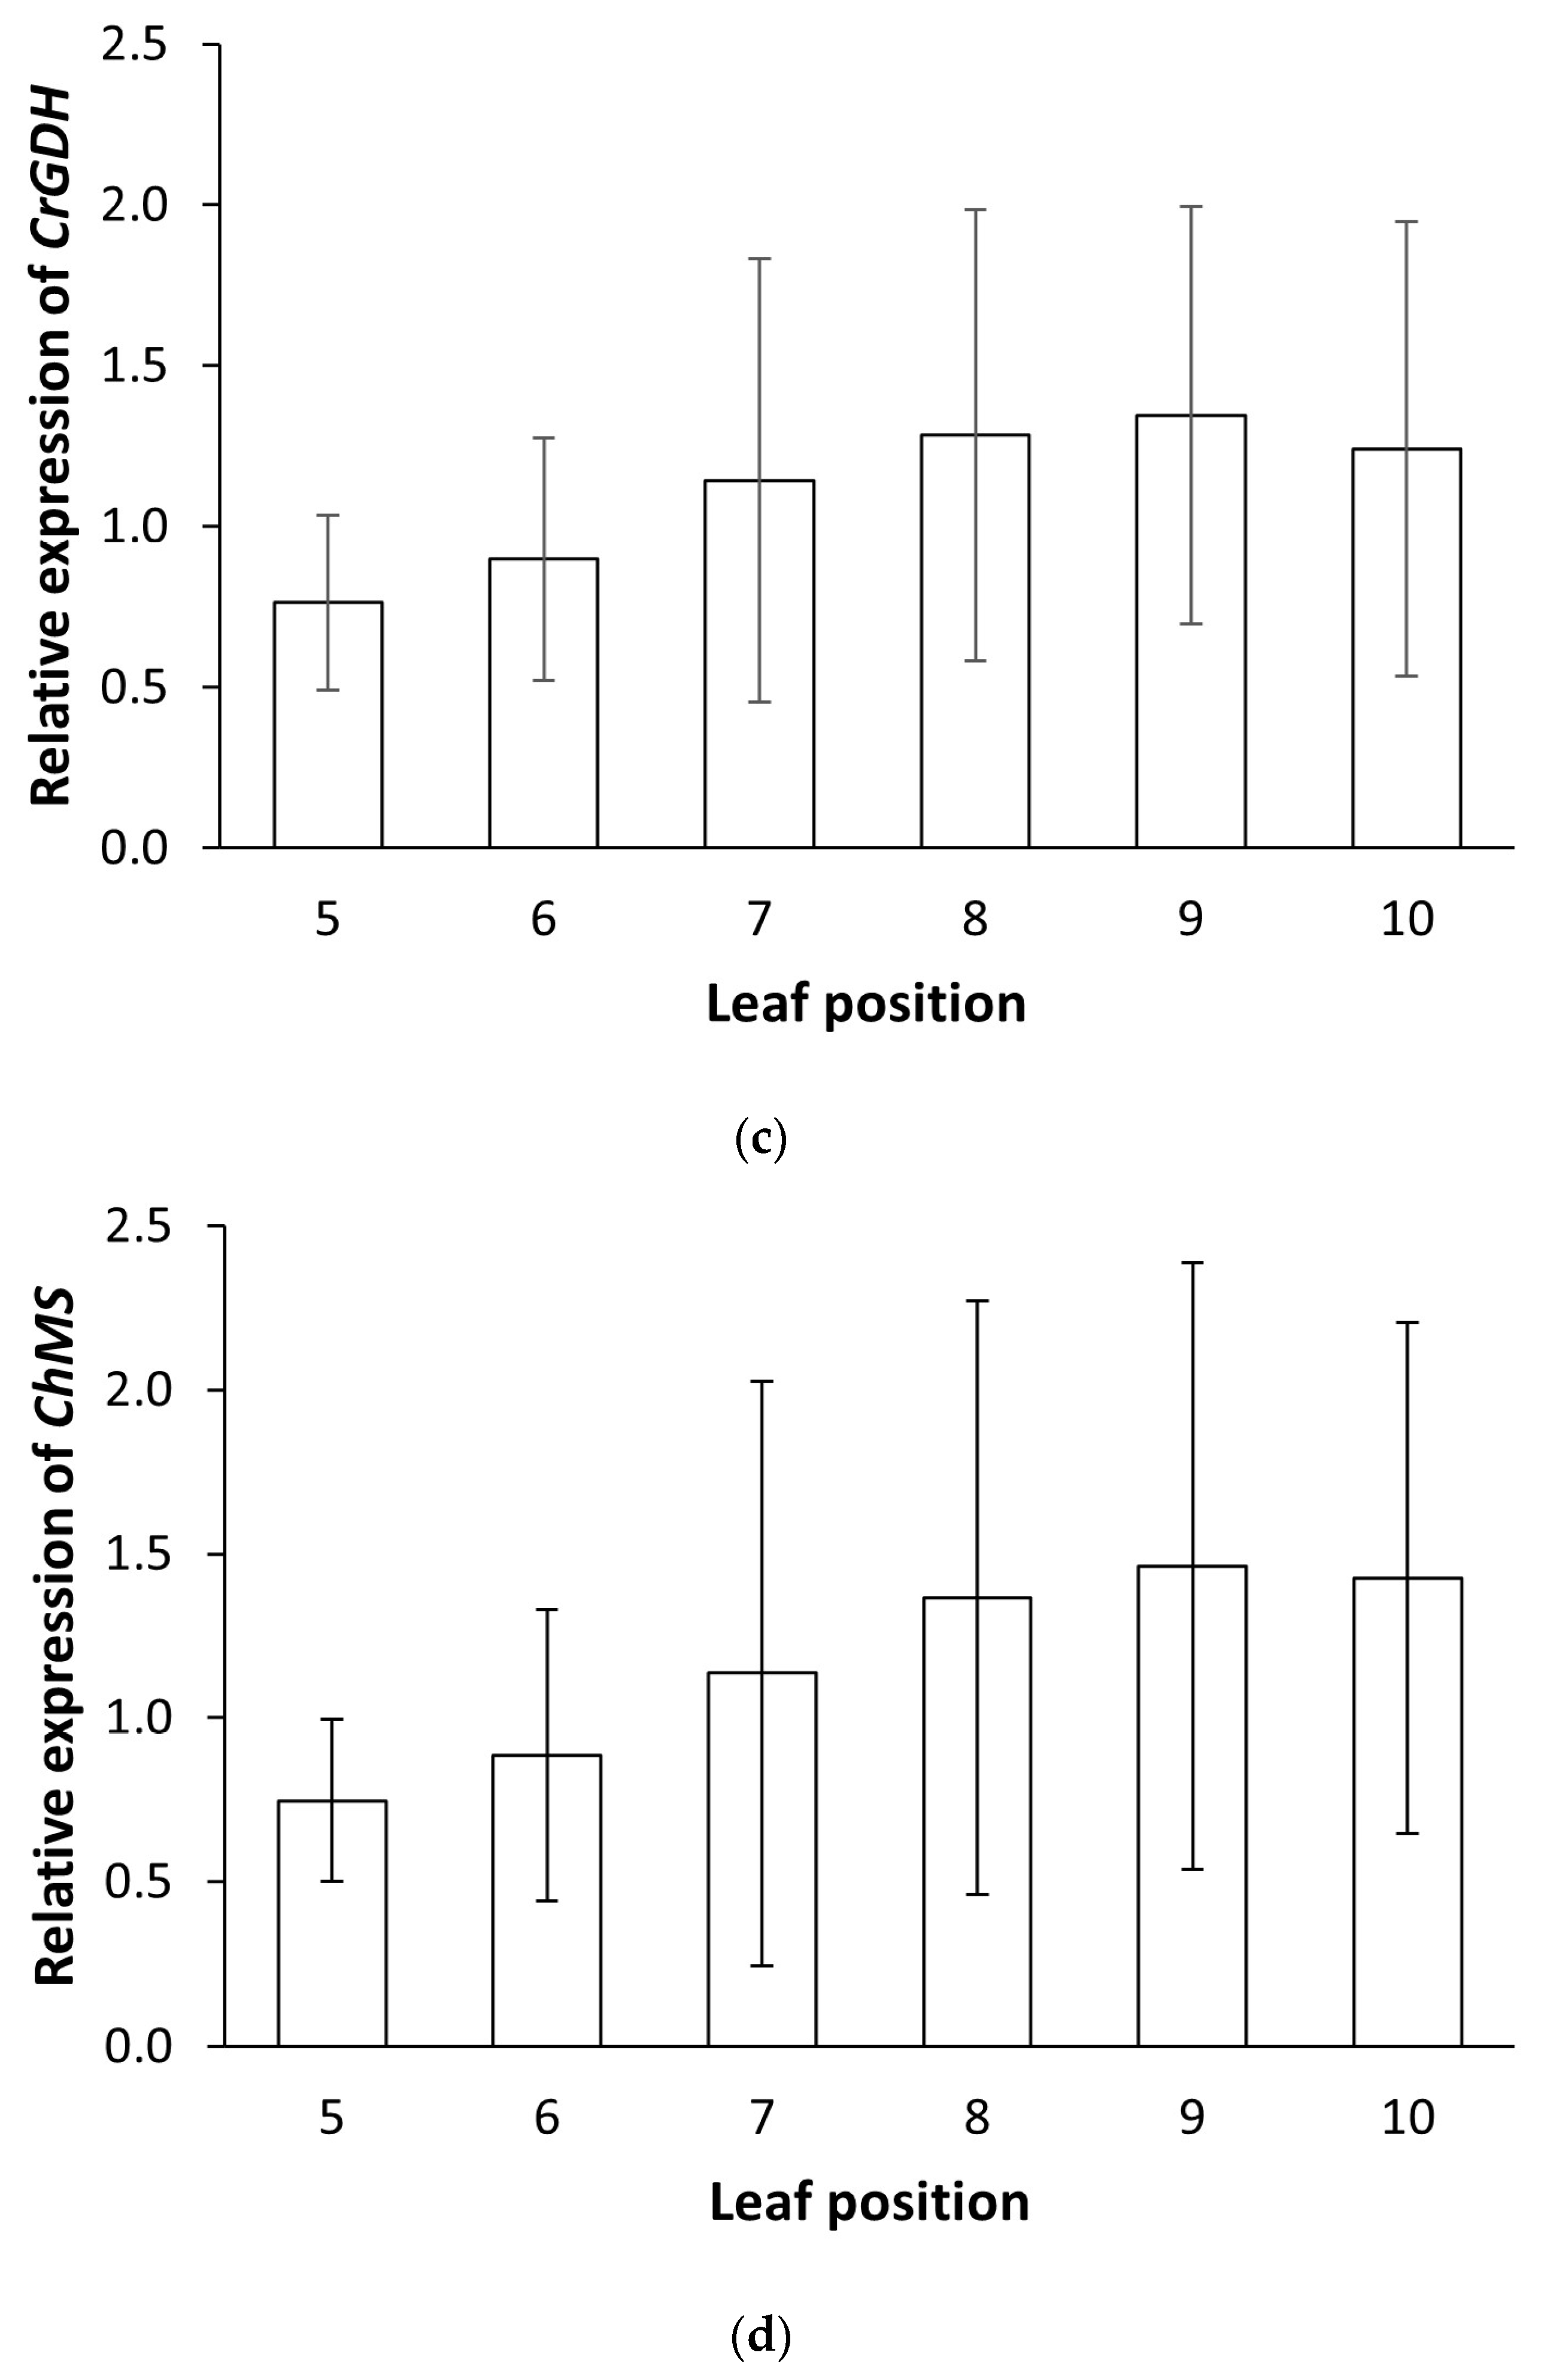
PtaPLGG1 expression reduction, it is desirable to have a range of expression levels for the two transgenic metabolic enzymes. This allows selection of a balanced perturbation of the metabolic flow that would enable an optimized output from the shunt pathway for increased photosynthetic activity. We observed a range of CrGDH and ChMS expression levels in the 41 T0 events (Table S3). Fine-tuned metabolic perturbation was also achieved at the level of post-transcriptional control, such as feedback inhibition and modulation. It would be interesting to quantitatively analyze the levels of related proteins in transgenic plants. Furthermore, enzymatic activities, governed by enzyme kinetic characteristics, provide another degree of fine-tuning regulation on metabolic output. Enzyme engineering through computational design using software such as Rosetta to discern the relationship of protein structure and function has been widely applied in the field of synthetic biology [37,38]. With the ever-increasing data on structure-function relationship and the knowledge derived from machine learning on enzyme activities, the future of protein design for biotech applications can only improve. Enzyme engineering through directed evolution (DE) to accumulate beneficial amino acid sequence changes, thereby improving enzymatic activity, has proven to be practical and fruitful in synthetic biology applications [6,39,40,41]. Examples of using DE to improve photosynthetic efficiency have been reported, albeit not as successful [6]. Challenges are not with the technology itself, but rather with how to properly design and screen the enzyme variants that would exert the activity change in a living plant. Therefore, enzyme engineering provides the potential for improving the efficiency of the shunt pathway in the future. Additionally, changes in the perturbation of endogenous metabolic flow can be monitored via metabolite profiling experiments or metabolomics analysis. It remains unclear what changes in the metabolite profile of Events 13-15E and7F contribute to the increased biomass production. We will incorporate metabolite analysis in future trials of these transgenic events to further investigate the mechanism behind the increase in biomass.
When vegetatively propagated plants experience changes in environmental and growth conditions, ranging from mechanical damage, to lack of nutrients during rooting, to transplanting shock, they need a period of time post potting for acclimation and to stabilize, a term used in the field to describe when genetics start to have the dominant effect on the growth characteristics of plants. The growth performance of C1 plants showed a wide range of variation during the first few weeks of growth after transplanting in the growth room. Our results, based on Vcmax measurement of photosynthesis activity in poplar plants after transplanting, helped to evaluate stabilization at the physiological level (Figure S1). Additional research is needed to better understand the process of stabilization and to narrow down the time frame that the poplar needs to fully acclimate to soil growth.
The impact of engineered photorespiration bypass on the activity of photosynthesis can be measured with conventional gas-exchange methodologies. Changes in Jmax and the ratio of Jmax:Vcmax reflect changes in photosynthetic activity. For a given plant species, Vcmax fluctuates with the physiological state of the plant and may also change under the influences of growth and environmental conditions, such as (a)biotic stresses, including transplanting acclimation (Figure S1). However, for plants of the same species grown under the same growth conditions, Vcmax fluctuations should not significantly differ from each other. We reason that we should not expect changes in the values of Vcmax between transgenic plants and non-transgenic controls because the photorespiration bypass design has not altered RuBisCO carboxylation activity.
The increase in biomass production in these engineered poplar trees may not fully reflect the efficiency enhancement in photosynthesis. As the amount of photosynthetic carbohydrates increases in the source tissue, transportation and deposition of these energy-rich carbon molecules to the sink tissue become limiting factors. As such, it would be valuable to assess carbon partitioning and source-sink dynamics in these transgenic trees in the future. Alternative photorespiration bypass pathways have been tested in other C3 plant species. In some cases, the pathway did not work as intended [42]. In other cases, the pathway seemed to work properly and resulted in enhanced photosynthetic rate, increased biomass and grain yield, however, the seed setting was reduced [25,26]. Through an integrated analysis of transcriptomics, physiology, and biochemistry, Wang et al. concluded that photosynthetic carbohydrates in these plants were not transported to grains in an efficient manner [26]. In woody plants such as poplar, this source-sink carbon partitioning issue may become limiting when photosynthesis is enhanced. Other issues such as C-N balance may add to the complexity as well. Nonetheless, woody plants may offer a simpler system than cereal crops due to complexities in regulating the transition from vegetative growth to reproductive growth for grain production.
While the current study was conducted in controlled growth room settings and produced encouraging results, it is also important to test the photosynthetically enhanced transgenic events in a field setting where trees will be subjected to more (a)biotic stress and higher light intensity. As such, a multi-year field trial of many of our transgenic events is currently underway. It will be interesting to see how the field trial results align with that from growth room studies.

5. Conclusions

The application of synthetic biology techniques in woody plant species for photosynthesis enhancement with the goal of greatly enhancing trees’ ability to draw down atmospheric CO2 has not been reported prior to this work. Here, from two separate growth experiments we demonstrated the successful introduction of a photorespiration bypass pathway into a tree species, resulting in increased biomass for the first time. A lead transgenic event with successful expression of the bypass pathway genes showed increased photosynthetic efficiency, leading to 35%–53% more above-ground dry biomass accumulation over four months of growth in a controlled environment, equivalent to 17%–27% more CO2 fixation from the air. To our knowledge, this is the first time such engineering has been attempted in a tree species for the purpose of carbon drawdown. Our results provided a proof of concept for photosynthesis enhancement in trees and opened the door for engineering trees to help combat climate change. Biological systems are powerful when it comes to carbon drawdown and storage, but at the same time, are complex. Needless to say, it is a challenging goal to engineer trees to make a meaningful impact on climate change. Utilization of the growing knowledge base to test potential biotechnology strategies in trees is a good start.

Supplementary Materials

The following supporting information can be downloaded at: https://www.mdpi.com/article/10.3390/f14040827/s1, Table S1. Primer and probe sequences for PCR, qPCR, and qRT-PCR. Table S2. Growth rate and copy number estimation of transgenes in transgenic events and controls. Table S3. Relative expression level of transgenes in various transgenic events. Figure S1. Photosynthesis activity in the form of Vcmax in poplar plants after transplanting to soil pots. Figure S2. Determination of photosynthetic parameters Jmax (a), Vcmax (b), Jmax:Vcmax ratio (c), and Amax (d) in 18-week-old C1 experimental plants Figure S3. Comparison of plant growth between transgenic events and non-transgenic control nine weeks post transplanting. Figure S4. Weekly stem volume growth curves of lead transgenic Events 13-15E and 7F plotted against non-transgenic control CT717 from Week 9 to 17. Figure S5. Fresh weight (g) of harvested 21-week-old C1 experimental plants. Figure S6. GDH and MS expression in 13-15E and CT717-3. Figure S7. Photosynthetic activity measurement from plants of another C2 repeat experiment. Figure S8. Stem growth rate comparison on C2 experimental plants.

Author Contributions

Y.T. and L.-W.C. wrote the original draft. R.A.D. and Y.T. reviewed and revised the manuscript. J.W.H. made the construct. D.G.-V. and M.L.O.-C. produced the transgenic events. A.C. and M.J.H. propagated and maintained events in tissue culture conditions. L.-W.C., K.R. and Y.T. performed molecular analyses. R.A.D. performed physiology studies. Y.T., C.R., P.M. and J.D. performed growth evaluations and event selections. C.R., P.M., J.K. and D.T. performed vegetative propagation and biomass analysis. Y.T., L.-W.C., R.A.D., C.R., K.R., J.W.H. and G.A.O. performed data analysis. Y.T. designed and supervised the experimentation. M.E.H., P.M., J.W.H. and Y.T. conceptualized the project. All authors have read and agreed to the published version of the manuscript.

Funding

This research received no external funding.

Data Availability Statement

Data is contained within the article or Supplementary Materials.

Acknowledgments

We thank Steven H. Strauss, Oregon State University, for the generous gift of hybrid Populus tremula × Populus alba, clone INRA 717-1B4.

Conflicts of Interest

The authors declare no conflict of interest.

References

  1. Johnson, M.P. Photosynthesis. Essays Biochem. 2016, 60, 255–273. [Google Scholar] [CrossRef]
  2. Ainsworth, E.A. Rice Production in a Changing Climate: A Meta-Analysis of Responses to Elevated Carbon Dioxide and Elevated Ozone Concentration. Glob. Chang. Biol. 2008, 14, 1642–1650. [Google Scholar] [CrossRef]
  3. Dhingra, A.; Portis, A.R.; Daniell, H. Enhanced Translation of a Chloroplast-Expressed RbcS Gene Restores Small Subunit Levels and Photosynthesis in Nuclear RbcS Antisense Plants. Proc. Natl. Acad. Sci. USA 2004, 101, 6315–6320. [Google Scholar] [CrossRef]
  4. Spreitzer, R.J.; Peddi, S.R.; Satagopan, S. Phylogenetic Engineering at an Interface between Large and Small Subunits Imparts Land-Plant Kinetic Properties to Algal Rubisco. Proc. Natl. Acad. Sci. USA 2005, 102, 17225–17230. [Google Scholar] [CrossRef]
  5. Whitney, S.M.; Sharwood, R.E. Linked Rubisco Subunits Can Assemble into Functional Oligomers without Impeding Catalytic Performance. J. Biol. Chem. 2007, 282, 3809–3818. [Google Scholar] [CrossRef]
  6. Mueller-Cajar, O.; Whitney, S.M. Directing the Evolution of Rubisco and Rubisco Activase: First Impressions of a New Tool for Photosynthesis Research. Photosynth. Res. 2008, 98, 667–675. [Google Scholar] [CrossRef] [PubMed]
  7. Whitney, S.M.; Sharwood, R.E.; Orr, D.; White, S.J.; Alonso, H.; Galmés, J. Isoleucine 309 Acts as a C4 Catalytic Switch That Increases Ribulose-1,5-Bisphosphate Carboxylase/Oxygenase (Rubisco) Carboxylation Rate in Flaveria. Proc. Natl. Acad. Sci. USA 2011, 108, 14688–14693. [Google Scholar] [CrossRef] [PubMed]
  8. Wilson, R.H.; Alonso, H.; Whitney, S.M. Evolving Methanococcoides burtonii Archaeal Rubisco for Improved Photosynthesis and Plant Growth. Sci. Rep. 2016, 6, 22284. [Google Scholar] [CrossRef]
  9. Savir, Y.; Noor, E.; Milo, R.; Tlusty, T. Cross-Species Analysis Traces Adaptation of Rubisco toward Optimality in a Low-Dimensional Landscape. Proc. Natl. Acad. Sci. USA 2010, 107, 3475–3480. [Google Scholar] [CrossRef]
  10. Galmés, J.; Kapralov, M.V.; Andralojc, P.J.; Conesa, M.À.; Keys, A.J.; Parry, M.A.J.; Flexas, J. Expanding Knowledge of the Rubisco Kinetics Variability in Plant Species: Environmental and Evolutionary Trends. Plant Cell Environ. 2014, 37, 1989–2001. [Google Scholar] [CrossRef]
  11. Young, J.N.; Heureux, A.M.C.; Sharwood, R.E.; Rickaby, R.E.M.; Morel, F.M.M.; Whitney, S.M. Large Variation in the Rubisco Kinetics of Diatoms Reveals Diversity among Their Carbon-Concentrating Mechanisms. J. Exp. Bot. 2016, 67, 3445–3456. [Google Scholar] [CrossRef]
  12. Cummins, P.L.; Kannappan, B.; Gready, J.E. Directions for Optimization of Photosynthetic Carbon Fixation: RuBisCO’s Efficiency May Not Be so Constrained after All. Front. Plant Sci. 2018, 9, 183. [Google Scholar] [CrossRef]
  13. Long, B.M.; Hee, W.Y.; Sharwood, R.E.; Rae, B.D.; Kaines, S.; Lim, Y.-L.; Nguyen, N.D.; Massey, B.; Bala, S.; von Caemmerer, S.; et al. Carboxysome Encapsulation of the CO2-Fixing Enzyme Rubisco in Tobacco Chloroplasts. Nat. Commun. 2018, 9, 3570. [Google Scholar] [CrossRef] [PubMed]
  14. Zhu, X.-G.; de Sturler, E.; Long, S.P. Optimizing the Distribution of Resources between Enzymes of Carbon Metabolism Can Dramatically Increase Photosynthetic Rate: A Numerical Simulation Using an Evolutionary Algorithm. Plant Physiol. 2007, 145, 513–526. [Google Scholar] [CrossRef]
  15. Rosenthal, D.M.; Locke, A.M.; Khozaei, M.; Raines, C.A.; Long, S.P.; Ort, D.R. Over-Expressing the C3 Photosynthesis Cycle Enzyme Sedoheptulose-1-7 Bisphosphatase Improves Photosynthetic Carbon Gain and Yield under Fully Open Air CO2 Fumigation (FACE). BMC Plant Biol. 2011, 11, 123. [Google Scholar] [CrossRef]
  16. Uematsu, K.; Suzuki, N.; Iwamae, T.; Inui, M.; Yukawa, H. Increased Fructose 1,6-Bisphosphate Aldolase in Plastids Enhances Growth and Photosynthesis of Tobacco Plants. J. Exp. Bot. 2012, 63, 3001–3009. [Google Scholar] [CrossRef]
  17. Miyagawa, Y.; Tamoi, M.; Shigeoka, S. Overexpression of a Cyanobacterial Fructose-1,6-/Sedoheptulose-1,7-Bisphosphatase in Tobacco Enhances Photosynthesis and Growth. Nat. Biotechnol. 2001, 19, 965–969. [Google Scholar] [CrossRef]
  18. Lefebvre, S.; Lawson, T.; Fryer, M.; Zakhleniuk, O.V.; Lloyd, J.C.; Raines, C.A. Increased Sedoheptulose-1,7-Bisphosphatase Activity in Transgenic Tobacco Plants Stimulates Photosynthesis and Growth from an Early Stage in Development. Plant Physiol. 2005, 138, 451–460. [Google Scholar] [CrossRef] [PubMed]
  19. Simkin, A.J.; McAusland, L.; Headland, L.R.; Lawson, T.; Raines, C.A. Multigene Manipulation of Photosynthetic Carbon Assimilation Increases CO2 Fixation and Biomass Yield in Tobacco. J. Exp. Bot. 2015, 66, 4075–4090. [Google Scholar] [CrossRef] [PubMed]
  20. Kebeish, R.; Niessen, M.; Thiruveedhi, K.; Bari, R.; Hirsch, H.-J.; Rosenkranz, R.; Stäbler, N.; Schönfeld, B.; Kreuzaler, F.; Peterhänsel, C. Chloroplastic Photorespiratory Bypass Increases Photosynthesis and Biomass Production in Arabidopsis thaliana. Nat. Biotechnol. 2007, 25, 593–599. [Google Scholar] [CrossRef]
  21. Carvalho, J.d.F.; Madgwick, P.J.; Powers, S.J.; Keys, A.J.; Lea, P.J.; Parry, M.A. An Engineered Pathway for Glyoxylate Metabolism in Tobacco Plants Aimed to Avoid the Release of Ammonia in Photorespiration. BMC Biotechnol. 2011, 11, 111. [Google Scholar] [CrossRef] [PubMed]
  22. Maier, A.; Fahnenstich, H.; von Caemmerer, S.; Engqvist, M.K.M.; Weber, A.P.M.; Flügge, U.-I.; Maurino, V.G. Transgenic Introduction of a Glycolate Oxidative Cycle into A. thaliana Chloroplasts Leads to Growth Improvement. Front. Plant Sci. 2012, 3, 38. [Google Scholar] [CrossRef] [PubMed]
  23. Nölke, G.; Houdelet, M.; Kreuzaler, F.; Peterhänsel, C.; Schillberg, S. The Expression of a Recombinant Glycolate Dehydrogenase Polyprotein in Potato (Solanum tuberosum) Plastids Strongly Enhances Photosynthesis and Tuber Yield. Plant Biotechnol. J. 2014, 12, 734–742. [Google Scholar] [CrossRef] [PubMed]
  24. South, P.F.; Cavanagh, A.P.; Liu, H.W.; Ort, D.R. Synthetic Glycolate Metabolism Pathways Stimulate Crop Growth and Productivity in the Field. Science 2019, 363, eaat9077. [Google Scholar] [CrossRef]
  25. Shen, B.-R.; Wang, L.-M.; Lin, X.-L.; Yao, Z.; Xu, H.-W.; Zhu, C.-H.; Teng, H.-Y.; Cui, L.-L.; Liu, E.-E.; Zhang, J.-J.; et al. Engineering a New Chloroplastic Photorespiratory Bypass to Increase Photosynthetic Efficiency and Productivity in Rice. Mol. Plant 2019, 12, 199–214. [Google Scholar] [CrossRef]
  26. Wang, L.-M.; Shen, B.-R.; Li, B.-D.; Zhang, C.-L.; Lin, M.; Tong, P.-P.; Cui, L.-L.; Zhang, Z.-S.; Peng, X.-X. A Synthetic Photorespiratory Shortcut Enhances Photosynthesis to Boost Biomass and Grain Yield in Rice. Mol. Plant 2020, 13, 1802–1815. [Google Scholar] [CrossRef]
  27. Zhang, C.; Zhong, X.; Lin, D.; Wu, K.; Wu, Z.; Zhang, Z.; Peng, X. Grain Quality Affected by Introducing Photorespiratory Bypasses into Rice. Agronomy 2022, 12, 566. [Google Scholar] [CrossRef]
  28. Cavanagh, A.P.; South, P.F.; Bernacchi, C.J.; Ort, D.R. Alternative Pathway to Photorespiration Protects Growth and Productivity at Elevated Temperatures in a Model Crop. Plant Biotechnol. J. 2022, 20, 711–721. [Google Scholar] [CrossRef]
  29. Wesley, S.V.; Helliwell, C.A.; Smith, N.A.; Wang, M.; Rouse, D.T.; Liu, Q.; Gooding, P.S.; Singh, S.P.; Abbott, D.; Stoutjesdijk, P.A.; et al. Construct Design for Efficient, Effective and High-Throughput Gene Silencing in Plants. Plant J. 2001, 27, 581–590. [Google Scholar] [CrossRef]
  30. Brunner, A.M.; Yakovlev, I.A.; Strauss, S.H. Validating Internal Controls for Quantitative Plant Gene Expression Studies. BMC Plant Biol. 2004, 4, 14. [Google Scholar] [CrossRef]
  31. Basa, B.; Solti, Á.; Sárvári, É.; Tamás, L. Housekeeping Gene Selection in Poplar Plants under Cd-Stress: Comparative Study for Real-Time PCR Normalisation. Funct. Plant Biol. 2009, 36, 1079–1087. [Google Scholar] [CrossRef]
  32. Xu, M.; Zhang, B.; Su, X.; Zhang, S.; Huang, M. Reference Gene Selection for Quantitative Real-Time Polymerase Chain Reaction in Populus. Anal. Biochem. 2011, 408, 337–339. [Google Scholar] [CrossRef] [PubMed]
  33. Pettengill, E.A.; Parmentier-Line, C.; Coleman, G.D. Evaluation of QPCR Reference Genes in Two Genotypes of Populus for Use in Photoperiod and Low-Temperature Studies. BMC Res. Notes 2012, 5, 366. [Google Scholar] [CrossRef] [PubMed]
  34. Wang, H.-L.; Li, L.; Tang, S.; Yuan, C.; Tian, Q.; Su, Y.; Li, H.-G.; Zhao, L.; Yin, W.; Zhao, R.; et al. Evaluation of Appropriate Reference Genes for Reverse Transcription-Quantitative PCR Studies in Different Tissues of a Desert Poplar via Comparision of Different Algorithms. Int. J. Mol. Sci. 2015, 16, 20468–20491. [Google Scholar] [CrossRef]
  35. Tang, F.; Chu, L.; Shu, W.; He, X.; Wang, L.; Lu, M. Selection and Validation of Reference Genes for Quantitative Expression Analysis of MiRNAs and MRNAs in Poplar. Plant Methods 2019, 15, 35. [Google Scholar] [CrossRef]
  36. Duursma, R.A. Plantecophys–An R Package for Analysing and Modelling Leaf Gas Exchange Data. PLoS ONE 2015, 10, e0143346. [Google Scholar] [CrossRef]
  37. Pan, X.; Kortemme, T. Recent Advances in de Novo Protein Design: Principles, Methods, and Applications. J. Biol. Chem. 2021, 296, 100558. [Google Scholar] [CrossRef]
  38. Arnold, F.H. Innovation by Evolution: Bringing New Chemistry to Life (Nobel Lecture). Angew. Chem. Int. Ed. 2019, 58, 14420–14426. [Google Scholar] [CrossRef]
  39. Siehl, D.L.; Tao, Y.; Albert, H.; Dong, Y.; Heckert, M.; Madrigal, A.; Lincoln-Cabatu, B.; Lu, J.; Fenwick, T.; Bermudez, E.; et al. Broad 4-Hydroxyphenylpyruvate Dioxygenase Inhibitor Herbicide Tolerance in Soybean with an Optimized Enzyme and Expression Cassette. Plant Physiol. 2014, 166, 1162–1176. [Google Scholar] [CrossRef]
  40. Piatkevich, K.D.; Jung, E.E.; Straub, C.; Linghu, C.; Park, D.; Suk, H.-J.; Hochbaum, D.R.; Goodwin, D.; Pnevmatikakis, E.; Pak, N.; et al. A Robotic Multidimensional Directed Evolution Approach Applied to Fluorescent Voltage Reporters. Nat. Chem. Biol. 2018, 14, 352–360. [Google Scholar] [CrossRef]
  41. Sachsenhauser, V.; Bardwell, J.C. Directed Evolution to Improve Protein Folding In Vivo. Curr. Opin. Struct. Biol. 2018, 48, 117–123. [Google Scholar] [CrossRef] [PubMed]
  42. Leman, J.K.; Weitzner, B.D.; Lewis, S.M.; Adolf-Bryfogle, J.; Alam, N.; Alford, R.F.; Aprahamian, M.; Baker, D.; Barlow, K.A.; Barth, P.; et al. Macromolecular Modeling and Design in Rosetta: Recent Methods and Frameworks. Nat. Methods 2020, 17, 665–680. [Google Scholar] [CrossRef]
Figure 1. Diagram of construct LC0102 design. Genetic elements within the T-DNA borders are shown. At the bottom is the sequence of the sense element of the 256 bp siRNA1 design targeting the region of PtaPLGG1 transcript from nucleotide position 886 to 1142. An intron of the Flaveria trinervia Pyruvate Orthophosphate Dikinase (PDK) was utilized to separate the sense element and the antisense element of siRNA1. Expression of the siRNAi is under the control of the Arabidopsis thaliana RbcS2b promoter and the 3′ terminator of the Arabidopsis Act2 gene.
Forests 14 00827 g001
Figure 2. Gene expression variation in leaves of various developmental stages. Tissue samples were collected from leaves at each position of three ramets and processed separately. (a) Absolute Cq value of PtaPLGG1 (circle) and PtaAct (rhombus) from leaves of various positions on non-transgenic plant CT717 at Week 17. Two technical replicas were employed for the assay. For each reaction, 100 ng of total RNA was used. (b) The normalized relative expression level of PtaPLGG1 in various leaf positions of transgenic Event 13-15E and non-transgenic CT717, with the average expression levels of all leaves set as 1.0. (c,d) Normalized relative expression level of transgenes CrGDH (c) and ChMS (d) in transgenic Event 13-15E. The average expression levels of all leaves was set as 1.0. Reference gene used in this multiplex assay: PtaEF1B-1.
Forests 14 00827 g002aForests 14 00827 g002b
Figure 3. Transgene expression analysis in selected C1 transgenic events. (a) Expression analysis of PtaPLGG1 in transgenic plants in the C1 experiment. Tissue samples were collected from Leaf 3 with three ramets per event except for two for Event 13-15E at Week 14. Reference gene used in this multiplex assay: PtaAct. (b,c) Expression analysis of CrGDH (b) and ChMS (c) in transgenic plants in the C1 experiment. Tissue samples were collected from Leaf 3 at Week 14. Statistical significance: p ≤ 0.05 (*), p ≤ 0.01 (**).
Forests 14 00827 g003
Figure 4. Photosynthetic activity and plant growth analysis in selected transgenic events. (a) A-Ci curve was generated from C1 experimental plants, 18 weeks old. Number of ramets: CT717 non-transgenic control, 5; Event 13-15E, 2; Event 7F, 3. Error bars indicate SEM. (b) C1 experimental plant height difference between transgenic plants and CT717 before harvesting for biomass measurement at Week 21. Left: 13-15E, 2 ramets; Right: 7F, 3 ramets; Middle: CT717, 5 ramets. (c) Average stem volume of C1 experimental plants at Week 17. (d) Dry biomass of harvested C1 experimental plants, including leaf, stem, root, and above-ground (AG) leaf + stem. Number of ramets: CT717 control plants, 5; Event 13-15E, 2 (one of the three initial ramets died earlier in the experiment); Event 7F, 3. All p-values were calculated using t-test and represent the difference compared to the non-transgenic CT717 control plants. * and ** represents a significant difference at p < 0.05 and p < 0.01, respectively when compared to non-transgenic CT717.
Forests 14 00827 g004aForests 14 00827 g004b
Figure 5. Transgene expression, photosynthetic activity, and plant growth analysis of C2 repeat experiment with the lead event. A repeat experiment was carried out with the lead event, 13-15E and non-transgenic control CT717-3. (a) PLGG1 expression in 13-15E and CT717-3. Tissue samples were collected from Leaf 8 with five ramets per event at Week 8. (be) Photosynthetic parameters determined from A-Ci curves performed on five ramets each of 13-15E and CT717-3: (b) Amax (CO2 assimilation rate at saturating light and CO2 concentration). (c) Jmax (maximum rate of photosynthetic electron transport). (d) Vcmax (maximum rate of carboxylation). (e) Jmax:Vcmax ratio. (g) A-Ci curve of 13-15E and CT717-3, five ramets each, error bars represent SEM. (f) Stem volume in 13-15E and CT717-3 at Week 14. (h) Biomass measurement of harvested C2 experimental plants in dry weight. Number of ramets: five per event. *, ** and **** represents a significant difference at p < 0.05, p < 0.01, and p < 0.0001 respectively when compared to non-transgenic CT717.
Forests 14 00827 g005aForests 14 00827 g005b
Disclaimer/Publisher’s Note: The statements, opinions and data contained in all publications are solely those of the individual author(s) and contributor(s) and not of MDPI and/or the editor(s). MDPI and/or the editor(s) disclaim responsibility for any injury to people or property resulting from any ideas, methods, instructions or products referred to in the content.

