Article

Changes in Forest Vegetation Carbon Storage and Its Driving Forces in Subtropical Red Soil Hilly Region over the Past 34 Years: A Case Study of Taihe County, China

1
Qianyanzhou Ecological Research Station, Key Laboratory of Ecosystem Network Observation and Modeling, Institute of Geographic Sciences and Natural Resources Research, Chinese Academy of Sciences, Beijing 100101, China
2
College of Resources and Environment, University of Chinese Academy of Sciences, Beijing 100049, China
*
Author to whom correspondence should be addressed.
These authors contributed equally to this work.
Forests 2023, 14(3), 602; https://doi.org/10.3390/f14030602
Submission received: 30 January 2023 / Revised: 2 March 2023 / Accepted: 15 March 2023 / Published: 17 March 2023
(This article belongs to the Section Forest Ecology and Management)

Abstract

:
After decades of afforestation, China’s forest coverage has increased significantly, but the forest quality and its impact on ecosystem services are still controversial. Taking forest vegetation carbon storage as an example, most assessment results based on the national forest inventory data showed that the contribution of enlarged forest area to the increase in China’s forest vegetation carbon storage was higher than that of the change in forest quality (vegetation carbon density). This means that the increase in forest carbon storage in China was mostly contributed by the increase in forest area and was less due to the increased forest vegetation carbon density. However, the national forest inventory data are based on national permanent plots that may be protected or are less disturbed to some extent. Therefore, the contribution of the change in forest quality to the increase in forest vegetation carbon storage, as evaluated from the national forest inventory data, might be overestimated, especially in regions with frequent human activities. To test the hypothesis, we selected Taihe County, a typical representative of the red soil hilly region in subtropical China, where the population is dense, economic development is fast, and the forest has experienced destruction and re-establishment. To accurately assess the impact of changes in the forest area and forest quality on forest vegetation carbon storage variation in real situations, we collected and used a series of remote sensing images from 1986 to 2019, inventory data for forest management, and field data. The results showed that the forest area and forest vegetation carbon density increased from 10.85 × 10⁴ ha and 17.89 Mg/ha in 1986 to 16.40 × 10⁴ ha and 26.51 Mg/ha in 2019, with an increase of 51.11% and 48.23%, respectively. Meanwhile, the forest vegetation carbon storage increased by 123.99%, from 1.94 Tg in 1986 to 4.35 Tg in 2019, suggesting a significant carbon sequestration ability. Further analysis showed that the contributions of changes in forest area and forest quality to the forest vegetation carbon storage variation were 1.23 Tg (51.19%) and 1.17 Tg (48.81%), respectively. The result implies that the increase in forest area and forest quality almost contributed equally to the increase in forest vegetation carbon storage during the 34 years of vegetation restoration in Taihe County. However, forest vegetation carbon density controlled the variation of forest vegetation carbon storage in all three forest developing stages. The precision of our results was also tested with two inventory datasets for forest management in Taihe County in 2009 and 2019. The relative contribution of forest vegetation carbon density is lower than most of the previous study results using national forest inventory data in this region, indicating that the contribution of change in the forest vegetation carbon density to the forest vegetation carbon storage variation might be overestimated based on these national permanent plots, which were protected or less disturbed to some extent.

1. Introduction

As a prominent part of terrestrial ecosystems, forests cover about 31% of the Earth’s land surface and play important roles in regulating the global carbon balance and mitigating climate change [1,2,3]. Forest vegetation is an important carbon pool of forest ecosystems, accounting for about 80%–90% of terrestrial biomass carbon [4,5,6]. Therefore, an accurate assessment of the forest vegetation carbon pool and its dynamics is crucial for ecosystem research [7,8,9].
According to the national forest inventory data in 2019, China holds a forest area of 220 million hectares, accounting for 5.51% of the global forest area and ranking fifth in the world [10]. However, the excessive exploitation of forests since the 1950s has led to severe soil erosion, desertification, and land degradation [11]. By the end of the 1970s, forest vegetation carbon storage in China had decreased by 0.68 Pg C, with a decrease ratio of 13.44% [9]. Since the 1980s, China launched national forest restoration projects across the country to counteract the ecological and environmental problems, and the forest coverage increased from 12% in the 1970s to 22.96% in 2019. The ecosystem services have been improved comprehensively, and the vegetation carbon storage of forest has increased from 3.60~4.72 Pg C to 7.91~7.8 Pg C with an increasing rate of 69.07%~91.53% [1,8,12,13,14]. However, the quality of forests in China is still low, and the vegetation carbon density and stand volume are even lower than the global average level [15,16]. Some studies even suspect that the national forest restoration projects only increased the forest area but not the forest quality [16].
How did the changes in forest area and forest quality contribute to the forest vegetation carbon storage variation in China? Most studies have shown that forest area expansion dominated the increase in forest vegetation carbon storage in China [17,18,19]. Using the national forest inventory data, Fang et al. [18] quantified the contribution of forest quality change in terms of the vegetation carbon density to China’s forest vegetation carbon sequestration and showed that the areal expansion of forests was a larger contributor to the increase in the forest vegetation carbon storage than the increased forest vegetation carbon density during 1973–2008 (60% vs. 40%). Similarly, a recent study indicated that the relative contributions of changes in the forest area and forest vegetation carbon density to China’s forest vegetation carbon storage changes from 1977 to 2018 were 66.73% and 33.27%, respectively [20]. These results demonstrated that forest area expansion had greater effects on the increase in forest vegetation carbon storage than forest quality improvement. In contrast, Li et al. [21] showed that the relative contributions of changes in the forest area and forest vegetation carbon density to China’s forest vegetation carbon storage variation during 1977–2008 were roughly equal (50.4% vs. 49.6%). The same method was adopted in these studies but it yielded different results, which implies that the different duration for those studies may greatly affect the relative contributions of the forest area and forest vegetation carbon density changes [20,21].
We noted that the aforementioned studies mainly applied the national forest inventory data, which were obtained from the national permanent plots. Although forests in these plots were unprotected and can be managed in a normal way, they were probably protected or were less disturbed to some extent due to the conspicuous national marks [22]. Studies have shown that forest vegetation carbon density is closely related to human disturbance [9,23,24,25]. The forest vegetation carbon density and carbon sequestration abilities are higher in protected areas than in unprotected areas [26,27], so the contribution of forest vegetation carbon density might be overestimated in the previous studies [17,18,19,20,21].
The subtropical red soil hilly region not only is an important commercial forest base of China but also progresses notably in the economy. The forest in this region, suffering from the great impact of frequent human activity, has experienced significant changes in both forest coverage and quality, and is a typical representative of the ecological restoration in southern China. Considering the large differences in forest quality changes in protected and unprotected areas [26,27], we selected Taihe County in this region as the representative to analyze its dynamic changes in forest area, forest quality (vegetation carbon density), and vegetation carbon storage, as well as the contribution of changes in forest area and forest quality to that of forest vegetation carbon storage during 1986–2019. The aim of this study was to precisely assess the impact of the forest area and forest quality changes on forest vegetation carbon storage variation under real situations with the disturbance of human activities to precisely evaluate the contribution of national forest restoration projects to the vegetation carbon sequestration ability in China over the past 34 years, and provide mechanical guidance for forest sustainable management and multi-functional development.

2. Materials and Methods
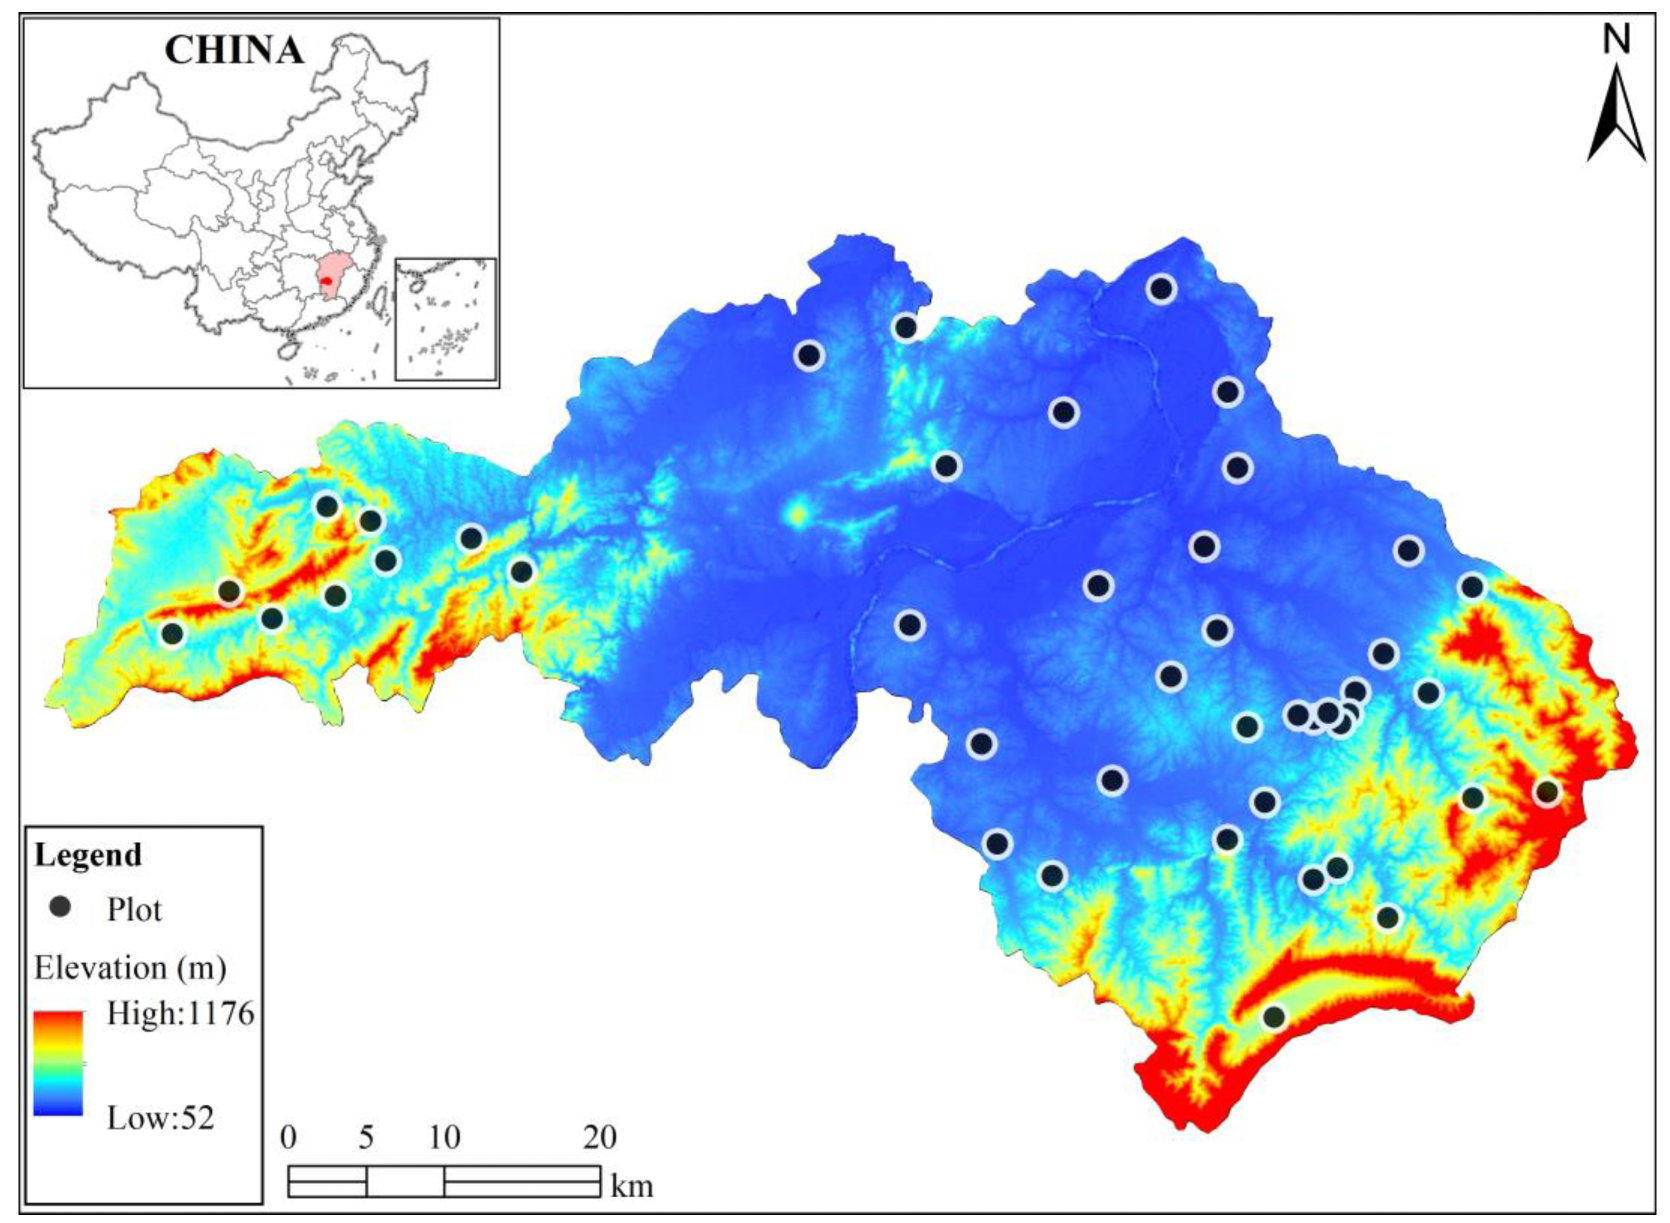
2.1. Study Area

The study was conducted in Taihe County (26.45°–26.98° N, 114.95°–115.33° E), Jiangxi Province, in southern China, located in the middle reaches of the Ganjiang River, the hinterland of the Jitai Basin, and between the Luoxiao Mountains and the Wuyi Mountains. The total area of Taihe County is 26.67 × 10⁴ ha with mountains, hills, and valleys accounting for 16%, 54%, and 30%, respectively. The altitude ranges from 52 to 1176 m, showing a typical topographical feature for the red soil hilly region in southern China (Figure 1). The region belongs to the humid subtropical monsoon climate zone, with plenty of hydrothermal resources that are unevenly distributed within a year. The average annual temperature is 18.6 °C, with an extreme maximum temperature of 41.5 °C and a minimum temperature of −6 °C. The average annual precipitation is 1457.9 mm, mostly occurring between April and June. The soils are predominantly red soil and purple soil. The forest coverage is 61.6% and the zonal vegetation is evergreen broadleaved forest. However, due to human destruction and unreasonable utilization, the zonal vegetation has almost been destroyed completely. The artificial plantations, accounting for 58.1%, are dominated by Masson pine (Pinus massoniana), Slash pine (Pinus elliottii), and Chinese fir (Cunninghamia lanceolata) species in this region. The understory shrubs mainly include Rhaphiolepis indica, Loropetalum chinense, and Vitex negundo var. cannabifolia, among others.

2.2. Data Collection

2.2.1. Field Data

Six dominant forest types were selected to establish temporary plots, and a total of 45 sample plots of 20 m × 20 m were established randomly. Plot location, topographic information (slope, aspect, slope position, and altitude), tree species, diameter at breast height, and tree height were recorded. In each plot, four subplots of 2 m × 2 m and 1 m × 1 m were established for shrub and herb investigation, respectively. The plant species, basal diameter, height, and coverage were recorded for each subplot. The fresh weights of herbs were obtained by harvesting and weighing them directly in the field. Subsamples were taken back to the laboratory and oven-dried to constant weight under a temperature of 65 °C. The water contents were calculated and used to convert the fresh weight to the dry weight. Figure 1 shows the spatial distribution of the sampling plots, and the stand characteristics of different forest types are shown in Table 1.

2.2.2. Inventory Data for Forest Management

Two inventory datasets for forest management of Taihe County for the years 2009 and 2019 with 15,707 and 30,353 sub-compartments, respectively, were applied in this study. The information on land use, dominant tree species, tree species composition, canopy closure, volume, and among others was included in these compartments. The dataset in 2019 was regarded as a background by calculating the total vegetation carbon storage and was used to randomly establish temporary plots. While the two datasets were jointly used to test the reliability of our remote sensing-based results with the unified data screening rules.

2.2.3. Remote Sensing Data

The remote sensing (RS) data used in this study are Landsat image data with a spatial resolution of 30 m downloaded from the United States Geological Survey (https://www.usgs.gov/, accessed on 1 July 2022). According to the spatial resolution of different Landsat series data, we chose Landsat 5 and Landsat 7 images [28]. To match the inventory data for forest management in 2019 and reduce the bias between RS sensors, Landsat data in 2019, 2009, 1999, and 1986 were selected. To ensure comparability and reduce the influence of bad meteorological conditions such as clouds and rains, RS images in November and December of Landsat 5 and Landsat 7 were selected in this study. The earliest cloudless RS images were two scenes of Landsat 5 TM in November 1986. To match the inventory datasets for forest management of 2009 and 2019, we selected two images of Landsat 5 TM in December 2009 and two images of Landsat 7 ETM+ in November 2019. We also selected two images of Landsat 5 TM in November 1999 to study the changes. A total of eight images were used in our study.

2.3. Data Analysis

2.3.1. Field Biomass Estimation

Biomass and timber volume models of different species [29,30,31,32] were used to calculate stand biomass (aboveground and belowground biomass) and volume based on the plot survey records. The linear relationship between stand biomass and volume was developed according to the following equation:
W = aV + b
where W is the stand biomass (Mg/ha), V is the stand volume (m3/ha), and a and b are model coefficients. The biomass–volume models of each forest type are shown in Table 2. The determination coefficient (R2) values for all forest types are higher than 0.75 and the root mean square error (RMSE) values are lower than 3, except for broadleaved forests and mixed forests, showing good fitting effects.
The aboveground biomass of shrubs was estimated using the biomass models based on the shrub basal diameter [33,34,35,36]. The belowground biomass was obtained according to the root-to-shoot ratio (0.85) for the shrub layer [37]. The total biomass of the shrub layer was the sum of the aboveground and belowground biomass. Similarly, the belowground biomass of the herb layer was estimated using a root-to-shoot ratio of 1.27 [37], and the total biomass of the herb layer was estimated as the same as that of the shrub layer. The average values of the shrub and herb layer were calculated for different forest types.

2.3.2. Carbon Storage Estimation of Sub-Compartment

The sub-compartment volume in the inventory data for forest management was converted to biomass using the relationships between stand biomass and volume (Table 2). According to the average biomass values of the shrub layer and herb layer for different forest types, the biomass of the shrub and herb layer in the sub-compartment was calculated. The sub-compartment biomass was obtained by adding the biomass of the arbor layer, shrub layer, and herb layer together. A constant ratio of 0.5 was used to convert biomass to vegetation carbon storage [4,9].

2.3.3. RS Data Preprocessing

The selected images were L1T products and the radiometric calibration, atmospheric correction, and geometric precision correction were conducted using ENVI 5.3 software. The processed images were clipped with the administrative boundary of Taihe County to form the target data of this study. We selected spectral bands (B1 to B6), vegetation indices (normalized vegetation index (NDVI), ratio vegetation index (RVI), and difference vegetation index (DVI)), and digital elevation model (DEM) as classification parameters. Vegetation indices were combinations of surface reflectance at two or more wavelengths designed to highlight a particular property of vegetation. NDVI reflected the background influence of plant canopy, such as soil, wet ground, snow, dead leaves, roughness, etc., and was related to vegetation cover [38]. RVI, which was highly related to dry leaf biomass, was a sensitive indicator parameter of green plants [39]. DVI reflected the changes in forest soil background sensitively [40]. DEM was also an important indicator for forest classification [41]. The samples selected based on the land use, dominant tree species, and tree species composition of the inventory data for forest management of 2019 were classified into four types, namely, coniferous forest, where single coniferous species’ or coniferous species’ total stand volume should be greater than or equal to 65%; broadleaved forest, where single broadleaved species’ or broadleaved species’ total stand volume should be greater than or equal to 65%; mixed forest, with total stand volume of coniferous or broadleaved species accounting for 35%–65%; and bamboo forest, with bamboo plants more than 2 cm in diameter at breast height. All the four types were based on the technical regulation for inventory data for forest management of Jiangxi Province. According to the proportion of different forest types in the sub-compartments, 1135 samples were selected for forest type classification, including 400 coniferous forests, 248 broadleaved forests, 245 mixed forests, and 242 bamboo forests. The ratio of the training set and testing set was approximately 4:1 in forest classification based on RS images. The training and testing samples were evenly distributed in the study area to satisfy the generalization of the sample space. Three widely used classification methods, including random forest classifier [42], decision tree [43], and BP neural network classifier [44], were used for RS image classification because of their good performances in previous studies [45,46,47]. The total accuracy and Kappa coefficient of the test set were used to compare the classification effects. The random forest classifier, which is a combination of tree predictors on various sub-samples of the dataset that uses averaging to improve the predictive accuracy and control over-fitting, performed well based on the statistical test (Table 3) and was thus selected for further image classification [48].

2.3.4. Linking RS Data to Forest Vegetation Carbon Storage

To calculate forest vegetation carbon storage, we tried to find the links between predictive factors and pixel-level forest vegetation carbon storage using the BP neural network. A total of 174 predictive factors belonging to six categories, including band images obtained from the RS images, principal components bands, which are uncorrelated bands derived from the band images [49], tasseled cap transformation bands, which are bands transformed from the band images to analyze the vegetation [50], vegetation indices, texture images, and terrain were obtained based on the RS data (Table 4). Of which, six were band information factors, three were bands produced by principal components transformation, three were bands produced by tasseled cap transformation, fifteen were vegetation indices obtained by band math, one hundred and forty-four were texture images extracted using gray-level co-occurrence matrix, which is a common method to define over an image to be the distribution of co-occurring grayscale values at a given offset [51], and three were terrain factors extracted based on DEM.
Since the area of a 7 × 7 pixel window size is 4.41 ha, sub-compartments with an area greater than 5 ha, stand volume greater than 0, and away from the street or water were selected for model development. The carbon storage of the central point of the sub-compartment was calculated based on the sub-compartment volume in the inventory data for forest management and matched with the corresponding selected RS features and terrain factors (Table 4). According to previous studies [52,53], we selected factors with Pearson (P) correlation coefficients less than 0.05 or 0.01 to establish the model. In this way, fourteen parameters with p values less than 0.05 were selected for the bamboo forest, forty-one parameters with p values less than 0.01 were selected for the coniferous forest, sixty-seven parameters with p values less than 0.01 were selected for the broadleaved forest, and thirty-nine parameters with p values less than 0.01 were selected for the mixed forest.
A total of 9006 sub-compartments across four forest types were selected to construct the carbon storage inversion model, namely, the relationship between the carbon storage and the RS features and terrain factors. We tried to test the best parameters of the BP neural network. Initially, the dataset for each forest type was subdivided such that 15% of the set was randomly put aside for model validation, another 15% was randomly put aside for model testing, and the remaining 70% of the set was used for model training (Table 5). Model training estimates the link between RS data and forest vegetation carbon storage; model validation determines the network structure or the parameters; and the model test checks the performance of the optimal model. The structure of the BP neural network usually included the input layer, the hidden layer, and the output layer [54]. For the design of the hidden layer, we tested and adjusted the number of layers of 1, 2, 3, and 4, respectively, and finally determined that the network with 50 nodes in a single layer had the best effect. Neural network training adopted the Levenberg–Marquardt algorithm, and the transfer function adopted the bitangent sigmoid transfer function. To prevent the network from overfitting, a regularization loss function with a regularization coefficient of 0.2 was used.
To analyze the accuracy of the vegetation carbon storage inversion models across different forest types, we compared observed and predicted carbon density values of the test set for different forest types. The observed values were calculated based on the sub-compartment volume in the inventory data for forest management. While the predicted carbon density values were obtained according to the link between RS data and forest vegetation carbon storage, namely the vegetation carbon storage inversion models. The results indicated that the predictive ability was desirable, with a slope close to 1:1 and R2 values larger than 0.7 (Figure 2).

2.3.5. Estimation of the Relative Contributions of Forest Area and Vegetation Carbon Density Changes to Vegetation Carbon Storage Variation

Using the forest identity concept [19,55], Fang et al. [18] proposed a method to separate the relative contributions of forest area and forest vegetation carbon density changes to forest vegetation carbon storage variation. According to this, the relationships among forest area (A), vegetation carbon density (D), and forest vegetation carbon storage (M) are shown in Equation (2).
M = A × D
Since   ln M = ln A + ln D , the relative change rates of A, D, and M over time (a, d, and m) follow the differential equation:
d ln M d t = d ln A d t + d ln D d t
Let the real change rate (a, d, and m) among two periods be approximately equal to the change rate of its natural logarithm:
a d ln A d t , d d ln D d t , m d ln M d t
m = a + d
Thus, the relative contributions of change in forest area (Ra, %) and change in vegetation carbon density (Rd, %) to the change in forest vegetation carbon storage can be expressed as follows [21]:
R a = a m × 100 % , R d = d m × 100 %

3. Results

3.1. Temporal and Spatial Changes in Forest Area

The forests in Taihe County in 1986 were mainly distributed in the eastern and western mountainous areas, and less in the central hilly area (Figure 3). At that time, the forest area was 10.85 × 10⁴ ha and the coverage was only 40.68% for Taihe County. With the progress of the national forest restoration projects, the forests developed rapidly in Taihe County. By 2019, the forest coverage reached 61.49%, with an increasing ratio of 51.11% compared to 1986. Taihe County has achieved remarkable effects in forest restoration, especially in the central hilly region. It can be generally divided into three stages, as shown in Figure 4. In the first stage (1986–1999), the forest area increased very quickly, by 4.49 × 10⁴ ha, with an average annual increase of 2.70%. The increase in the forest area was mainly distributed in the eastern and central hilly areas (Figure 3). By 1999, the forest coverage reached 57.54%. In the second stage (1999–2009), the forest area stagnated and showed a small decrease, with a net loss of 0.17 × 10⁴ ha. However, in the third stage (2009–2019), the forest area increased again in a steady manner by 1.23 × 10⁴ ha, with an average annual increase of only 0.78%. Therefore, the national forest restoration projects showed quite a great effect on the forest area increase in Taihe County, which was in line with national forest development [8,9].
Accordingly, the area of different forest types changed variously at different stages (Figure 4). Of which, the area of coniferous forest, which included Slash pine forests, Chinese fir forests, Masson pine forests, and so on, had consistent variation trends with that of the total forest area. In the first stage, the increase was particularly rapid, with a net increase of 3.63 × 10⁴ ha, equivalent to 80.96% of the increase in the total forest area during the same period. In the second stage, the coniferous forest area stagnated and showed a small decrease. In the third stage, the coniferous forest area increased steadily. Therefore, artificial coniferous forests contributed most to the increase in the forest area. Compared with coniferous forests, broadleaved forests remained stable at all stages with little changes; mixed forests increased slightly only in the first stage; and bamboo forests increased slightly only in the third stage, with no significant changes in other stages.

3.2. Changes in Forest Vegetation Carbon Density

With the expansion of the forest area, the vegetation carbon density of the forest also increased rapidly from 17.89 Mg/ha in 1986 to 26.51 Mg/ha in 2019, with an increment of 8.63 Mg/ha and an average annual growth rate of 1.20%. However, the forest vegetation carbon density did not increase linearly during the period. In the first stage (1986–1999), the forest vegetation carbon density increased significantly from 17.89 Mg/ha to 32.11 Mg/ha, with an increasing ratio of 79.55% compared to 1986. In the second stage (1999–2009), it dropped sharply to 23.12 Mg/ha, with a decreasing ratio of 28.01% compared to 1999. In the third stage (2009–2019), the forest vegetation carbon density increased steadily to 26.51 Mg/ha, with an increasing ratio of 14.68% compared to 2009 (Figure 5).
The changes in forest vegetation carbon density of different forest types varied in different stages (Figure 5). In the first stage, the vegetation carbon density of coniferous and broadleaved forests increased sharply by 35.07 Mg/ha and 23.17 Mg/ha, with an increasing ratio of 816.45% and 41.21% compared to 1986, respectively. In the second stage, they dropped obviously by 21.01 Mg/ha and 19.81 Mg/ha, with a decreasing ratio of 53.37% and 24.95% compared to 1999, respectively. In the third stage, they increased steadily by 1.35 Mg/ha and 9.36 Mg/ha, with an increasing ratio of 7.36% and 15.70% compared to 2009, respectively. The vegetation carbon density of bamboo forests was always low, increased only in the second stage, and showed no distinct changes in other stages. The vegetation carbon density of mixed forests increased in all stages but was the most rapid in the third stage.

3.3. Changes in Forest Vegetation Carbon Storage

With the expansion of the forest area and the increase in the forest vegetation carbon density, the forest vegetation carbon storage increased from 1.94 Tg in 1986 to 4.35 Tg in 2019 as shown in Figure 6, with an increase of 2.41 Tg and an average annual increase of 2.47%. However, the forest vegetation carbon storage also varied greatly during the period, which was consistent with the trend of forest vegetation carbon density. In the first stage (1986–1999), the forest vegetation carbon storage increased sharply from 1.94 Tg to the maximum value of 4.93 Tg, with an average annual increase of 7.43%. In the second stage (1999–2009), it decreased to 3.51 Tg, with an average annual decrease of 2.58%. In the third stage (2009–2019), it gradually increased to 4.35 Tg with an average annual increase of 1.66%, but it was still lower than the maximum value.
The vegetation carbon storage of different forest types varied differently in different stages. The vegetation carbon storage of coniferous and broadleaved forests showed a similar trend to that of the whole forest vegetation. They, respectively, increased by 2.18 Tg and 0.58 Tg in the first stage, decreased obviously by 1.21 Tg and 0.51 Tg in the second stage, and increased again by 0.23 Tg and 0.17 Tg in the third stage, respectively. On the other hand, the vegetation carbon storage of mixed and bamboo forests increased slowly through the study period.

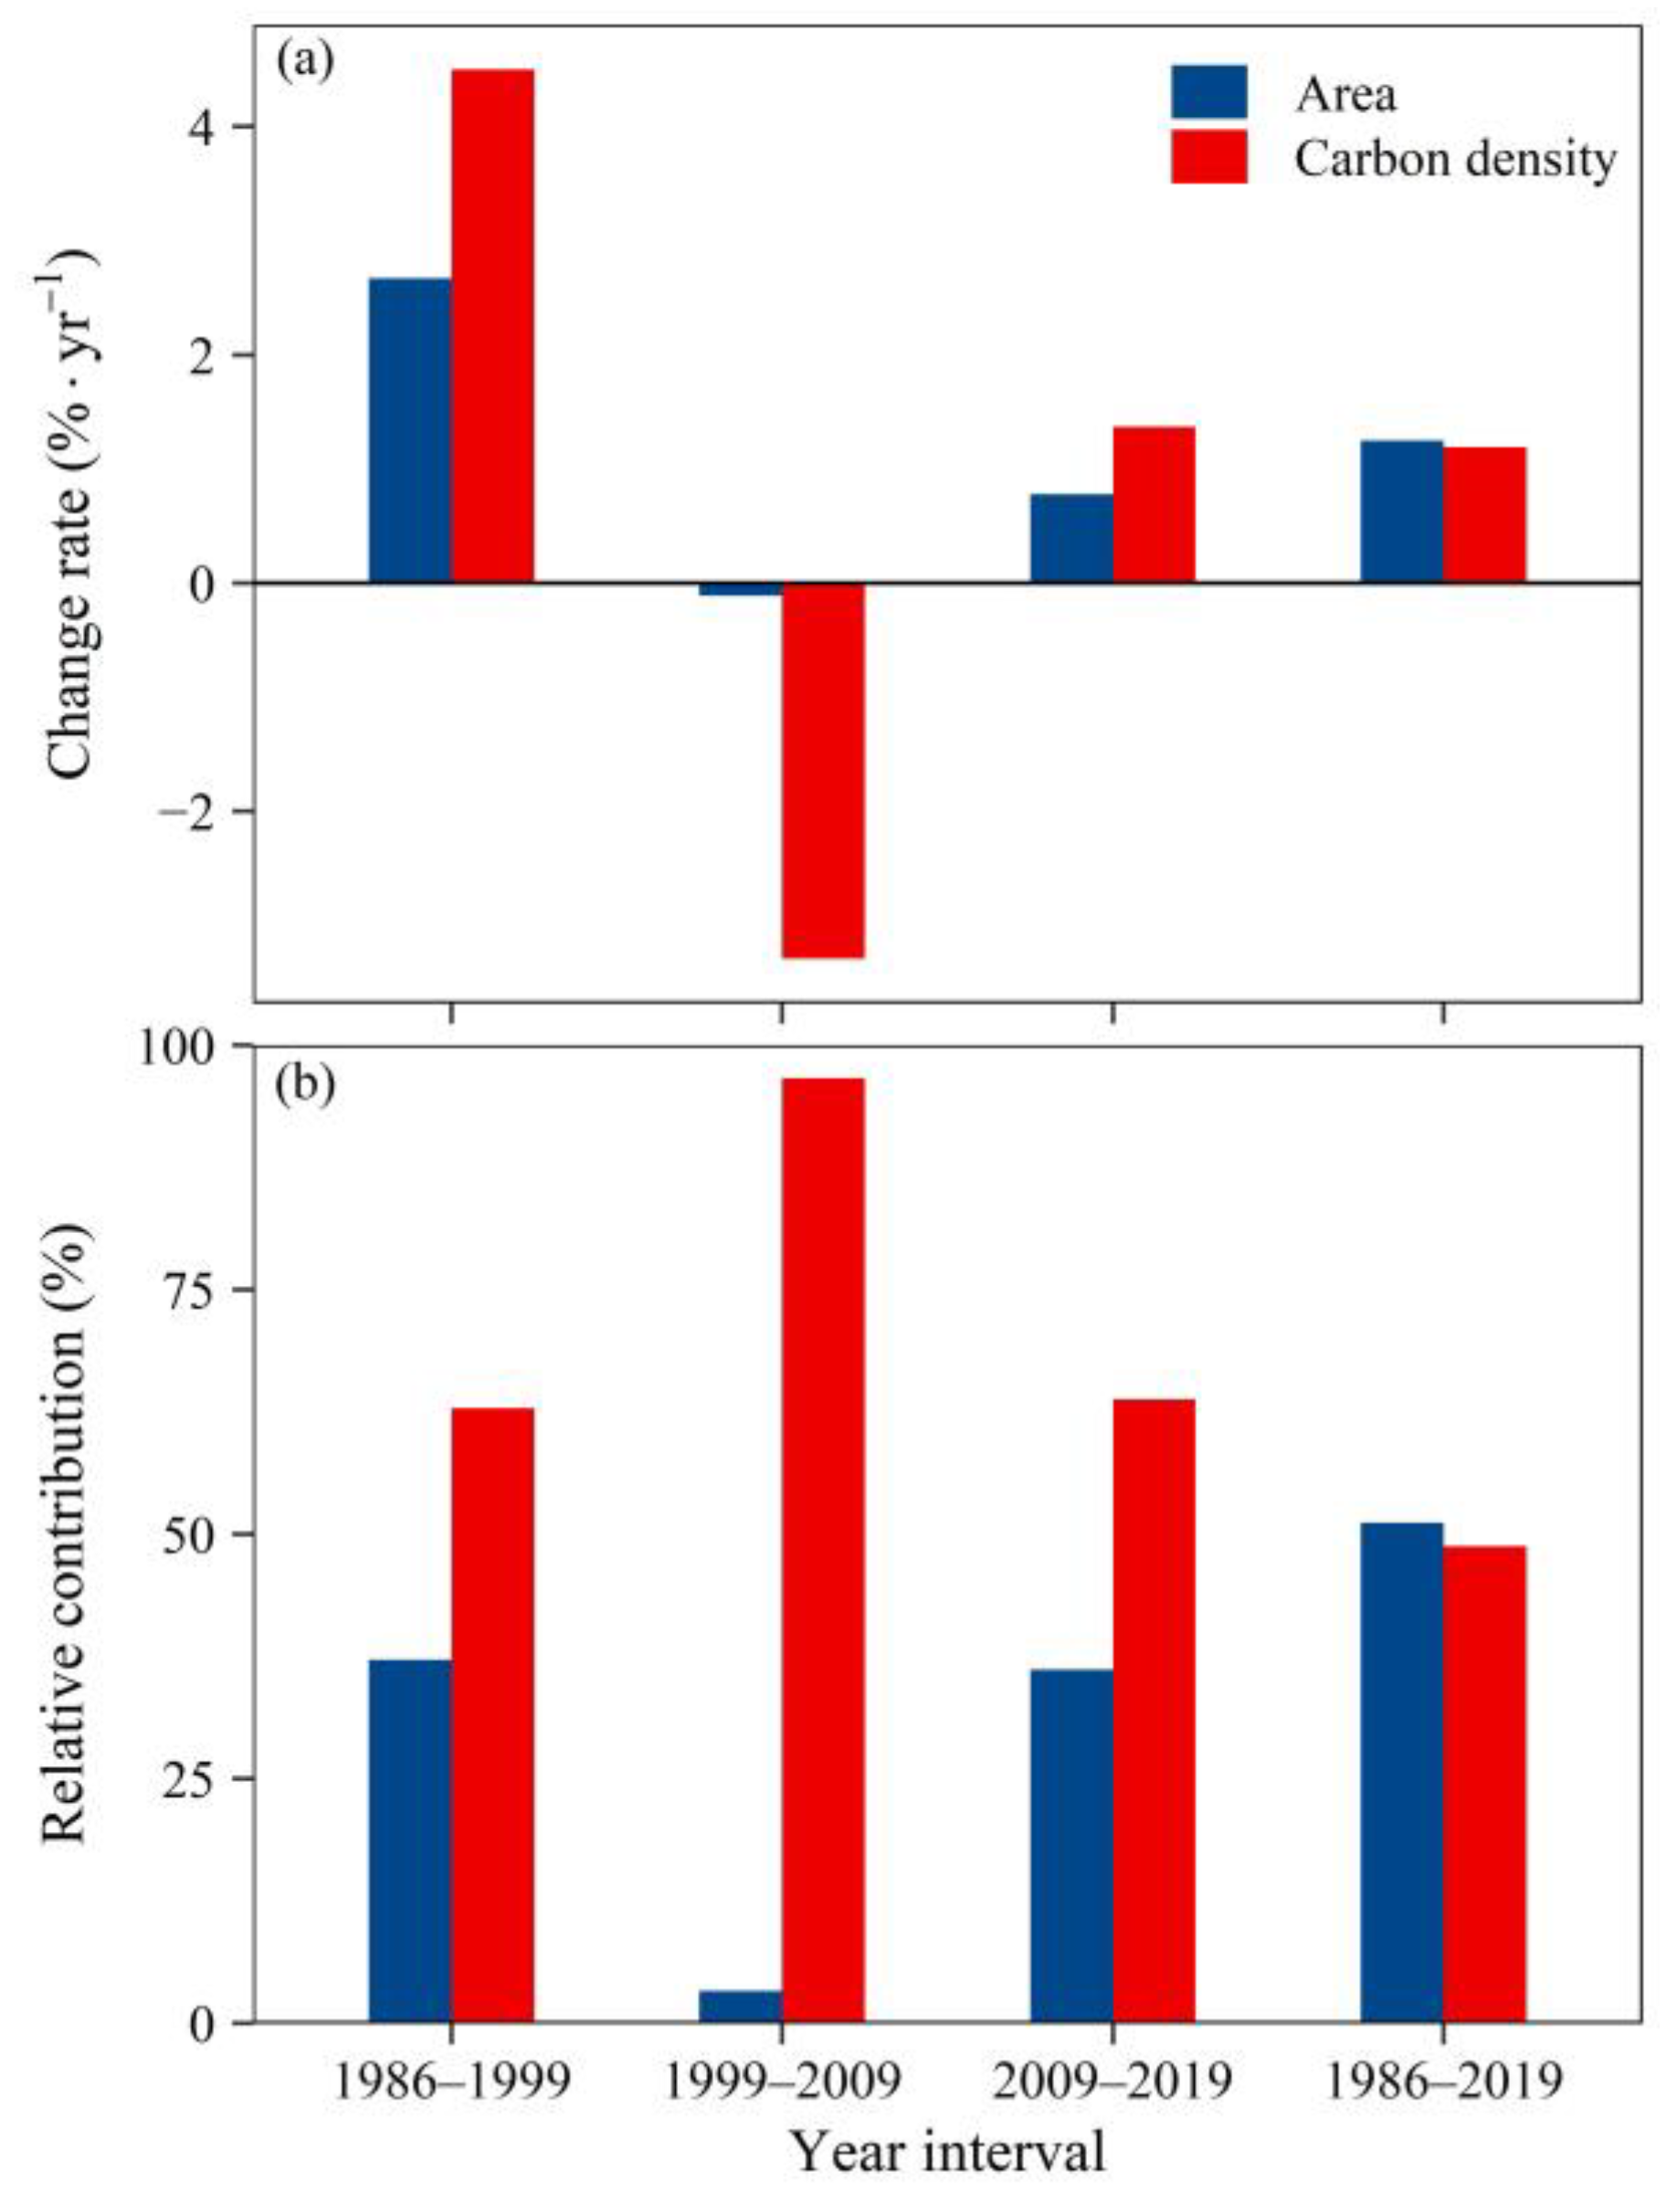
3.4. Relative Contributions of Changes in Forest Area and Vegetation Carbon Density to Vegetation Carbon Storage Variation

The relative contributions of changes in the forest area and vegetation carbon density to vegetation carbon variation were assessed based on the method by Fang et al. [18]. From 1986 to 2019, the annual mean change rates of the forest area and biomass density were 1.25% and 1.19% in Taihe County, respectively (Figure 7a), and the contributions of changes in the forest area and vegetation carbon density to the increase in the vegetation carbon storage were 1.23 Tg (51.55%) and 1.17 Tg (48.45%), respectively (Figure 7b). Both factors contributed almost equally, but large differences existed at different stages. In the first stage, forest vegetation showed a significant carbon sequestration ability; the forest vegetation carbon storage increased by 2.99 Tg, which was nearly 1.5 times the forest vegetation carbon storage in 1986. The increase in both the forest area and forest vegetation carbon density greatly improved the forest vegetation carbon storage, but the contribution of the increase in forest vegetation carbon density was 62.81%, which is higher than that of the forest area. In the second stage, the forest vegetation carbon storage decreased by 1.42 Tg, which was mainly caused by the reduction in the forest vegetation carbon density with a relative contribution of 96.67%. In the third stage, the forest vegetation carbon sequestration ability was recovered and the forest vegetation carbon storage increased by 0.84 Tg. The relative contributions were 36.19% and 63.81% for forest area expansion and vegetation carbon density increase, respectively. Clearly, forest quality (vegetation carbon density) changes controlled the variation of forest vegetation carbon storage in all three stages.

4. Discussion

Indiscriminate deforestation by human beings led to a significant decline in forest area and forest quality and a series of ecological problems, such as soil erosion, in China by the end of the 1970s. In the 1980s, national forest restoration projects were launched to restore the forest ecosystem across the whole of China to prevent the environment’s further degradation. With the development of afforestation, forest coverage, carbon storage, and other ecosystem services in China improved significantly [8,9,56], and subtropical China became a large carbon sink with annual carbon sequestration of 0.72 Pg C during the period of the 1990s and 2000s [57]. Forest vegetation carbon sequestration ability mainly depends on the forest area and forest quality (vegetation carbon density). Previous results based on the national forest inventory data from 1977 to 2008 showed that the relative contributions of China’s forest area and forest vegetation carbon density were almost equal [21], which is compatible with our findings. However, some other studies [20] based on the same data source from 1977 to 2018 showed that forest area expansion determined the forest vegetation carbon storage increase in China. The possible reason for this may be the difference in the study period. Among the different regions in the same period, there were also considerable differences in the relative contributions of the forest area expansion and forest vegetation carbon density increase to the forest vegetation carbon storage variation. Previous studies showed that the change in the forest vegetation carbon density was the only factor affecting forest vegetation carbon storage in the northeastern, northern, and central regions of China from 2009 to 2018, while forest area expansion dominated the forest vegetation carbon storage increase in the southwestern region at the same period [20]. To compare the analysis results with different datasets in the same region and the same duration, we selected national forest inventory data from the previous study in Jiangxi, Anhui, Hunan, Hubei, and Henan within the humid subtropical region. The result showed that the increase in forest vegetation carbon density was the only factor influencing the forest vegetation carbon storage variation from 2009 to 2018 [20]. Nevertheless, our study using the inventory data for forest management of Taihe County showed that the relative contribution of the increase in forest vegetation carbon density to the increase in forest vegetation carbon storage from 2009 to 2019 was 63.81%, which was obviously lower than that of the above result with national forest inventory data. Furthermore, the forest vegetation carbon storage increased in the humid subtropical region from 1999 to 2008 based on the national forest inventory data [21]. Nevertheless, our study with the inventory data for forest management showed a sharp decrease from 1999 to 2009. The opposite results very likely resulted from the discrepancy of different data sources, the national forest inventory data, and inventory data for forest management. The national forest inventory data were observed from the national permanent plots, which were reported to be protected or less disturbed to some extent in some regions due to the national marks [22]. Inventory data for forest management were obtained from plots randomly set in the forest to reflect the real situation of a forest ecosystem. Previous studies showed that forest vegetation carbon density was closely related to human activities. Compared with the forests in protected areas, unprotected forests showed distinct lower carbon density increments owing to the more frequent human disturbances [26,27]. Therefore, our study results might be more reliable in reflecting forest changes under real situations with human activities using RS images associated with inventory data for forest management. To further test the reliability of our study results, we used two inventory datasets for forest management of Taihe County in 2009 and 2019 with the unified data screening rules; the relative contribution of forest vegetation carbon density changes to forest vegetation carbon storage variation was 64.1%. This result from the field dataset was consistent with our study result of 63.81% using the RS data associated with the inventory data for forest management. This further demonstrated that our methods and results performed well with acceptable precision.
The development of forest vegetation carbon storage in Taihe County can be divided into three stages: the rapidly increasing stage (1986–1999), the slow-decreasing stage (1999–2009), and the steadily increasing stage (2009–2019), just corresponding to the previous time series of the first, second, and third stage. This variation could be attributed to the effects of human beings and extreme climate events [58,59,60].
In the first stage, the increase in forest vegetation carbon storage was mainly caused by the contribution of forest vegetation carbon density increase (62.81%). As we know, there were plenty of wastelands suitable for afforestation, so the area expansion of the forest, especially for coniferous plantations, was very rapid, with an annual increase of 2.70% in this stage. As the dominant plantation species, including the Masson pine, Slash pine, and Chinese fir, the area of these coniferous forests increased more rapidly by 7.95% per year. Therefore, it is reasonable to believe that forest area expansion has a greater contribution to the increase in forest vegetation carbon storage than the increase in forest vegetation carbon density. However, during this period, the Chinese government strengthened forest protection [1]. As a consequence, local people were also gradually conscious of the importance of forest protection, which further reduced human beings’ disturbance and promoted the growth of the forest [59]. In addition, the humid subtropical monsoon climate with plenty of hydrothermal resources was also conducive to forest growth [57]. Therefore, forest quality and other ecosystem services were improved more rapidly, and the forest vegetation carbon density increased by 4.61% annually (Figure 5). Of these, coniferous plantations showed the highest average annual increase of 18.58% [60]. As a result, the increase in the forest vegetation carbon density contributed more to the increase in the forest vegetation carbon storage than forest area expansion. This is consistent with previous results that demonstrate that afforestation in southern China significantly improved the forest vegetation carbon sequestration and other ecosystem services [61,62].
In the second stage, the forest area changed less but the forest vegetation carbon density declined, resulting in a great loss in the forest vegetation carbon storage. So it is quite easy to understand that the decreased forest vegetation carbon density mainly contributed (96.67%) to the reduction in the forest vegetation carbon storage. These results could be mainly ascribed to the following aspects: First, extreme climate events greatly decreased forest quality. Severe freezing rain and snow disasters from January to February 2008 caused considerable damage to the forests in China, especially in the subtropical region, and many forests were destroyed completely [63]. The large area of damaged coniferous plantations in this region was quite difficult to recover naturally, so large-scale logging had to be carried out for reforestation, which seriously lowered the forest quality [64]. Second, this region was an important wood production base in China and it provided a large number of coniferous plantations. The catastrophic flood that occurred in the Yangtze River in 1998 caused heavy economic losses and casualties, with a damaged area of over 21 million hectares, and more than 223 million people were affected. The disaster directly awoke the Chinese government and made them realize the importance of the ecological function of the forest ecosystem; thus, much more effort was made to improve the quality of the forest ecosystem. Therefore, most natural forests were protected. Instead, as a commercial forest base, many more coniferous plantations in this region were logged to compensate for the necessity of wood products [65]. Third, after decades of reforestation, the waste hills and unreclaimed lands that were suitable for afforestation were rarely available, which limited the expansion of the forest area. In addition, several provinces in south China carried out a forest ownership reform by changing the collectively owned forests to individually owned ones in 2004 [66]. This caused a short confusion in cutting management for individual forests and might have aggravated forest degradation to some extent.
In the third stage, the increase in the forest vegetation carbon storage was also mainly attributed to the increase in the forest vegetation carbon density (63.81%). The main reason was probably the increased area of plantations. The severe snow disaster in 2008 caused serious damage to forests, especially the coniferous plantations. To rapidly restore the destructed forest ecosystem, the annual afforestation area was boosted to more than 1500 ha from 2009 to 2012 while the average annual afforestation area was twice more than the amount from 2005 to 2008. Furthermore, the improvement in the forest tenure system insured forest growth. In 2008, the Chinese government formally extended the household rights for forest land to 70 years [67]. At the same time, a formal forest harvesting procedure for privately owned forests had also been established, which also prevented further deforestation. Therefore, the forest vegetation carbon density was steadily enhanced, especially for broadleaved and mixed forests [1,68].
In this study, some uncertainties may arise from the bias of RS image classification and model prediction. It is a bit hard to classify forest types precisely because of the not-very-fine resolution of Landsat data. To improve the accuracy of classification, we chose the classifier with a total accuracy of over 83% and a Kappa coefficient greater than 0.8 to make forest classification in our research, while the classification accuracy of forest types was 60%–80%, with a Kappa coefficient of 0.5–0.7 in previous studies [69]. The determination coefficient (R2 values) of linear fitting between the predicted values and the observed values were greater than 0.7 in our research, which was higher than or comparable to 0.4–0.7 in previous studies [70].

5. Conclusions

The national forest restoration projects that started in the 1980s have significantly increased not only the forest area but also the forest quality in China. In the subtropical red soil hilly region, the vegetation carbon storage in Taihe County increased by an annual rate of 2.47% and from 1.94 Tg in 1986 to 4.35 Tg in 2019, and it was mainly contributed by coniferous plantations. Our research showed that the increase in forest carbon storage in the red soil hilly region of subtropical China was ascribed to both the forest area expansion (51.55%) and vegetation carbon density increase (48.45%), and their contributions were almost equal. Interestingly, the forest vegetation carbon density controlled the variation of forest vegetation carbon storage in all three forest developing stages. When compared with previous studies, the contribution of the vegetation carbon density in our study was a little lower. Further analysis indicated that those studies might have overestimated the contribution of the vegetation carbon density change to the forest vegetation carbon storage variation when using the national forest inventory data, due to the national permanent plots, which tend to be protected to some extent and lessen human being’s disturbances.

Author Contributions

Conceptualization, H.W.; methodology, L.Y. and S.M.; software, L.Y. and S.M.; validation, L.Y., S.M., and F.Y.; formal analysis, L.Y. and H.W.; investigation, L.Y., S.M., and F.Y.; resources, S.M., X.D. and H.W.; data curation, L.Y. and X.D.; writing—original draft preparation, L.Y.; writing—review and editing, S.M. and H.W.; visualization, L.Y. and S.M.; supervision, H.W.; project administration, S.M. and H.W.; funding acquisition, S.M. and H.W. All authors have read and agreed to the published version of the manuscript.

Funding

This research was funded by the National Key R&D Program of China (2020YFA0608102) and the Special Project on National Science and Technology Basic Resources Investigation of China (2021FY100701).

Data Availability Statement

Not applicable.

Acknowledgments

Forest resource survey data of Taihe County are supported by Taihe County Forestry Bureau. We are thankful to all who helped in this study and grateful to anonymous reviewers for their comments, which allowed us to improve the initial manuscript.

Conflicts of Interest

The authors declare no conflict of interest.

References

  1. Yang, C.; Shi, Y.; Sun, W.; Zhu, J.; Ji, C.; Feng, Y.; Ma, S.; Guo, Z.; Fang, J. Updated estimation of forest biomass carbon pools in China, 1977–2018. Biogeosciences 2022, 19, 2989–2999. [Google Scholar] [CrossRef]
  2. Pan, Y.; Birdsey, R.A.; Fang, J.; Houghton, R.; Kauppi, P.E.; Kurz, W.A.; Phillips, O.L.; Shvidenko, A.; Lewis, S.L.; Canadell, J.G.; et al. A Large and persistent carbon sink in the world’s forests. Science 2011, 333, 988–993. [Google Scholar] [CrossRef] [Green Version]
  3. Pacala, S.W.; Hurtt, G.C.; Baker, D.; Peylin, P.; Houghton, R.A.; Birdsey, R.A.; Heath, L.; Sundquist, E.T.; Stallard, R.F.; Ciais, P.; et al. Consistent Land-and Atmosphere-Based U.S. Carbon Sink Estimates. Science 2001, 292, 2316–2320. [Google Scholar] [CrossRef] [Green Version]
  4. Guo, Z.; Hu, H.; Li, P.; Li, N.; Fang, J. Spatio-temporal changes in biomass carbon sinks in China’s forests from 1977 to 2008. Sci. China Life Sci. 2013, 56, 661–671. [Google Scholar] [CrossRef] [Green Version]
  5. Piao, S.; Fang, J.; Zhu, B.; Tan, K. Forest biomass carbon stocks in China over the past 2 decades: Estimation based on integrated inventory and satellite data. J. Geophys. Res. Atmos. 2005, 110, 195–221. [Google Scholar] [CrossRef] [Green Version]
  6. Dixon, R.K.; Solomon, A.M.; Brown, S.; Houghton, R.A.; Trexier, M.C.; Wisniewski, J. Carbon pools and flux of global forest ecosystems. Science 1994, 263, 185–190. [Google Scholar] [CrossRef] [PubMed]
  7. Erb, K.-H.; Kastner, T.; Plutzar, C.; Bais, A.L.S.; Carvalhais, N.; Fetzel, T.; Gingrich, S.; Haberl, H.; Lauk, C.; Niedertscheider, M.; et al. Unexpectedly large impact of forest management and grazing on global vegetation biomass. Nature 2017, 553, 73–76. [Google Scholar] [CrossRef]
  8. Piao, S.; Fang, J.; Ciais, P.; Peylin, P.; Huang, Y.; Sitch, S.; Wang, T. The carbon balance of terrestrial ecosystems in China. Nature 2009, 458, 1009–1013. [Google Scholar] [CrossRef] [PubMed]
  9. Fang, J.; Chen, A.; Peng, C.; Zhao, S.; Ci, L. Changes in forest biomass carbon storage in china between 1949 and 1998. Science 2001, 292, 2320–2322. [Google Scholar] [CrossRef]
  10. FAO. Global Forest Resources Assessment 2020: Main Report; FAO: Rome, Italy, 2020. [Google Scholar]
  11. Zhang, P.; Shao, G.; Zhao, G.; Le Master, D.C.; Parker, G.R.; Dunning, J.B.; Li, Q. Ecology—China’s forest policy for the 21st century. Science 2000, 288, 2135–2136. [Google Scholar] [CrossRef] [PubMed] [Green Version]
  12. Zhao, M.; Yang, J.; Zhao, N.; Liu, L.; DU, L.; Xiao, X.; Yue, T.; Wilson, J.P. Spatially explicit changes in forest biomass carbon of China over the past 4 decades: Coupling long-term inventory and remote sensing data. J. Clean. Prod. 2021, 316, 128274. [Google Scholar] [CrossRef]
  13. Fang, J.; Yu, G.; Liu, L.; Hu, S.; Chapin, F.S. Climate change, human impacts, and carbon sequestration in China. Proc. Natl. Acad. Sci. USA 2018, 115, 4015–4020. [Google Scholar] [CrossRef] [PubMed] [Green Version]
  14. Pan, Y.; Luo, T.; Birdsey, R.; Hom, J.; Melillo, J. New estimates of carbon storage and sequestration in China’s Forests: Effects of age-class and method on inventory-based carbon estimation. Clim. Chang. 2004, 67, 211–236. [Google Scholar] [CrossRef]
  15. Hua, F.; Wang, X.; Zheng, X.; Fisher, B.; Wang, L.; Zhu, J.; Tang, Y.; Yu, D.W.; Wilcove, D.S. Opportunities for biodiversity gains under the world’s largest reforestation programme. Nat. Commun. 2016, 7, 12717. [Google Scholar] [CrossRef] [PubMed] [Green Version]
  16. Xu, J. China’s new forests aren’t as green as they seem. Nature 2011, 477, 370. [Google Scholar] [CrossRef] [PubMed] [Green Version]
  17. Tong, X.; Brandt, M.; Yue, Y.; Ciais, P.; Rudbeck Jepsen, M.; Penuelas, J.; Wigneron, J.-P.; Xiao, X.-P.; Song, X.-P.; Horion, S.; et al. Forest management in southern China generates short term extensive carbon sequestration. Nat. Commun. 2020, 11, 129. [Google Scholar] [CrossRef] [Green Version]
  18. Fang, J.; Guo, Z.; Hu, H.; Kato, T.; Muraoka, H.; Son, Y. Forest biomass carbon sinks in East Asia, with special reference to the relative contributions of forest expansion and forest growth. Glob. Chang. Biol. 2014, 20, 2019–2030. [Google Scholar] [CrossRef]
  19. Kauppi, P.E.; Ausubel, J.H.; Fang, J.Y.; Mather, A.S.; Sedjo, R.A.; Waggoner, P.E. Returning forests analyzed with the forest identity. Proc. Ntal. Acad. Sci. USA 2006, 103, 17574–17579. [Google Scholar] [CrossRef] [PubMed] [Green Version]
  20. Zhao, M.; Yang, J.; Zhao, N.; Xiao, X.; Yue, T.; Wilson, J.P. Estimation of the relative contributions of forest areal expansion and growth to China’s forest stand biomass carbon sequestration from 1977 to 2018. J. Environ. Manag. 2021, 300, 113757. [Google Scholar] [CrossRef]
  21. Li, P.; Zhu, J.; Hu, H.; Guo, Z.; Pan, Y.; Birdsey, R.; Fang, J. The relative contributions of forest growth and areal expansion to forest biomass carbon. Biogeosciences 2016, 13, 375–388. [Google Scholar] [CrossRef] [Green Version]
  22. Zeng, W.; Zhou, Y. Discussion on main problems and countermeasures to continuous forest inventory and forest management inventory. Cent. South For. Inventory Plan. 2003, 22, 8–11. (In Chinese) [Google Scholar]
  23. Zhao, M.; Yang, J.; Zhao, N.; Liu, Y.; Wang, Y.; Wilson, J.P.; Yue, T. Estimation of China’s forest stand biomass carbon sequestration based on the continuous biomass expansion factor model and seven forest inventories from 1977 to 2013. For. Ecol. Manag. 2019, 448, 528–534. [Google Scholar] [CrossRef]
  24. Xu, X.; Cao, M.; Li, K. Temporal-spatial dynamics of carbon storage of forest vegetation in China. Prog. Geogr. 2007, 26, 1–10. (In Chinese) [Google Scholar]
  25. Wang, X.; Feng, Z.; Ouyang, Z. The impact of human disturbance on vegetative carbon storage in forest ecosystems in China. For. Ecol. Manag. 2001, 148, 117–123. [Google Scholar] [CrossRef]
  26. Chen, S.; Jiang, H.; Jin, J.; Wang, Y. Changes in net primary production in the Tianmu Mountain Nature Reserve, China, from 1984 to 2014. Int. J. Remote. Sens. 2016, 38, 211–234. [Google Scholar] [CrossRef]
  27. Yang, X.; Blagodatsky, S.; Lippe, M.; Liu, F.; Hammond, J.; Xu, J.; Cadisch, G. Land-use change impact on time-averaged carbon balances: Rubber expansion and reforestation in a biosphere reserve, South-West China. For. Ecol. Manag. 2016, 372, 149–163. [Google Scholar] [CrossRef]
  28. Jiang, G.; Han, B.; Gao, Y.; Yang, C. Review of 40-year earth observation with Landsat series and prospects of LDCM. J. Remote Sens. 2013, 17, 1033–1048. [Google Scholar]
  29. Xiang, W.; Zhou, J.; Ouyang, S.; Zhang, S.; Lei, P.; Li, J.; Deng, X.; Fang, X.; Forrester, D.I. Species-specific and general allometric equations for estimating tree biomass components of subtropical forests in southern China. Eur. J. For. Res. 2016, 135, 963–979. [Google Scholar] [CrossRef]
  30. Wang, Z.; Du, H.; Song, T.; Peng, W.; Zeng, F.; Zeng, Z.; Zhang, H. Allometric models of major tree species and forest biomass in Guangxi. Acta Ecologica Sinica 2015, 35, 4462–4472. (In Chinese) [Google Scholar]
  31. Zuo, S.-D.; Ren, Y.; Weng, X.; Ding, H.-F.; Luo, Y.-J. Biomass allometric equations of nine common tree species in an evergreen broadleaved forest of subtropical China. Yingyong Shengtai Xuebao. 2015, 26, 356–362. [Google Scholar]
  32. Ma, Z.; Liu, Q.; Xu, W.; Li, X.; Liu, Y. Carbon storage of artificial forest in Qianyanzhou, Jiangxi province. Sci. Silvae Sin. 2007, 43, 1–7. (In Chinese) [Google Scholar]
  33. Zhou, H.; Meng, S.; Liu, Q. Allometric equations for estimating aboveground biomass of broad-leaved forests saplings and shrubs in subtropical China. J. Nanjing For. Univ. (Nat. Sci. Ed.) 2017, 41, 79–86. (In Chinese) [Google Scholar]
  34. Chen, F.; Luo, Y.; Li, Q. Allometric equations for estimating biomass of dominant shrub species in subtropical forests in eastern Guangdong Province, China. J. Cent. South Univ. For. Technol. 2013, 33, 5–10. (In Chinese) [Google Scholar]
  35. Li, Y.; Zheng, S.; Gong, G.; Chen, J.; Tang, B.; Zhu, Z.; Wu, X.; Mu, C. Biomass and its allocation of undergrowth Vitex negundo L. in different age classes of mixed cypress forest. Acta Ecologica Sinica 2010, 30, 2809–2818. (In Chinese) [Google Scholar]
  36. Zhang, H.; Liu, Q.; Lu, P.; Yu, Q.; Zeng, H. Biomass estimation of several common shrubs in Qianyanzhou experimental station. For. Inventory Plan. 2005, 30, 43–49. (In Chinese) [Google Scholar]
  37. Luo, Y.; Wang, X.; Zhang, X. Biomass and Its Allocation In Forest Ecosystems in China; Forestry Publishing House: Beijing, China, 2013. (In Chinese) [Google Scholar]
  38. Gamon, J.A.; Field, C.B.; Goulden, M.L.; Griffin, K.L.; Hartley, A.E.; Joel, G.; Penuelas, J.; Valentini, R. Relationships between NDVI, canopy structure, and photosynthesis in three californian vegetation types. Ecol. Appl. 1995, 5, 28–41. [Google Scholar] [CrossRef] [Green Version]
  39. Jordan C, F. Derivation of leaf-area index from quality of light on the forest floor. Ecology 1969, 50, 663–666. [Google Scholar] [CrossRef]
  40. Tucker C, J. Red and photographic infrared linear combinations for monitoring vegetation. Remote Sens. Environ. 1979, 8, 127–150. [Google Scholar] [CrossRef] [Green Version]
  41. Dorren, L.K.A.; Maier, B.; Seijmonsbergen, A.C. Improved Landsat-based forest mapping in steep mountainous terrain using object-based classification. For. Ecol. Manag. 2003, 183, 31–46. [Google Scholar] [CrossRef]
  42. Breiman, L. Random forests. Mach. Learn 2001, 45, 5–32. [Google Scholar] [CrossRef] [Green Version]
  43. Safavian, S.; Landgrebe, D. A survey of decision tree classifier methodology. IEEE Trans. Syst. Man Cybern. 1991, 21, 660–674. [Google Scholar] [CrossRef] [Green Version]
  44. Franklin, J. Predictive vegetation mapping: Geographic modelling of biospatial patterns in relation to environmental gradients. Prog. Phys. Geogr. Earth Environ. 1995, 19, 474–499. [Google Scholar] [CrossRef]
  45. Rodriguez-Galiano, V.F.; Ghimire, B.; Rogan, J.; Chica-Olmo, M.; Rigol-Sanchez, J.P. An assessment of the effectiveness of a random forest classifier for land-cover classification. ISPRS J. Photogramm. Remote Sens. 2012, 67, 93–104. [Google Scholar] [CrossRef]
  46. Friedl, M.; Brodley, C. Decision tree classification of land cover from remotely sensed data. Remote. Sens. Environ. 1997, 61, 399–409. [Google Scholar] [CrossRef]
  47. Paola, J.D.; Schowengerdt, R.A. A review and analysis of backpropagation neural networks for classification of remotely-sensed multi-spectral imagery. Int. J. Remote Sens. 1995, 16, 3033–3058. [Google Scholar] [CrossRef]
  48. Gislason, P.O.; Benediktsson, J.A.; Sveinsson, J.R. Random Forests for land cover classification. Pattern Recognit. Lett. 2006, 27, 294–300. [Google Scholar] [CrossRef]
  49. Richards, J.A. Remote Sensing Digital Image Analysis: An Introduction, 5th ed.; Springer: Berlin/Heidelberg, Germany, 2013. [Google Scholar]
  50. Crist, E.P.; Cicone, R.C. Application of the tasseled cap concept to simulated thematic mapper data. Photogramm. Eng. Remote Sens. 1984, 50, 343–352. [Google Scholar]
  51. Nanni, L.; Brahnam, S.; Ghidoni, S.; Menegatti, E.; Barrier, T. Different approaches for extracting information from the co-occurrence matrix. PLoS ONE 2013, 8, e83554. [Google Scholar] [CrossRef] [Green Version]
  52. Fisher, R.A.; Yates, F. Statistical Tables for Biological, Agricultural and Medical Research; Oliver and Boyd: Edinburgh/London, UK, 1938. [Google Scholar]
  53. Hubbard, R.; Bayarri, M.J. Confusion over measures of evidence (p’s) versus errors (α’s) in classical statistical testing. Am. Stat. 2003, 57, 171–178. [Google Scholar] [CrossRef]
  54. Papale, D.; Valentini, A. A new assessment of European forests carbon exchanges by eddy fluxes and artificial neural network spatialization. Glob. Change Biol. 2003, 9, 525–535.41. [Google Scholar] [CrossRef]
  55. Waggoner, P.E. Using the forest Identity to grasp and comprehend the swelling mass of forest statistics. Int. For. Rev. 2008, 10, 689–694. [Google Scholar] [CrossRef]
  56. Chen, C.; Park, T.; Wang, X.; Piao, S.; Xu, B.; Chaturvedi, R.K.; Fuchs, R.; Brovkin, V.; Ciais, P.; Fensholt, R.; et al. China and India lead in greening of the world through land-use management. Nat. Sustain. 2019, 2, 122–129. [Google Scholar] [CrossRef] [PubMed]
  57. Yu, G.; Chen, Z.; Piao, S.; Peng, C.; Ciais, P.; Wang, Q.; Li, X.; Zhu, X. High carbon dioxide uptake by subtropical forest ecosystems in the East Asian monsoon region. Proc. Natl. Acad. Sci. USA 2014, 111, 4910–4915. [Google Scholar] [CrossRef] [PubMed] [Green Version]
  58. Brown, S.; Schroeder, P.; Birdsey, R. Aboveground biomass distribution of US eastern hardwood forests and the use of large trees as an indicator of forest development. For. Ecol. Manag. 1997, 96, 37–47. [Google Scholar] [CrossRef]
  59. Fang, J.; Piao, S.; He, J.; Ma, W. Increasing terrestrial vegetation activity in China, 1982–1999. Sci. China Life Sci. 2004, 47, 229–240. [Google Scholar] [CrossRef]
  60. Zhang, C.; Ju, W.; Chen, J.M.; Wang, X.; Yang, L.; Zheng, G. Disturbance-induced reduction of biomass carbon sinks of China’s forests in recent years. Environ. Res. Lett. 2015, 10, 114021. [Google Scholar] [CrossRef]
  61. Sheng, W. On the maintenance of Long-term productivity of plantation in China. For. Res. 2018, 31, 1–14. (In Chinese) [Google Scholar]
  62. Bryan, B.A.; Gao, L.; Ye, Y.; Sun, X.; Connor, J.D.; Crossman, N.D.; Stafford-Smith, M.; Wu, J.; He, C.; Yu, D.; et al. China’s response to a national land-system sustainability emergency. Nature 2018, 559, 193–204. [Google Scholar] [CrossRef]
  63. Wang, X.; Huang, S.; Li, J.; Zhou, G.; Shi, L. Sprouting response of an evergreen broad-leaved forest to a 2008 winter storm in Nanling Mountains, southern China. Ecosphere 2016, 7, e01395. [Google Scholar] [CrossRef]
  64. Ma, Z.; Wang, H.; Wang, S.; Li, Q.; Wang, Y.; Wang, H. Impact of a severe ice storm on subtropical plantations at Qianyanzhou, Jiangxi, China. Chin. J. Plant Ecol. 2010, 34, 204–212. (In Chinese) [Google Scholar]
  65. Zhou, S. Deepening understanding and classification guidance to fight the tough battle of forestry development in the phase of staid. For. China 2005, 8, 4–11. (In Chinese) [Google Scholar]
  66. Wang, G.; Innes, J.L.; Lei, J.; Dai, S.; Wu, S. Ecology—China’s forestry reforms. Science 2007, 318, 1556–1557. [Google Scholar] [CrossRef] [Green Version]
  67. Xu, J.; Hyde, W.F. China’s second round of forest reforms: Observations for China and implications globally. For. Policy Econ. 2019, 98, 19–29. [Google Scholar] [CrossRef]
  68. Holtmann, A.; Huth, A.; Pohl, F.; Rebmann, C.; Fischer, R. Carbon sequestration in mixed deciduous forests: The influence of tree size and species composition derived from model experiments. Forests 2021, 12, 24. [Google Scholar] [CrossRef]
  69. Pizarro, S.E.; Pricope, N.G.; Vargas-Machuca, D.; Huanca, O.; Ñaupari, J. Mapping land cover types for highland Andean ecosystems in Peru using google earth engine. Remote. Sens. 2022, 14, 1562. [Google Scholar] [CrossRef]
  70. Li, Y.; Li, C.; Li, M.; Liu, Z. Influence of variable selection and forest type on forest aboveground biomass estimation using machine learning algorithms. Forests 2019, 10, 24. [Google Scholar] [CrossRef] [Green Version]
Figure 1. The geographical location of Taihe County and sampling plot distribution.
Forests 14 00602 g001
Figure 2. Relationships between observed and predicted vegetation carbon densities for different forest types.
Forests 14 00602 g002
Figure 3. Distribution map of forest types of Taihe County from 1986 to 2019.
Forests 14 00602 g003
Figure 4. Area changes in different forest types in Taihe County from 1986 to 2019.
Forests 14 00602 g004
Figure 5. Vegetation carbon density changes in different forest types from 1986 to 2019.
Forests 14 00602 g005
Figure 6. Vegetation carbon storage change in different forest types from 1986 to 2019.
Forests 14 00602 g006
Figure 7. Annual mean change rates of forest area and vegetation carbon density (a) and their relative contributions to change in forest vegetation carbon storage (b) in different stages.
Forests 14 00602 g007
Table 1. Stand characteristics of the six forests.
Forest TypesDiameter (cm)Stand Density (trees/ha)Volume
(m3/ha)
Carbon Storage (Mg/ha)Sample Size
Arbor LayerShrub LayerHerb Layer
Slash pine forest13.62 (±3.41)1175 (±419)145.00 (±70.73)25.45 (±9.64)7.22 (±6.62)2.14 (±0.65)14
Chinese fir forest12.60 (±2.24)2631 (±968)172.67 (±56.24)35.97 (±11.42)3.95 (±3.76)1.82 (±1.13)9
Masson pine forest8.31 (±3.36)1465 (±685)58.77 (±37.82)21.35 (±13.49)10.25 (±11.34)1.83 (±0.48)5
Broadleaved forest18.80 (±3.36)1306 (±699)215.64 (±102.43)119.27 (±57.54)0.13 (±0.07)1.16 (±0.34)9
Mixed forest12.21 (±3.11)1350 (±620)105.83 (±55.58)44.84 (±28.66)17.39 (±25.89)2.15 (±1.35)5
Bamboo forest9.60 (±0.29)2700 (±535)46.31 (±6.78)27.36 (±4.24)1.55 (±0.72)1.30 (±0.52)3
Values are expressed as mean (±standard deviation).
Table 2. Relationships between stand biomass and volume for different forest types.
Forest TypesModel ExpressionR2RMSE (Mg/ha)
Slash pine forestW = 0.326V + 14.1970.9802.710
Chinese fir forestW = 0.489V + 2.3580.9961.517
Masson pine forestW = 0.860V + 0.9490.9990.707
Broadleaved forestW = 1.846V − 71.2450.85158.131
Mixed forestW = 1.101V − 8.2600.78226.771
Bamboo forestW = 1.585V − 3.0890.9751.333
Table 3. Classification accuracy assessment of different classifiers.
ClassifierTotal AccuracyKappa Coefficient
Decision tree76.8%0.759
Random forest 83.2%0.804
BP neural network62.0%0.538
Table 4. Summary of predictors for forest vegetation carbon storage estimation.
Variable TypeVariable NumberVariable NameDescription
Band image6B1Blue (0.45~0.52 μm)
B2Green (0.52~0.60 μm)
B3Red (0.63~0.69 μm)
B4NIR (0.76~0.90 μm)
B5SWIR1 (1.55~1.75 μm)
B6SWIR2 (2.09~2.35 μm)
Principal components transformation3PC1, PC2, and PC3First, second, and third bands from principal component analysis
Tasseled cap transformation3Brightness, greenness, and wetnessThree bands produced by tasseled cap transformation
Vegetation index15DVIDifference vegetation index
EVIEnhanced vegetation index
GARIGreen atmospherically resistant index
GDVIGreen difference vegetation index
GNDVIGreen normalized difference Vegetation index
GRVIGreen ratio vegetation index
IPVIInfrared percentage vegetation index
LAILeaf area index
NDVINormalized difference vegetation index
OSAVIOptimized soil-adjusted vegetation index
RDVIRenormalized difference vegetation index
RVIRatio vegetation index
SAVISoil-adjusted vegetation index
TDVITransformed difference vegetation index
VARIVisible atmospherically resistant index
Texture image144BiTjMea, BiTjVar, BiTjHom, BiTjCon, BiTjDis, BiTjEnt, BiTjSem, and BiTjCorBands 1–6 texture measurement Using gray-level co-occurrence matrix
Terrain image3DEM, slope, and aspectExtraction based on DEM
Note: BiTjXXX represents a texture image developed in the Landsat surface reflectance band i (1–6) using the texture measure with a j × j (3, 5, 7) pixel window, where XXX is Co(contrast), Dis (dissimilarity), Mea (mean), Hom (homogeneity), SeM (angular second moment), Ent (entropy), Var (variance), or Cor (correlation).
Table 5. Sample sizes of vegetation carbon storage inversion models across different forest types.
Forest TypesSample Size
TotalTrainingValidationTest
Coniferous forest50063504751751
Broadleaved forest22271559334334
Mixed forest1293905194194
Bamboo forest 4803367272
Disclaimer/Publisher’s Note: The statements, opinions and data contained in all publications are solely those of the individual author(s) and contributor(s) and not of MDPI and/or the editor(s). MDPI and/or the editor(s) disclaim responsibility for any injury to people or property resulting from any ideas, methods, instructions or products referred to in the content.

