Article

Planted or Natural Pine Forests, Which One Will Better Recover after Drought? Insights from Tree Growth and Stable C and H Isotopes

by
Rafael Mª Navarro-Cerrillo
1,*,
Antonio M. Cachinero-Vivar
1,
Francisco J. Ruiz-Gómez
1,
J. Julio Camarero
2,
José A. González-Pérez
3 and
Óscar Pérez-Priego
1
1
Laboratory of Dendrochronology, Silviculture and Climate Change, Department of Forestry, School of Agriculture and Forestry, University of Córdoba, DendrodatLab-ERSAF, Edif. Leonardo da Vinci, Campus de Rabanales s/n, E-14071 Córdoba, Spain
2
Instituto Pirenaico de Ecología (IPE-CSIC), Avda. Montañana 1005, E-50192 Zaragoza, Spain
3
Instituto de Recursos Naturales y Agrobiología de Sevilla (IRNAS-CSIC), Av. de la Reina Mercedes 10, E-41012 Sevilla, Spain
*
Author to whom correspondence should be addressed.
Forests 2023, 14(3), 573; https://doi.org/10.3390/f14030573
Submission received: 16 January 2023 / Revised: 24 February 2023 / Accepted: 11 March 2023 / Published: 13 March 2023
(This article belongs to the Section Forest Meteorology and Climate Change)

Abstract

:
Increasing intensity and frequency of droughts are leading to forest dieback, growth decline and tree mortality worldwide. Reducing tree-to-tree competition for water resources is a primary goal for adaptive climate silviculture strategies, particularly in reforested areas with high planting density. Yet, we need better insights into the role of stand type (i.e., natural forests versus plantations) on the resilience of pine forests to droughts across varying time scales. In this study, we combined dendrochronological data and stable C (δ13C) and H (δ2H) isotopes measured in tree-ring wood as well as in specific wood chromatographically isolated compounds to investigate contrasting responses to drought of natural versus planted stands of two representative pine species, i.e., Pinus pinaster and Pinus nigra in southeastern Europe. Natural stands exhibited about two-fold increase in tree-ring growth in average (basal area at 20 years-BAI20) as compared to planted stands. A response function analysis showed contrasting seasonal growth patterns for both species, which were related to monthly mean temperature and precipitation. Both stand type and species variables influenced growth resilience indices. Both pine species revealed contrasting resilience patterns among forest types; whereas planted stands seemed to be less sensitive to yearly droughts as determined by a higher recovery index (CRc) for P. pinaster, the contrary was found in the case of P. nigra. On the other hand, while resistance CRT and resilience CRS indices were higher for planted than natural forests in the case of P. pinaster, little differences were found for P. nigra. Beyond comparisons, carbon stable isotopes shed lights on the role of forest types in dry sites, being δ13C consistently lower in natural than in planted forests for both pine species (p < 0.05). We concluded that planted forest assimilated more carbon as per unit of water used than natural stands in response to droughts. Both δ13C and δ2H isotopic signals were positively correlated for both species for planted forests. However, a lack of correlation was evidenced for natural stands. Consistent with δ13C observations, δ2H concentrations in woody phenolic compounds (guaiacol and oleic acid) revealed contrasting patterns among forest types. This puts forward that δ2H concentrations in woody phenolic compounds (rather than in woody tree ring) accounts for other confounding factors in tree ring formation that can be associated with forest type. Our results highlight the value of stable isotope approaches versus conventional dendrochronological tools in drought studies and call for the consideration of forest type as an endogenous aspect defining the vulnerability of pine forests to climate.

1. Introduction

Forest dieback and tree mortality events caused by drought stress have been reported worldwide, many impacting pine forests in seasonally dry areas such as the Mediterranean basin [1,2]. Pine forests in Southern Europe are likely to face prolonged water shortages due to climate change projections [3]. The response of forests to droughts have been shown to be largely uncertain, varying among plant biomes, structural variables, environmental conditions, and across timescales [4]. This drought time-scale dependency reflects contrasting physiological responses that hamper our ability to make accurate predictions. Regardless of these uncertainties, an important reduction in tree growth is forecasted in Mediterranean pine forests, mainly due to climate change projections [5]. In fact, such aridification trends have already been aggravated during the last decade leading to raised mortality rates across pine stands [5,6]. Here we will hypothesize that this scenario will be particularly intense in planted as compared to natural pine stands. Specifically, we predict that planted forest are particularly threatened by climate change due to historical aspects associated with planting system. Yet, we need to better understand the role of structural properties of stands on the resilience of pine forests that allow developing adaptive forest management strategies.
In the second half of the 20th century, large-scale reforestation and restoration efforts for ecosystem service provision (primarily for the purpose of preventing soil erosion [7]) were conducted with pine plantations in the Mediterranean Basin. It is worthwhile to note that most pine plantations were done with high planting density on sites with rocky, thin soils that have led to even-aged stands with shallow root systems, and a high tree-to-tree competition for water resources. The extent to which competition plays a role on physiological mechanisms associated with time-scale droughts remains unclear. In the short term, mechanisms such as xylem cavitation and hydraulic failure are expected in high density planting stands in response to intense droughts, which largely limit tree transpiration, and cause growth decline, dieback, and mortality in the medium and long term [8]. This is the case of poorly managed Mediterranean pine plantations, accounting for approximately 10% of the total forest area, which have recently experienced drought-induced dieback [5,9,10]. This background has made planted pine forests particularly more susceptible to droughts as compared to natural stands, which are characterized by more complex structures, and more importantly by lower density stands that better fit site productivity [11,12]. Although key aspects associated with biodiversity of populations (including genetic variability within species) should not be neglected, we need a more holistic understanding of the main factors underlying growth and resilience at the required time scales. However, despite tree mortality and severe crown defoliation are common phenomena in Mediterranean pine forests, they may be caused by complex interactions between abiotic (e.g., drought) and biotic (e.g., tree-to-tree competition, insects, fungi) stressors which should be disentangled [13,14].
The degree of resilience can be determined from the physiological response of plant species to water deficits, which can be evaluated at different temporal scales. In the short-time scale, physiological observations are generally restricted to instantaneous leaf gas exchange measurements. In the seasonal and yearly time scales, physiological responses to water stress can be monitored with more time-integrated observations such as growth rates determined from tree ring growth approaches. For instance, dendrochronological studies have shown that drought limits radial growth in a variety of stands and site situations, in particular xeric areas prone to drought-induced dieback [15]. Complementary to classical tree ring growth indices, the use of stable isotopes (mainly δ13C, δ18O, and δ2H) in tree-rings has improved our abilities to track down drought responses back in time (up to several decades) [16,17]. This temporal dimension provides key features of the multi scalar character of the chronology of droughts as compared to traditional physiological studies using instantaneous leaf-level gas exchanges measurements [18]. Furthermore, carbon isotope ratios such as δ13C and δ18O in tree-ring wood or cellulose has been widely used as a surrogate for intrinsic water-use efficiency (iWUE), i.e., a measure of the ratio between carbon assimilation and stomatal conductance for water vapor. In fact, iWUE is a key parameter for studying the response of vegetation to water stress, and hence its importance in breeding programs for “drought resistance” [19]. Changes in stable isotopes such as δ13C and δ18O have been shown to vary with key environmental variables such as air temperature, precipitation, and vapor pressure deficit [20]. These relationships can be inverted, and climate signal can be consequently inferred from stable oxygen isotopes (δ18O) in organic matter that originated from water [21]. In Mediterranean areas, the combined study of δ13C and δ18O in wood have revealed the different vulnerability to drought of tree species [2,22]. However, very few studies have yet employed δ2H to assess forest responses to drought [23].
In addition to climate, stand structural characteristics influence tree physiology, and hence growth and survival [24,25]. For instance, in line with iWUE, both δ13C and δ18O in wood have demonstrated that competition in high density pine plantation intensifies drought stress [11,26,27]. However, the relationship between iWUE and forest growth is unclear in seasonally dry forests [28]. For instance, Moreno-Gutiérrez et al. [27] revealed that trees in dense pine plantations showed consistently higher δ18O (but similar δ13C) values than open woodlands, indicating lower photosynthetic performance in the former, but no differences in iWUE between stand types. Therefore, the impact of drought on the complex relationship across different surrogates of iWUE and growth rates requires further enquiries.
In this study, we will provide a comprehensive assessment of the impact of drought events on growth and several stable isotopes including δ13C and δ2H in both tree-ring wood and specific wood chromatographically isolated compounds. Our overall objective is to compare such an impact on two contrasting stand types, such as natural vs. planted pine stands, across two pine species (Pinus pinaster Ait. and Pinus nigra Arn. subsp. salzmannii (Dunal)) growing along an aridity gradient in southeastern Spain. Dieback has affected both plantations and natural forests of the two species since the early 2000s in this area [10,11,29]. Furthermore, plantations of both species have been shown to be particularly responsive to water shortage [5,30,31,32]. The vulnerability of these plantations to drought raises concerns about their long-term viability. Here we hypothesize both a poorer post-drought recovery (growth resilience) and higher vulnerability of planted as compared to natural stands. To test this hypothesis, we: (1) compare the variability of growth, δ13C and δ2H between planted and natural pine forests, (2) quantify the relationships between climate, growth indices and stable isotope data, (3) assess post-drought growth resilience, and (4) disentangle the impacts of drought on tree functioning in natural versus planted pine forests. Finally, we will put these findings in perspective of adaptive climate silviculture applications.

2. Materials and Methods

2.1. Study Sites and Tree Species

We identified three hotspots for pine forests in Andalusia, south-eastern Spain, based on a climatic gradient. The experimental sites comprise eight populations, distributed throughout Sierra de Baza-Filabres (2°32′–2°50′ W, 37°13′–37°23′ N; hereafter “Almería”), Sierra Nevada (2°32′ W, 37°13′ N; hereafter “Granada”), and Sierra de Tejeda-Almijara (2°32′ W, 37°13′ N; hereafter “Málaga”; Table 1; Figure S1 Supplementary Material). All sites experience a Mediterranean climate with a hot and dry summer, preceded or followed by cool and rainy spring and autumn conditions. The mean January and July temperatures range from 8.9 to 24.5 °C, and the mean annual temperatures range between 14.5 °C to 17.3 °C. The mean annual precipitation ranges between 350 to 600 mm, with predominantly dry conditions from April to October (Table 1). Xerorthent regosols [33] are the predominant soils, mostly developed on quartzite and schist is steep slopes (>35%).
Natural and planted pine forests were sampled along an aridity gradient with precipitation decreasing from NW to SE (Table 1). In the second half of the 20th century, large pine plantations were established with the primary objective of preventing soil erosion. As a result, planting density ranged between 1500 and 2000 trees ha−1, and only protective thinning was done every 20 to 25 years since planting. Understory of natural pine forests consists primarily of Mediterranean shrubs like Cistus spp., Ulex baeticus Boiss and Erica scoparia L. in the more humid areas, and Genista spp. and Retama spp. in the dry regions. Dieback and high pine mortality have been observed in these regions over the past ten years, primarily as a result of drought stress and heatwaves [5,10,11]. In general, P. pinaster occupies warmer and drier sites, mainly on acid soils, than P. nigra, which is usually found at cooler and wetter Mediterranean mountain sites, often on basic soils [34].

2.2. Climate Data

We used 1-km gridded climatic data sets of mean temperature and total precipitation. This database was updated for the period 2007–2020 by bonding local climate data from stations operated by the Andalusian Regional Government and the Spanish Meteorological Agency (AEMET). To harmonize these data sets, climate variables were previously scaled at 1-km resolution through an interpolation procedure implemented in the R package “meteoland” [35]. This approximation was evaluated in cross-validation using seven-year data (2000–2007). Annual and seasonal time series of mean temperature and total precipitation (Figure S2, Supplementary Material), as well as the yearly water deficit, were computed following Hargreaves and Samani [36] as the sum of the monthly variances between precipitation and potential evapotranspiration. The water balance for each hydrological year (from 1 September to 31 August) was also estimated. This allowed defining the following drought years: 1995, 2005 and 2012.

2.3. Field Sampling and Dendrochronological Data

In summer 2021, two square plots of 40 × 40 m were established in each population (n = 16 plots) and codified attending to the species, stand origin (natural vs planted forest) and location as follow: PPNMA, P. pinaster natural (Málaga); PPPMA, P. pinaster planted (Málaga); PPNGR, P. pinaster natural (Granada); PPPGR, P. pinaster planted (Granada); PNNGR, P. nigra natural (Granada); PNPGR, P. nigra planted (Granada); PNNAL, P. nigra natural (Almería) and PNPAL, P. nigra planted (Almería). Plots were centered on a focal tree were georeferenced with a global satellite receiver with submeter precision (Leica Zeno 20 GIS, Leica Geosystems, Switzerland) (Table S1, Supplementary Material). Diameter at breast height (dbh, 1.3 m above ground level) (Masser BT Caliper; Lapland, Finland) and height (Vertex III hypsometer, Haglöf, Långsele, Sweden) in all trees with dbh ≥ 7.5 cm were measured at each plot. After that, a 5.1-mm increment borer was used to extract two cores from a minimum of 15 dominant trees in each plot at a height of 1.3 m perpendicular to the maximum slope (Table 1). After being air-dried, cores were glued to wooden supports and progressively sanded until the tree rings appeared [37]. A Lintab-TSAP measuring tool (Rinntech, Heidelberg, Germany) was used to measure sanded cores to the nearest 0.01 mm under the binoculars and visually cross-date them. COFECHA software was used to statistically verify the visual cross-dating, which ensures that each tree ring was correctly dated [38,39].

2.4. Processing Tree-Ring Width Data

Basal area increment (BAI) was obtained using tree-ring widths (TRW), and the mean BAI in the last 20 years (BAI20) was determined to assess recent growth trends. To assess climate-growth relationships we obtained ring-width indices by standardizing and detrending individual ring-width series using the dplR package [40]. Tree-ring indices at high-frequency variability were derived by fitting ring-width data to linear or negative exponential (when appropriate) functions. By fitting first-order autoregressive models, most of the first-order autocorrelation was then subtracted from these indexed series [37]. Residual mean series (chronologies) for each species and forest type were obtained by averaging the resulting series with bi-weight robust means. The characteristics of the tree-ring series were evaluated using dendrochronological statistics [37]: raw tree-ring width data mean and standard deviation (SD); the residual series’ mean sensitivity (MS); the residual series’ mean between-trees correlation (Rbar); the expressed population signal (EPS) of residual width series and the first-order autocorrelation of raw tree-ring width data (AC1). In climate-growth analyses, chronology segments with EPS greater than 0.85 were considered reliable.
Following Lloret et al. [41], we calculated three drought vulnerability indices considering the three observed drought episodes in 1995, 2005, and 2012. We chose three years as the pre- and post-drought periods to avoid overlapping between drought periods [29]. Then, resistance (CRT), resilience (CRS) and recovery (CRC) growth indices for each drought event were calculated as:
CRT = Dr/PreDr
CRS = PostDr/Dr
CRC = PostDr/PreDr
where Dr corresponds to BAI during the drought year (1995, 2005 and 2012), and the PreDr and PostDr correspond to the average BAI of the 3 years pre and post the drought episode.

2.5. Isotopic Analyses

One additional core beside each tree-ring sampling core described above was extracted for δ13C and δ2H stable isotope analysis, and selected tree rings were manually dissected with a scalpel under a binocular. Samples corresponded to 3 years before and after droughts, and to the respective drought years (1995, 2005, and 2012). The wood for each period was subsequently mixed and milled in a mixer ball mill (Retsch® Model MM 400, Retsch GmbH, Haan, Germany). The amount of ground wood samples ranged from 50 to 300 mg.
Following Jiménez-Morillo et al. [42], whole wood samples were analyzed using elemental analysis/isotope ratio mass spectrometry (EA/IRMS), as well as through direct pyrolysis compound specific isotope analysis (Py-CSIA) [43,44]. The EA/IRMS system consisted of a Flash IRMS EA/HT analyzer from Thermo Scientific, Bremen, Germany, coupled to a Delta V Advantage isotope ratio mass spectrometer via a ConFlo IV continuous flow open split interface from Thermo Scientific. These reactors were used to measure C, N, and S in combustion and H and O in pyrolysis, respectively. The samples (c 0.5 mg) were weighed in metallic cups made of tin for the C and silver for the H analyses (IVA Analysentechnik GmbH & Co. KG, Meerbusch, Germany). Suitable adjustment guidelines from the Worldwide Nuclear Energy Organization (IAEA) (https://nucleus.iaea.org, accessed on 3 May 2022) were ready in a similar way and set inside clusters of tests. For C, the standard materials used were cellulose (IAEA-CH-3), sucrose (IAEA-CH-6) and caffeine (IAEA-600). For H, polyethylene (IAEA-CH-7) and oil (IAEA-NBS-22) were used.
A double-shot pyrolyzer (model 3030D; Frontier Laboratories Ltd., Fukushima, Japan) was used for the Py-CSIA of H stable isotopes attached to a gas chromatograph (Trace GC Ultra; Frontier Laboratories Ltd., Fukushima, Japan) and an IsoLinkTM IRMS System (Thermo Fisher Scientific, Bremen, Germany). Wood samples (c 1.5 mg) were weighed in pyrolysis cups made of deactivated stainless steel (Eco-Cup; Frontier Laboratories Ltd., Fukushima, Japan) and injected directly into the GC for chromatographic separation in a preheated furnace at 400 °C for one minute. An ultra-inert fused silica (5% phenyl-methylpolysiloxane) capillary column with a film thickness of 30 m × 250 μm × 0.25 μm was used in the GC. After remaining at 50 °C for one minute, oven temperature was raised to 100 °C at 30 °C min−1, moved from 100 °C to 300 °C at 10 °C min−1, and finally remained at 300 °C for ten minutes. He served as the carrier gas at a flow rate of 1 mL min−1. The IsoLink interface, equipped with a for thermal conversion (TC) micro-reactor set at 1420 °C, was used to gasify the individual compounds that were eluted from the GC. The ConFlo IV universal interface was used to measure the stable H isotope composition (δ2H) of individual compounds in a Delta V Advantage isotope ratio mass spectrometer. By comparing and matching mass spectra produced by a conventional Py-GC/MS analysis with the Py-CSIA chromatograms produced under the same pyrolysis and chromatographic conditions, the identification of chromatographic compounds was inferred. The ISODAT 3.0 software (Thermo Scientific, Bremen, Germany) was used to calculate background subtractions and isotope abundances. The n-alkane mixture C4 (5 dissolved n-alkanes C-17 to C-25 in equal concentrations: Indiana University, Bloomington, IN, USA) served as the reference material for an evaluation and correction of the Py-CSIA’s precision and measurement accuracy. δ2H values relative to the VSMOW scale [45] were calculated using the linear correlation between the measured and standard isotope values from the C4 mixture [45]. Each analytical run was preceded and followed by daily analyses of the reference n-alkane mixture. With a linear regression (R2 ≥0.99 in all cases), standard and measured isotopic values fitted well along a straight line.
Stable isotope abundances in relation to the international standards Vienna Pee Dee Belemnite (VPDB) and Vienna Standard Mean Ocean Water (VSMOW) were reported in the delta (δ) notation (i.e., δ13C and δ2H) [46]. δ13C and δ2H typically had analytical standard deviations of less than ±0.1 and 1.0‰, respectively and were determined by analyzing duplicate samples. The iWUE was calculated following Farquhar et al. [47] as:
iWUE = Ca [1 − (Ci/Ca)] 0.625 = A/gs
where Ca is the atmospheric CO2 concentration, Ci is the CO2 concentration in the sub-stomatal cavity of leaves, and 0.625 is the relation among the conductance of H2O compared to the conductance of CO2. A is the molar flux of CO2 into the plant from the atmosphere and g is the conductance of the boundary layer and stomata1 pores to the diffusion of CO2. The Ci was obtained using δ13C values in wood and atmospheric CO2 as described in Belmecheri and Lavergne [48].

2.6. Statistical Analysis

Student’s t test was used to compare growth and drought vulnerability indices for each species across forest types, and Mann–Whitney U-tests were used to compare isotope data for independent samples (p ≤ 0.05). δ2H and δ13C data were fitted using simple linear regression to evaluate the effect of type of forests and drought on isotopic response. The coefficient of determination (R2) was used to evaluate the degree of correlation between the two variables. Concentrations of δ2H in tree-ring wood were transformed using Z-score standardization [49]. Pearson’s correlations were used to quantify the growth response to climate (monthly, seasonal, and annual mean temperature data). From the previous June to September of the year of tree ring formation, the correlation of a series of ring-width indices and climatic variables (mean temperature, total precipitation) were assessed, considering the common period of 1975–2013.
R software was used for all statistical analyses [50]. The Student’s t and Mann–Whitney U-tests were calculated using the lme4 package [51]. Bootstrapped climate-growth correlations were calculated using the treeclim R package [52].

3. Results

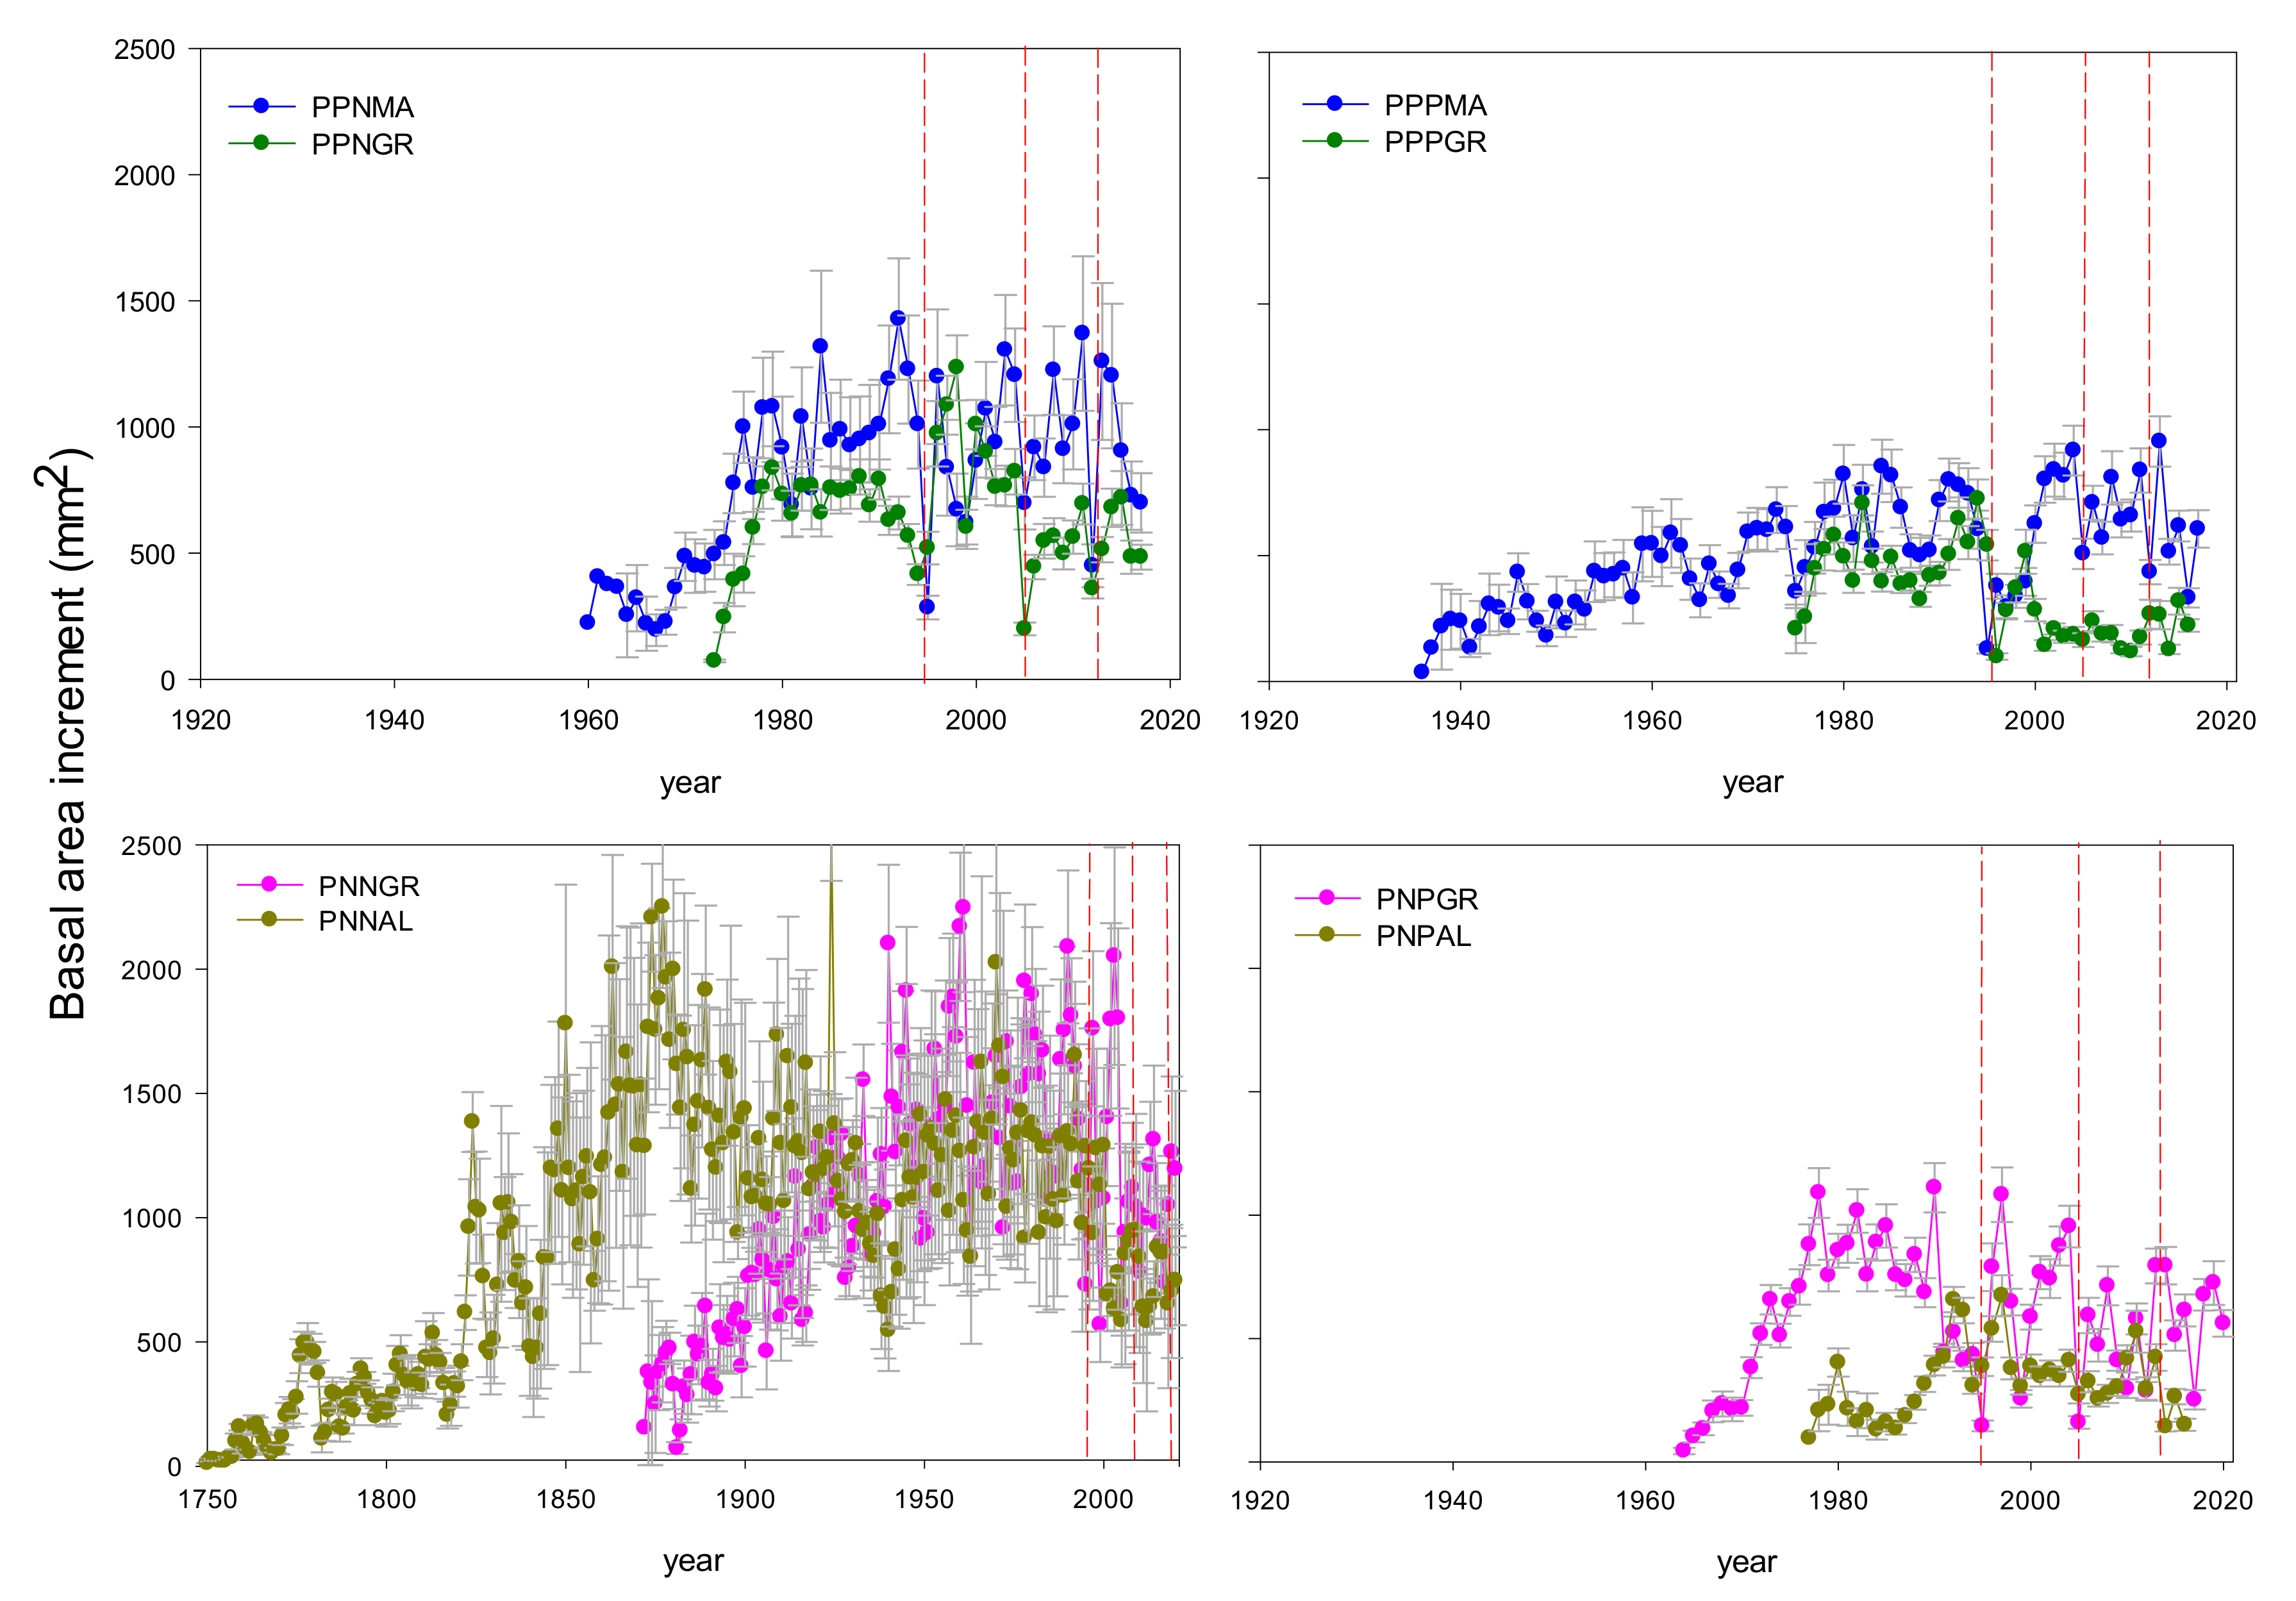
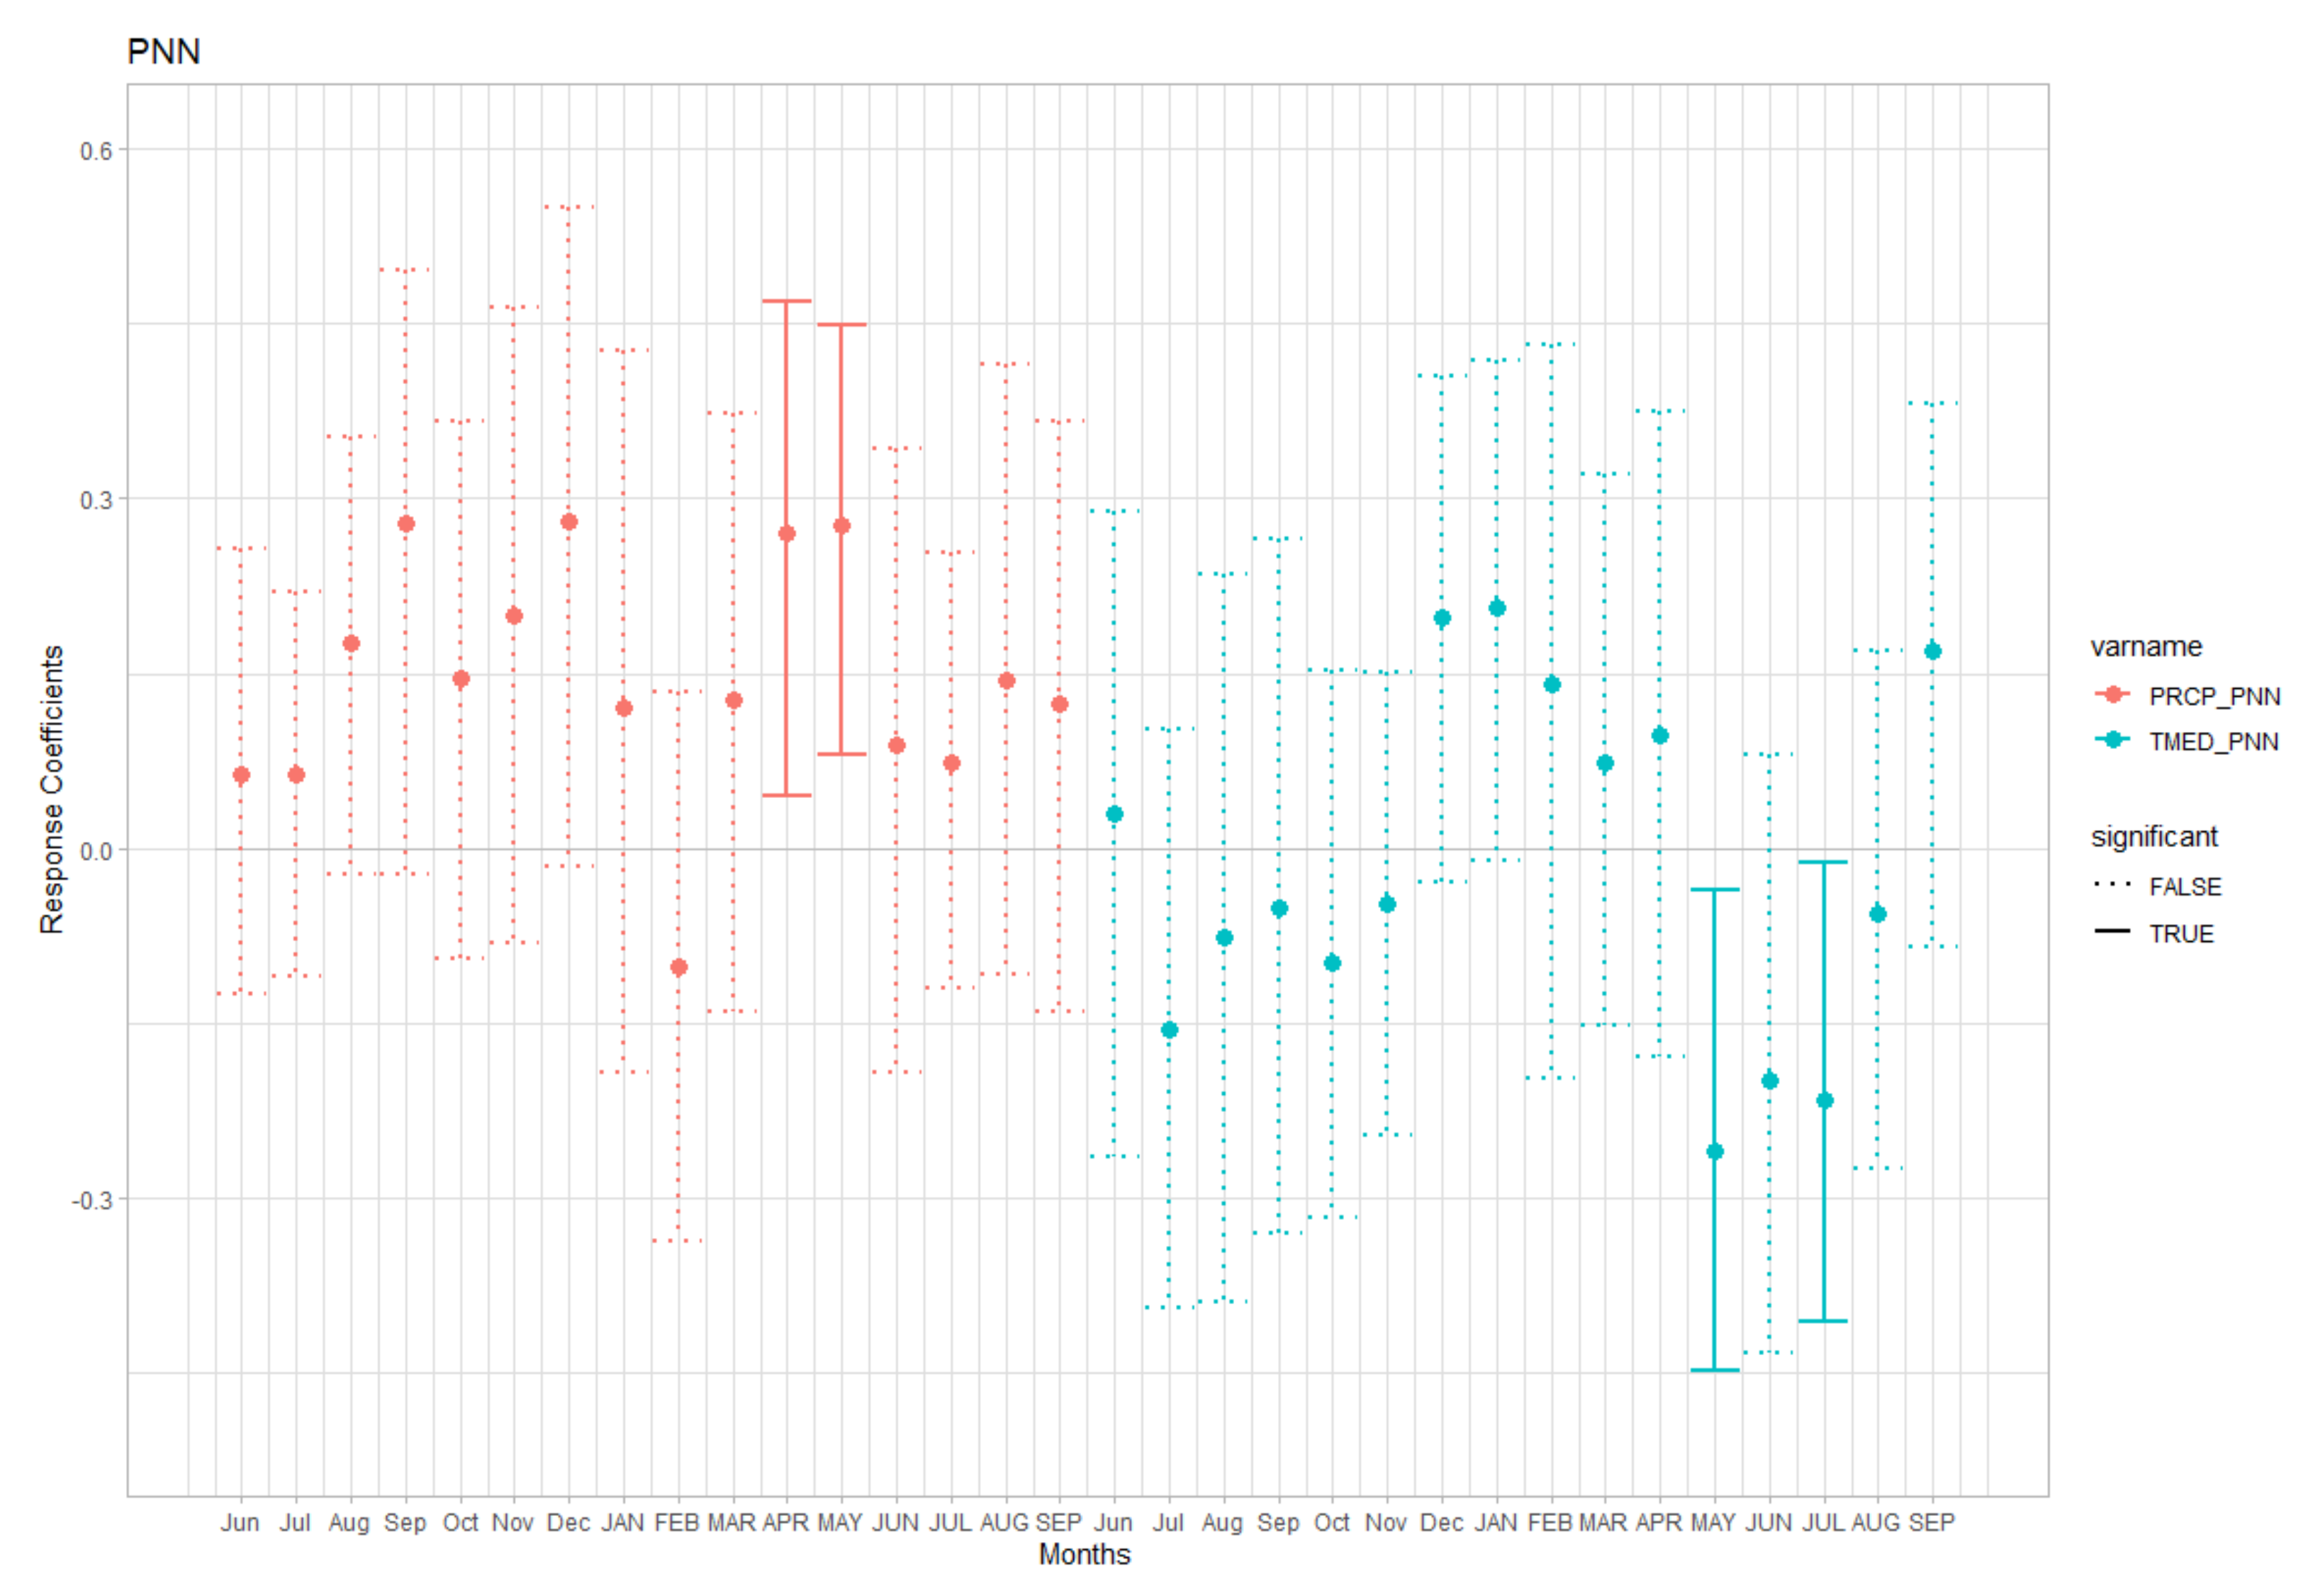
3.1. Growth Patterns and Climate-Growth Relationships

The recent growth (BAI20) was higher in natural than in planted stands (Figure 1, Table 2). Pinus nigra showed significantly higher BAI20 values on natural forests (7.60–11.65 cm2 year−1, PNNA and PNNGR sites, respectively) than in plantations (3.43–5.89 cm2 year−1, PNPA and PNPGR sites, respectively), and higher than P. pinaster, which also showed higher growth in natural (6.42–9.41 cm2 year−1, PPNGR and PPNMA sites, respectively) than in planted (2.28–6.44 cm2 year−1, PPPGR and PPPMA sites, respectively) forests.
In P. pinaster, wet conditions in the prior summer and warmer conditions in the winter enhanced growth in natural forests (Figure 2, Figure S3 Supplementary Material). On the other hand, planted forests seemed to be less sensitive to climate, and tree growth benefited from precipitations in the previous October and current March. However, dry conditions in previous summer (July) and current autumn (September) had a negative effect on growth. In the case of P. nigra, growth positively correlated with April–May precipitation but negatively with temperature over May and July (Figure 2, Figure S3 Supplementary Material). Pinus nigra showed a negative to earlier spring (May) and summer (July) temperatures.

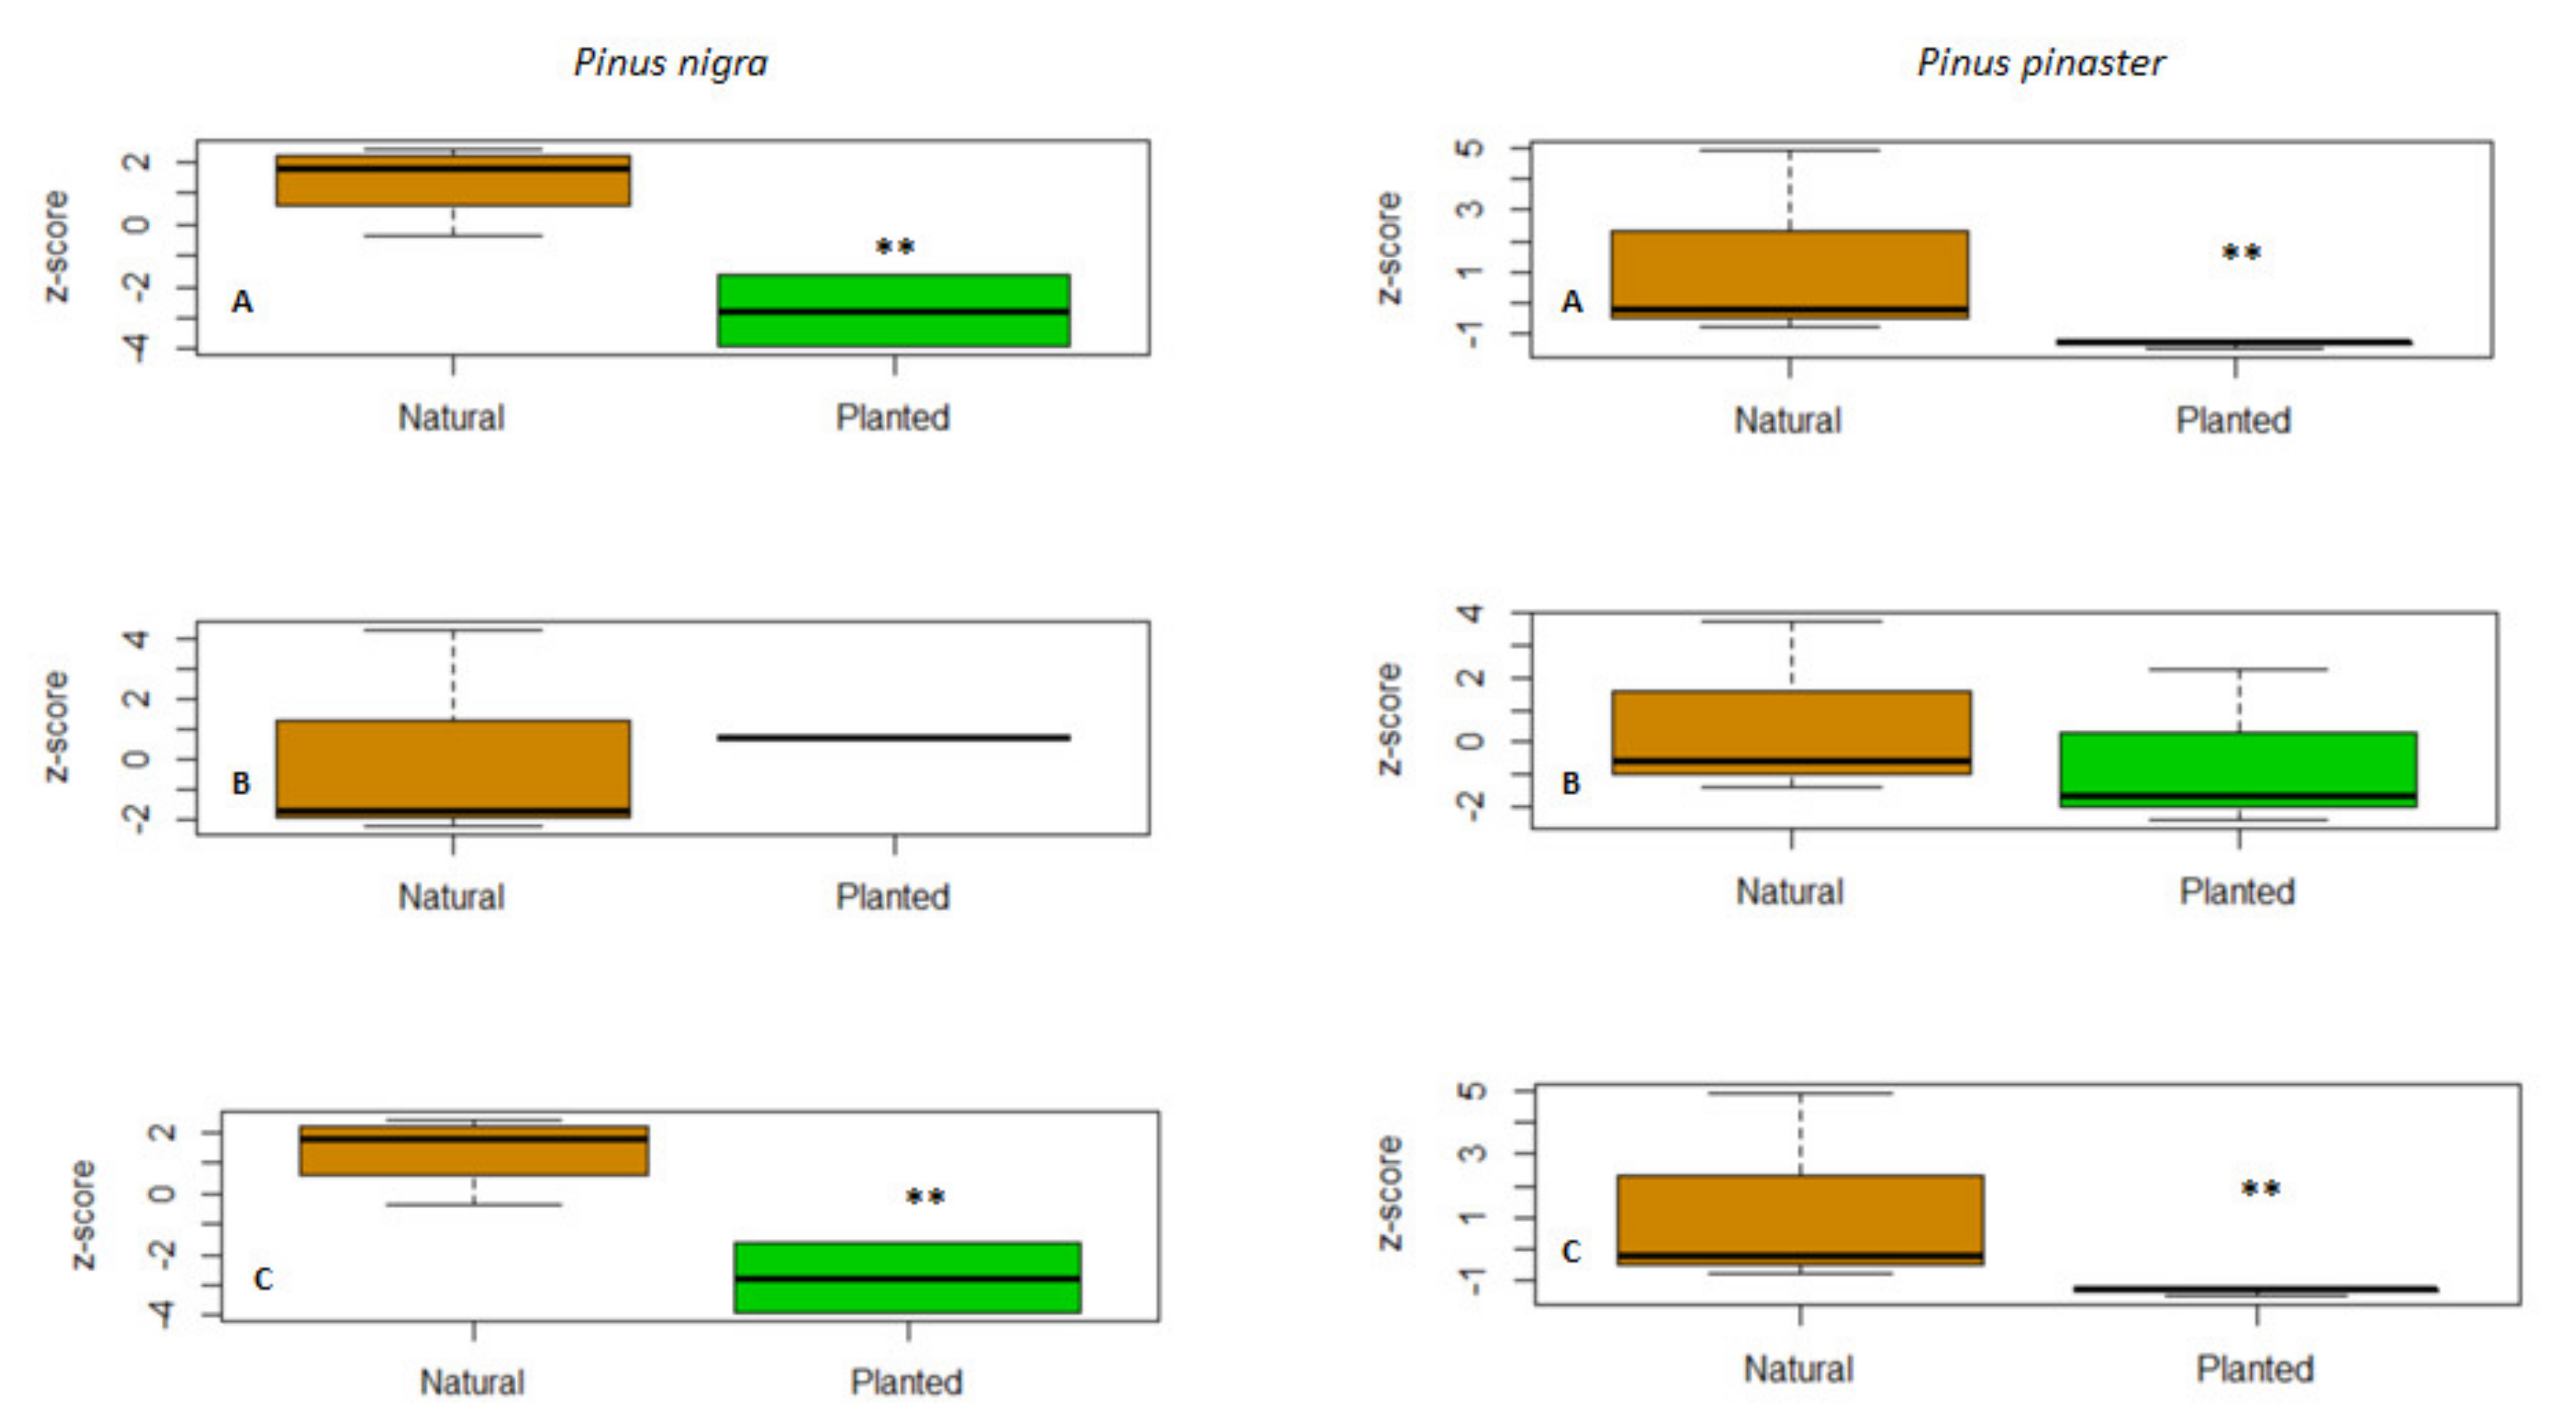
3.2. Growth Resilience Indices

The stand type and species interacted significantly, affecting the resistance (CRT), resilience (CRS), and recovery (CRC) indices (Figure 3, Table S1 Supplementary Material). In P. pinaster, CRT and CRS indices were higher for planted than natural forests in 1995 and 2012 droughts. However, CRC was significantly higher for natural P. pinaster forests. On the other hand, P. nigra CRT and CRS indices showed little differences between natural and planted stands, but CRC indices were much higher in planted than in natural forests for all drought events considered. A convergent negative trend with time was found for the CRC indices in both pine species (Figure 3).

3.3. Stable Isotopes (δ13C, δ2H)

Overall, the observed δ13C values ranged between −23.79 to −25.65‰, being significantly lower in natural as compared to planted forests in both P. nigra (p = 0.026) and P. pinaster (p = 0.009) species in the driest locations (Almería and Granada, respectively, Table 2). Therefore, iWUE was significantly higher in planted than in natural forests (Table 2). Pinus nigra showed significant differences for δ2H between natural and planted forest at both locations (Granada, p = 0.041; Almería, p = 0.015), with the higher values occurring in planted stands (Table 3). On the other hand, P. pinaster only showed significant differences for δ2H between natural and planted forest at Málaga location (p = 0.038, Table 2).
While no linear relation was found between δ13C and δ2H in natural stands, a positive linear correlation was observed for planted stands for both species (Figure 4). Finally, concentrations of δ2H on guaiacol and oleic acid in both species were significantly (p < 0.01) higher in natural than in planted forests (Figure 5, Table S2 Supplementary Material).

4. Discussion

This study revealed different aspects of the link between tree growth and functioning in determining time-scales drought responses across two representative Mediterranean pine species, and along an aridity gradient. Our results provide a step forward in the use of stable isotope analyses to better understand the multi scalar nature of droughts, shading lights into the role of stand type (i.e., natural forests versus plantations) on the resilience of pine forests to droughts across varying time scales.

4.1. Growth Patterns and Responses to Climate in Planted and Natural Forests

According to our hypothesis, forest type and aridity determined differential growth rates expressed as BAI20, with the highest growth rates in natural forests of P. nigra. This is consistent with other findings regarding Mediterranean pine stands, which demonstrated that trees in natural forests have higher growth in comparison to dense, homogeneous plantations [53]. The BAI20 data revealed that planted trees reduce growth at early stages than those in natural forests, suggesting that forest type is a central endogenous property influencing radial growth [54]. However, this is not straight forward since dryness conditions add complexity for P. nigra when a lack of water during the spring growing season largely determine growth [55].
The BAI20 obtained in P. pinaster was lower on planted forests, where even- and small-sized trees were dominant. On the other hand, the higher growth observed in natural P. pinaster stands could have been explained by their lower stand density and more complex structure, which allow access to limiting resources including light and water. In fact, water availability might explain to some extent the observed differences between P. pinaster and P. nigra, being the former a very drought-sensitive species [55]. Valeriano et al. [56] observed a reduction in P. pinaster growth in pure patches as compared with other pine species usually living in dense and multi-strata forests. Thus, P. pinaster plantations could not benefit from the free growing space as efficiently as other pine species, which make them particularly vulnerable to drought-induced dieback [57].
Spring precipitation enhanced growth of P. nigra for both forest types, whereas P. pinaster growth mainly responded to wet prior-winter conditions in natural forests. According to previous tree-ring studies for these two species, growth mainly depends on photo-assimilates formed during the previous growing season [5,29,31,58]. Therefore, tree growth of natural forests showed higher sensitivity to climatic variables, and this response seems to depend on seasonally varying physiological responses related to the synthesis and storage of non-structural carbohydrates [59].

4.2. Improved Growth Resilience in Natural Forests

During the three studied yearly droughts (1995, 2005, and 2012), natural P. nigra stands reached higher values in the recovery (CRC) index, but lower values for both resistance (CRT) and resilience (CRS) indices than planted stands. Contradictory planted P. pinaster stands had the highest recovery (CRC) indices than natural stands. Despite this contrasting pattern, the overall decreased trend of CRC values over the three periods indicated an accumulative effect of drought stress on the ability of these stands to respond to successive droughts. This is consistent with the observed disproportionate mortality of P. pinaster plantations with respect to natural forests [29]. On the other hand, the lower resistance of natural P. nigra stands was consistent with the well-documented size-related decline of growth of this species [34]. Nevertheless, we found a similar response for CRt and CRs indexes between planted and natural stands for both species, which might indicate a lower sensitivity to drought. Another cause to consider is the fact that they might reflect other spatial variance such as mix of microsite quality or other inherent factors, e.g., physiological state and genetics, which require further examination.
These facts suggest that drought stress and climate warming are selectively affecting growth, vitality, and mortality rates of planted pine stands in Mediterranean areas and in other drought-prone areas [60]. The use of genetic provenances that are not well-suited to withstand droughts and competition associated with high tree density and lack of appropriate management (e.g., thinning) may contribute to this vulnerability. Vulnerability to drought may also indicate that long-term effect of environmental factors, such as aridification, which have a negative impact on tree growth and vigor, or that repeated drought events over time have resulted in sudden mortality events following extremely dry and warm years. Due to long-term reductions in growth as the climate becomes warmer and drier, we observed a convergence of resilience growth indices in both natural and planted stands [55,57].

4.3. Forest Type and Drought Effects on Isotopic Signals (δ13C and δ2H)

We found that δ13C and δ2H in tree-ring wood were dependable proxies of the responses of P. pinaster and P. nigra between natural and planted forests. Derived iWUE from tree-ring wood δ13C showed higher values in planted forests than natural stands suggesting the former are more sensitive to drought than natural forests. Previous research has shown the effect of stand structure in iWUE in pine species [61]. Increased dryness conditions lead to a partial closure of stomata to reduce water loss, which raises δ13C and iWUE [47]. Clearly, whether the structure itself might modifies radiative budgets (and hence degree of dryness) or it plays an important role in regulating the carbon and water economy of the tree remains controversial [62,63]. Therefore, the complex interactions between structural variables (i.e., tree size, stand density) and environmental conditions (air temperature, VPD, relative humidity, soil moisture) influencing iWUE require further studies. In dry Mediterranean areas, drought leads growth decline and dieback which can slow down the increase in iWUE [64]. We argue that stand type involves key spatial covariates such as rooting depth, which might shed lights into the role of stand types on physiological responses. Some pieces of evidence have shown that Mediterranean pine species exhibiting a more “conservative” water use strategy (high iWUE) are associated with rooting depth, which allows trees to extract soil water from deeper sources during the peak growing season and summer [27]. In natural forests, trees may access deeper groundwater sources than trees from planted stands, which tend to extract it from upper soil layers during the dry summer season probably because they developed less efficient and shallow roots [65].
It has been common practice to estimate and interpret changes in water availability in forest plantation based on δ2H measurements [66]. Our results from δ2H showed that planted forests had significantly greater values than natural ones. It may be explained by the fact that planted trees under water stress could use a greater proportion of stored carbohydrates that are δ2H enriched [67,68]. This is consistent with our findings, reduced metabolic and growth rates could have explained the observed increased δ2H concentration in wood phenolic compounds in response to droughts. Additionally, lower δ2H values in natural forests might indicate access to water from deeper layers, while plantations acquire it more superficial layers [69]. The observed relationship between δ13C and δ2H were consistent across species and forest types. In planted forests, both variables covaried positively, and this response may depend on earlier stomatal closure in these drought-conditions stands and lower water availability closely related to iWUE (δ13C and δ2H enrichment [70,71]).
Higher concentrations of δ2H in phenolic wood compounds found in natural forests may correspond to a higher accumulation of these chemical elements during the period of shoot growth due to different metabolic processes [72]. During dry periods, the decrease of δ2H on wood compounds in pine plantations may alter cell wall integrity and synthesis making these trees more vulnerable to xylem embolism. Trees from natural forests could be more adapted to low precipitation during the growing season by increasing the activity of cellulosic compounds, retaining higher turgor levels during cell enlargement at low water potentials thus forming more tracheids with thicker cell walls [73].

4.4. Implications for Forest Management

Interactions between natural and planted forests over large geographic areas will be modulated by accessibility to water sources [74]. In Mediterranean mountains, rainfall events influence stand adaptation in terms of tree water use strategies and short-term water sources [75]. Natural and planted forests of P. nigra and P. pinaster showed different degrees of environmental adaptability by exhibiting distinguish growth and water use patterns. Natural forests will benefit from a better adaptation of water use by accessing to relatively constant deep soil water.
By influencing their water status, proper forest management of pine plantations can make trees more able to adapt to changes in precipitation patterns [69]. Understanding how planted forests use shallow and deep soil water in response to precipitation pulses may help foresters to design management schemes to withstand extreme drought, especially dry areas where seasonal precipitation is highly variable, and temperatures are increasing. Thinning, which reduces resource competition for the remaining trees, may provide an adaptation strategy for tree survival in water-constrained environments due to its long-term viability [12,76]. Nonetheless, pine planted forests would, in general, depend more on variable surface soil water enhanced by precipitation, but the connection between improving soil loss and decreasing water use utilization coming about because of thinning should be investigated.

5. Conclusions

The integration of dendrochronological and isotopic data allowed us to obtain new insights on the differential responses to drought of natural and planted P. pinaster and P. nigra forests. We found that forest type had significant influences on growth, drought response and stable isotope values in wood (δ13C, δ2H). Our findings showed that the relationships between wood δ13C and δ2H is a good proxy of drought sensitivity, indicating its applicability for silvicultural studies. However, changes in structural and chemical composition of wood might affect such relationships. Our results revealed that δ2H concentration in wood phenolic compounds (guaiacol, and oleic acid) are better constraints of drought responses. Planted forests show lower growth rates, exhibiting greater sensitivity to water shortage and mostly took water from more superficial layers, compared to natural forests. Stable isotope techniques in wood will allow to predict the effects of climate and land use changes on other planted forests in seasonally dry regions.

Supplementary Materials

The following supporting information can be downloaded at: https://www.mdpi.com/article/10.3390/f14030573/s1, Table S1. Significant differences (p < 0.05) of resistance (CRT), recovery (CRC), and resilience (CRS) indexes for Pinus pinaster and P. nigra natural and planted stands during the extreme dry years (1995, 2005 and 2012). Sites: PPNMA, P. pinaster natural (Málaga); PPPMA, P. pinaster planted (Málaga); PPNGR, P. pinaster natural (Granada); PPPGR, P. pinaster planted (Granada); PNNGR, P. nigra natural (Granada); PNPGR, P. nigra planted (Granada); PNNAL, P. nigra natural (Almería) and PNPAL, P. nigra planted (Almería). Figure S1. Distribution of Pinus pinaster (PP) and Pinus nigra (PN) natural (PPN and PNN) and planted (PNP and PPP) plots in the Western Mediterranean Basin and along an aridity gradient in Andalusia, southeastern Spain. Sites’ abbreviations: PPNMA, P. pinaster natural (Málaga); PPPMA, P. pinaster planted (Málaga); PPNGR, P. pinaster natural (Granada); PPPGR, P. pinaster planted (Granada); PNNGR, P. nigra natural (Granada); PNPGR, P. nigra planted (Granada); PNNAL, P. nigra natural (Almería) and PNPAL, P. nigra planted (Almería). Figure S2. Bootstrapped response function analysis relating tree-ring growth to monthly mean temperature (blue bars) and precipitation (red bars) from previous June to current September Abbreviations: Site, PPNMA, Pinus pinaster natural (Málaga); PPPMA, P. pinaster planted (Málaga); PPNGR, P. pinaster natural (Granada); PPPGR, P. pinaster planted (Granada); PNNGR, P. nigra natural (Granada); PNPGR, P. nigra planted (Granada); PNNAL, P. nigra natural (Almería) and PNPAL, P. nigra planted (Almería). Abbreviated previous-year months are given in lowercase letters, current year ones in uppercase letters. Coefficients significantly correlated correspond to p < 0.05 (continuous lines).

Author Contributions

Conceptualization, R.M.N.-C. and A.M.C.-V.; methodology, R.M.N.-C., A.M.C.-V., J.A.G.-P., J.J.C.; formal analysis, R.M.N.-C., A.M.C.-V., J.A.G.-P., Ó.P.-P.; investigation, R.M.N.-C., A.M.C.-V., J.J.C., Ó.P.-P., F.J.R.-G.; resources, R.M.N.-C.; data curation, A.M.C.-V., R.M.N.-C.; writing—original draft preparation, R.M.N.-C., A.M.C.-V., J.J.C., Ó.P.-P.; writing—review and editing, all authors; supervision, R.M.N.-C.; project administration, R.M.N.-C., A.M.C.-V.; funding acquisition, R.M.N.-C. All authors have read and agreed to the published version of the manuscript.

Funding

This research was funded by SILVADAPT.NET (RED2018-102719-T), EVIDENCE (Ref: 2822/2021) and REMEDIO (PID2021-128463OB-I00).

Data Availability Statement

Data are accessible by contacting corresponding author.

Acknowledgments

We acknowledge support given by SILVADAPT.NET (RED2018-102719-T), EVIDENCE (Ref: 2822/2021) and REMEDIO (PID2021-128463OB-I00). We also acknowledge the financial and institutional support of the University of Cordoba-Campus de Excelencia CEIA3. The authors acknowledge and thank the support of the Mediterranean Forest Global Change Observatory through the project “Scientific Infrastructures for Global Change Monitoring and Adaptation in Andalusia (INDALO)—LIFEWATCH-2019-04-AMA-01”, co-financed with FEDER funds corresponding to the Pluriregional Operational Programme of Spain 2014-2020. We thank the “Consejería de Medioambiente y Ordenación del Territorio” (Junta de Andalucía), the “RED SEDA NETWORK” (Junta de Andalucía), for providing field work and data support.

Conflicts of Interest

The authors declare no conflict of interest.

References

  1. Allen, C.D.; Breshears, D.D.; McDowell, N.G. On underestimation of global vulnerability to tree mortality and forest die-off from hotter drought in the Anthropocene. Ecosphere 2015, 6, 1–55. [Google Scholar] [CrossRef]
  2. Camarero, J.J.; Gazol, A.; Sangüesa-Barreda, G.; Oliva, J.; Vicente-Serrano, S.M. To die or not to die: Early-warning signals of dieback in response to a severe drought. J. Ecol. 2015, 103, 44–57. [Google Scholar] [CrossRef] [Green Version]
  3. Giorgi, F.; Lionello, P. Climate change projections for the Mediterranean region. Glob. Planet. Chang. 2008, 63, 90–104. [Google Scholar] [CrossRef]
  4. Vicente-Serrano, S.M.; Gouveia, C.; Camarero, J.J.; Beguería, S.; Trigo, R.; Lopez-Moreno, J.I.; Azorin-Molina, C.; Pasho, E.; Lorenzo-Lacruz, J.; Revuelto, J.; et al. Response of vegetation to drought time-scales across global land biomes. Proc. Natl. Acad. Sci. USA 2013, 110, 52–57. [Google Scholar] [CrossRef] [Green Version]
  5. Sánchez-Salguero, R.; Navarro-Cerrillo, R.M.; Camarero, J.J.; Fernández-Cancio, A. Selective drought-induced decline of pine species in southeastern Spain. Clim. Chang. 2012, 113, 767–785. [Google Scholar] [CrossRef]
  6. Rodriguez-Vallejo, C.; Navarro-Cerrillo, R.M. Contrasting Response to Drought and Climate of Planted and Natural Pinus pinaster Aiton Forests in Southern Spain. Forests 2019, 10, 603. [Google Scholar] [CrossRef] [Green Version]
  7. MAGRAMA. La Restauración forestall en España: 75 años de una Ilusión; Ministerio de Agricultura y Pesca, Alimentación y Medio Ambiente Secretaría General Técnica Centro de Publicaciones: Madrid, Spain, 2017. [Google Scholar]
  8. McDowell, N.; Pockman, W.T.; Allen, C.D.; Breshears, D.D.; Cobb, N.; Kolb, T.; Plaut, J.; Sperry, J.; West, A.; Williams, D.G.; et al. Mechanisms of plant survival and mortality during drought: Why do some plants survive while others succumb to drought? New Phytol. 2008, 178, 719–739. [Google Scholar] [CrossRef] [PubMed]
  9. Yi, C.; Hendrey, G.; Niu, S.; McDowell, N.; Allen, C.D. Tree mortality in a warming world: Causes, patterns, and implications. Environ. Res. Lett. 2022, 17, 030201. [Google Scholar] [CrossRef]
  10. Rodriguez-Vallejo, C.; Navarro-Cerrillo, R.M.; Manzanedo, R.D.; Rodriguez, G.P.; Gazol, A.; Camarero, J.J. High resilience, but low viability, of pine plantations in the face of a shift towards a drier climate. For. Ecol. Manag. 2021, 479, 118537. [Google Scholar] [CrossRef]
  11. Sánchez-Salguero, R.; Navarro, R.M.; Camarero, J.J.; Fernández-Cancio, A. Drought-induced growth decline of Aleppo and maritime pine forests in south-eastern Spain. For. Syst. 2010, 19, 458. [Google Scholar] [CrossRef]
  12. Navarro-Cerrillo, R.M.; Sánchez-Salguero, R.; Rodriguez, C.; Lazo, J.D.; Moreno-Rojas, J.M.; Palacios-Rodriguez, G.; Camarero, J.J. Is thinning an alternative when trees could die in response to drought? The case of planted Pinus nigra and P. Sylvestris stands in southern Spain. For. Ecol. Manag. 2019, 433, 313–324. [Google Scholar] [CrossRef]
  13. Sánchez-Salguero, R.; Camarero, J.J.; Dobbertin, M.; Fernández-Cancio, A.; Vilà-Cabrera, A.; Manzanedo, R.D.; Zavala, M.A.; Navarro-Cerrillo, R.M. Contrasting vulnerability and resilience to drought-induced decline of densely planted vs. natural rear-edge Pinus nigra forests. For. Ecol. Manag. 2013, 310, 956–967. [Google Scholar] [CrossRef]
  14. Camarero, J.J. The drought-dieback-death conundrum in trees and forests. Plant Ecol. Divers. 2021, 14, 1–12. [Google Scholar] [CrossRef]
  15. Gazol, A.; Camarero, J.J.; Sánchez-Salguero, R.; Zavala, M.A.; Serra-Maluquer, X.; Gutiérrez, E.; de Luis, M.; Sangüesa-Barreda, G.; Novak, K.; Rozas, V.; et al. Tree growth response to drought partially explains regional-scale growth and mortality patterns in Iberian forests. Ecol. Appl. 2022, 32, e2589. [Google Scholar] [CrossRef]
  16. Gessler, A.; Ferrio, J.P.; Hommel, R.; Treydte, K.; Werner, R.A.; Monson, R.K. Stable isotopes in tree rings: Towards a mechanistic understanding of isotope fractionation and mixing processes from the leaves to the wood. Tree Physiol. 2014, 34, 796–818. [Google Scholar] [CrossRef] [PubMed] [Green Version]
  17. Gessler, A.; Cailleret, M.; Joseph, J.; Schönbeck, L.; Schaub, M.; Lehmann, M.; Treydte, K.; Rigling, A.; Timofeeva, G.; Saurer, M. Drought induced tree mortality-a tree-ring isotope based conceptual model to assess mechanisms and predispositions. New Phytol. 2018, 219, 485–490. [Google Scholar] [CrossRef] [PubMed]
  18. Cherubini, P.; Battipaglia, G.; Innes, J.L. Tree vitality and forest health: Can tree-ring stable isotopes be used as indicators? Curr. For. Rep. 2021, 7, 69–80. [Google Scholar] [CrossRef]
  19. Salazar-Tortosa, D.; Castro, J.; de Casas, R.R.; Viñegla, B.; Sánchez-Cañete, E.P.; Villar-Salvador, P. Gas exchange at whole plant level shows that a less conservative water use is linked to a higher performance in three ecologically distinct pine species. Environ. Res. Lett. 2018, 13, 045004. [Google Scholar] [CrossRef]
  20. Maseyk, K.; Hemming, D.; Angert, A.; Leavitt, S.W.; Yakir, D. Increase in water-use efficiency and underlying processes in pine forests across a precipitation gradient in the dry Mediterranean region over the past 30 years. Oecologia 2011, 167, 573–585. [Google Scholar] [CrossRef]
  21. Marshall, J.D.; Monserud, R.A. Co-occurring species differ in tree-ring δ18O trends. Tree Physiol. 2006, 26, 1055–1066. [Google Scholar] [CrossRef]
  22. Shestakova, T.A.; Camarero, J.J.; Ferrio, J.P.; Knorre, A.A.; Gutiérrez, E.; Voltas, J. Increasing drought effects on five european pines modulate δ13C-growth coupling along a Mediterranean altitudinal gradient. Funct. Ecol. 2017, 31, 1359–1370. [Google Scholar] [CrossRef] [Green Version]
  23. Battipaglia, G.; Cherubini, P. Stable Isotopes in Tree Rings of Mediterranean Forests. In Stable Isotopes in Tree Rings; Siegwolf, R.T.W., Brooks, J.R., Roden, J., Saurer, M., Eds.; Tree Physiology 8; Springer: Cham, Switzerland, 2022; pp. 605–629. [Google Scholar] [CrossRef]
  24. De La Serrana, R.G.; Vilagrosa, A.; Alloza, J.A. Pine mortality in southeast Spain after an extreme dry and warm year: Interactions among drought stress, carbohydrates and bark beetle attack. Trees 2015, 29, 1791–1804. [Google Scholar] [CrossRef]
  25. Choat, B.; Brodribb, T.J.; Brodersen, C.R.; Duursma, R.A.; López, R.; Medlyn, B.E. Triggers of tree mortality under drought. Nature 2018, 558, 531–539. [Google Scholar] [CrossRef] [PubMed]
  26. Linares, J.-C.; Delgado-Huertas, A.; Camarero, J.J.; Merino, J.; Carreira, J.A. Competition and drought limit the response of water-use efficiency to rising atmospheric carbon dioxide in the Mediterranean fir Abies pinsapo. Oecologia 2009, 161, 611–624. [Google Scholar] [CrossRef]
  27. Moreno-Gutiérrez, C.; Battipaglia, G.; Cherubini, P.; Saurer, M.; Nicolás, E.; Contreras, S.; Querejeta, J.I. Stand structure modulates the long-term vulnerability of Pinus halepensis to climatic drought in a semiarid Mediterranean ecosystem. Plant Cell Environ. 2012, 35, 1026–1039. [Google Scholar] [CrossRef] [PubMed]
  28. Kannenberg, S.A.; Cabon, A.; Babst, F.; Belmecheri, S.; Delpierre, N.; Guerrieri, R.; Maxwell, J.T.; Meinzer, F.C.; Moore, D.J.; Pappas, C.; et al. Drought-induced decoupling between carbon uptake and tree growth impacts forest carbon turnover time. Agric. For. Meteorol. 2022, 322, 108996. [Google Scholar] [CrossRef]
  29. Navarro-Cerrillo, R.M.; Rodriguez-Vallejo, C.; Silveiro, E.; Hortal, A.; Palacios-Rodríguez, G.; Duque-Lazo, J.; Camarero, J.J. Cumulative Drought Stress Leads to a Loss of Growth Resilience and Explains Higher Mortality in Planted than in Naturally Regenerated Pinus pinaster Stands. Forests 2018, 9, 358. [Google Scholar] [CrossRef] [Green Version]
  30. Bogino, S.M.; Bravo, F. Growth response of Pinus pinaster Ait. to climatic variables in central Spanish forests. Ann. For. Sci. 2008, 65, 506. [Google Scholar] [CrossRef] [Green Version]
  31. Caminero, L.; Génova, M.; Camarero, J.J.; Sánchez-Salguero, R. Growth responses to climate and drought at the southernmost European limit of Mediterranean Pinus pinaster forests. Dendrochronologia 2018, 48, 20–29. [Google Scholar] [CrossRef]
  32. Navarro-Cerrillo, R.; Sánchez-Salguero, R.; Herrera, R.; Ruiz, C.C.; Moreno-Rojas, J.; Manzanedo, R.; López-Quintanilla, J. Contrasting growth and water use efficiency after thinning in mixed Abies pinsapo-Pinus pinaster-Pinus sylvestris forests. J. For. Sci. 2016, 62, 53–64. [Google Scholar] [CrossRef] [Green Version]
  33. USDA Soil Taxonomy: A Basic System of Soil Classification for Making and Interpreting Soil Surveys, 2nd ed.; Soil Survey Staff; Agr. Handbook 436; USDA-NRCS: Washington, DC, USA, 1999; 869p.
  34. Lucas-Borja, M.E.; Bose, A.K.; Andivia, E.; Candel-Pérez, D.; Plaza-Álvarez, P.; Linares, J.C. Assessing tree drought resistance and climate-growth relationships under different tree age classes in a Pinus nigra Arn. ssp. salzmannii forest. Forests 2021, 12, 1161. [Google Scholar] [CrossRef]
  35. De Cáceres, M.; Martin-StPaul, N.; Turco, M.; Cabon, A.; Granda, V. Estimating daily meteorological data and downscaling climate models over landscapes. Environ. Model. Softw. 2018, 108, 186–196. [Google Scholar] [CrossRef]
  36. Hargreaves, G.H.; Samani, Z.A. Estimating Potential Evapotranspiration. J. Irrig. Drain. Div. 1982, 108, 225–230. [Google Scholar] [CrossRef]
  37. Fritts, H.C. Tree Rings and Climate; Academic Press: London, UK, 1976. [Google Scholar]
  38. Holmes, R.L. Computer-assisted quality control in tree-ring dating and measurement. Tree-Ring Bull. 1983, 43, 69–78. [Google Scholar]
  39. Biondi, F.; Qeadan, F. A Theory-Driven Approach to Tree-Ring Standardization: Defining the Biological Trend from Expected Basal Area Increment. Tree-Ring Res. 2008, 64, 81–96. [Google Scholar] [CrossRef] [Green Version]
  40. Bunn, A.G. Statistical and visual crossdating in R using the dplR library. Dendrochronologia 2010, 28, 251–258. [Google Scholar] [CrossRef]
  41. Lloret, F.; Keeling, E.G.; Sala, A. Components of tree resilience: Effects of successive low-growth episodes in old ponderosa pine forests. Oikos 2011, 120, 1909–1920. [Google Scholar] [CrossRef]
  42. Jiménez-Morillo, N.T.; Palma, V.; Garcia, R.; Dias, C.B.; Cabrita, M.J. Combination of Stable Isotope Analysis and Chemometrics to Discriminate Geoclimatically and Temporally the Virgin Olive Oils from Three Mediterranean Countries. Foods 2020, 9, 1855. [Google Scholar] [CrossRef]
  43. González-Pérez, J.A.; Jiménez Morillo, N.T.; Rosa Arranz, J.M.; Knicker, H.; González-Vila, F.J. Pyrolysis-compound specific isotope analysis (Py-CSIA). Technique and applications. In Proceedings of the 21st International Symposium on Analytical and Applied. Pyrolysis, Nancy, France, 9–12 May 2016. [Google Scholar]
  44. San-Emeterio, L.M.; López-Núñez, R.; González-Vila, F.J.; González-Pérez, J.A. Evolution of composting process in maize biomass revealed by analytical pyrolysis (Py-GC/MS) and pyrolysis compound specific isotope analysis (Py-CSIA). Appl. Sci. 2021, 11, 6684. [Google Scholar] [CrossRef]
  45. Schimmelmann, A.; Qi, H.; Coplen, T.B.; Brand, W.A.; Fong, J.; Meier-Augenstein, W.; Kemp, H.F.; Toman, B.; Ackermann, A.; Assonov, S.; et al. Organic Reference Materials for Hydrogen, Carbon, and Nitrogen Stable Isotope-Ratio Measurements: Caffeines, n-Alkanes, Fatty Acid Methyl Esters, Glycines, l-Valines, Polyethylenes, and Oils. Anal. Chem. 2016, 88, 4294–4302. [Google Scholar] [CrossRef] [Green Version]
  46. Coplen, T.B. Guidelines and recommended terms for expression of stable-isotope-ratio and gas-ratio measurement results. Rapid Commun. Mass Spectrom. 2011, 25, 2538–2560. [Google Scholar] [CrossRef]
  47. Farquhar, G.D.; Leary, M.H.; Berry, J.A. On the relationship between carbon isotope discrimination and the intercellular carbon dioxide concentration in leaves. Aust. J. Plant Physiol. 1982, 9, 121–137. [Google Scholar] [CrossRef]
  48. Belmecheri, S.; Lavergne, A. Compiled records of atmospheric CO2 concentrations and stable carbon isotopes to reconstruct climate and derive plant ecophysiological indices from tree rings. Dendrochronologia 2020, 63, 125748. [Google Scholar] [CrossRef]
  49. Pontius, J.; Hallett, R. Comprehensive Methods for Earlier Detection and Monitoring of Forest Decline. For. Sci. 2014, 60, 1156–1163. [Google Scholar] [CrossRef]
  50. R Core Team, R. A Language and Environment for Statistical Computing; R Foundation for Statistical Computing: Vienna, Austria, 2021. [Google Scholar]
  51. Bates, D.; Mächler, M.; Bolker, B.; Walker, S. Fitting Linear Mixed-Effects Models Using lme4. J. Stat. Softw. 2015, 67, 1–48. [Google Scholar] [CrossRef]
  52. Zang, C.; Biondi, F. treeclim: An R package for the numerical calibration of proxy-climate relationships. Ecography 2014, 38, 431–436. [Google Scholar] [CrossRef]
  53. Rubio-Cuadrado, Á.; López, R.; Rodríguez-Calcerrada, J.; Gil, L. Stress and tree mortality in Mediterranean pine forests: Anthropogenic influences. In Pines and Their Mixed Forest Ecosystems in the Mediterranean Basin; Springer: Cham, Switzerland, 2021; pp. 141–181. [Google Scholar] [CrossRef]
  54. Fernández-de-Uña, L.; McDowell, N.G.; Canellas, I.; Gea-Izquierdo, G. Disentangling the effect of competition, CO2 and climate on intrinsic water-use efficiency and tree growth. J. Ecol. 2016, 104, 678–690. [Google Scholar] [CrossRef] [Green Version]
  55. Camarero, J.J.; Gazol, A.; Tardif, J.C.; Conciatori, F. Attributing forest responses to global-change drivers: Limited evidence of a CO2-fertilization effect in Iberian pine growth. J. Biogeogr. 2015, 42, 2220–2233. [Google Scholar] [CrossRef] [Green Version]
  56. Valeriano, C.; Gazol, A.; Colangelo, M.; Camarero, J.J. Drought Drives Growth and Mortality Rates in Three Pine Species under Mediterranean Conditions. Forests 2021, 12, 1700. [Google Scholar] [CrossRef]
  57. Camarero, J.J.; Gazol, A.; Sánchez-Salguero, R. Effects of global change on tree growth and vigor of Mediterranean pines. In Pines and Their Mixed Forest Ecosystems in the Mediterranean Basin 2021; Springer: Cham, Switzerland, 2021; pp. 237–249. [Google Scholar]
  58. Manrique-Alba, A.; Beguería, S.; Tomas-Burguera, M.; Camarero, J. Increased Post-Drought Growth after Thinning in Pinus nigra Plantations. Forests 2021, 12, 985. [Google Scholar] [CrossRef]
  59. Xu, B.; Arain, M.A.; Black, T.A.; Law, B.E.; Pastorello, G.Z.; Chu, H. Seasonal variability of forest sensitivity to heat and drought stresses: A synthesis based on carbon fluxes from North American forest ecosystems. Glob. Chang. Biol. 2020, 26, 901–918. [Google Scholar] [CrossRef] [Green Version]
  60. Silvério, E.; Duque-Lazo, J.; Navarro-Cerrillo, R.M.; Pereña, F.; Palacios-Rodríguez, G. Resilience or Vulnerability of the Rear-Edge Distributions of Pinus halepensis and Pinus pinaster Plantations Versus that of Natural Populations, under Climate-Change Scenarios. For. Sci. 2020, 66, 178–190. [Google Scholar] [CrossRef]
  61. Frank, D.C.; Poulter, B.; Saurer, M.; Esper, J.; Huntingford, C.; Helle, G.; Treydte, K.; Zimmermann, N.E.; Schleser, G.H.; Ahlström, A.; et al. Water-use efficiency and transpiration across European forests during the Anthropocene. Nat. Clim. Chang. 2015, 5, 579–583. [Google Scholar] [CrossRef] [Green Version]
  62. Forrester, D.I. Transpiration and water-use efficiency in mixed-species forests versus monocultures: Effects of tree size, stand density and season. Tree Physiol. 2015, 35, 289–304. [Google Scholar] [CrossRef] [PubMed] [Green Version]
  63. Fernandes, T.J.; Del Campo, A.D.; Herrera, R.; Molina, A.J. Simultaneous assessment, through sap flow and stable isotopes, of water use efficiency (WUE) in thinned pines shows improvement in growth, tree-climate sensitivity and WUE, but not in WUEi. For. Ecol. Manag. 2016, 361, 298–308. [Google Scholar] [CrossRef]
  64. Linares, J.C.; Camarero, J.J. From pattern to process: Linking intrinsic water-use efficiency to drought-induced forest decline. Glob. Chang. Biol. 2012, 18, 1000–1015. [Google Scholar] [CrossRef]
  65. Voltas, J.; Lucabaugh, D.; Chambel, M.R.; Ferrio, J.P. Intraspecific variation in the use of water sources by the circum-Mediterranean conifer Pinus halepensis. New Phytol. 2015, 208, 1031–1041. [Google Scholar] [CrossRef] [Green Version]
  66. Volkmann, T.H.M.; Haberer, K.; Gessler, A.; Weiler, M. High-resolution isotope measurements resolve rapid ecohydrological dynamics at the soil–plant interface. New Phytol. 2016, 210, 839–849. [Google Scholar] [CrossRef] [Green Version]
  67. Cormier, M.-A.; Werner, R.A.; Sauer, P.E.; Gröcke, D.R.; Leuenberger, M.C.; Wieloch, T.; Schleucher, J.; Kahmen, A. 2H-fractionations during the biosynthesis of carbohydrates and lipids imprint a metabolic signal on the δ2H values of plant organic compounds. New Phytol. 2018, 218, 479–491. [Google Scholar] [CrossRef] [PubMed] [Green Version]
  68. Lehmann, M.M.; Vitali, V.; Schuler, P.; Leuenberger, M.; Saurer, M. More than climate: Hydrogen isotope ratios in tree rings as novel plant physiological indicator for stress conditions. Dendrochronologia 2020, 65, 125788. [Google Scholar] [CrossRef]
  69. Wang, J.; Fu, B.; Wang, L.; Lu, N.; Li, J. Water use characteristics of the common tree species in different plantation types in the Loess Plateau of China. Agric. For. Meteorol. 2020, 288–289, 108020. [Google Scholar] [CrossRef]
  70. Cernusak, L.A.; Ubierna, N. Carbon isotope effects in relation to CO2 assimilation by tree canopies. In Stable Isotopes in Tree Rings; Siegwolf, R.T.W., Brooks, J.R., Roden, J., Saurer, M., Eds.; Tree Physiology 8; Springer: Cham, Switzerland, 2022; pp. 291–310. [Google Scholar]
  71. Lehmann, M.M.; Schuler, P.; Cormier, M.A.; Allen, S.T.; Leuenberger, M.; Voelker, S. The Stable Hydrogen Isotopic Signature: From Source Water to Tree Rings. In Stable Isotopes in Tree Rings; Siegwolf, R.T.W., Brooks, J.R., Roden, J., Saurer, M., Eds.; Tree Physiology 8; Springer: Cham, Switzerland, 2022; pp. 331–359. [Google Scholar] [CrossRef]
  72. Tyutkova, E.; Loskutov, S.; Petrov, I.; Dorzhiev, D. Seasonal biochemical changes in Betula tortuosa Ledeb. annual rings in Alpine forest-tundra of Kuznetsk Ala Tau Mountains. Wood Sci. Technol. 2022, 57, 289–306. [Google Scholar] [CrossRef]
  73. Moulin, J.C.; Ribeiro, D.D.S.; Vidaurre, G.B.; Mulin, L.B.; Moreira, S.I. Effect of drought stress on the formation and lignification of eucalyptus wood cells. IAWA J. 2022, 43, 263–275. [Google Scholar] [CrossRef]
  74. Meusburger, K.; Trotsiuk, V.; Schmidt-Walter, P.; Baltensweiler, A.; Brun, P.; Bernhard, F.; Walthert, L. Soil–plant interactions modulated water availability of Swiss forests during the 2015 and 2018 droughts. Glob. Change Biol. 2022, 28, 5928–5944. [Google Scholar] [CrossRef] [PubMed]
  75. Manrique-Alba, A.; Beguería, S.; Molina, A.J.; González-Sanchis, M.; Tomàs-Burguera, M.; del Campo, A.D.; Colangelo, M.; Camarero, J.J. Long-term thinning effects on tree growth, drought response and water use efficiency at two Aleppo pine plantations in Spain. Sci. Total. Environ. 2020, 728, 138536. [Google Scholar] [CrossRef] [PubMed]
  76. Sohn, J.A.; Saha, S.; Bauhus, J. Potential of forest thinning to mitigate drought stress: A meta-analysis. For. Ecol. Manag. 2016, 380, 261–273. [Google Scholar] [CrossRef]
Figure 1. Mean series of basal area increment (BAI) of natural vs. planted P. pinaster stands (above) and P. nigra stands (below) along an aridity gradient in south-eastern Spain. Sampled sites correspond to P. pinaster (PP) and P. nigra (PN) natural (PPN and PNN) and planted (PNP and PPP) stands. Gray bars correspond to standard errors and vertical red dashed lines show dry years (1995, 2005 and 2012). Sites’ abbreviations: PPNMA, P. pinaster natural (Málaga); PPPMA, P. pinaster planted (Málaga); PPNGR, P. pinaster natural (Granada); PPPGR, P. pinaster planted (Granada); PNNGR, P. nigra natural (Granada); PNPGR, P. nigra planted (Granada); PNNAL, P. nigra natural (Almería) and PNPAL, P. nigra planted (Almería).
Forests 14 00573 g001
Figure 2. Bootstrapped response function analysis relating tree-ring growth to monthly mean temperature (blue bars) and precipitation (red bars) from previous June to current September in Pinus pinaster (PP) and P. nigra (PN) natural (PPN and PNN) and planted (PNP and PPP) stands. Previous-year months are given in lowercase letters, whereas current-year ones are shown in uppercase letters. Significant correlations (p < 0.05) are presented with continuous lines.
Forests 14 00573 g002aForests 14 00573 g002b
Figure 3. Resistance (CRT), recovery (CRC), and resilience (CRS) growth indices calculated for Pinus pinaster and P. nigra natural and planted stands during three dry years (1995, 2005 and 2012). Values are means ± standard error and different letters (a, b and c) indicate significant differences (p < 0.05) between stand type within drought events. Bold values show significant differences among groups (Student’s t-test, significance levels: * p ≤ 0.05; ** p ≤ 0.01; *** p ≤ 0.001).
Forests 14 00573 g003
Figure 4. Relationships between stable isotopes (δ13C and δ2H) in wood of (A) Pinus pinaster and (B) P. nigra for natural (PNN, PPN; red lines, symbols and equations) and planted (PNP, PPP; blue lines, symbols and equations) stands along an aridity gradient in south-eastern Spain. Note that δ13C and δ2H negatively covaried in planted forests. Abbreviations: PPN, P. pinaster natural; PPP, P. pinaster planted; PNN, P. nigra natural; PNP, P. nigra planted. Compositions fall on two distinct trends: the dry 2012 year and post-drought, wet years 2013, 2014 and 2015.
Forests 14 00573 g004aForests 14 00573 g004b
Figure 5. Z-scores of concentrations of δ2H in (A) phenol, 2-methoxy (guaiacol), (B) 2-propanone, (4-hydroxy-3-methoxyphenyl) (guaiacyl acetone) and (C) octadecenoic acid (oleic acid) in tree-ring wood of natural (brown box plots) and planted (green box plots) Pinus nigra and P. pinaster stands. Difference levels of significance are shown based on U Mann–Whitney test comparing natural vs. planted stands. Significance levels: * p ≤ 0.05; ** p ≤ 0.01; *** p ≤ 0.001. Significant differences between natural and planted stands are shown with asterisks (** p ≤ 0.01).
Forests 14 00573 g005
Table 1. Topographical and silvicultural characteristics of the Pinus pinaster and Pinus nigra forests sampled along an aridity gradient in southeastern Andalucía (Spain). Abbreviations: P, planted stands; F, forest (naturally regenerated stands); Sites, PPNMA, Pinus pinaster natural (Málaga); PPPMA, P. pinaster planted (Málaga); PPNGR, P. pinaster natural (Granada); PPPGR, P. pinaster planted (Granada); PNNGR, P. nigra natural (Granada); PNPGR, P. nigra planted (Granada); PNNAL, P. nigra natural (Almería) and PNPAL, P. nigra planted (Almería); DBH diameter at breast height (cm); H: dominant height (m); G: basal area (m2 ha−1); N: stand density (stems ha−1); Elev, Elevation (m.a.s.l.); Exp, Exposition. Values are ranges (slope) or means ± standard errors (in brackets).
SpeciesStand TypeSiteLat. (N)Long. (W)DBH (cm)H (m)G (m2 ha-1)N (Trees ha-1)Elev (m)Exp Slope (%)
Pinus
pinaster
NPPNMA36.594.9633.4(1.7)8.2(0.3)15.7180400SW35–65
PPPPMA36.495.1232.2(3.2)8.8(0.4)10.6130260S>65
NPPNGR37.233.4533.2(0.8)10.6 (0.6)20.72401320NE35–65
PPPPGR37.242.5712.9(0.6)7.4(0.3)16.512501300NW35–65
Pinus
nigra
NPNNGR37.083.4660.4(4.2)7.8(0.4)71.82501700N35–65
PPNPGR37.043.5527.4(1.1)13.1 (0.3)27.24601425NW2
NPNNAL37.262.5281.2(5.9)9.5(0.3)41.5801800NW35–65
PPNPAL37.222.5615.8(0.5)9.5(0.3)17.69001725N35–65
Table 2. Dendrochronological statistics of sampled Pinus pinaster and P. nigra forests sampled across an aridity gradient in southeastern Spain. Sampled sites correspond to P. pinaster (PP) and P. nigra (PN) natural (PPN and PNN) and planted (PNP and PPP) stands. Abbreviations: Spp, specie; Site, PPNMA, P. pinaster natural (Málaga); PPPMA, P. pinaster planted (Málaga); PPNGR, P. pinaster natural (Granada); PPPGR, P. pinaster planted (Granada); PNNGR, P. nigra natural (Granada); PNPGR, P. nigra planted (Granada); PNNAL, P. nigra natural (Almería) and PNPAL, P. nigra planted (Almería); TRW, tree-ring width; BAI20, mean basal area increment in the last 20 years; MS, Mean sensitivity; Rbar, mean correlation among series; AC1, first-order autocorrelation; EPS, Expressed Population Signal. Values are means ± standard errors (in brackets) Bold values show significant differences among groups (Student’s t-test significance levels: * p ≤ 0.05; ** p ≤ 0.01; *** p ≤ 0.001).
SpeciesSiteTimespan
(No. Years)
TRW (cm)BAI20
(cm2 Year−1)
MSRbarAC1EPS
P. pinasterPPNMA1960–2017 (57)2.90 (0.14) **9.41 (1.60) ***0.3320.5940.6680.957
PPPMA1936–2017 (81)1.95 (0.09)6.44 (0.65)0.3730.6870.6440.982
PPNGR1973–2017(45)2.56 (0.26) ***6.42 (0.51) ***0.3120.4760.8680.948
PPPGR1975–2016(41)1.94 (0.31)2.28 (0.34)0.3730.5670.8870.966
P. nigraPNNGR1869–2020 (151)1.72 (0.05) ***11.65 (2.33) ***0.2970.5290.7240.895
PNPGR1964–2020 (56)2.07 (0.16)5.89 (0.52)0.4510.6180.7840.973
PNNAL1747–2020 (273)1.05 (0.02) ***7.60 (2.43) **0.3450.5030.7410.853
PNPAL1977–2016 (39)2.12 (0.22)3.43 (0.36)0.3380.5100.7960.949
Table 3. C (δ13C) and H (δ2H) isotope values and intrinsic water-use efficiency (iWUE) data of sampled Pinus pinaster and P. nigra forests across an aridity gradient in southeastern Spain. Sampled sites correspond to P. pinaster (PP) and P. nigra (PN) natural (PPN and PNN) and planted (PNP and PPP) stands. Values are means (SD). Abbreviations: PPNMA, P. pinaster natural (Málaga); PPPMA, P. pinaster planted (Málaga); PPNGR, P. pinaster natural (Granada); PPPGR, P. pinaster planted (Granada); PNNGR, P. nigra natural (Granada); PNPGR, P. nigra planted (Granada); PNNAL, P. nigra natural (Almería) and PNPAL, P. nigra planted (Almería). Values are means ± standard errors (in brackets). Bold values show significant differences among groups (Mann–Whitney U-test, significance levels: * p ≤ 0.05; ** p ≤ 0.01; *** p ≤ 0.001).
SpeciesStand TypeSiteδ13C (‰)δ2H (‰)iWUE
(μmol mol−1)
Pinus pinasterMálagaPPNMA−25.11 (0.50).−61.39 (1.24) *109.81 (5.83)
PPPMA−24.43 (0.83)−57.28 (3.27)116.97 (9.37)
GranadaPPNGR−25.33 (0.47) *−65.15 (1.80)110.05 (2.38) *
PPPGR−23.79 (0.31)−68.56 (4.03)123.93 (3.78)
PPN−25.24 (0.33)−63.64 (1.29)108.95 (2.22)
PPP−24.11 (0.43)−60.93 (3.22)120.44 (4.93)
Pinus nigraGranadaPNNGR−24.51 (0.34)−76.83 (6.04) *116.22 (3.88)
PNPGR−23. 82 (0.57)−66.69 (5.37)123.94 (6.27)
AlmeríaPNNAL−25.65 (0.19) **−60.09 (1.22) *103.00 (2.11) *
PNPAL−24.28 (0.31)−53.98 (1.75)118.86 (3.89)
PNN−25.08 (0.25)−69.29 (3.81) *109.61 (2.90) *
PNP−24.05 (0.31)−58.67 (2.23)121.40 (3.60)
Disclaimer/Publisher’s Note: The statements, opinions and data contained in all publications are solely those of the individual author(s) and contributor(s) and not of MDPI and/or the editor(s). MDPI and/or the editor(s) disclaim responsibility for any injury to people or property resulting from any ideas, methods, instructions or products referred to in the content.

