Article

Improving Sustainable Forest Management of Pinus halepensis Mill. Mid-Aged Stands in a Context of Rural Abandonment, Climate Change, and Wildfires

by
Eduardo Rojas-Briales
1,
Jose-Vicente Oliver-Villanueva
1,
Victoria Lerma-Arce
1,
David Fuente
2 and
Edgar Lorenzo-Sáez
1,*
1
ITACA Research Institute, Universitat Politècnica de València, Camí de Vera s/n, 46022 Valencia, Spain
2
Department of Biophysics, Faculty of Science, Palacký University, 779 00 Olomouc, Czech Republic
*
Author to whom correspondence should be addressed.
Forests 2023, 14(3), 527; https://doi.org/10.3390/f14030527
Submission received: 29 January 2023 / Revised: 4 March 2023 / Accepted: 6 March 2023 / Published: 7 March 2023

Abstract

:
Pinus halepensis Mill. covers most lowland forests on limestone soils and semiarid to sub-humid climates in the Mediterranean basin. It is considered a key species in climate change due to its pioneer nature, versatility, and flexibility. Moreover, its industrial potential is an additional incentive to promote forest management to increase its quality and productivity while contributing to other environmental and social objectives. However, there is a considerable gap in science-based knowledge on the effects of different silvicultural treatments on Pinus halepensis stands. Thus, this research compares the impact of four different treatments (light thinnings, strong thinnings, transformation to uneven-aged, and diameter-driven uneven-aged) on even-aged mid-rotation stands of Pinus halepensis in terms of growth, vulnerability, and resilience to extreme weather events, regeneration, and shrub cover. The effects of four treatments are evaluated in 12 research plots of 0.49 ha each (three per treatment) and contrasted with the other three non-managed control plots. Light and strong thinning treatments show better growth—at least in the short term—and stock results than those reported in the reference yield tables. Transformation to uneven-aged treatment shows advantages in maintaining periodic growth, regeneration, and stability. In addition, it offers an alternative for steep slope stands, smallholders, and extended narrow-aged estates to speed up the desirable balanced age class distribution. Diameter-driven uneven-aged treatment implies greater vulnerability to extreme weather events during the first years and considerable stock reduction while offering faster and taller tree regeneration. A dual regeneration pattern of Ulex parviflorus Pourr is observed in addition to post-fire regeneration in the case of sudden and well-distributed tree cover reduction around 40% of the canopy due to the transformation into the uneven-aged stand. An observation period longer than a decade of the research plots will confirm these first conclusions.

1. Introduction

Pinus halepensis Mill. (Aleppo pine) is one of the most representative species of the Mediterranean-type ecosystems (MTEs) [1,2], covering more than 6 million ha in this region [3]. It is present in all regions on both shores of the Mediterranean Sea [1,4] and extends from the Western Mediterranean (Spain, Morocco), where it is most abundant, to Lebanon through Southern France, Italy, Greece, and Turkey in South Europe and Algeria, Tunisia, and Libya in North Africa. Pinus halepensis is close related to Pinus brutia (Turkish or Calabrian pine) and can hybridize with it. This commonly occurs in the eastern part of the Mediterranean basin [5] in coastal zones [6].
Pinus halepensis is a drought-tolerant and relatively fast-growing native coniferous species [2], well adapted to dry summer conditions [1]. In contrast to the rest of euro-Mediterranean pines, it can sprout in any season as far as the climate allows. It prefers limestone soils, avoiding harsh mountain climates. It is among the species most affected by wildfires in Europe [7]. However, it is fire-resilient due to the high production of serotinous cones that favor a quick post-fire regeneration [8]. It is also the only serotine pine species of the euro-Mediterranean species as Pinus pinaster Ait. serotine cones are restricted to the Western subspecies (atlantica).
These species were widely planted between 1930 and 1980 in Mediterranean areas for soil protection and windbreaks near the coasts [8]. Bioclimatic envelope models predict that the suitable climatic area of Pinus halepensis is clearly in expansion [9] due to climate change [10,11] as well as to land abandonment [12]. It covers 2.1 million ha in Spain, rating it as the most extended conifer [13]. It is found around the Mediterranean coast, the Balearic Islands, and some near continental lowlands (La Mancha, Ebro Valley) below 1000 m. This species is the dominating tree species in 3 Spanish regions (Valencia, Balearic Islands, and Murcia), covering more than 70% of the forests in these Autonomous Communities.
Pinus halepensis is characterized by monospecific stands [14,15] for two main reasons. First, it displays a high capacity to colonize poor and degraded soils, especially after agricultural abandonment. It regenerates rapidly and efficiently after a fire, creating very dense stands that can exceed 10,000 trees/ha [16,17] in the case of fire well above 100,000 trees/ha. Second, it has been widely used in reforestations after the Spanish Civil War [18].
Thanks to its excellent adaptation capacity, this species can alter its morphology depending on the environment. Tall, straight trees and specimens with tortuous stems can be formed depending on site limitations, poor forest management, or both [19]. In addition, 4 to 6 m3/ha-year can be reached in high-quality sites where, however, it can be displaced in the long term by more shadow-resistant species. Nevertheless, the average growth is less than 2 m3/ha-year [1]. Thus, Pines halepensis stands out more for its role as a protective species preventing erosion and regulating the water cycle and for its landscape value than for its direct productive use. This reduces the economic interest in silvicultural treatments of its stands. Interestingly, the quality of the wood is of reasonable quality if compared to other pines [20,21]. However, the poor morphology of most trunks, especially those harvested in thinnings or first-generation stands [22], implies a lower proportion of roundwood usable as sawn timber, even veneer [19]. The everyday use of this raw material is for pallet slabs [23]. Some recent innovations allow the inclusion of sawn timber from Pinus halepensis in engineered products such as OSB or CLT [24], which opens added-value opportunities for this species. Nevertheless, the most widespread use is chipping, either for wood-based panels (chipboard or fiberboard) or bioenergy (chips or pellets) [25].
In the actual climate change context, sustainable forest management is critical for adapting forests to climate alterations. In this sense, Pinus halepensis plays a crucial role in the Mediterranean basin due to its versatility and adaptation to severe weather conditions such as high temperatures and prolonged droughts. Its industrial potential could be used as a solid incentive to promote management to increase its quality and productivity while improving the landscape and environmental value. However, studies assessing the impact of different silvicultural treatments on these forest stands are lacking due to the absence of interest in its production potential and the need to sustain the research for decades. This species is the dominant one in extended Mediterranean areas considerably affected by fire and is also crucial in their landscape values for tourism. Thus, consistent science-based research on the most suitable management options is urgently needed.
In summary, this research aims to evaluate the effect of different silvicultural treatments applied to Pinus halepensis even-aged mid-age stands to identify the most suitable silvicultural models applicable to various conditions and demands. To achieve this, a network of permanent experimental plots was established in 2009 to analyze the influence of forest management on the structural dynamics of even-aged stands of Pinus halepensis. The specific objectives of this research are:
  • To analyze the effect of each silvicultural treatment on the growth and stock evolution of the stands.
  • To analyze the damage caused by perturbances (wind, snow) concerning the applied treatment.
  • To evaluate the natural regeneration of pine trees and shrubs in each silvicultural treatment.
  • To check the accuracy of the existing yield tables for this species in the selected areas.

2. Materials and Methods

2.1. Study Area

The research plots are situated within the state forest P. V154 “La Hunde y La Palomera”, located at the western limit of the municipality of Ayora in the Region of Valencia in Spain (Figure 1). Geographically, the ETRS89 coordinates of the midpoint of the study area are 39°7′41″ N; 1°13′32″ W.
Concerning the orography, the study area is located in a valley with an average altitude of 793 m in a slight slope of less than 10%. The soil presents Quaternary glacis sediments (Calcisols). The climate is considered an upper meso-Mediterranean floor with an upper dry humidity index [26,27,28].

2.2. Experimental Plots and Silvicultural Treatments

Site and stand factors must be similar among the research plots not to affect the analysis. Thus, the following characteristics were homogeneous in the plots located in slight slopes:
(a)
Soil (rock and deepness);
(b)
Orography (orientation, soft, and even slope);
(c)
Climate (near the location of the different research plots);
(d)
Stands (even-aged stands afforested in the same year with the same species and with no significant thinning applied before).
The selected stands were planted in 1959 on marginal agricultural land with cereal crops.
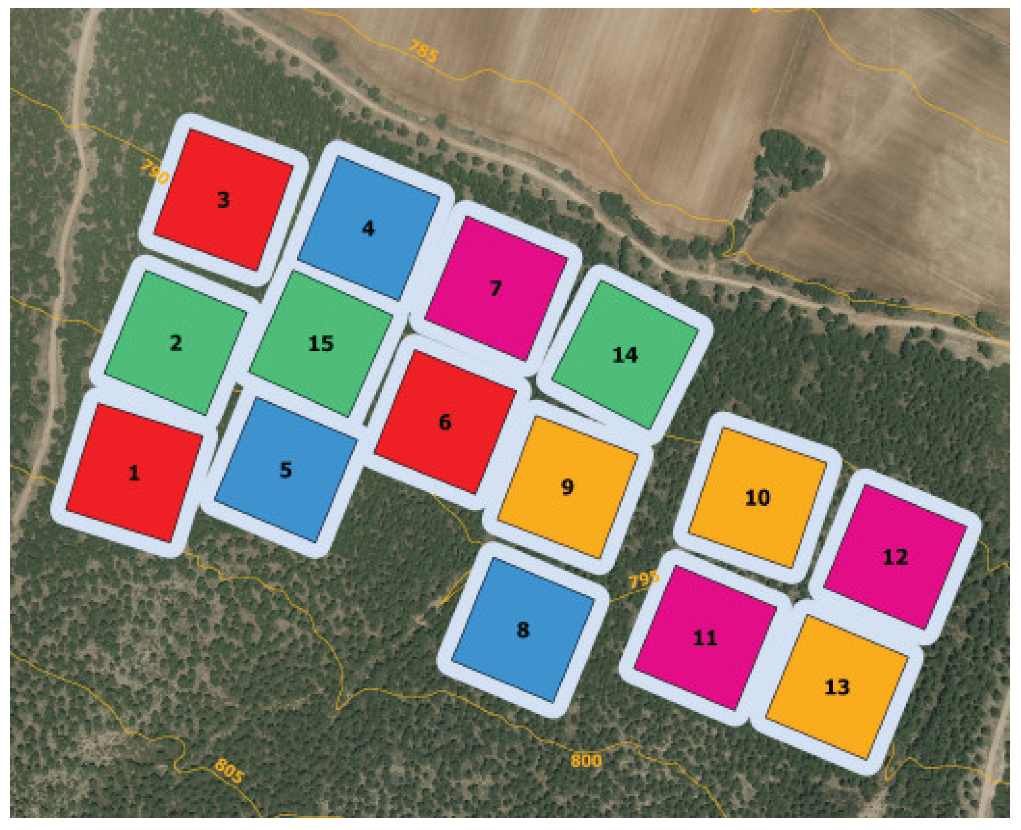
A total of 15 plots of 0.49 ha (70 × 70 m) were defined in late 2008 with a 10 m perimeter in which the same treatment was applied (Figure 2). Four silvicultural treatments were carried out at the beginning of 2009 in the plots of this 50-year-old forest stand, allowing three replicas of each of the four treatments. Once the site index of each of the 15 plots was determined, they were grouped into three categories (low, medium, and average), allotting one of each to each of the four treatments.
The plots inventory and main stand state characteristics per plot (2009–2019) can be seen in the Supplementary Materials section. First, for the design and definition of the silvicultural treatment, a sociological classification of the trees in each experimental plot was performed according to the classes defined by [29]. These sociological classes were: 1 = dominant tree, 2 = co-dominant, 3 = intermediate, 4 = dominated, and 5 = overtopped. The five different treatments applied to the experimental plots according to their sociological class are summarized as follows, including their rationale:
  • Light thinning (LT): All trees of Kraft classes 4 and 5 were removed, as well as those of class 3, unless excessive understocking in the stand would be created. In addition, the most vigorous and best-positioned trees were preselected, identifying them as possible seed trees for future natural regeneration. Thus, those of classes 1 and 2 of poorer quality that may interfere with each other would be removed. Trees with any health issues would also be removed. The applied thinning intensity was derived from the yield table for this species published by [16] for light thinning.
  • Strong thinning (ST): All trees of Kraft classes 3, 4, and 5 were removed unless excessive understocking in the stand was created. Trees of classes 1 and 2 were only eliminated for health reasons, overstocked stand density, or if they show poor quality. The applied thinning intensity was derived from the yield table for this species published by [16] for strong thinning.
  • Transformation to uneven-aged (TU): Trees were systematically removed according to quality criteria and phytosociological position. All trees of Kraft classes 4 and 5 were removed, as well as those of class 3, if they were of low quality. Trees of classes 1 and 2 with poor quality or presenting health issues were eliminated unless an excessive understocking in the stand was created. In stands with a high density of trees of classes 1 and 2, these were removed following quality and space distribution criteria to facilitate regeneration.
  • Diameter-driven uneven-aged (DU): Trees with the largest diameter were removed, while those with a lower diameter were left standing. The target diameter chosen was 23 cm (DBH) without felling any trees below that diameter except for the dead ones. If the gap left after the felling creates an equivalent space larger than three dominant trees, the most centric or stable tree will be left standing.
  • Control plots (CP): Only dead or almost trees were removed (class 5), counted as natural mortality.
It should be noted that since these research plots were established, including the 2009 treatment, two extreme weather events caused significant damage and windthrow: a strong wind in February 2010 and a heavy snowfall in January 2017. These events have also been used to evaluate the four silvicultural treatments applied regarding their resilience effect, including their time evolution.
The different treatments were identified due to the following rationale:
  • LT and ST are the standard treatments in mid-aged and even-aged stands. Before engaging into new thinning pathways and considering the relatively high age of the stands (50 years) in relation to the rotation age in this species (80–100 years) for applying a first thinnings, the most prudent option was to test, for the first time in a research plot setting, the thinning intensities of the previously quoted yield table.
  • TU: Pinus halepensis is not predisposed to uneven-aged structures, as it is a light species. This treatment is considered suitable in at least three cases: steep slopes due to high erosion potential and increased light availability, small-scale ownership, and as a transitional option for extensive mid-age afforestation to speed up the diversification of age classes and structures. The small-scale stand diversity in steep slopes would risk masking the results, recommending the establishment of research plots of uneven-aged treatments in almost flat conditions such as the ones of these research plots.
  • DU: In the past, the standard treatment was diameter-driven uneven-aged selection with 23 cm as the minimum diameter. While this practice had been phased-out in public forests in the past decades, it remained the standard in private ones. Professional foresters have shared strong criticism regarding the degradation risks of this treatment, especially about the stand stability, growth potential, and genetics [30]. Ex-ante exclusion of long-applied treatment without due research-based checking was considered premature.
  • CPs are foreseen in silvicultural treatment plots as a standard practice to allow comparisons with non-treated stands.

2.3. Stand Characterization Based on Forest Growth Parameters

The effect of each silvicultural treatment was analyzed based on the measurement of the following forest growth parameters:
  • Stand density (trees/ha): This is defined as the number of living trees with a DBH >7.5 cm at 1.30 m high present in each plot per hectare.
  • Basal area (BA or G, in m2 or m2/ha): This is defined as the cross-sectional area of the normal diameter of a tree or all trees per hectare at 1.30 m high of a stand. It is a good thickness estimator if it is combined with the dominant diameter and the mean square diameter [31]. It can be calculated with the following expression (1):
G m 2 = π 4 i = 1 n D B H m 2
  • Quadratic mean diameter (Dq, in cm): This corresponds to the mean basal area diameter of each plot (Gm). It can be calculated with expression (2):
D q c m = 4 × G m c m 2 π
  • Quadratic mean height (Hq, in m): This corresponds to the mean height of the mass. This height also corresponds to that of the mean basal area tree.
  • Dominant diameter (Dd, in cm). This corresponds to the diameter of the 100 thickest trees per hectare. The quadratic means of the diameters of the 49 thickest trees of each one are calculated to obtain the dominant diameter per plot.
  • Dominant height (Hd, in cm): This corresponds to the tree’s height with the average normal section of the thickest 100 trees per hectare. The thickest 49 trees per plot are selected, and the mean square of their heights is calculated.
  • Volume with bark (Vwb, in m3 or m3/ha): This is calculated based on the formula obtained from the last available National Forest Inventory (3rd) released just a few years before the plots were set-up [32] for the forest district to which the study area belongs (Province of Valencia). The ratio is individually applied for each tree in the plot, and these unit volumes are subsequently added to gather the total volume per plot. It can be calculated with expression (3):
V w b d m 3 = 0.0010409 × D B H m m 1.90943 × h m 0.72076
  • Slenderness (h/d, as a %): Ratio between the total height and the normal diameter. Slenderness index is a stability indicator for which values below 80 indicate good stability, whereas values between 81 and 100 show some instability and values above 100 represent a high instability [31]. The average slenderness index of the plot corresponds to the arithmetic mean of the individual slenderness indexes of all the trees [33]. The individual slenderness index can be calculated with expression (4):
h d = h m D B H c m × 100        
  • Unitary volume of the average tree (Vt, in m3/tree): The volume corresponding to the average tree of a stand, calculated as the quotient between the total volume of the plot and the number of trees.
  • Periodic growth (pg): This represents the periodic growth of a tree parameter. It is also known as Periodic Annual Increment (PAI) or Periodic Annual Growth. Periodic growth can be calculated with expression (5):
p g = M m n
M and m are the values of the variable considered at the final and initial moment, respectively, and n is the period between both measurements.
  • Average periodic growth (apg): This is an expression of the accumulated growth divided by the age. It is also called Mean Annual Increment (MAI) or Mean Annual Growth. It can be calculated with expression (6):
a p g = M A g e
where M, in this case, is the total accumulated growth divided by age.
In addition, some considerations about the regeneration must be taken into account:
  • Regeneration is counted before reaching 0.25 m as the smaller juveniles often dry out due to the lack of light in excessive shadow.
  • Regeneration and shrub cover, including the dominant species, are measured by inventory subplots of 4% of the area of each research plot.
Finally, the effect of the interventions is analyzed with Kruskal–Wallis and Tukey’s post hoc tests with a significance level of 5%.

3. Results and Discussions

3.1. Analysis of Growth Differences among Silvicultural Treatments

The amount of biomass extracted by the different silvicultural treatments, which is an average of each set of three plots, is described in Table 1.
Table 2 shows the mean values for each treatment of the average periodic growth in terms of diameter, height, basal area, and volume. Additionally, the unitary volume of the average tree for 2009 (calculated from the data prior to the 2009 fellings) and for 2019 (calculated from the total volume accumulated in 2019) is displayed in Table 2. The periodic growth indices are also included, which are obtained from the data of the stand before the 2019 fellings and from the data after the 2009 fellings (deducting the losses due to extreme weather events of 2010 and 2017 and the natural mortality).
Table 2 shows that the average mean growth before the 2009 fellings is nearly the same in all the treatments because the stand was unmanaged for a long time. The mean growth remains practically constant in all silvicultural treatments in 2009 and 2019. Thus, it is impossible to determine at which stage of the average growth curve the stand is right now as a period of ten years is too short to show significant changes. However, the analysis of the control plots (CPs), without treatment, reflecting the natural stand evolution, shows that for Dq, Hq, and BA, the mean growth is lower in 2019 than in 2009. Thus, it can be deduced that the stand has already reached the age of maximum average growth in BA, Hq, and Dq and periodic growth. In addition, LT and ST treatments show a higher average periodic volume growth than those predicted in the Pinus halepensis yield tables [16]. In fact, the measured average periodic growth accounts for 3.6 m3/year/ha, while the expected value is 2.9 m3/year/ha [16] corresponding to a 25% stronger growth in both types of thinning (LT and ST).
Furthermore, the same situation occurs in all treatments. As a light species, Pinus halepensis culminates its height much earlier than other species, and the decrease in its periodic growth intensifies with age [31].
Comparing the Dq growth among treatments, the more intense the intervention, the stronger the periodic growth in diameter is. However, concerning the BA, this trend is ambivalent, showing the lowest increase in CP and the highest in LT, ST, and TU with minimal differences in between both DU. In principle, a more intense treatment could have a certain positive effect on tree growth. However, the lower growth in the DU intervention could also indicate that this treatment potentially leads to the loss of stand stability and, therefore, to the loss of growth.
In the case of Hq, no significant differences are observed in the periodic growth among treatments, confirming the enlarged law by Faustmann [34] and that reformulated by Assmann [35]. This equation estimates total growth in even-aged stands of the same species by considering the height of the dominant trees regardless of the tree density/ha as far as the critical basal area (BA) is not reached (around 70%).
Finally, the fact that periodic growth in volume is still higher in all treatments than the mean periodic growth of 2019 implies that the period of maximum mean growth has yet to be reached [36]. This is in agreement with [16] for this species, expecting the age of maximum mean growth in volume to be between 60 and 70 years. For the DU treatment, the lower periodic growth in volume indicates that this treatment is disruptive.
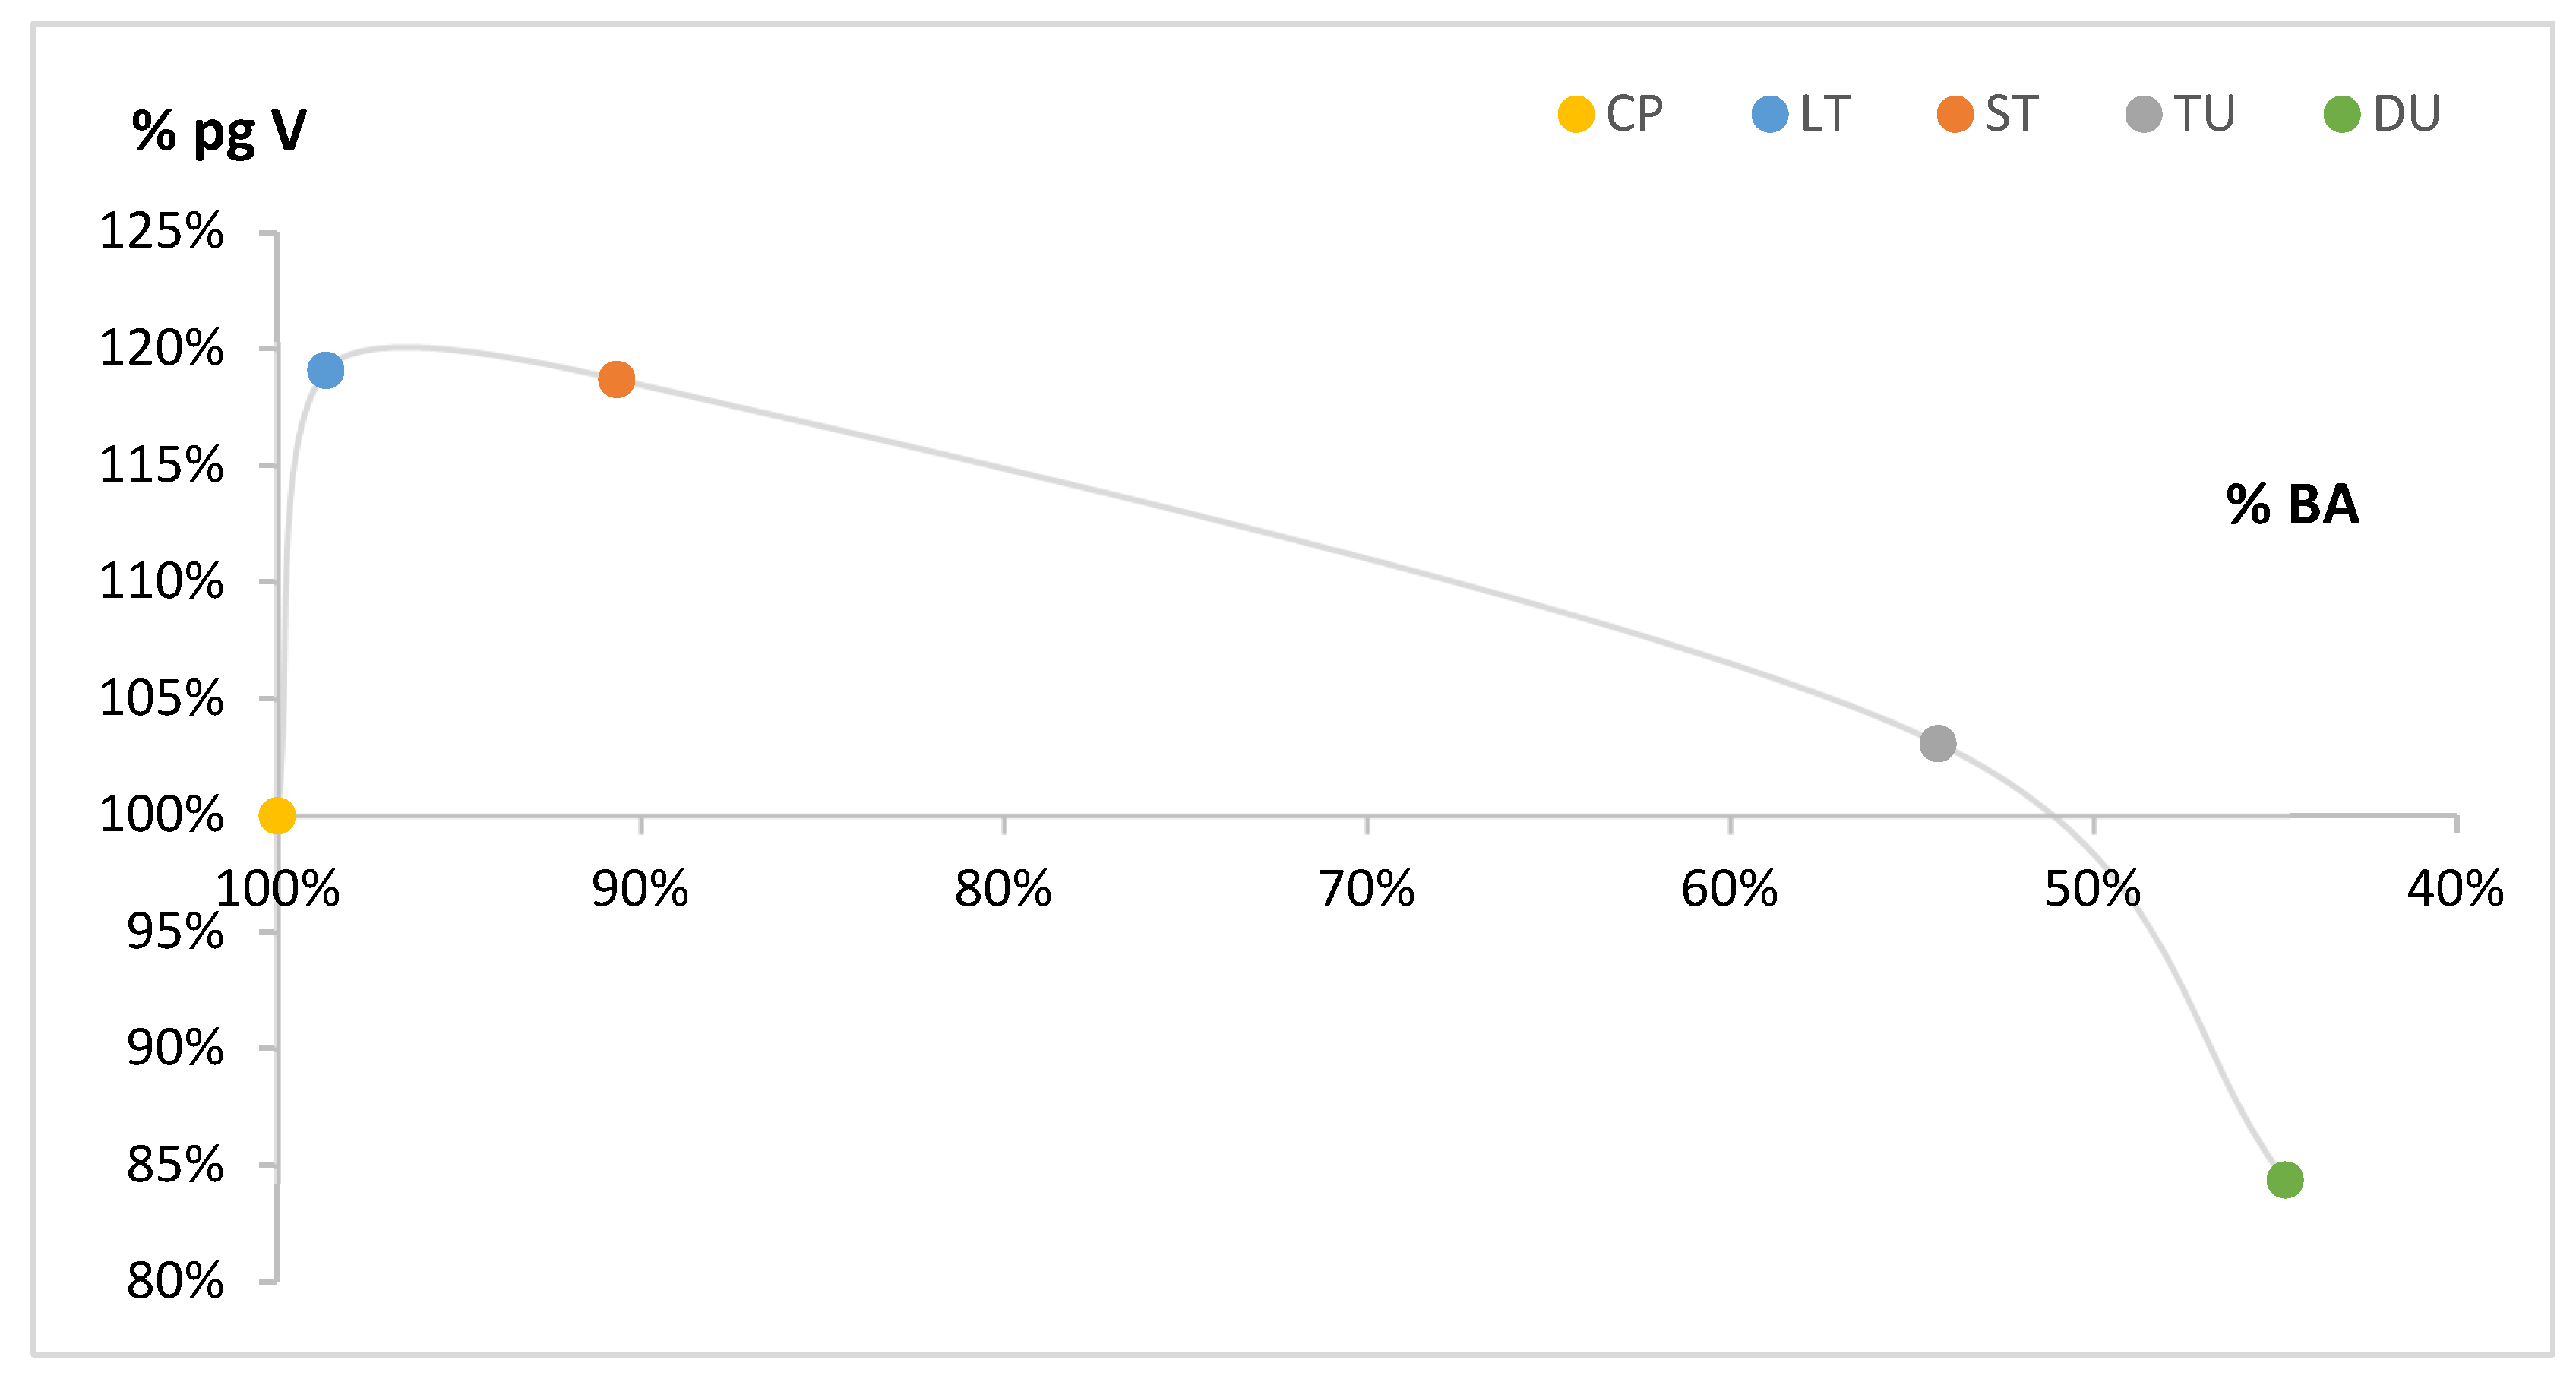
This assumption can be verified in Figure 3, which represents the variation in the periodic growth in volume as a function of the intensity of the treatment. Figure 3 shows the periodic growth in volume for each treatment (expressed as a percentage of the periodic growth of CP) and BA (a percentage of the BA control plots). BA is obtained by deducting the 2010 and 2017 wind and snow extreme events from the 2009 post-treatment stock.
Figure 3 shows that light to medium silvicultural treatments cause a higher volume growth compared to the unmanaged stands in the CP. On the contrary, too intensive treatments can reduce this increase even below the growth of the CP stands. According to [35], the critical BA is defined as the basal area related to a 5% growth loss in volume with respect to the growth of the non-treated plots. This corresponds to a pg V of 95% in the vertical axis of Figure 3. Thus, Figure 3 shows that the critical BA is around 50% of the BA of the CP. Therefore, the DU intervention leads to considerable volume growth losses, at least temporarily.
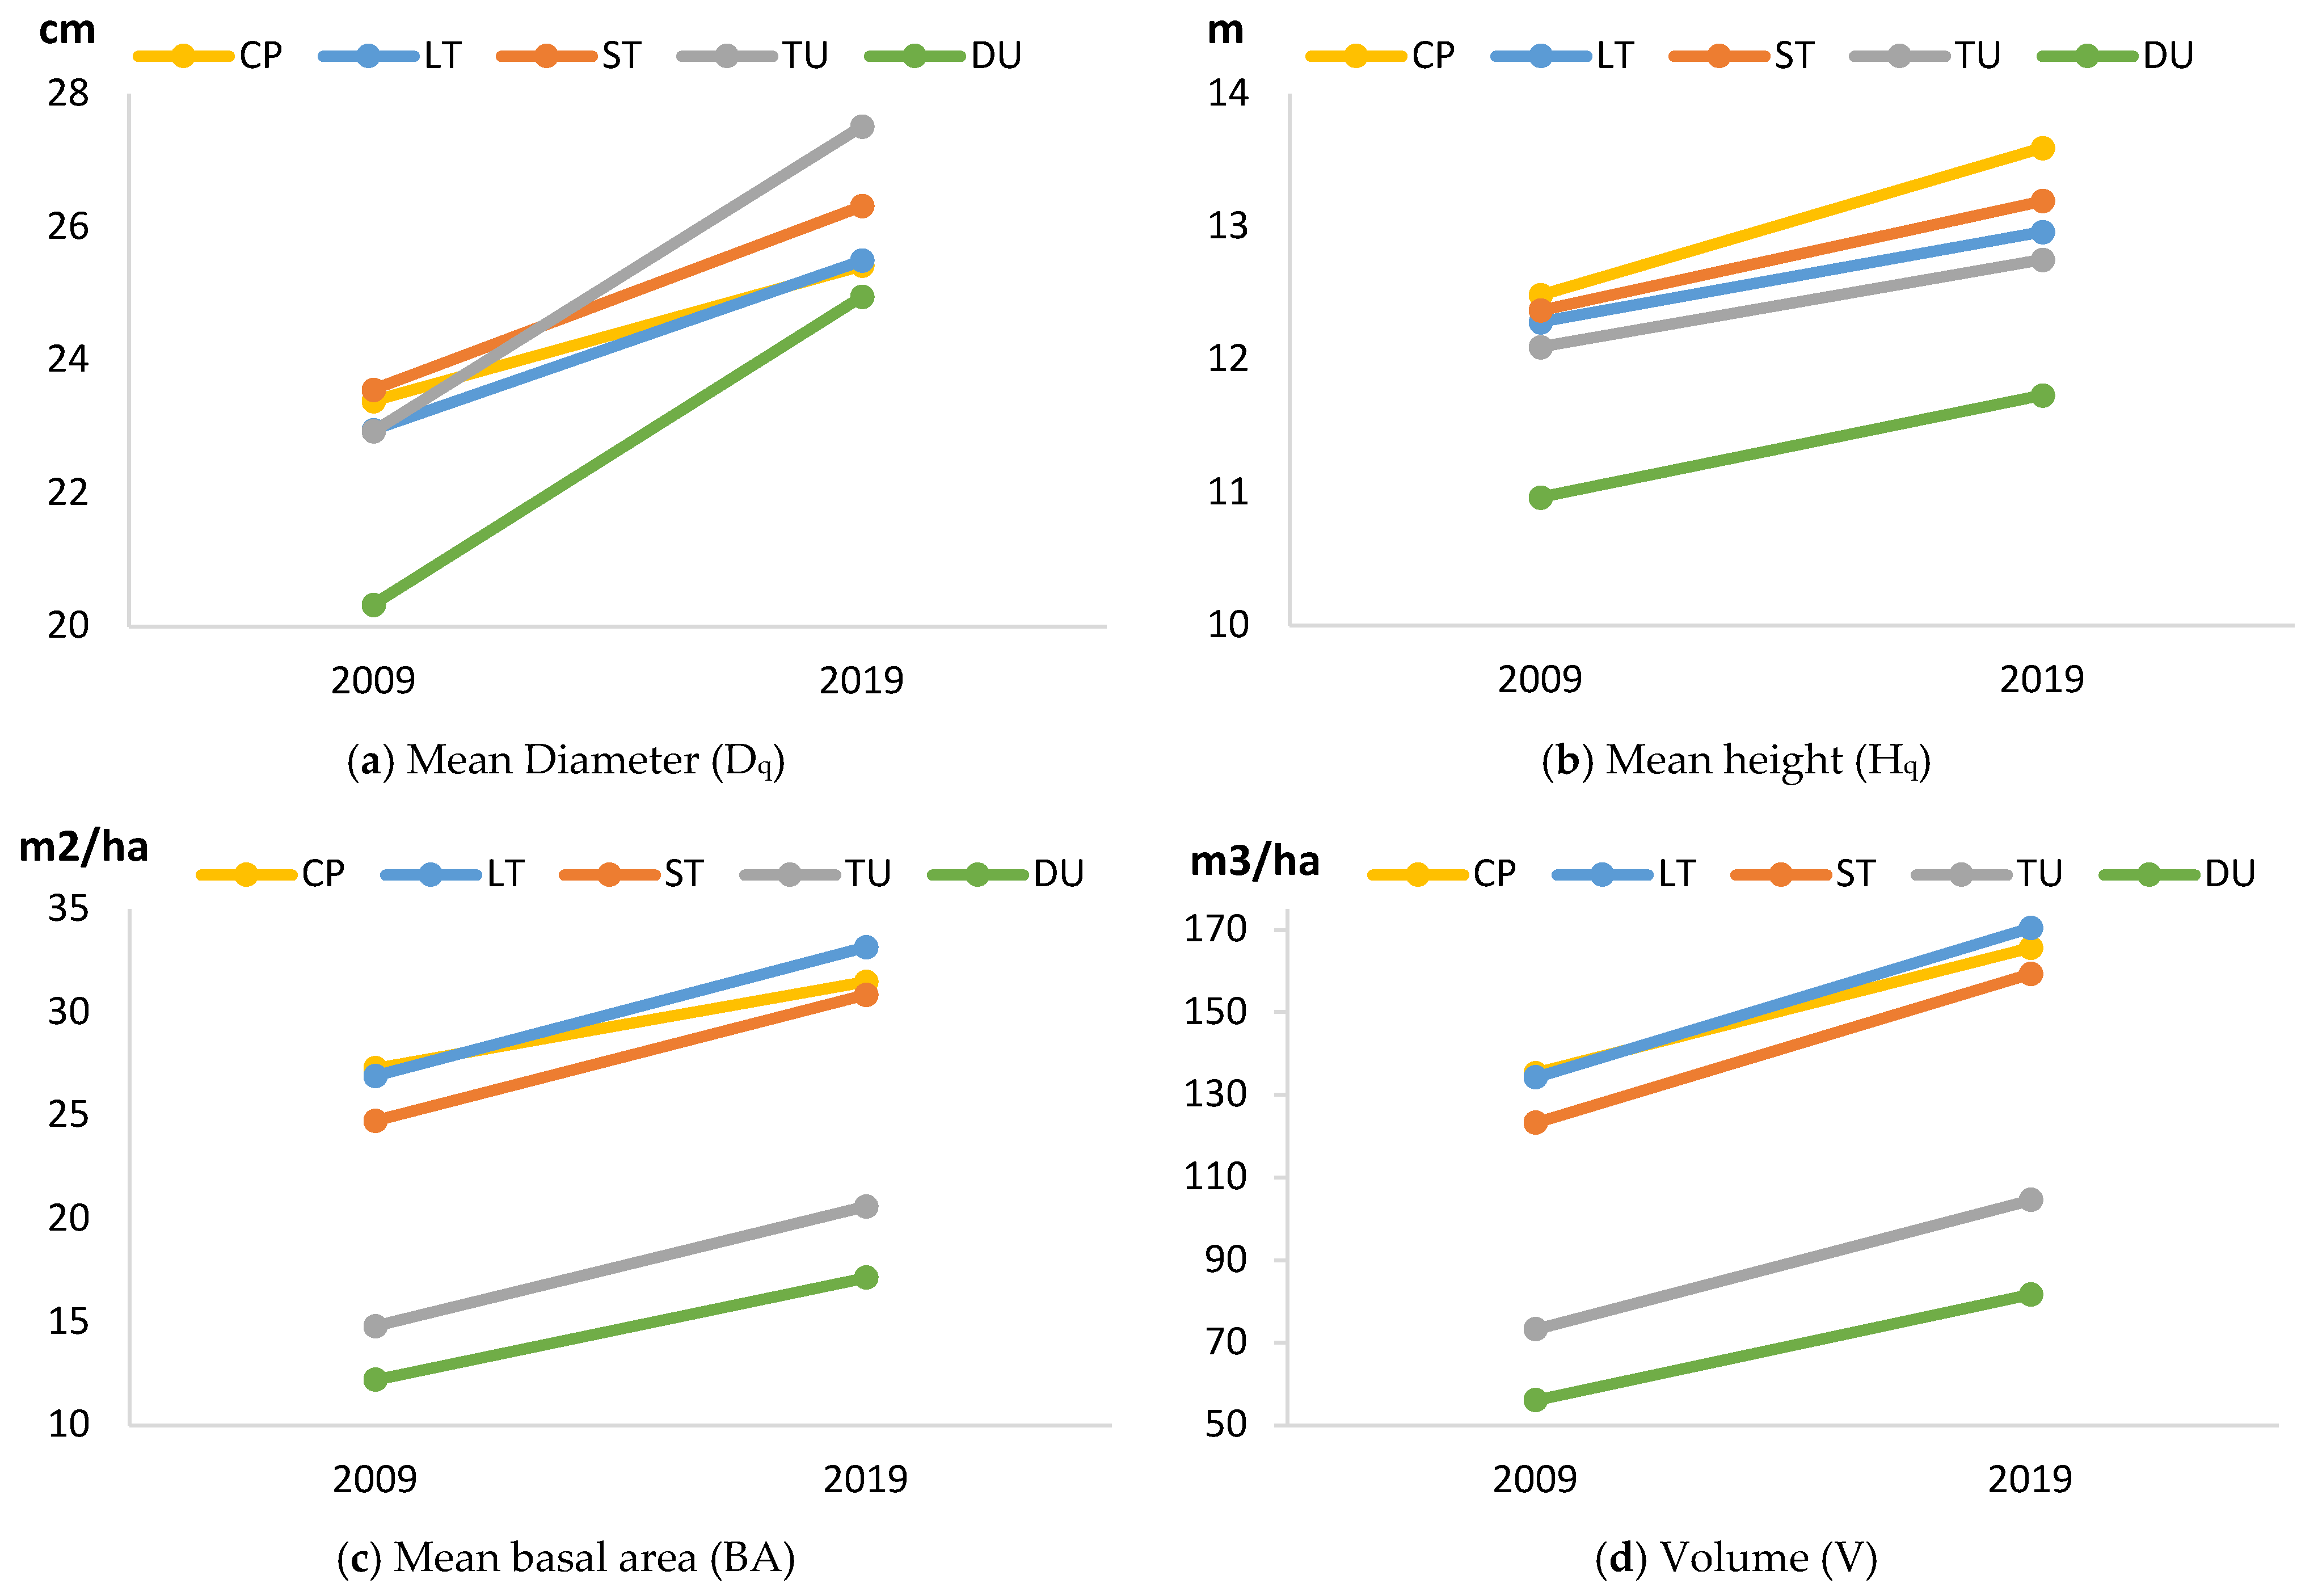
Alternatively, Figure 4 provides a visual interpretation of the data from Table 2. It represents the average of Dq, Hq, BA, and V in 2009 and 2019 for each silvicultural treatment. Figure 4 displays that there are no significant differences among treatments in terms of growth of Hq (4b), BA (4c), and V (4d), because the slope is similar. However, for Dq, there is a significant variation in the slope of the TU and DU treatments compared to the rest (4a).
In addition, Figure 4 shows that the BA and V magnitudes of the stocks within the DU and TU groups are significantly lower than those of the others. The same occurs with Hq and Dq of the DU-treated individuals. Despite the lower Dq in the DU trees in 2009, this magnitude increases enough to compensate for the initial gap ten years later.
Regarding the evolution of the CP individuals, the variables Dq, BA, and V display a lower rise among all treatments. Just Hq in CP stands shows a stronger increase due to high-light competence, which promotes stand instability due to critical h/d factors.
Figure 5 reveals that the increase in the unitary volume of the average tree is very similar in all the treatments. However, regarding absolute values, DU leads to a slightly lower increase than the other silvicultural treatments.
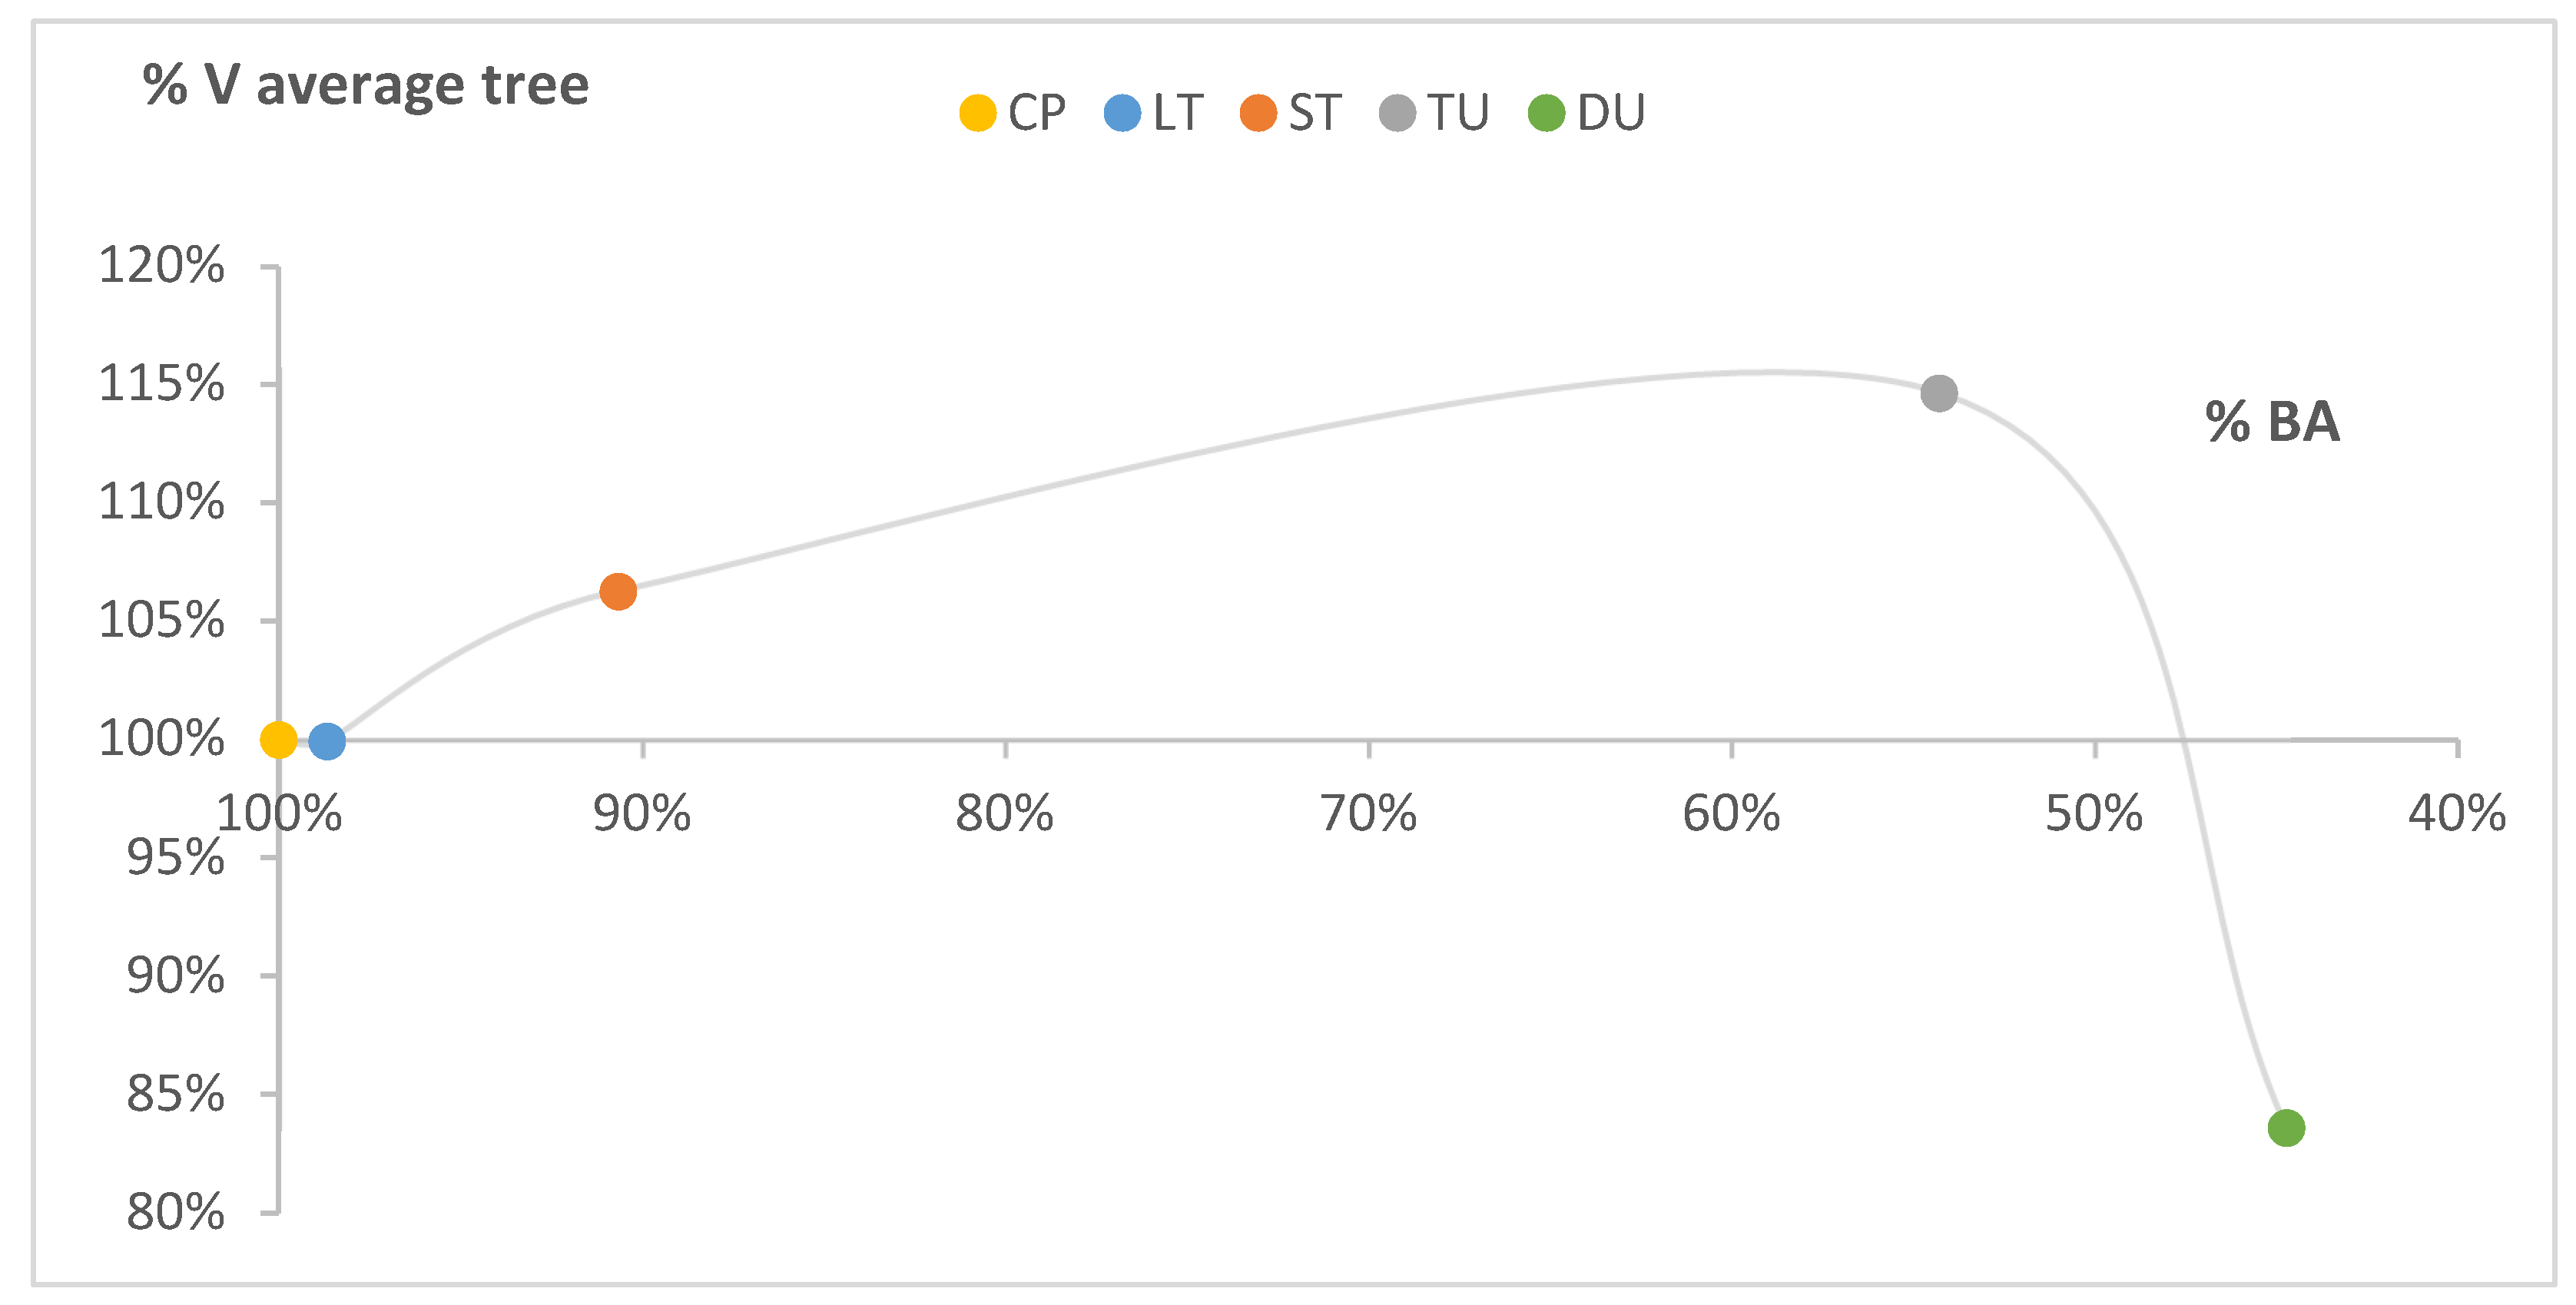
Figure 6 represents the relative variation in the unitary volume of each treatment regarding the corresponding magnitude in the CP stands (100%) against its respective BA value compared to the CP magnitude (100%). It shows that the stronger the treatment intensity, the higher the unitary volume of the mean tree. This can be explained by the fact that a density reduction implies a greater spacing among trees. This leads to a larger diameter growth and, therefore, a volume increase. However, a decrease in the unitary volume of the average tree in the DU treatment is appreciable (Figure 6). This occurs as the unitary volume is strongly influenced by the thinnest trees that remain standing, whereas the most vigorous trees are mostly removed. This is another sign that the DU treatment leads to a loss of quality and growth. Remarkably, the growth pattern within LT and CP plots for the unitary volume and the BA is very similar and relatively modest. Thus, LT does not considerably contribute to the stand growth and its resilience.
Finally, Kruskal–Wallis and Tukey’s post hoc tests with a significance level of 0.05 were carried out for the periodic increase in Dq, Hq, and unitary volume of the average tree to evaluate the impact of the treatments on these three variables. The statistical analysis only indicates significant differences among treatments in the periodic growth in Dq values. In this regard, individual trees react to large clearings by considerably increasing their Dq. In even-aged stands, especially reforested stands, and according to [31], Hq usually varies little with the Dq. Thus, the slightly larger periodic growth in height in unmanaged control plots could be explained by the need for light and, thus, height in dense stands. Alternatively, the statistical analysis of the periodic growth of BA, the unitary volume, and the total accumulated unitary volume does not show any significant differences. However, previous data exploration for DU-treated stands (Figure 4 and Figure 5) suggested that there could be a considerable reduction in growth in the DU treatment in the coming years.
Individual results of the different sample plots for each of the thinning treatment can be seen in “S2: The stands state characteristics along the study (2009–2019)” of the Supplementary Materials section.

3.2. Impact of Extreme Weather Events of 2010 and 2017

Wind and snowstorms in 2010 and 2017 caused a significant windthrow of trees in the research plots. These events allowed us to assess the stability of the stands related to the different applied treatments. In this regard, Table 3 shows the state of the research plots before the 2010 windthrow and the main features of the thrown trees.
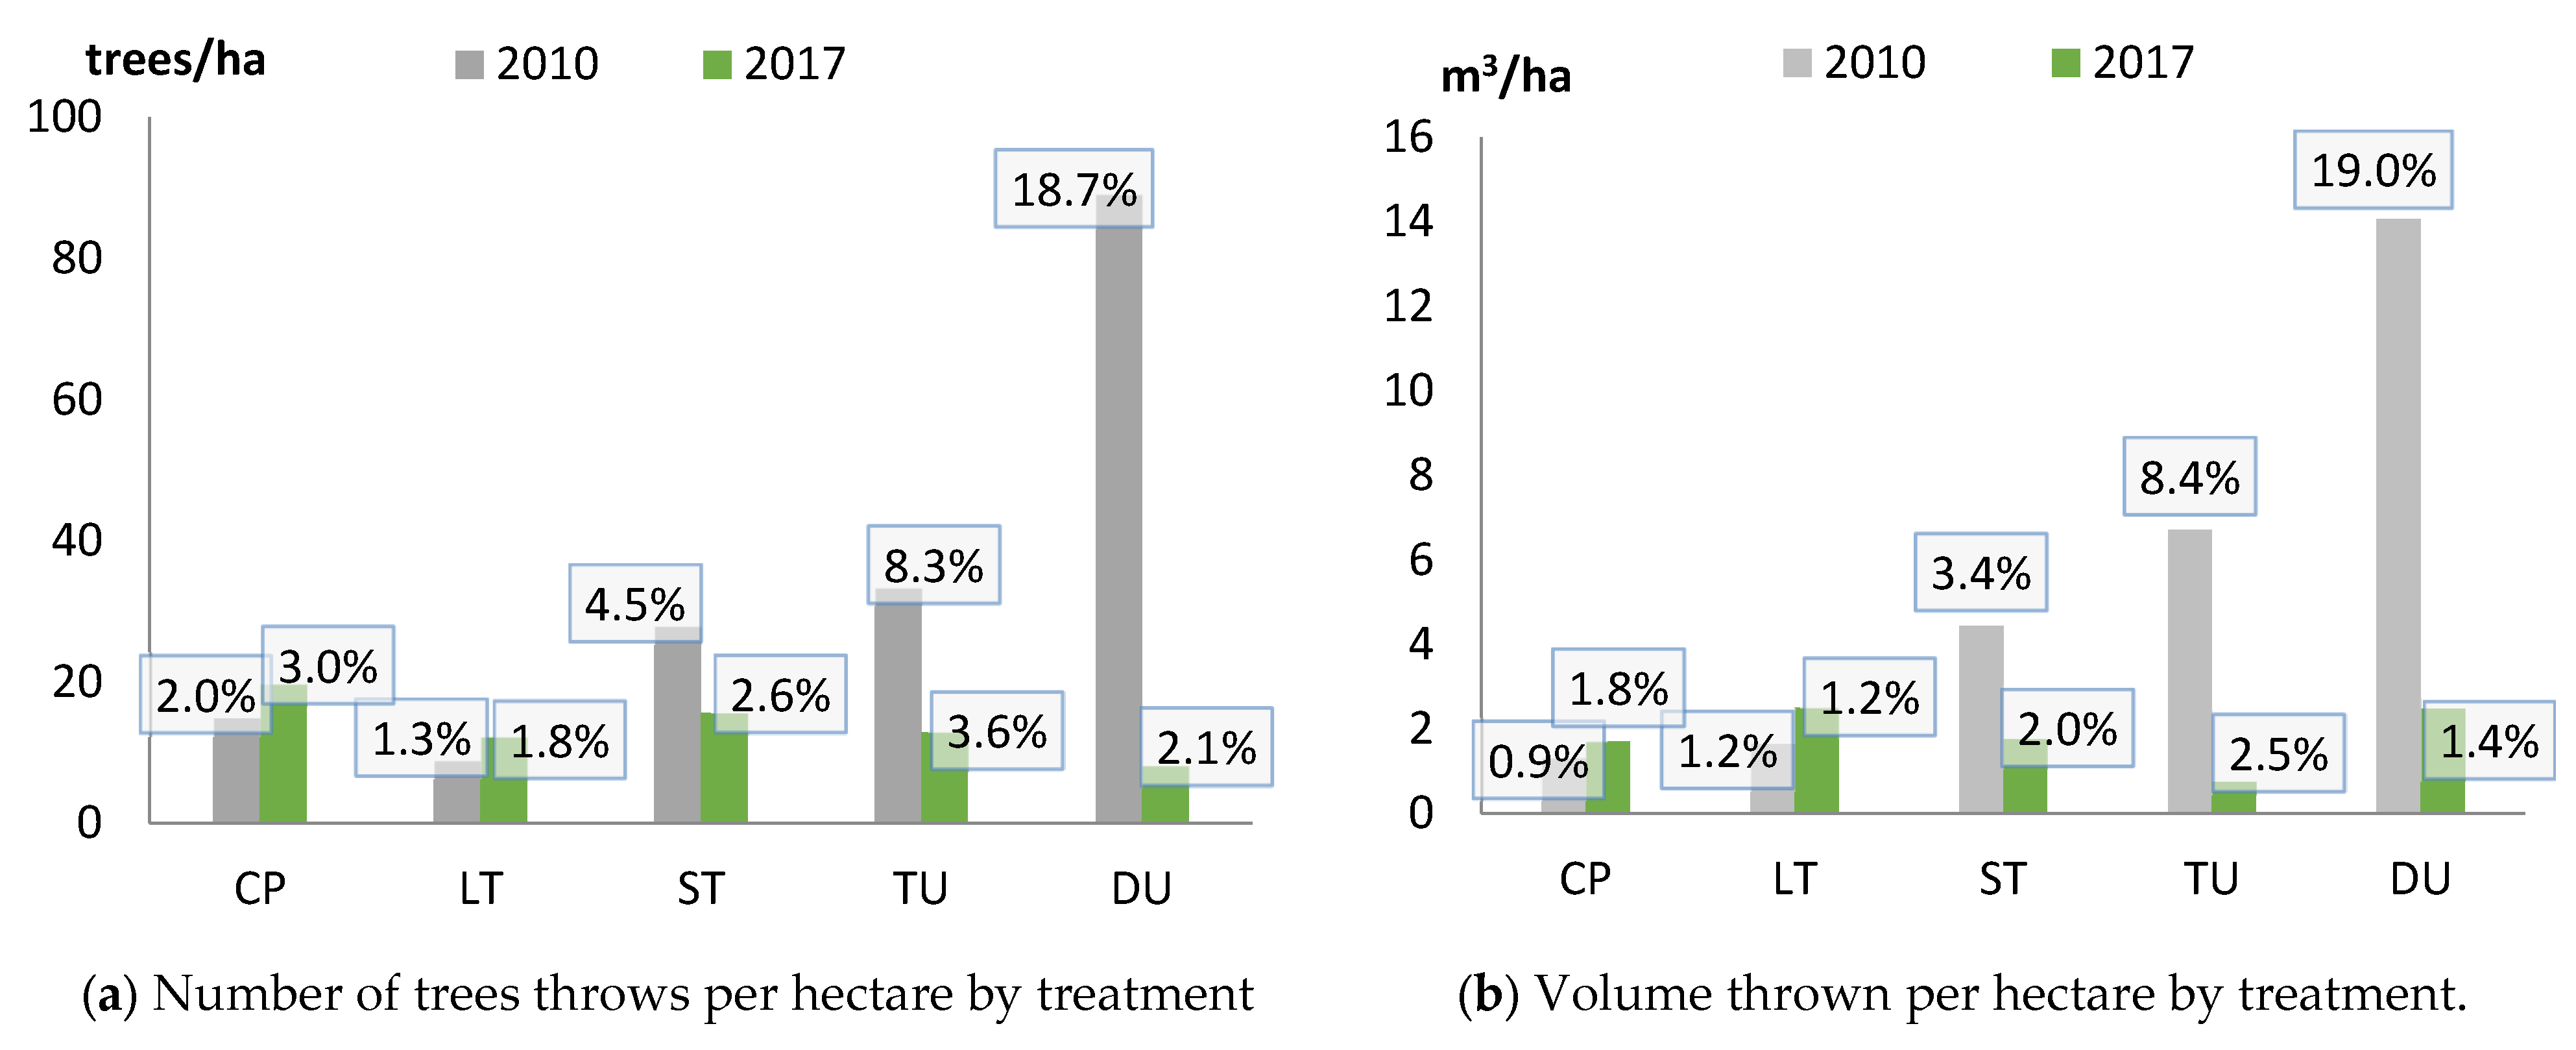
It has to be noted that the interventions in 2009 caused temporary instability in the treated stands as the canopy was substantively opened. The resistance of the trees to the wind in the short term depends on the group but also individual stability. Thus, individual mid-term trees react to greater wind exposure by increasing diametric growth and reducing height growth. This way, the slenderness index is reduced and the overall basal area increases [37]. However, the damage caused by the 2010 windthrow was considerable, especially in the more intensive treatments (TU and DU). This was due to the short time (just one year) that passed between the treatments and the weather event. Thus, that period was insufficient for the trees to reach the mid-term stabilization mentioned by [37]. An alternative situation occurred for the 2017 windthrow as the time window after the treatments of 2009 was much larger. In the 2010 windthrow, CP, LT, and ST ranged from 0.9% to 4.5% in N, Dq, BA, and V, while TU doubled the highest figures of the previous parameters (8.3%–8.4%) and DU quadrupled them (18.7%–19.0%). In advanced ages, the capacity to respond to fellings, especially the most intensive ones affecting the dominant strata, is lower [38]. Hence, extreme weather conditions mainly affected those unable to improve their stability by increasing their diametric growth and reducing their slenderness.
Moreover, Table 4 shows the main parameters of the research plots for each treatment after 2010 and after the 2017 windthrow. The thrown tree proportion in each treatment ranges between 2% and 3% of the previous tree numbers. Low values (1.2%–3.6%) in N, Dq, BA, and V can be seen without any clear tendency in the different treatments. Thus, although the most intensive treatment (DU) caused a high predisposition to windthrow, this was just a relatively short-term impact diluted after eight years.
Finally, the comparison of both windthrows reveals that the damage caused by the 2010 one was far more significant (Figure 7). The lower losses of the 2017 event highlight the positive effect of the interventions on the stand stability. Thus, the period of eight years (2009) after the treatment application was enough to improve the average individual stability of the stand, reducing the susceptibility to windthrow. However, it can be seen that the impact of the windthrow in the lighter treatments (CP, LT) was much greater in the second weather event compared to the stronger ones (ST, TU, DU). In the first group of interventions, a larger stock was thrown in 2017 than in 2010. However, the opposite occurred in the strongly treated individuals: fewer trees were affected by the wind in 2017 than in 2010, that is, many years after the fellings.
In even-aged stands below 60 years and despite the higher slenderness indices, the high density of individuals hinders air circulation, reducing the magnitude of the force exerted by the wind on the trees [39], leading to a less intense windthrow that masks posterior collapse risks. Later, the lability tendency shifts to the dense and less managed stands.

3.3. Regeneration and Shrub Cover Evaluation by Treatment

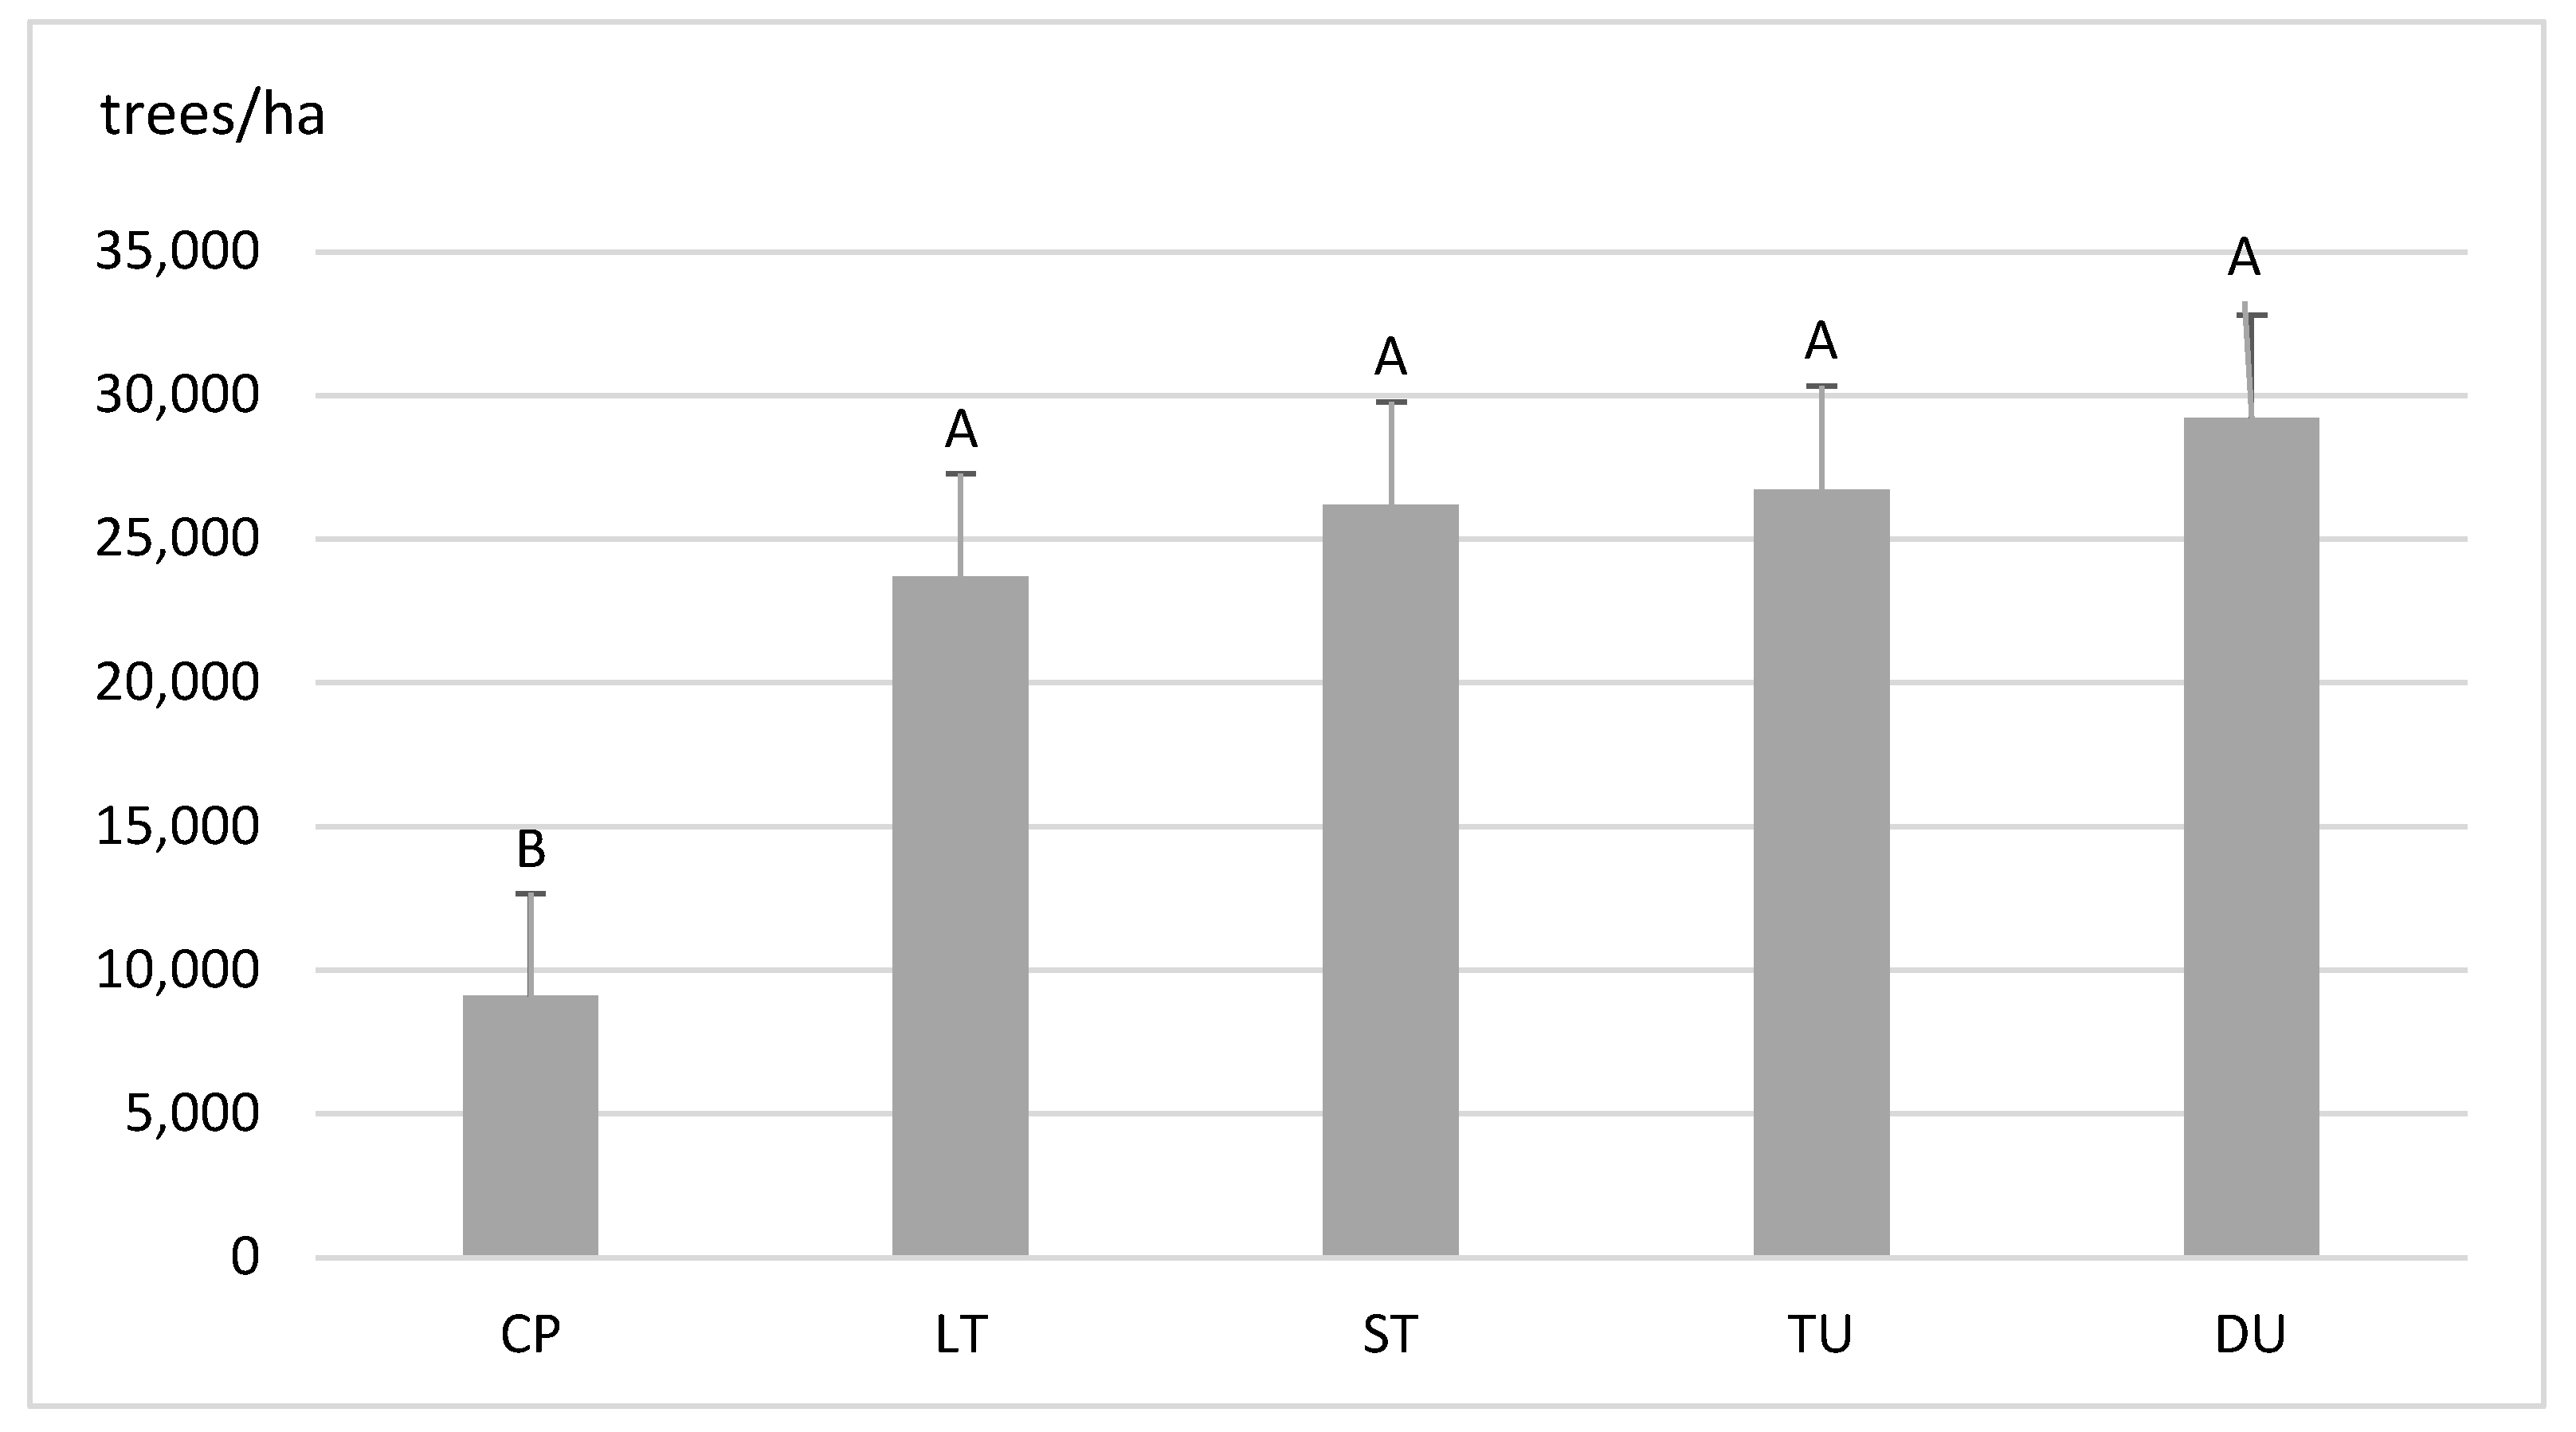
Figure 8 compares the different treatments’ juveniles (trees below 0.25 m). It notes that the seedling density in the control plots is significantly lower than the corresponding magnitude for the rest of the treatments. The average density of the control plots is lower than 10,000 trees/ha and that of the other treatments is around 25,000 trees/ha.
In order to regenerate, Pinus halepensis requires much light during its first years [31]. Therefore, in the CP, the juveniles have a greater difficulty developing correctly or surviving as the very dense canopy impedes light penetration. In addition, Figure 8 suggests a slightly increasing correlation between the regeneration and the felling intensity. This can be appreciated in TU and DU plots, corroborating the light species character of Pinus halepensis.
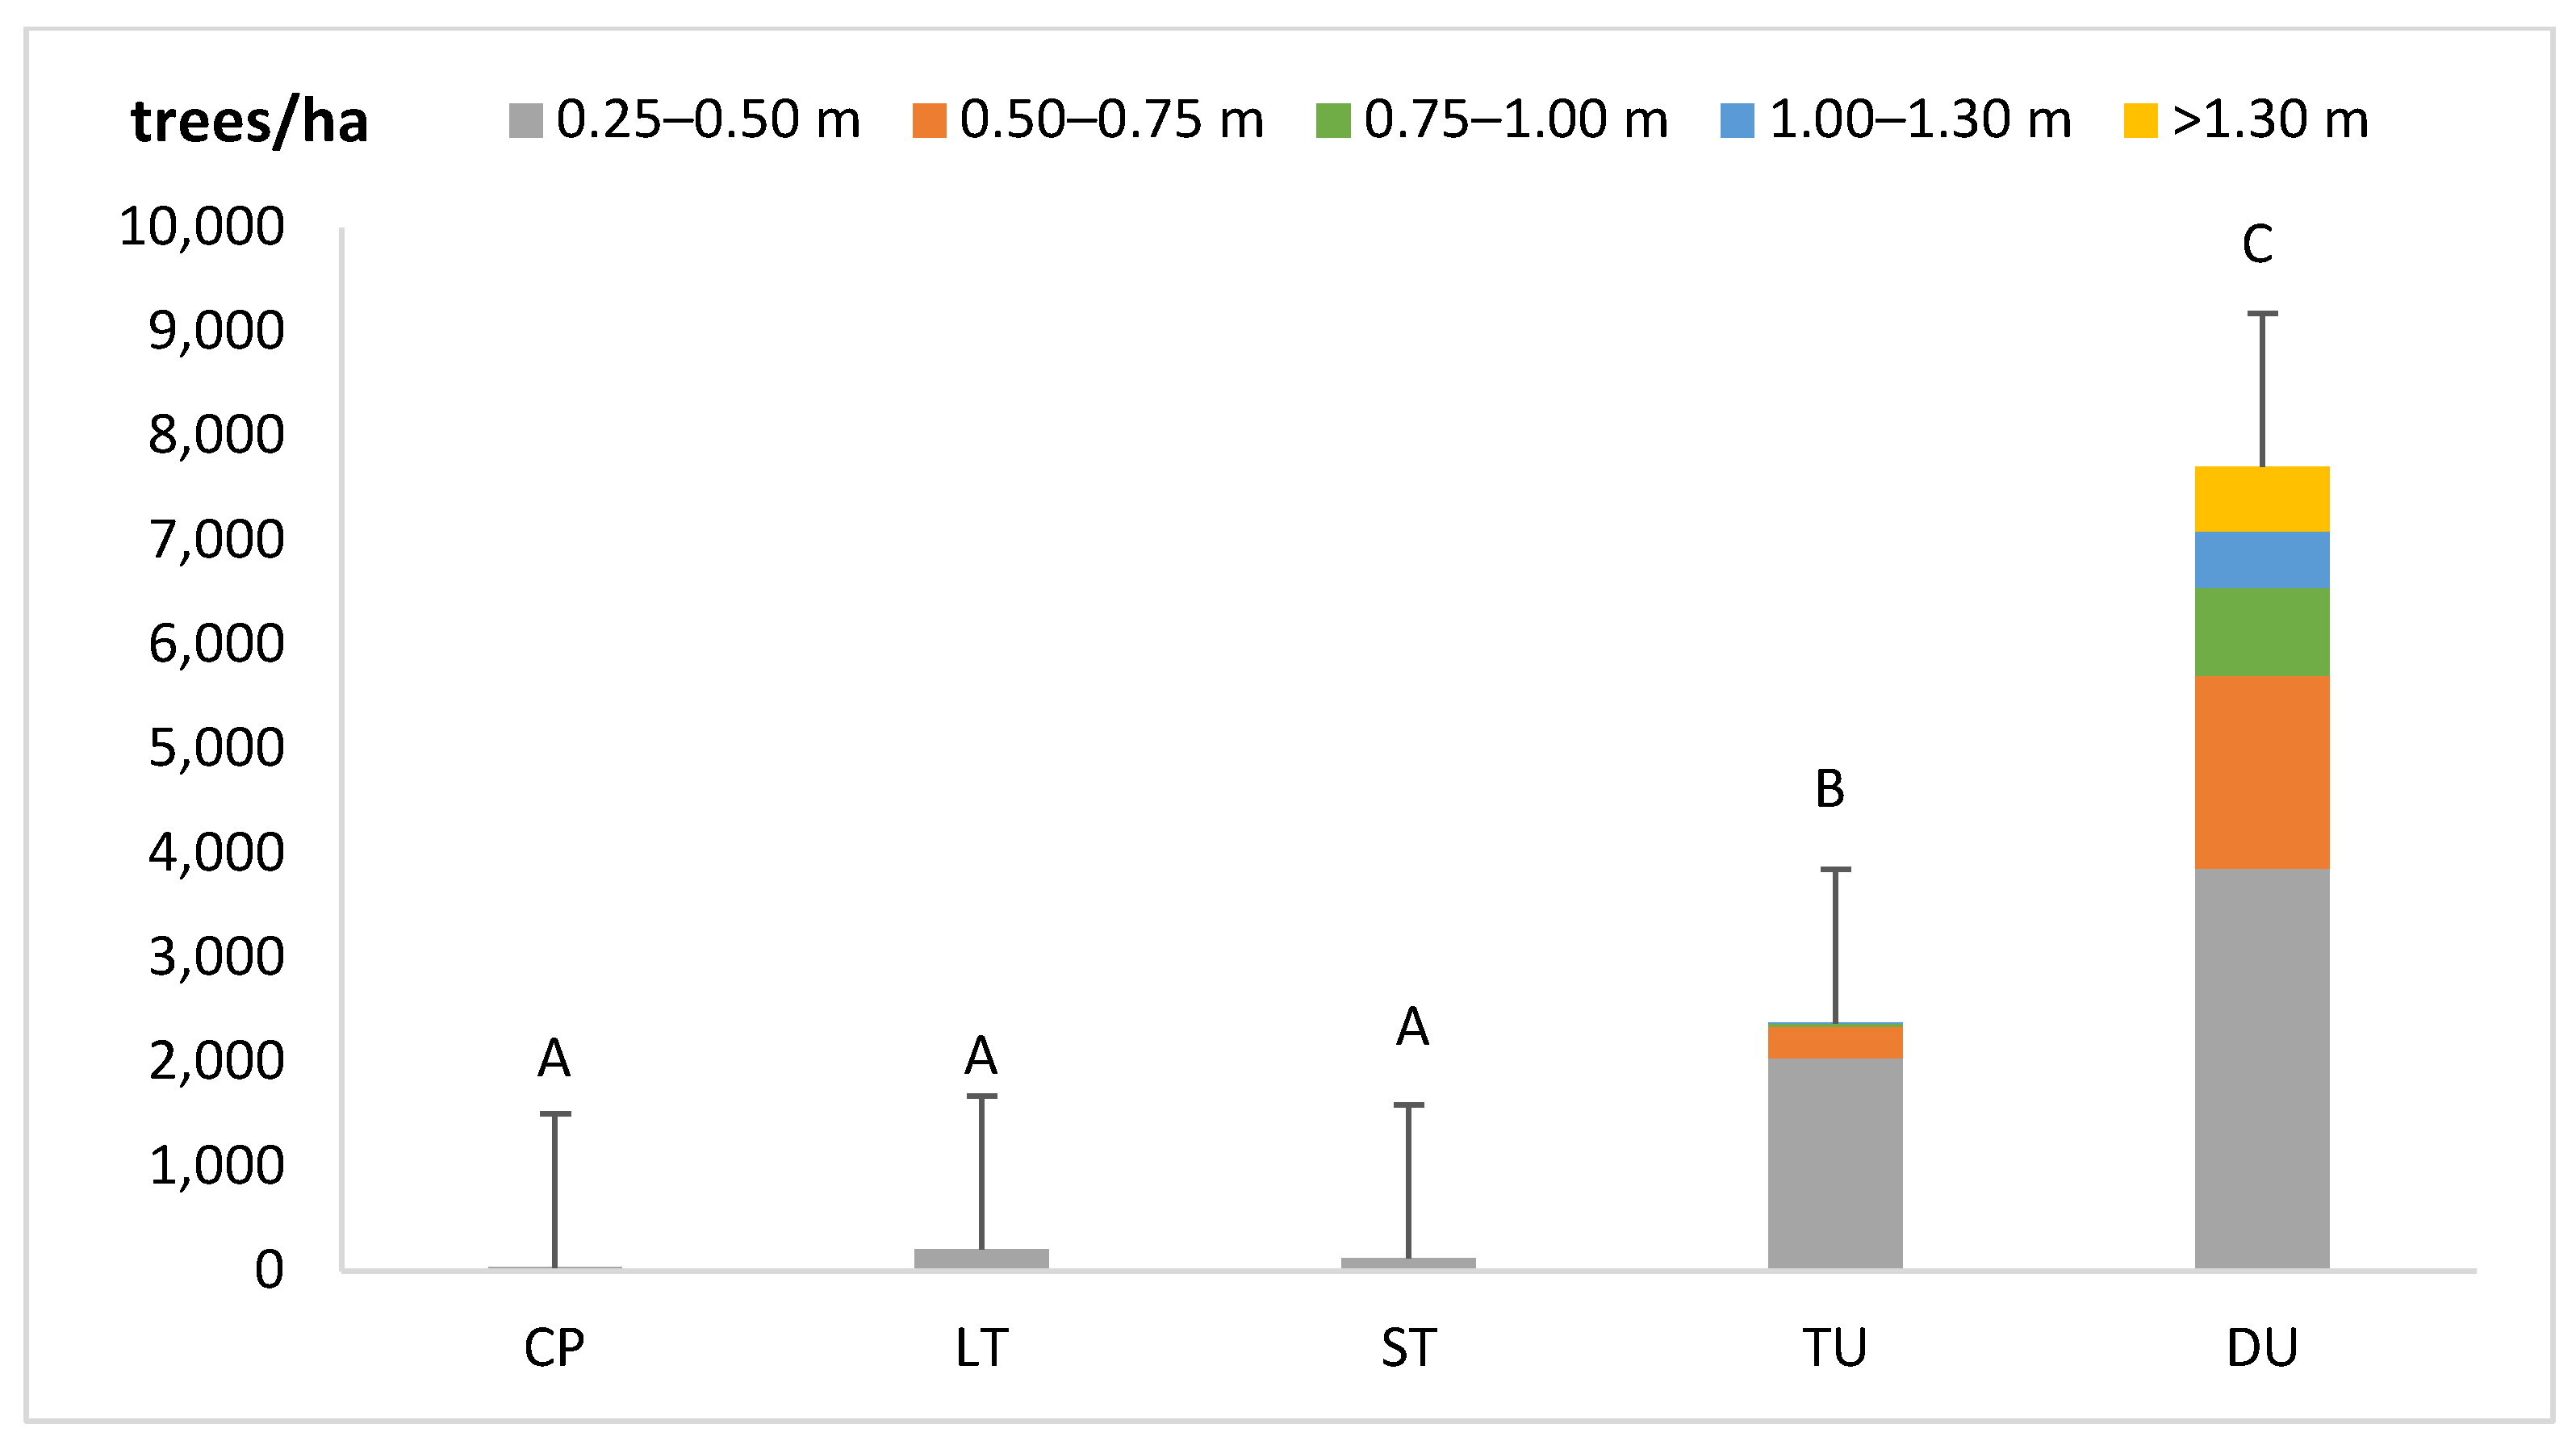
Furthermore, Figure 9 analyzes the development and the real changes of regeneration survival considering the light species nature of Pinus halepensis. In particular, plots treated with LT or ST show a regeneration restricted to tiny young trees (trees with a height between 0.25 and 0.50 m). Nevertheless, the regeneration of young trees in the TU- and DU-treated plots is more solid and displays a more significant height variability.
DU plots present the highest number of juveniles per hectare (7708/ha on average). In addition, 8% of regenerated trees display a height above 1.3 m. TU treatment plots present an average juveniles density of 2500 trees/ha, that is, less than 1/3 of the equivalent DU magnitude. It should also be recalled that most individuals are at most 0.75 m. This could be explained by the fact that the TU intervention aims for a gradual regeneration, allowing differentiated age classes over time [31], while DU management generates, in practice, a stand with 2–3 coexisting age classes. Nevertheless, DU promotes regeneration due to the extraction of the thickest trees, favoring light penetration.
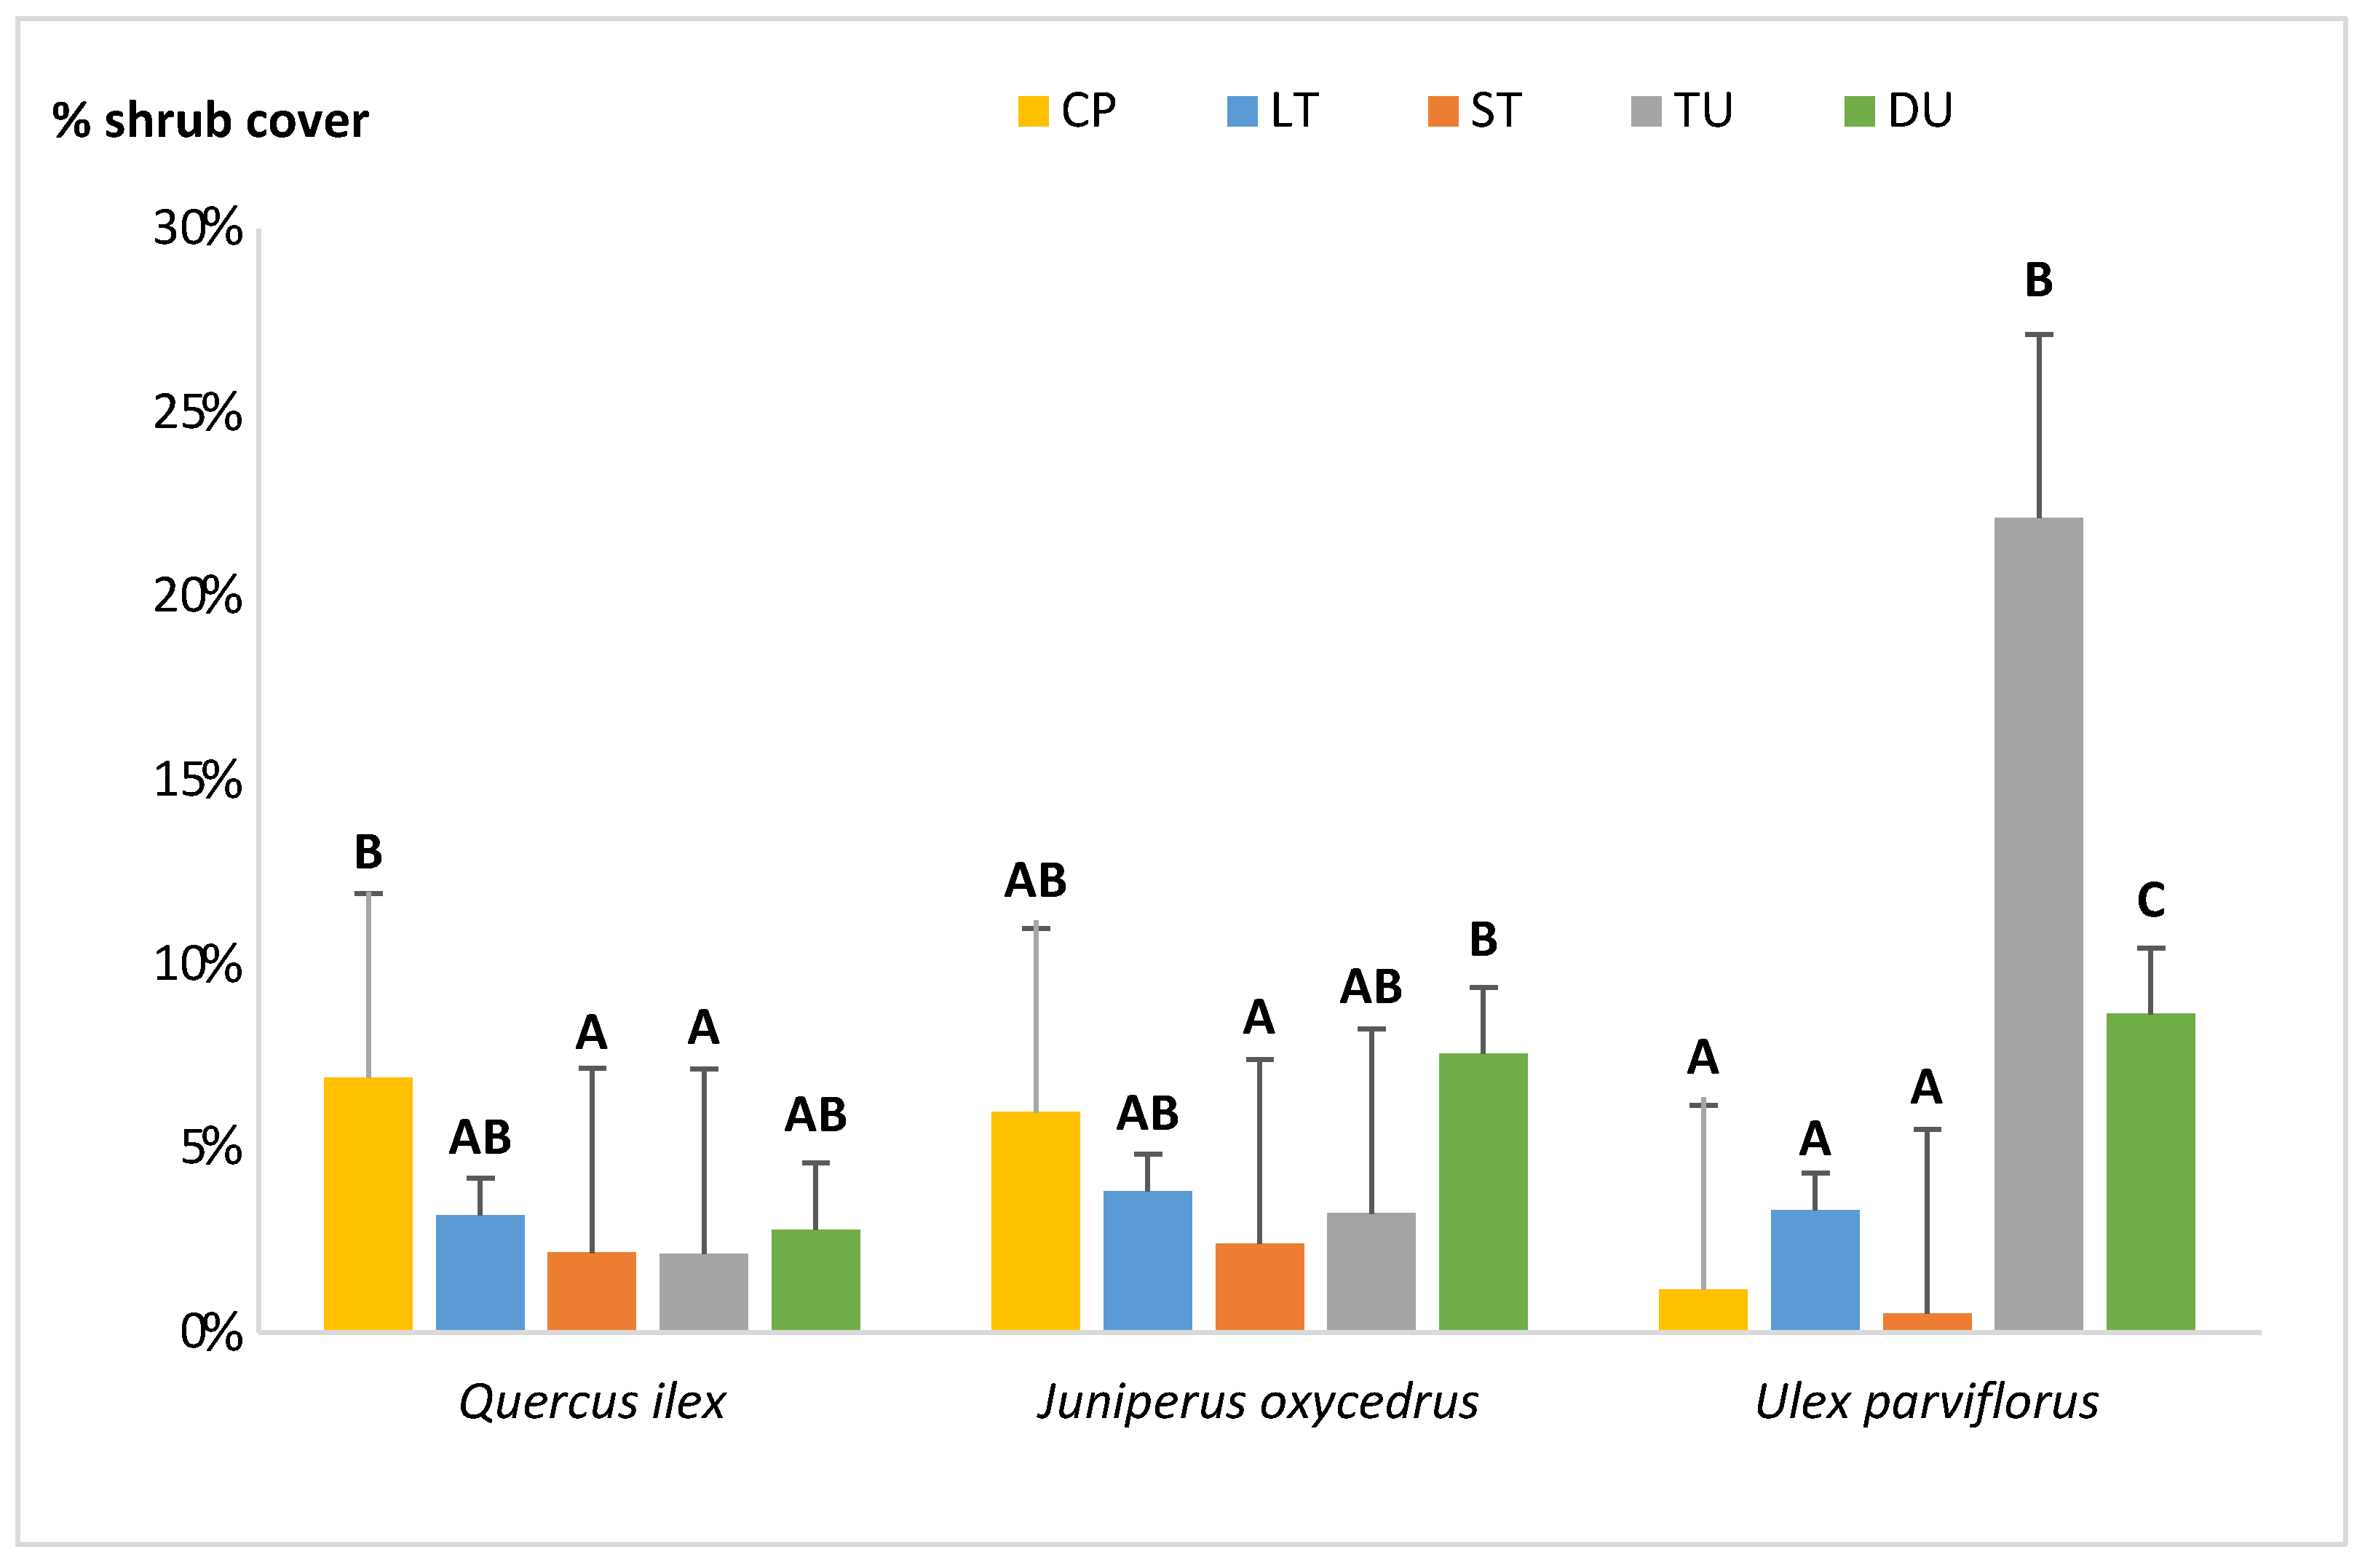
The understory cover highly conditions the development of the regeneration. Therefore, the presence of various shrub species has also been statistically analyzed. The assessed species are Quercus ilex L., Juniperus oxycedrus L., and Ulex parviflorus due to their abundance and coverage share that influences the regeneration development. Figure 10 shows that the three species present some significant differences in coverage share in the different treatments applied.
In the case of Quercus ilex, its highest coverage was noted in the CP, followed by DU- and LT-treated plots, while the lowest coverage was found in the TU and ST stands (Figure 10). Statistical differences were only found in the case of CP when compared to ST and TU plots. A certain similar pattern can be found in the cover of Juniperus oxycedrus. However, the highest coverage in this case appeared in DU plots followed by the CP and LT. The lowest coverage occurred in the TU and ST stands. A statistical difference was found between DU and ST trees.
These two species—Quercus ilex and Juniperus oxycedrus—are primarily of vegetative origin, sprouting from the remaining trees/shrubs among the fields where stones were set aside by the farmers. This fact and the presence of former field edges in the different plots could explain this dissimilarity. Additionally, the obtained results for these two species must be taken carefully as their coverage percentages are very low (less than 10% in all cases). In addition, the high variability in the data could be masking the real trend in its distribution.
Finally, Ulex parviflorus is more abundant in the TU plots (average cover of 22%) followed by DU plots (average cover of 9%), showing significant differences between them but also when compared to the other three treatments that do not display substantial differences among the three types of interventions. Its presence in the CP and ST plots is rare.
The differentiated distribution of this species in the different treatments could be explained by the fact that Ulex parviflorus shows a clear light behavior with progressive light demand together with a seed regeneration preference in absence of a fire event. This could explain its more remarkable presence in TU than in DU plots as there was a slightly smaller and evenly distributed stand opening in the first case than in the second. In addition, its abundant presence in the TU plots could explain the lower regeneration of Pinus halepensis within these plots compared to those treated with DU management due to the stronger light competition and the faster growth of Ulex parviflorus. This species displays a dual regeneration pattern, one well-researched tendency linked to fire [40] and another in the absence thereof, requiring a steadier canopy opening.

4. Conclusions

This paper presents experimental research on silvicultural treatments applied to mid-aged even-aged Pinus halepensis permanent plots in Eastern Spain.
The periodic growth in the 60-year-old stands suggests that they have already reached the age of maximum mean annual growth in basal area, mean diameter, and mean height but not yet in volume. The forest growth parameters were checked compared to the existing yield tables for this species [16], showing a higher growth (25%) as it would correspond to the given site quality in both thinning intensities (LT, ST). This highlights the need to fine-tune the national-wide single-yield tables of this species to the specific regional conditions.
This research confirms that the periodic growth in mean diameter rises with the felling intensity of the corresponding treatment. However, observed trends in the periodic growth of volume indicate that DU treatment reduces long-term production, whose evolution will need longer monitoring.
The volume in the plots treated with TU and DU is lower than that of the other treatments due to the higher felling volume. Though the plots treated with TU were able to improve the mean tree’s periodic growth in volume and unitary volume compared to the control plots after ten years, the plots managed under DU were not. Further research is needed to shed light on the reasons behind the differences in each treatment in volume and other growth-related parameters.
To gain a complete picture, resilience to perturbances is a crucial factor to consider. The results show a possible destabilization of high tree density even-aged stands of P. halepensis from 70 years on and highlights the risks of postponing thinnings. Extreme weather events of snow and windthrow in 2010 and 2017 allowed us to evaluate the stability of the stands depending on the treatment applied. The treatments carried out in 2009 improved the average individual stability of all the treated stands, including DU plots. Therefore, treatments that substantially affect the density of regular middle-aged stands carry a moderate immediate risk in the case of strong winds or snowfall, a risk that is attenuated after a short period.
The analysis of regeneration shows that the number of juveniles in the control plots is significantly lower than in the rest of the interventions, which reflects that Pinus halepensis is a light species. In addition, the comparison between the number of seedlings and the number of tree regenerations higher than 0.25 m confirms the high mortality rate of juveniles. Even in DU plots, which are the most favored in regeneration, the number of juveniles above one year does not even reach a third of all. Furthermore, the young tree regeneration is only relevant in TU and DU. In terms of height, DU shows by far a much faster development of viable regeneration than TU.
In addition, the shrub cover of Ulex parviflorus is significantly more abundant in these treatments than in the others. It is interesting to note that the coverage of this species is significantly higher in the case of TU than in DU, indicating a not quoted dual regeneration strategy of this species: (a) post-fire well-known regeneration and (b) a default one in the case of fire absence by opening stands and reducing the coverage around 40%. This corroborates the pioneer nature of the species. Thus, the thicker shrub cover hinders the development of the Pinus halepensis regeneration.
Finally, the results are still too premature to identify a clear advantage among the applied interventions. However, ST treatments are a plausible alternative if the goal is to keep the even-aged structure stands. In fact, due to the minor differences between light and strong thinning as defined in the applied yield tables, a more vigorous thinning intensity might be considered for younger stands (30–50). Possibly, future research plots will face this knowledge gap.
In high slopes, small estates, and when a single age class is extensively present and there is a need to diversify the age classes, uneven-aged structures show advantages regarding maintaining periodic growth, regeneration, and stability. The TU treatment is especially appropriate to reduce the volume growth and windthrow risk, even for a short period. Finally, the DU treatment presents some risks related to its higher vulnerability to extreme weather events during the following years and due to the significant volume loss caused by structural and genetic regression effects on the stands if interventions are recurrently applied. However, DU treatment has the advantage of fast regeneration and a sooner investment recovery of the afforestation costs. An intermediate intervention of both treatments could be considered by combining the degree of opening of the DU treatment and the positive selection of the trees to fell of the TU one. Increasing the canopy’s opening from 40% in TU to 50%–60%, as applied in DU, would be crucial to speed up the regeneration in a light species such as Pinus halepensis, while reducing the windthrow risk and avoiding significant volume growth losses.

Supplementary Materials

The following supporting information can be downloaded at: https://www.mdpi.com/article/10.3390/f14030527/s1, Supplementary Material File S1: The plots inventory and main characteristics per plot. File S2: The stands state characteristics along the study (2009–2019).

Author Contributions

Conceptualization, E.R.-B.; methodology, E.R.-B.; validation, E.L.-S. and J.-V.O.-V.; formal analysis, E.R.-B. and V.L.-A.; investigation, E.R.-B.; data curation, D.F. and V.L.-A.; writing—original draft preparation, D.F. and E.L.-S.; writing—review and editing, E.L.-S., V.L.-A., E.R.-B. and J.-V.O.-V.; supervision, E.R.-B. and J.-V.O.-V.; project administration, E.R-B. and J.-V.O.-V. All authors have read and agreed to the published version of the manuscript.

Funding

This research was financially supported by Generalitat Valenciana in 2008–2010 and own UPV funds in 2017 and 2019.

Data Availability Statement

Data supporting reported results can be found in Supplementary Materials section.

Acknowledgments

We are grateful to the Conselleria de Territori i Habitatge for the support. We also want to include a special mention to Rafael Currás Cayón, Director of Centre d’Investigació i Experimentació Forestal (CIEF) of the Generalitat Valenciana (GVA) and to Joany Jovani Sancho, Vicent Agustí Ribas Costa (supporting MSc Forestry students), Santiago Martín Alcón (forest researcher), and Baltasar Benavente Catalán (forest ranger of Ayora). Finally, we also thank Eva Samblas Vives (University of Alcalà de Henares), who made the measurements in 2019 and Alejandro Poveda López (afiliación Treemetrics Ltd.Ireland) for designing the research plots.

Conflicts of Interest

The authors declare no conflict of interest.

References

  1. Fady, B.; Semerci, H.; Vendramin, G.G. EUFORGEN Technical Guidelines for Genetic Conservation and Use for Aleppo Pine (Pinus halepensis) and Brutia Pine (Pinus brutia); Bioversity International: Rome, Italy, 2003; Available online: https://www.bioversityinternational.org/fileadmin/user_upload/online_library/publications/pdfs/858.pdf (accessed on 18 January 2023).
  2. Mauri, A.; di Leo, M.; de Rigo, D.; Caudullo, G. Pinus halepensis and Pinus brutia in Europe: Distribution, Habitat, Usage and Threats; European Atlas of Forest Tree Species. Publ. Off. EU: Luxembourg, 2016; Available online: https://forest.jrc.ec.europa.eu/media/atlas/Pinus_halepensis_brutia.pdf (accessed on 18 January 2023).
  3. Farjon, A. A Handbook of the World’s Conifers; Brill Publishers: Leiden, The Netherlands, 2010. [Google Scholar] [CrossRef]
  4. De Luis, M.; Čufar, K.; Di Filippo, A.; Novak, K.; Papadopoulos, A.; Piovesan, G.; Rathgeber, C.B.K.; Raventós, J.; Saz, M.A.; Smith, K.T. Plasticity in Dendroclimatic Response across the Distribution Range of Aleppo Pine (Pinus halepensis). PLoS ONE 2013, 8, e83550. [Google Scholar] [CrossRef] [PubMed]
  5. Korol, L.; Madmony, A.; Riov, Y.; Schiller, G. Pinus halepensis x Pinus brutia subspbrutia hybrids? Identification using morphological and biochemical traits. Silvae Genet. 1995, 44, 186–190. [Google Scholar]
  6. Allard, G.; Boglio, D.; Bizay, A.; Berrahmouni, N.; Besacier, C.; Colletti, M.; Conigliaro, M.; D’Annuzio, R.; Fages, B.; Garavaglia, V.; et al. State of Mediterranean Forests; FAO: Rome, Italy, 2013; Available online: https://www.miteco.gob.es/es/biodiversidad/temas/politica-forestal/state_of_mediterranean_forests_tcm30-155818.pdf (accessed on 18 January 2023).
  7. Buhk, C.; Meyn, A.; Jentsch, A. The challenge of plant regeneration after fire in the Mediterranean Basin: Scientific gaps in our knowledge on plant strategies and evolution of traits. Plant Ecol. 2007, 192, 1–19. [Google Scholar] [CrossRef]
  8. Moreira, F.; Arianoutsou, M.; Corona, P.; de las Heras, J. (Eds.) Post-Fire Management of Serotinous Pine Forests; Springer Netherlands: Dordrecht, The Netherlands, 2012. [Google Scholar] [CrossRef]
  9. Urli, M.; Delzon, S.; Eyermann, A.; Couallier, V.; García-Valdés, R.; Zavala, M.A.; Porté, A.J. Inferring shifts in tree species distribution using asymmetric distribution curves: A case study in the Iberian mountains. J. Veg. Sci. 2014, 25, 147–159. [Google Scholar] [CrossRef]
  10. Rathgeber, C.; Nicault, A.; Guiot, J.; Keller, T.; Guibal, F.; Roche, P. Simulated responses of Pinus halepensis forest productivity to climatic change and CO2 increase using a statistical model. Glob. Planet Chang. 2000, 26, 405–421. [Google Scholar] [CrossRef]
  11. Thuiller, W. BIOMOD—Optimizing predictions of species distributions and projecting potential future shifts under global change. Glob. Chang. Biol. 2003, 9, 1353–1362. [Google Scholar] [CrossRef]
  12. Delgado-Artés, R.; Garófano-Gómez, V.; Oliver-Villanueva, J.-V.; Rojas-Briales, E. Land use/cover change analysis in the Mediterranean region: A regional case study of forest evolution in Castelló (Spain) over 50 years. Land Use Policy 2022, 114, 105967. [Google Scholar] [CrossRef]
  13. Ministry for the Ecological Transition and the Demographic Challenge. Spanish Forest Strategy 2050. Available online: www.miteco.gob.es/es/biodiversidad/temas/politica-forestal/estrategiaforestalespanolahorizonte2050_tcm30-549806.pdf (accessed on 18 January 2023).
  14. Bueis, T.; Turrión, M.-B.; Bravo, F. Stand and environmental data from Pinus halepensis Mill and Pinus sylvestris L. plantations in Spain. Ann. Sci. 2019, 76, 38. [Google Scholar] [CrossRef]
  15. Moghli, A.; Santana, V.M.; Soliveres, S.; Baeza, M.J. Thinning and plantation of resprouting species redirect overstocked pine stands towards more functional communities in the Mediterranean basin. Sci. Total Environ. 2022, 806, 150715. [Google Scholar] [CrossRef] [PubMed]
  16. Montero, G.; Cañellas, I.; Ruíz-Peinado, R. Growth and Yield Models for Pinus halepensis Mill. For. Syst. 2001, 10, 179–201. [Google Scholar]
  17. Osem, Y.; Yavlovich, H.; Zecharia, N.; Atzmon, N.; Moshe, Y.; Schiller, G. Fire-free natural regeneration in water limited Pinus halepensis forests: A silvicultural approach. Eur. J. Res. 2013, 132, 679–690. [Google Scholar] [CrossRef]
  18. Gil, F.T.M. The Restoration of the Vegetation Cover in Semi-Arid Zones Based on the Spatial Pattern of Biotic and Abiotic Factors; Universidad de Valencia: Valencia, Spain, 2002; Available online: https://rua.ua.es/dspace/bitstream/10045/10089/1/Maestre-Gil-Fernando-Tomas.pdf (accessed on 18 January 2023).
  19. Beltrán, M.; Piqué, M.; Vericat, P. Models de Gestió per Als Boscos de Pi Blanc (Pinus halepensis Mill.). Producció de Fusta i Prevenció d’Incendis Forestals; Centre de la Propietat Forestal—Departament d’Agricultura, Ramaderia, Pesca, Alimentació i Medi Natural: Barcelona, Spain, 2011; Available online: https://cpf.gencat.cat/web/.content/or_organismes/or04_centre_propietat_forestal/06-Publicacions/publicacions_tecniques/colleccions/orgest/models_de_gestio_forestal/orgest_models_de_gesti__per_als_boscos_de_pi_blanc/docs/pi_blanc.pdf (accessed on 18 January 2023).
  20. Mòdol, E.C.; Casals, M.V. Properties of Clear Wood and Structural Timber of Pinus halepensis from North-Eastern Spain. In Proceedings of the World Conference on Timber Engineering, Auckland, New Zealand, 16–19 July 2012; pp. 251–254. Available online: https://www.researchgate.net/publication/318562527_Properties_of_Clear_Wood_and_Structural_Timber_of_Pinus_Halepensis_from_North-Eastern_Spain#fullTextFileContent (accessed on 18 January 2023).
  21. Elaieb, M.T. Physical, mechanical and natural durability properties of wood from reforestation Pinus halepensis Mill. in the Mediterranean Basin. Bois For. Trop. 2017, 331, 19–31. Available online: https://www.researchgate.net/publication/315100329_Physical_mechanical_and_natural_durability_properties_of_wood_from_reforestation_Pinus_halepensis_Mill_in_the_Mediterranean_Basin (accessed on 18 January 2023). [CrossRef]
  22. Boulli, A.; Baaziz, M.; M’Hirit, O. Polymorphism of natural populations of Pinus halepensis Mill. in Morocco as revealed by morphological characters. Euphytica 2001, 119, 309–316. [Google Scholar] [CrossRef]
  23. Navarro, P.B.; Armengot, B.; Arce, V.L.; Benítez, L.G.; Villanueva, J.V.O. Sustainable forest management for added-value wood products. In III Congreso Forestal de la C.V. Gestión de Incendios Forestales en el Contexto del Cambio Climático; University of Valencia: Valencia, Spain, 2019; pp. 145–148. [Google Scholar]
  24. Navarro, P.B.; Hermoso, E.; Sánchez-González, M.; Luengo, E.; Gilabert Sanz, S.; Monleón Doménech, M.; Mandrara, Z.; Lanvin, J.D.; Gominho, J.; Oliver Villanueva, J. An innovative construction system made from local Mediterranean natural resources. In Proceedings of the XV World Forestry Congress, Seoul, Republic of Korea, 2–6 May 2022; pp. 1–9. [Google Scholar]
  25. Lerma-Arce, V.; Oliver-Villanueva, J.; Segura-Orenga, G.; Urchueguia-Schölzel, J. Comparison of alternative harvesting systems for selective thinning in a Mediterranean pine afforestation (Pinus halepensis Mill.) for bioenergy use. iForest 2021, 14, 465–472. [Google Scholar] [CrossRef]
  26. Bautista, I.; Lidón, A.; Lull, C.; González-Sanchis, M.; del Campo, A.D. Thinning decreased soil respiration differently in two dryland Mediterranean forests with contrasted soil temperature and humidity regimes. Eur. J. Res. 2021, 140, 1469–1485. [Google Scholar] [CrossRef]
  27. Del Campo, A.D.; González-Sanchis, M.; Molina, A.J.; García-Prats, A.; Ceacero, C.J.; Bautista, I. Effectiveness of water-oriented thinning in two semiarid forests: The redistribution of increased net rainfall into soil water, drainage and runoff. Ecol. Manag. 2019, 438, 163–175. [Google Scholar] [CrossRef]
  28. Hernández, G.F. Estudio a corto plazo de un tratamiento selvícola en una masa forestal de Quercus illex en el monte de La Hunde (Ayora) sobre propiedades químicas, biológicas y bioquímicas del suelo. 2017. Available online: https://riunet.upv.es:443/handle/10251/88986 (accessed on 19 January 2023).
  29. Kraft, G. Beiträge zur Lehre von den Durchforstungen, Schlagstellungen und Lichtungshieben; Klindworth’s Verlag: Hannover, Germany, 1884. [Google Scholar]
  30. Piqué, M.; Vericat, P.; Cervera, T.; Baiges, T.; Farriol, R. Tipologies Forestals Arbrades. Sèrie: Orientacions de Gestió Forestal Sostenible per a Catalunya (ORGEST). 2014. Available online: https://cpf.gencat.cat/web/.content/or_organismes/or04_centre_propietat_forestal/06-Publicacions/publicacions_tecniques/colleccions/orgest/tipologies_forestals_de_catalunya/orgest_manual_de_tipologies_forestals/docs/manual___complet.pdf (accessed on 19 January 2023).
  31. Molina, J.M.G. Introducción a la Selvicultura General; Universidad de León: León, Spain, 2005. [Google Scholar]
  32. Ecuador de Transformación Agraria. Tercer Inventario Forestal Nacional (IFN 3). 2006. Available online: https://www.miteco.gob.es/es/biodiversidad/servicios/banco-datos-naturaleza/informacion-disponible/ifn3_base_datos_26_50.aspx (accessed on 19 January 2023).
  33. Del Río, M.; Montero, G.; Ortega, C. Respuesta de los distintos regímenes de claras a los daños causados por la nieve en masas de Pinus sylvestris L. en el Sistema Central. Investig. Agrar. Sist. Y Recur. For. 1997, 6, 103–117. [Google Scholar]
  34. Eichhorn, F. Beziehungen zwischen Bestandeshöhe und Bestandsmasse. Allg. Forst Jagdztg. 1904, 80, 45–49. [Google Scholar]
  35. Assmann, E.; Der Zuwachs im Verjüngungstadium. Waldbauliche Probleme aus ertragskundlicher Sicht. Cent. Gesammte Forstwes. 1965, 4, 193–217. Available online: https://www.waldwachstum.wzw.tum.de/fileadmin/publications/Assmann_1965_Der_Zuwachs_im_Verjuengungsstadium.pdf (accessed on 19 January 2023).
  36. Ortega, C.; del Río, M.; Montero, G.; Bachiller, A. Resultados de una experiencia de claras en repoblaciones de Pinus pinaster Ait. en el norte de Guadalajara. In Proceedings of the II Congreso Forestal Español, Pamplona, Spain, 23–27 June 1997; Available online: http://secforestales.org/publicaciones/index.php/congresos_forestales/article/view/19667/19367 (accessed on 19 January 2023).
  37. Cameron, A.D. Importance of early selective thinning in the development of long-term stand stability and improved log quality: A review. Forestry 2002, 75, 25–35. [Google Scholar] [CrossRef]
  38. Güemes, C.G.; Calama, R. La práctica de la selvicultura para la adaptación al cambio climático. In Los bosques y la Biodiversidad Frente al Cambio Climático: Impactos, Vulnerabilidad y Adaptación en España; Herrero, A., Zavala, M.A., Eds.; Ministerio Para la Transición Ecológica: Madrid, Spain, 2015; pp. 501–512. [Google Scholar]
  39. Alcón, S.M.; Olabarría, J.R.G.; Coll, L. Evaluación y caracterización de los daños causados por la acción del viento y la nieve en los bosques de coníferas de montaña de Cataluña. In Proceedings of the V Congreso Forestal Español, Avila, Spain, 21–25 September 2009; Available online: http://secforestales.org/publicaciones/index.php/congresos_forestales/article/view/17213/17048 (accessed on 19 January 2023).
  40. Pausas, J.G. Incendios Forestales. Una Visión Desde la Ecología; Libros de la Catarata: Madrid, Spain, 2012; Volume 32. [Google Scholar]
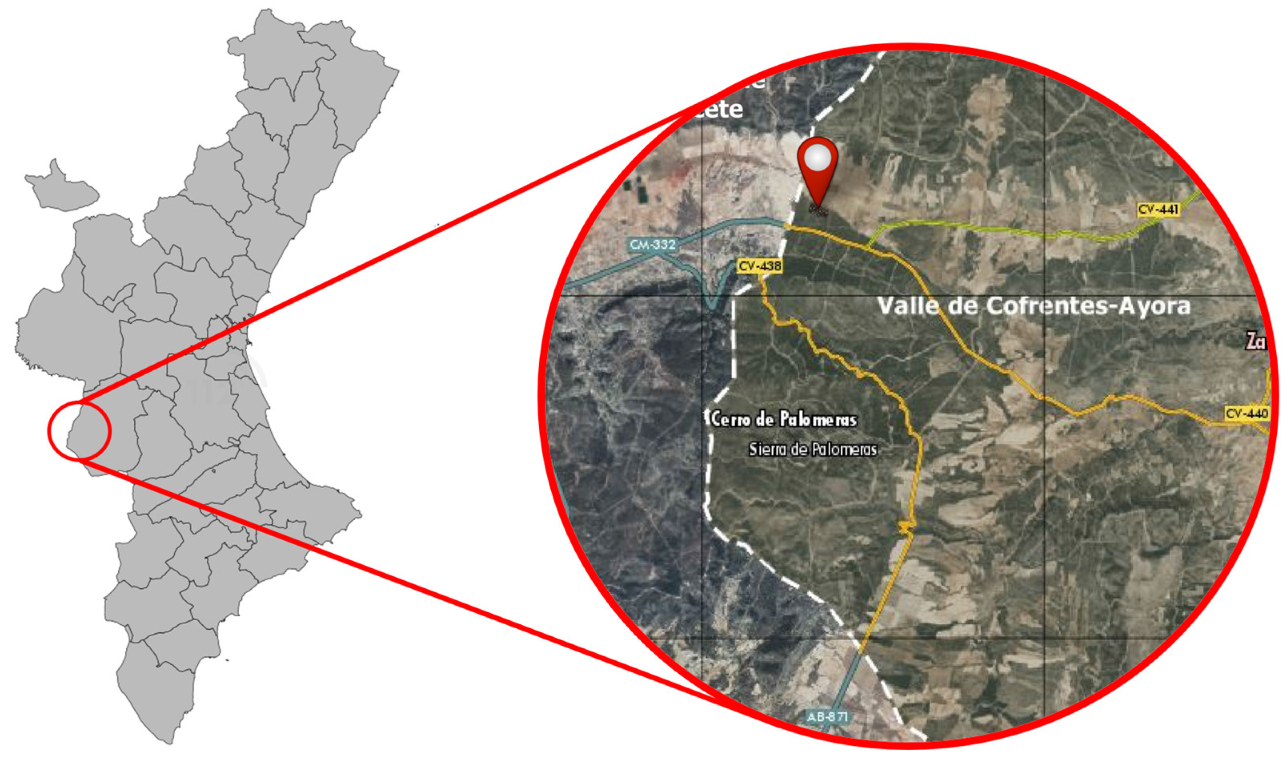
Figure 1. Location map of the study area in Valencia region (Spain).
Forests 14 00527 g001
Figure 2. Type of treatment per plot. Light thinning (blue), strong thinning (red), transformation to uneven-aged (yellow), diameter-driven uneven-aged (pink), and control plots (green).
Forests 14 00527 g002
Figure 3. Variation in the current volume increment (pg V) expressed as a percentage of that of the Control Plots (100%) with respect to BA expressed as a percentage of the CP BA (100%).
Forests 14 00527 g003
Figure 4. Changes in the different parameters by type of treatment between 2009 (after the applied treatment) and 2019.
Forests 14 00527 g004
Figure 5. Changes in the unitary volume of the mean tree per treatment between 2009 and 2019.
Forests 14 00527 g005
Figure 6. Unitary volume variation V of the average tree in 2019 expressed as a percentage of the volume of the mean tree of the control plots (100%) with respect to the BA expressed as a percentage of the CP BA (100%).
Forests 14 00527 g006
Figure 7. Effect of the windthrow events in 2010 and 2017 on treatment plots by treatment. The percentage corresponds to the proportion of thrown trees and thrown volume with respect to the corresponding total magnitude per ha.
Forests 14 00527 g007
Figure 8. Average seedling (<0.25 m) density/ha for the different treatments. Different capital letters indicate significant differences among treatments in 2019.
Forests 14 00527 g008
Figure 9. Density of juveniles above 0.25 m (as parameter for measuring regeneration) in the plots of each treatment and classified by height ranges. Different capital letters indicate significant differences among treatments.
Forests 14 00527 g009
Figure 10. Average shrub cover percentage by species and treatment applied. The different letters indicate significant differences among treatments. There are no significant differences between a level with two letters and those of the corresponding single letters.
Forests 14 00527 g010
Table 1. Fellings in number of trees, basal area, and volume by type of treatment in 2009.
% Removed Trees
(n/ha)
% Removed
Basal
Area (m2/ha)
% Removed
Volume
(m3/ha)
LT—Light thinning14%7%7%
ST—Strong thinning25%14%13%
TU—Transformation to uneven-aged44%38%37%
DU—Diameter-driven uneven-aged29%40%41%
Table 2. Mean values of average periodic growth, periodic growth, and unitary volumes of the mean tree per treatment in different years.
Average Periodic Growth
2009 (Average of 50 Years)
Average Periodic Growth
2019 (Average of 60 Years)
Periodic Growth (Average of
10 Years)
Average Tree Volume
DqHqBAVDqHqBAVDqHqBAV20092019
cm/
year
m/
year
m2/
ha-year
m3/
ha-year
cm/
year
m/
year
m2/
ha-year
m3/
ha-year
cm/
year
m/
year
m2/
ha-year
m3/
ha-year
m3/
tree
m3/
tree
CP0.450.250.582.850.420.230.552.880.200.110.423.040.1980.26
LT0.440.240.602.990.430.220.613.090.250.070.623.620.1870.26
ST0.430.240.613.030.440.220.613.120.280.080.613.610.1830.28
TU0.430.240.532.620.460.210.542.720.460.070.583.140.1820.30
DU0.440.220.522.460.420.200.522.510.460.080.502.570.1760.22
Table 3. Main parameters of the research plots for each treatment in 2009 before the extreme weather event and characteristics of the trees affected by the 2010 windthrow (total value and percentage compared to 2009).
After the 2009 FellingsTrees Affected by the 2010 Windthrow
NDqBAVNDqBAV
trees/hacmm2/ham3/hatrees/ha%cmm2/ha%m3/ha%
CP71222.8228.72142.09152.0%15.940.281.0%1.320.9%
LT68622.7528.05139.7491.3%21.070.331.2%1.661.2%
ST62023.3226.38131.24284.5%20.660.913.5%4.443.4%
TU40522.8116.5982.03338.3%22.881.358.3%6.718.4%
DU49320.2415.4271.418918.7%20.092.9218.9%14.0719.0%
Table 4. Main parameters of the research plots by treatment after the 2010 windthrow and trees affected by the 2017 windthrow.
After the 2010 WindthrowTrees Affected by the 2017 Windthrow
NDqBAVNDqBAV
trees/hacmm2/ham3/hatrees/ha%cmm2/ha%m3/ha%
CP69722.9428.44140.77203.0%18.110.522.0%2.501.8%
LT67822.7627.72138.08121.8%19.350.351.3%1.701.2%
ST59223.4425.47126.81162.6%20.570.512.0%2.512.0%
TU37122.8015.2375.32133.6%18.810.353%1.772.5%
DU40420.2012.4957.3482.1%16.650.171.4%0.771.4%
Disclaimer/Publisher’s Note: The statements, opinions and data contained in all publications are solely those of the individual author(s) and contributor(s) and not of MDPI and/or the editor(s). MDPI and/or the editor(s) disclaim responsibility for any injury to people or property resulting from any ideas, methods, instructions or products referred to in the content.