Article

Ecological and Soil Data Applied to Conservation Management of an Urban Forest

by
Mia T. Wavrek
1,†,
Sharon Jean-Philippe
2 and
Michael L. McKinney
1,*
1
Department of Earth and Planetary Sciences, University of Tennessee, 1621 Cumberland Avenue, 602 Strong Hall, Knoxville, TN 37996, USA
2
Institute of Agriculture, University of Tennessee, 2621 Morgan Circle, Knoxville, TN 37996, USA
*
Author to whom correspondence should be addressed.
This manuscript is part of a Master’s thesis by the first author, available online at [email protected].
Forests 2023, 14(3), 487; https://doi.org/10.3390/f14030487
Submission received: 20 December 2022 / Revised: 14 February 2023 / Accepted: 22 February 2023 / Published: 28 February 2023
(This article belongs to the Section Urban Forestry)

Abstract

:
Urban ecosystems have great potential for urban biodiversity conservation, but achieving conservation goals relies on comprehensive ecological assessments to assist in active management practices; however, land use changes in urban ecosystems have led to unique abiotic and biotic inputs that have affected and altered below-ground soil composition, with potentially negative implications across trophic levels. We investigated the relationships between soil attributes and key indicators of forest health, specifically the composition and condition of vegetation and soils in an urban remnant forest area. The major findings revealed a dominance of native plant species, with some invasion by non-native plants, and acidic high-carbon soils sufficient in most plant available nutrients. Moreover, stepwise regression analysis showed significant relationships between soil attributes and native species diversity and abundance; prevalence of invasive plants (Lonicera maackii, Pueraria montana, Albizia julibrissin, Ligustrum sinense, Lonicera japonica, Ailanthus altissima, and Paulownia tomentosa); forest canopy gaps; and fine woody debris on the forest floor. These findings identified attributes of urban soils affecting forest health and biodiversity conservation, with broad implications for the long-term monitoring of urban forests.

1. Introduction

The growing interest in enhancing ecosystem services and biodiversity conservation in cities has highlighted the importance of improving ecological planning and management of urban forests, particularly remnant forested natural areas [1,2,3]. Compared to the broader urban forest, which comprises all trees and associated vegetation growing in the urban environment, urban forested natural areas trees grow in a forest stand, are characterized by high levels of self-regulation (little management), and they typically take the form of urban park land [3,4]. Thousands of hectares of forested natural areas exist across the U.S. in densely populated areas, with nearly 3000 hectares in New York City alone [5]. These characteristics distinguish urban forested natural areas from other highly managed urban greenspaces, resulting in distinctive but substantial social and ecological contributions to sustainable urban ecosystems [6].
Throughout the U.S., where over 80% of the population lives in urban areas [4], urban forested natural areas in municipal park systems are becoming increasingly important for connecting humans to nature [7]. Spending time in nature provides adults and children significant physical, psychological, and cognitive benefits [8,9]. Forested natural areas also provide benefits in the form of ecosystem services, including filtering air and water pollution, watershed protection and stormwater retention, urban heat island mitigation, and providing habitats for the often-overlooked native biodiversity in urban areas [10,11,12]. The biodiversity conservation potential of forested natural areas is particularly high, due to their complex structure and ability to support a diversity of species in urban areas. Indeed, a variety of studies have demonstrated the impressive biodiversity of forested natural areas in cities [13,14,15]. With expanding urban populations and land area, the conservation of urban forested areas, their benefits, and associated biodiversity are increasingly important [16]. The ability for forested natural areas to sustainably deliver biodiversity conservation benefits is directly affected by how they are managed [3,17,18]. Historically, the multitude of agencies involved in urban greenspace planning and management have prioritized human uses and preferences, with ecological management objectives as secondary or altogether absent, resulting in a lack of ecological information necessary for advancing conservation policy and goals [14,19,20]. Cities at the forefront of these efforts are conducting comprehensive ecological assessments across their urban natural areas. While the bulk of the data collected in ecological inventories focus on vegetative attributes, soils also serve critical functions in the maintenance of forest health and ecological restoration in cities [21,22].
Urban soils are a relatively neglected component of urban ecosystems, despite their broad range of functional benefits [23]. Within urban landscapes, soils are highly heterogeneous, comprising native or remnant patches, artificial soils formed by the removal, mixing, and/or replacement of native soils with fill materials or non-native soils, and sealed, paved patches [24,25]. Properties associated with each of these broad forms of urban soil will differ drastically and, as with non-urban soils, depend on climatic, geological, topographic, biological, anthropogenic, and temporal factors [26,27].
The dominant characteristics of urban soils that distinguish them from non-urban soils include non-agricultural anthropogenic disturbance and/or manipulation and contamination by the surrounding urban landscape via direct inputs of pollutants or atmospheric or hydrological deposition [28,29]. Additional factors associated with urban environments, such as elevated temperatures compared to the surrounding landscape, high levels of impervious surfaces, gray infrastructure to channel storm and wastewater, and invasion by non-native invasive species, also have effects on urban soils [30]. All of these components influence the physical, chemical, and biological qualities of urban soil, including texture, pH, the degree of compaction (bulk density), temperature, hydrology, decomposition, nutrient content and availability for plants, soil organisms, and toxicity to plants and animals, among others [29]. These attributes of soil can have profound consequences on their functions, and therefore, on the living organisms that depend on it, including humans.
Blanchart et al. [23] compiled a list of soil ecosystem services which included air quality and climate regulation, water purification, food production, fiber and raw materials, wildlife habitat, heritage conservation, and recreational activities, among others (see also O’Riordan et al. [31] for an excellent review). However, just as the management of urban forested natural areas is a critical component of their ability to support native biodiversity, the management of urban soils also plays an important role in the delivery of soil-derived benefits in urban ecosystems [23]. In the context of urban forested natural areas, urban soils provide unique benefits. Though some level of anthropogenic disturbance is inevitable, urban forested natural areas provide some of the few places where natural or remnant soils persist in urban environments. With adequate physical properties and sufficient soil nutrient levels, these soils provide the substrate upon which a diversity of forest plants can grow, thus supporting the foundation of complex food webs, and enhancing the overall urban biodiversity conservation potential of forested natural areas [32]. Recent investigations into the microbial biodiversity of soils in New York City parks revealed that urban park soils serve as reservoirs of natural products produced by soil bacteria, a fascinating new area of research with implications for human health [33,34].
Currently, few studies have characterized urban soils in the context of biodiversity. A notable exception is the excellent review by Guilland et al. [35] concerning the biological quality of urban soils for management goals. They argued for the importance of soils management in urban ecosystem management, while also documenting a lack of data and empirical studies on this topic. Specifically, they found very few studies that investigated relationships between soil attributes and key indicators of urban forest health, including vegetative composition, ecological impacts, and human impacts.
This case study is intended as a first step in addressing this lack of data on these topics. Our specific research questions are as follows: What is the general quality and composition of soil in urban forest remnants? How is the biodiversity in urban forest remnants related to the soil composition in those habitats? How are invasive species influenced by soil composition, including litter and other types of soil disturbance?

2. Materials and Methods
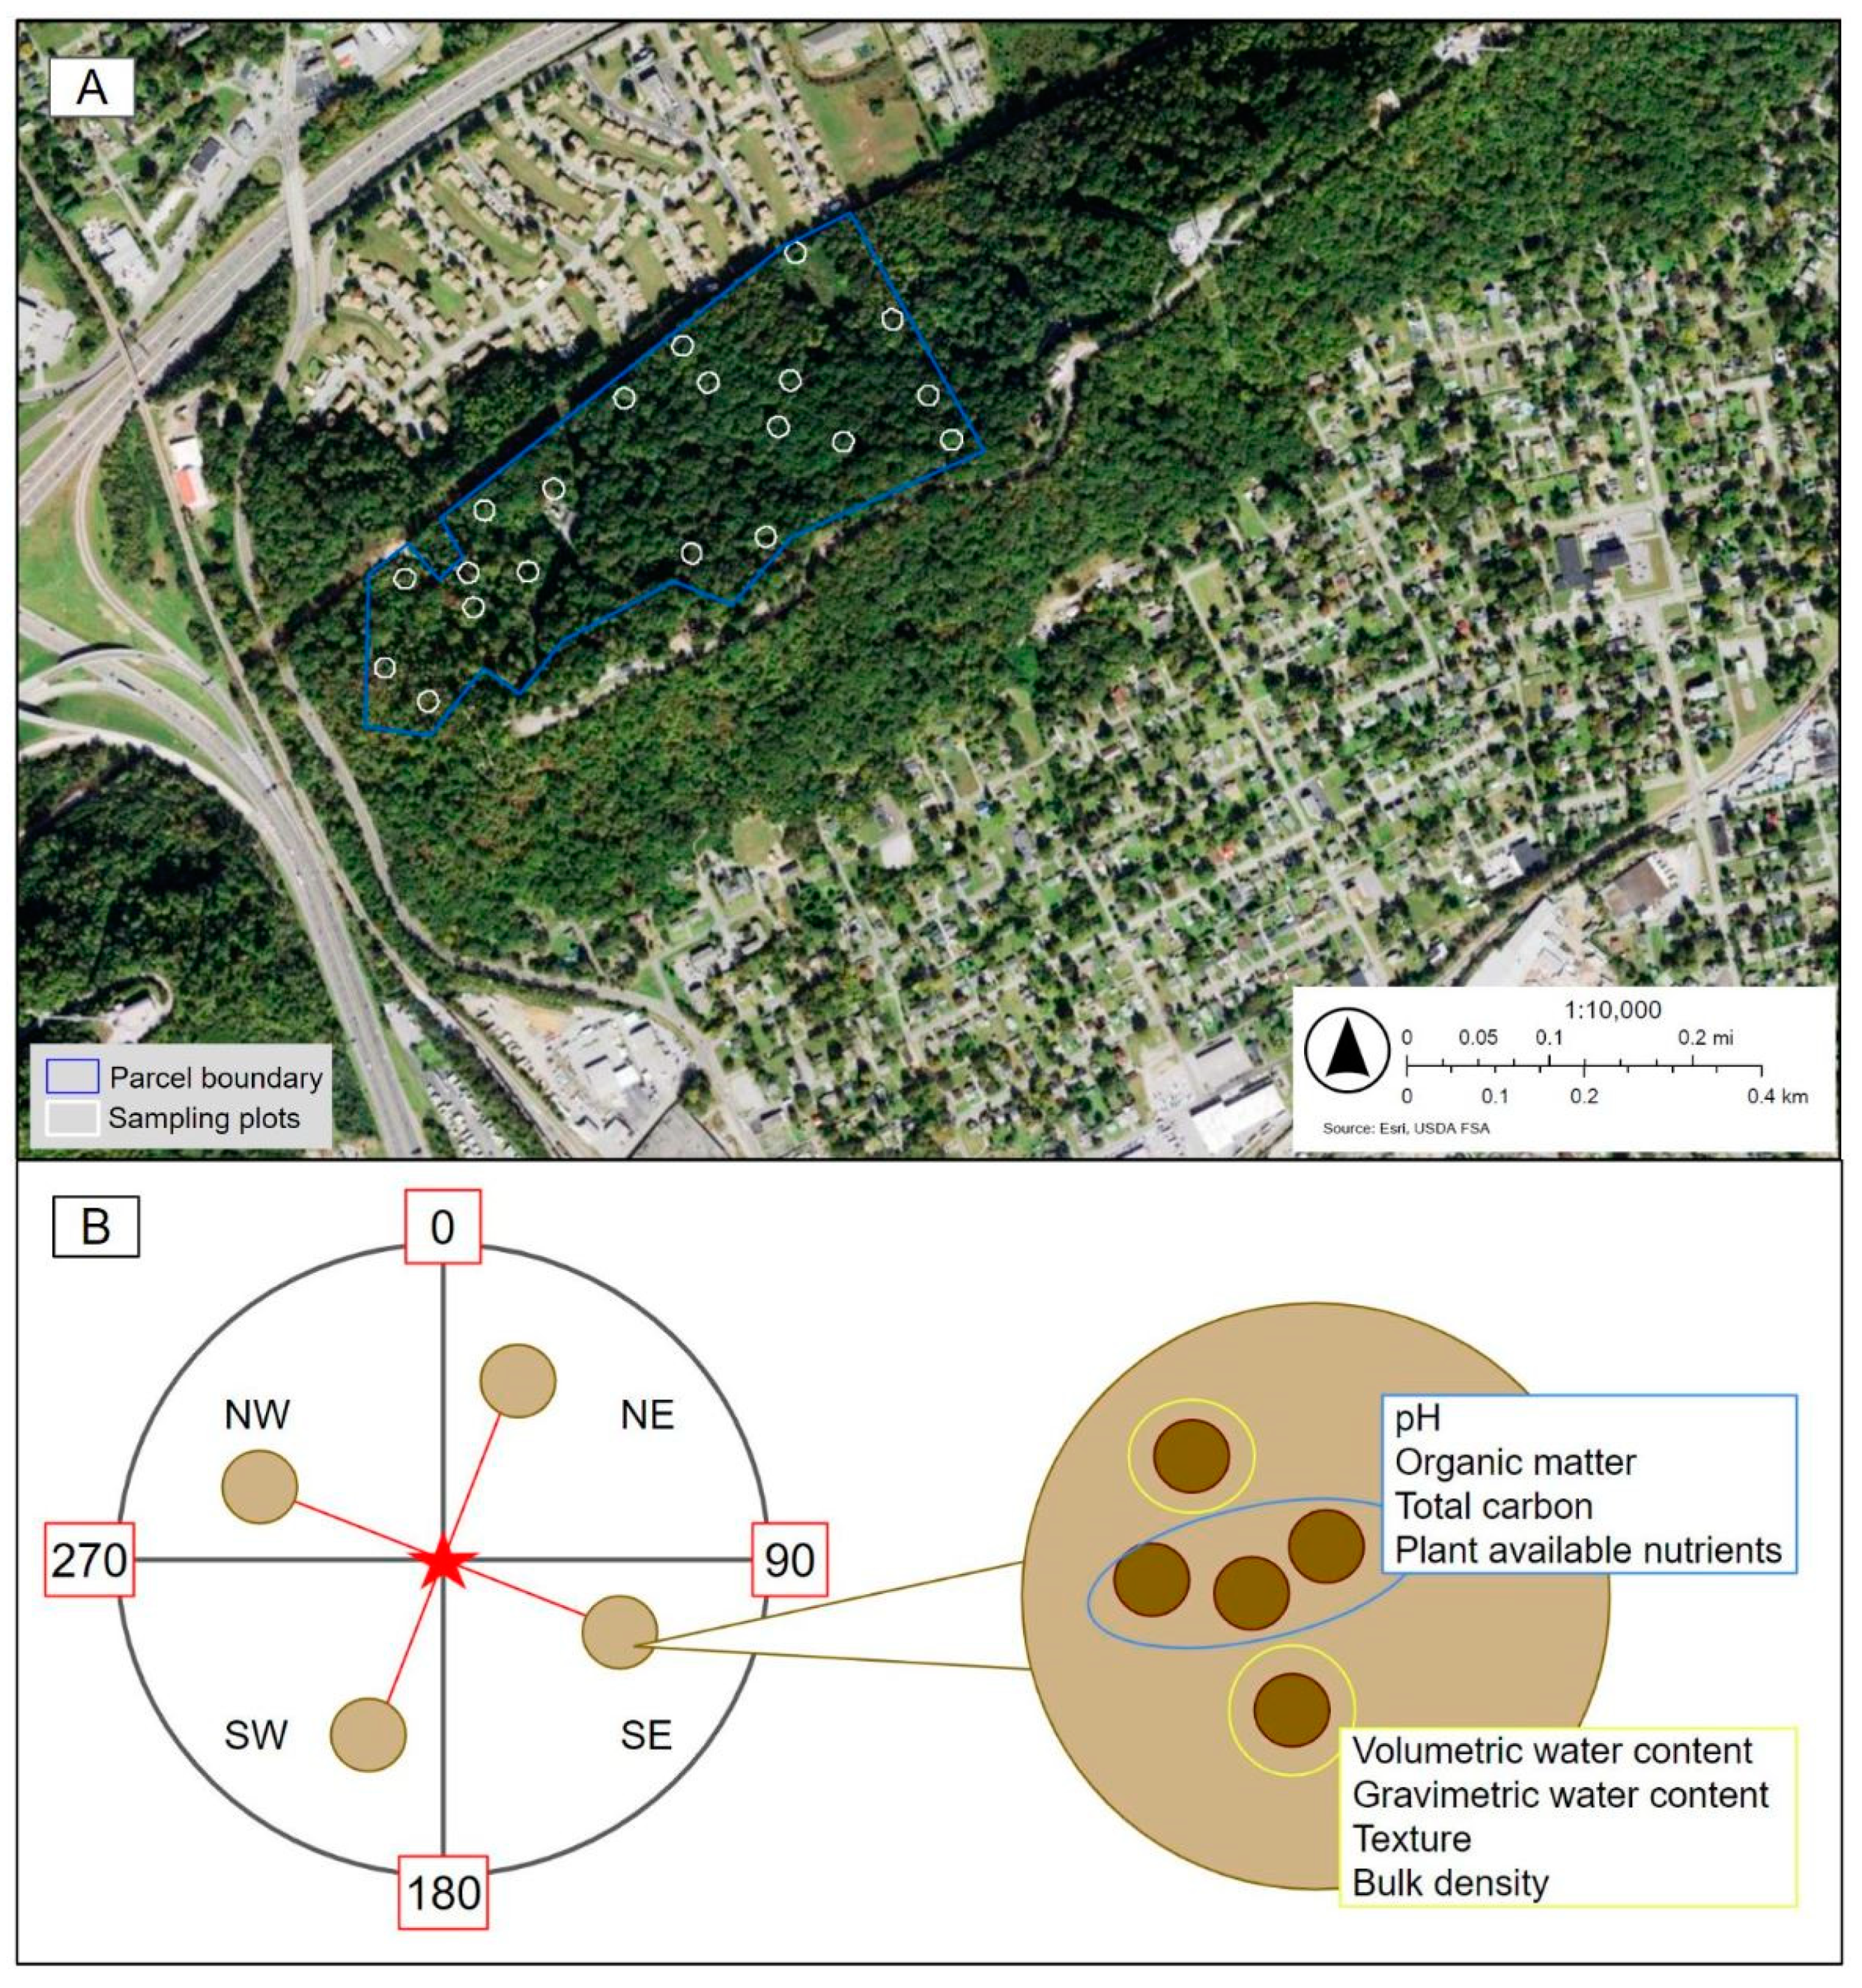
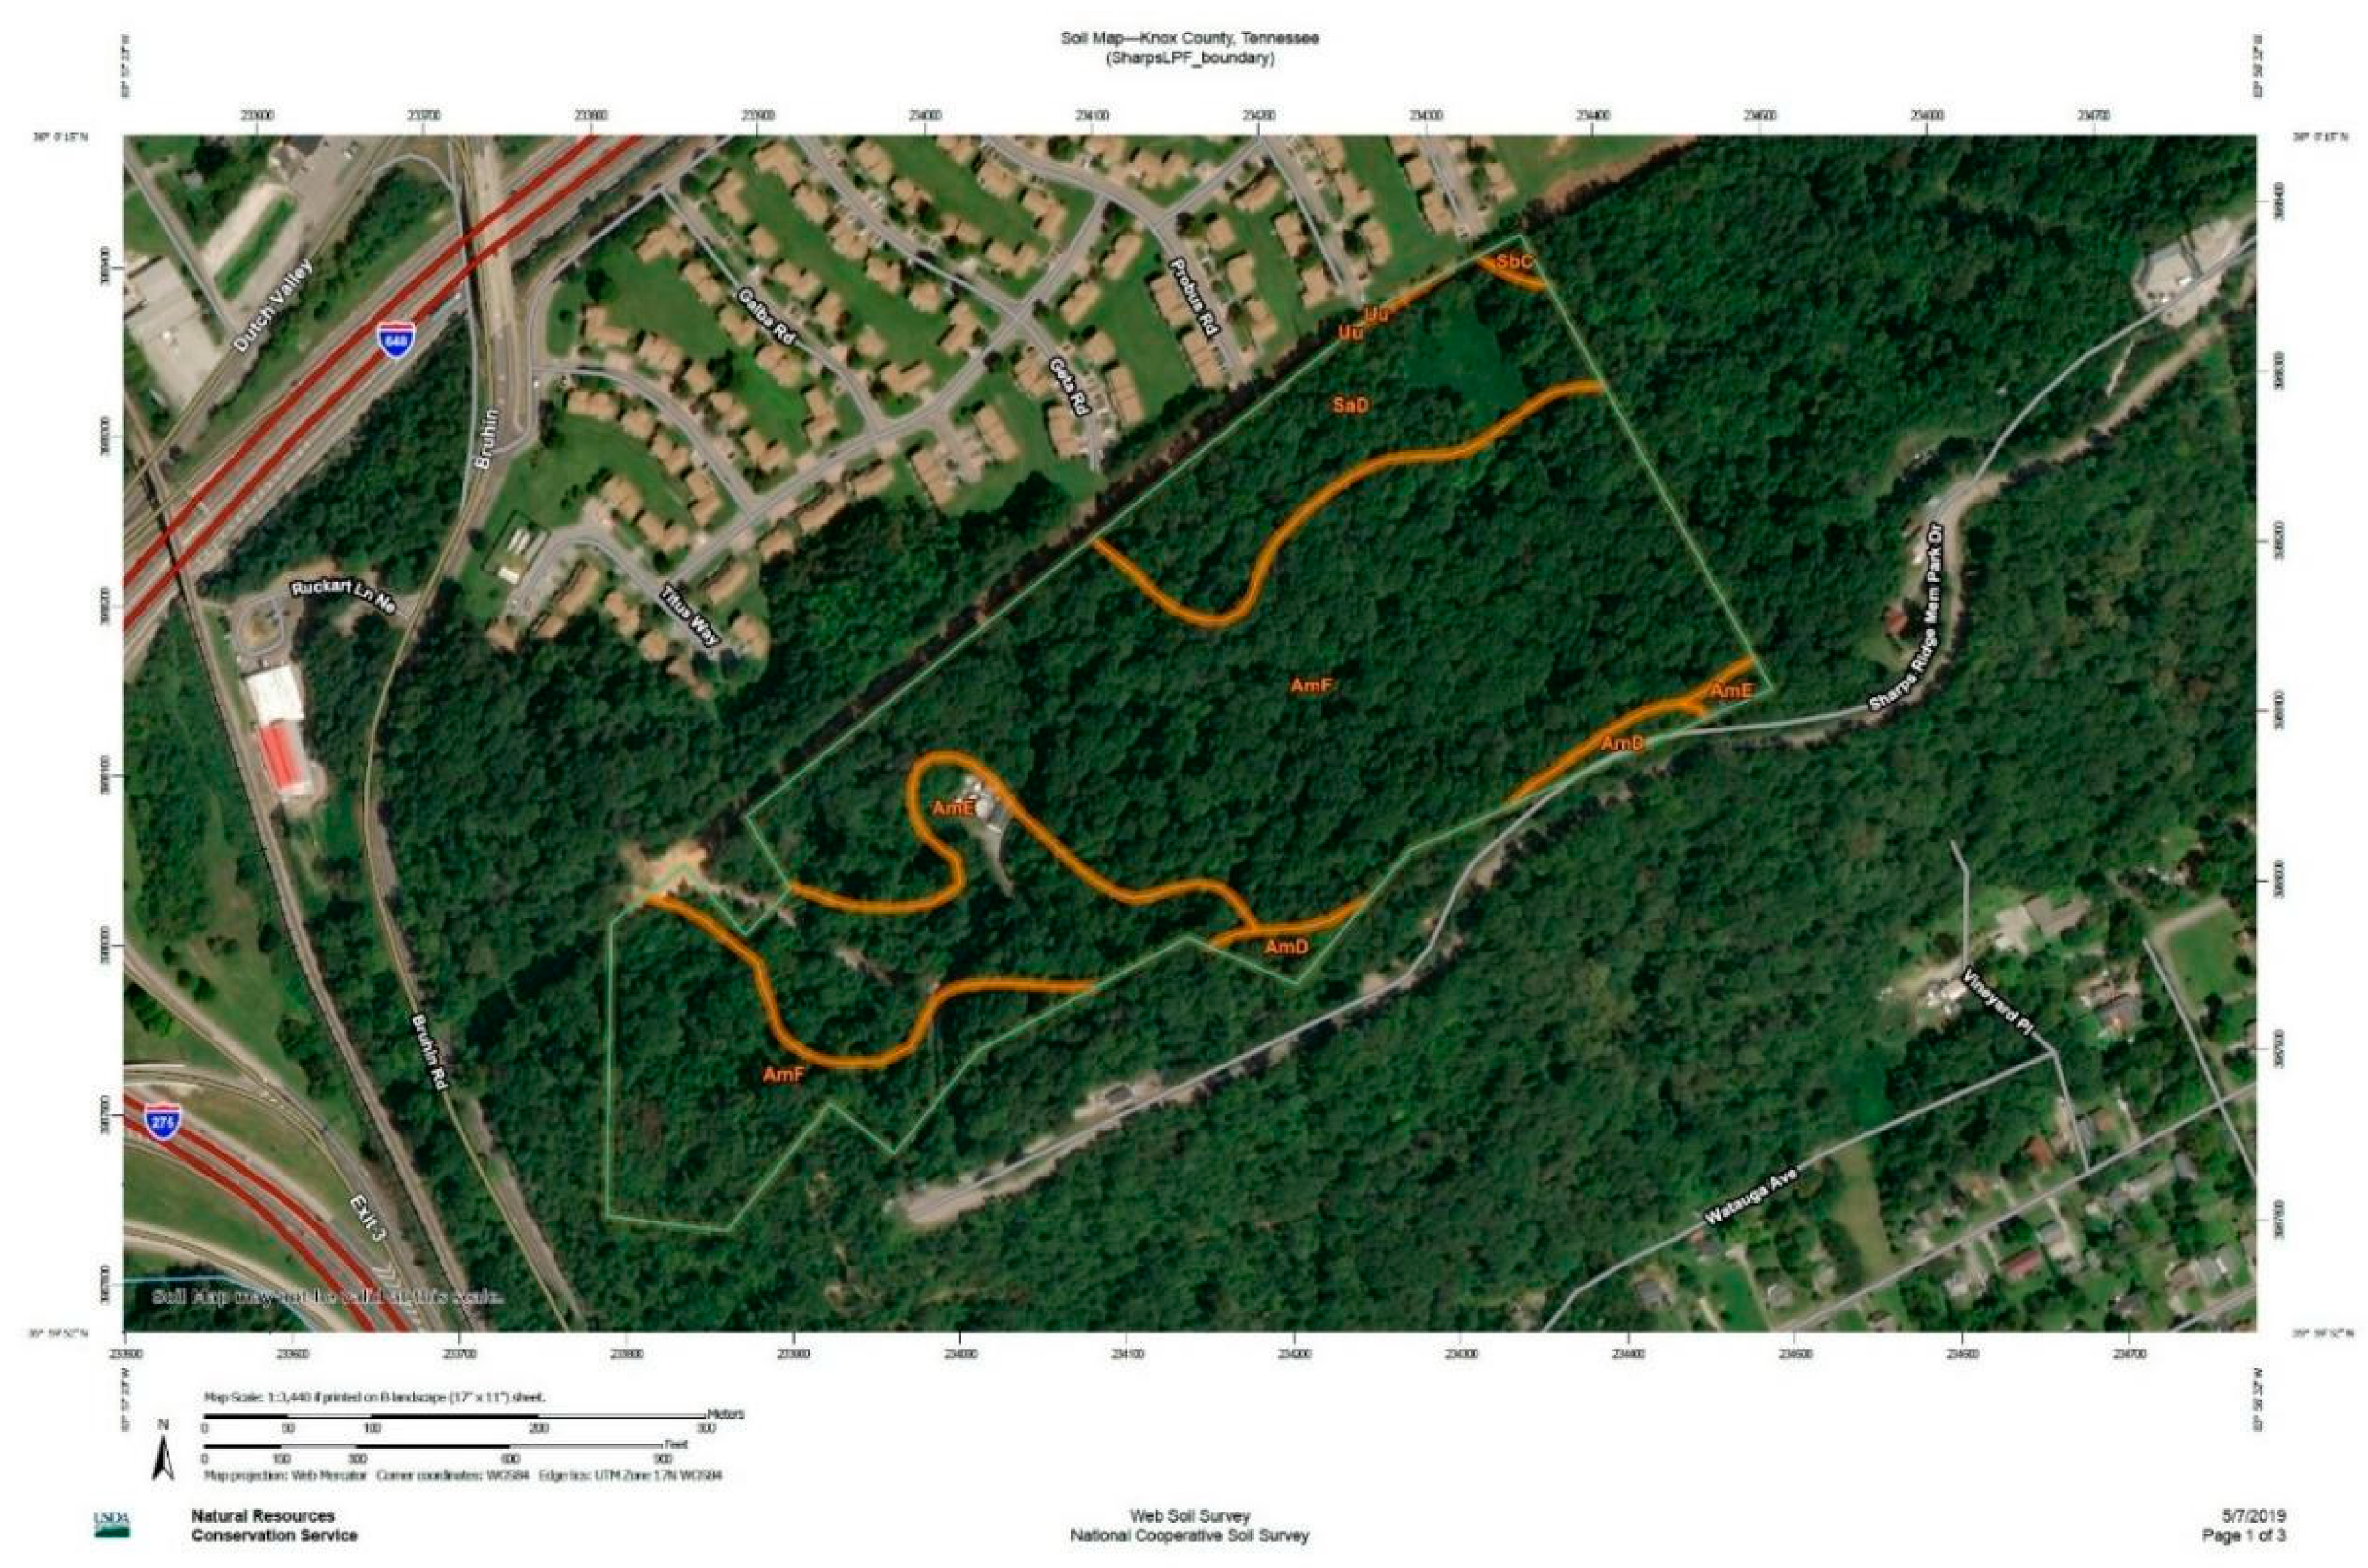
This study was conducted in a 17-ha parcel of a steeply sloped 80+ ha urban remnant forested area in Knoxville, Tennessee, where baseline ecological data were previously absent. Known as Sharp’s Ridge, a portion of the forest is dedicated to a 45-ha city park frequented by mountain bikers, hikers, and birders. In 2017, a Knoxville-based nonprofit acquired the 17 ha of forested area, with the objectives of compatibly designing a passive trail system that would connect to the larger park while conserving native plant biodiversity, preserving vital migratory bird habitat, connecting underserved communities to unique nature recreation opportunities, and restoring habitat impacted by non-native invasive species. Considering that baseline ecological and soils data were absent, the purpose of this study was two-fold: (1) to characterize vegetation and soil composition and condition in an urban forested natural area by way of a comprehensive ecological assessment and soil analyses, and (2) to investigate relationships between soil attributes and key indicators of forest health.

2.1. Study Site

Located in Knoxville, Tennessee, Sharp’s Ridge is one of several parallel topographic ridges in East Tennessee. The study site is a 17-ha parcel of relatively intact secondary hardwood and pine forest, largely surrounded by urban landscape, with major roadways running along its northwest and southeast boundaries (Figure 1). Dispersed across roughly half of the forested land area on privately-owned parcels are communication towers, power lines, and satellite dishes installed by commercial communication companies. Despite anthropogenic disturbances, Sharp’s Ridge is well known among avian enthusiasts for its abundance of year-round and neotropical migratory bird species, the latter of which use the intact forested area as a stopover site during fall and spring migrations [36].
A paved road that serves as the main entrance to the city park is the southern boundary of the 17-ha parcel, while the northern boundary sits along a utility right-of- way and residential neighborhood. A fenced area surrounding satellite dishes sits near the center of the parcel, and is accessible by a secondary dead-end paved road used by commercial communications companies. Trespassing throughout the parcel is apparent.
Soils of the 17-ha land parcel are a mix of Apison–Montevallo, Salacoa, and modified urban soils [37] (Figure A1 and Table A1). Apison–Montevallo (Am) soils are loamy/shaly soils commonly found on ridgetops with varying depths, and are characterized by shale or siltstone material with sandstone, derived from residuum or colluvium. Salacoa (S) is the deepest, most well-drained soil in this complex, derived from colluvium. The AmS complex is found in steep mixed woodlands. Urban land-Udorthents are typical in urban areas where soils have been modified by cutting, filling, or mechanical disturbance.
Figure 1. (A) Locations of the 17 ecological sampling plots across the 17-hectare parcel located on Sharp’s Ridge, Knoxville, Tennessee. (B) Ecological assessment plot diagram for attribute collection at each field site. Image modified from Natural Areas Conservancy Protocol (unpublished document). Ecological attributes collected at each sampling plot are as follows (modified from [38]): Overstory trees (>10 cm DBH). For each 11.3 m radius plot: species identification, diameter at breast height, vigor, and vine cover growth stages. Midstory trees (2–10 cm DBH). For each 11.3 m radius plot: Species identification and vine cover growth stages. Understory: species identification and percent cover in 4 1 m × 1 m subplots. Human impacts were measured as proportion of each plot showing human disturbance (e.g., litter, trampling). Ecological impacts were measured as proportion of each plot showing canopy gaps and other evidence of natural disturbances. Soil attributes measured include plant available nutrients, bulk density, volumetric and gravimetric water content, pH, texture, and organic matter.
Forests 14 00487 g001

2.2. Ecological Data Collection

Using ArcGIS 10.7, 100 coordinates were randomly generated throughout the 17-ha parcel boundary and stratified using a slope raster. Due to the high proportion of steeply sloped areas across the parcel, the coordinates were constrained to slopes ≲25 degrees for the safety of data collection. A subset of 17 plots were randomly selected across the parcel (Figure 1A, Table A2). These served as the central locations for each 0.04-ha (11.3-m radius) circular sampling plot. Using a GPS device, the plots were constructed by navigating to the central location and placing 5 flag stakes, one at the center and 4 in cardinal directions, effectively dividing the plot into 4 subplots (NE, SE, SW, NW; Figure 1B). Across the 17 plots, the average slopes ranged from 25.45 degrees to 6.24 degrees (Table A3). Site elevations ranged from 1079.2 m to 1315.8 m. Between June and September 2019, a two-person field crew collected baseline vegetative and impact data in the 17 plots, following the Natural Areas Conservancy Upland and Forest Assessment Field Protocol (unpublished document), with modifications noted. To characterize urban forest composition, all woody, vining, and herbaceous species in the overstory, midstory, and understory were identified within each plot. To account for species not captured in these inventories, timed walking transects of each plot were conducted, and the presence of any additional species was recorded. The raw data from each plot were used to calculate plot-level ecological indicators of urban forest health. The proportion of native species in the overstory and midstory of each plot was calculated (pi, Equation (1)), as well as native diversity (H, Equation (2)) and equitability (EH, Equation (3)) for the overstory and midstory, using the following series of equations:
pi = ni/N
where pi is the proportion of individuals found in species i, ni is the number of individuals in species i, and N is the total number of individuals in the community. Thus the following equations result:
H= − ∑ pi ln pi
EH= H/ln S
where S is the total number of species in the community (richness). Understory and additional species were not included in these calculations, as only their presence, not abundance, was recorded.
Forest condition was summarized for each plot, based on field measurements of plot-level impacts and all qualifying vegetation in the overstory, midstory, and understory vegetation inventories. Basal area of individual overstory trees (BA, ft2) was calculated using Equation (4), and was subsequently used to calculate basal area per hectare (Equation (5b), m2/ha):
BA = 0.005454 (DBH in2)
BA per acre = sum (BAft2 × TPA)
BA m2 per hectare = BA per acre/4.356
where DBH is tree diameter at breast height (in inches), and TPA is the trees per acre represented by each tallied tree on a plot. A vigor rating on a 5-point scale (1 = Healthy, 5 = Dead) was assigned to each overstory tree, which cumulatively assessed tree dieback, defoliation, twig and branch mortality, and areas of missing crown. The presence and species of vines growing on any portion of qualifying overstory and midstory vegetation were recorded, as well as the stage of growth (below DBH, above DBH, or present in tree canopy). A visual estimate of the proportion of each plot, covered or impacted by a variety of anthropogenic and ecological disturbances, was used to quantify plot-level impacts (the average of independent estimates between the two-person field crew). Impacts included anthropogenic dumping (trash, construction materials, debris), canopy gaps, tree damage (coarse woody debris and/or dead snags), fine woody debris, fire, soil modification (disturbance, pits, and/or mounds), and invasive species. Invasion impact was quantified using a visual estimate, since some highly branching species such as Chinese privet (Ligustrum sinense) and Amur honeysuckle (Lonicera maackii) had stem diameters that did not qualify in the midstory vegetation inventory, potentially underrepresenting these species and their impacts.

2.3. Soil Collection and Analysis

Throughout January 2020, soil sampling was conducted within each subplot (Figure 1B) of every plot by first randomly selecting one of many possible azimuths that were randomly generated prior to entering the field; the subplot corresponding to the selected azimuth would be identified, and azimuths for the remaining subplots were determined by adding or subtracting 90 degrees, so that soil samples were collected at standardized distances within the plot. Soil cores were collected at 5 m within the subplot. When an obstruction (e.g., large downed woody material, large tree root) prevented sampling at 5 m, the sampling location was moved toward the plot center in 30-cm intervals along the 5-m transect until a suitable location was identified. When obstructions prevented soil coring in a subplot, cores were not collected.
At suitable locations, the O horizon was first cleared in a ~0.5-m diameter circular area, and percent water content (volumetric water content, θv) was measured using a time-domain reflectometry (TDR) meter at two separate coring locations (~10 cm apart) before collecting five 10-cm soil cores, as close to the coring locations as possible.
Three soil cores were combined into a single sample and bagged for future organic matter, pH, and nutrient analyses (henceforth ‘combined sample’), and the remaining two were kept separate and bagged for future gravimetric water content measurements (θg) and texture analysis (henceforth ‘bulk density samples’). This made for a possible total of 12 samples per plot (4 combined samples and 8 bulk density samples). When a below- ground obstruction prevented complete (10 cm) coring, a new coring location within the cleared area was attempted. If several unsuccessful (<10 cm) attempts were made, a core <10 cm was collected, and the length was recorded. Plastic baggies containing soil samples were stored in a lab cooler within 24 h until further processing.
A total of 65 combined samples and 130 bulk density samples were collected for analysis of soil attributes. In a laboratory at the University of Tennessee, Knoxville, the combined samples were dried in a drying oven at 105 °C for 24 h, sieved to 2 mm, and re-bagged. For each bulk density sample, wet mass was first measured, then each was dried and sieved as above, and re-weighed. Solids > 2 mm were weighed and subtracted from initial wet and dry measurements to determine the wet and dry mass of the soil (masswet and massdry, respectively). Then, gravimetric water content (θg) was determined using Equation (6), and bulk density (ρb) was calculated using Equations (6) and (7):
θg = (masswet − massdry)/massdry
ρb = θvg
Bulk density samples were grouped by plot and combined for texture analysis. All processed soil samples were sent to the Soil, Pest, and Plant Center at the University of Tennessee Institute of Agriculture Extension in Nashville, Tennessee, for texture (n = 17) and pH, buffer pH (resistance to liming), organic matter, and essential nutrient analyses (n = 65). To determine plot-level values for each soil attribute, the average was calculated across all subplot samples.

2.4. Statistical Analysis

To investigate relationships between forest health indicators and the suite of soil attributes, a series of stepwise regression analyses were employed in SPSS v. 25.0 [39], with soil attributes as the independent variables and each forest health indicator as the dependent variable. For each regression model that returned statistically significant results, collinearity statistics (VIF, Tolerance) were evaluated, and the best models were selected following Tabachnick et al. [40]. The Kolmogorov–Smirnov (KS) and Shapiro–Wilk tests were employed for each independent variable to check the normality of observations and residuals, respectively, and to confirm model validity. The interquartile range (IQR) was presented for variables where results of the KS test were significant.

3. Results and Discussion

3.1. Urban Forest Composition and Condition

The dominant species across the combined overstory and midstory inventories were as follows: red maple (A. rubrum), black gum (Nyssa sylvatica), and sassafras (S. albinium), largely due to the abundance of these species in the midstory. In the overstory, the most common species was chestnut oak (Q. montanta), followed by red maple (A. rubrum) and tulip poplar (Liriodendron tulipifera). Results of the understory species inventory revealed that red maple, greenbriar (Smilax spp.), and Japanese honeysuckle (Lonicera japonica), an invasive vine, were the dominant species on the forest floor. Surprisingly, native herbaceous species were relatively uncommon, with an average percent cover of 5.8% in quadrats across all plots. Despite the minimal biomass of the herbaceous layer in temperate forests, it has the potential to contribute significantly to urban forest ecosystem structure and function, as well as to native biodiversity conservation, with most plant biodiversity in temperate forests occurring in the herbaceous layer [41]. The most common herbaceous understory species were tick trefoil (Desmodium nudiflorum), plume solomon’s seal (Maianthemum racemosum), and Christmas fern (Polystichum acrostichoides), which cumulatively contributed to just 3.9% of all understory species inventoried.
A summary of forest health indicators across all plots is presented in Table 1. Vegetative species richness across all plots totaled 129 native species and 11 invasive species. The highest combined (midstory and overstory strata) Shannon’s Diversity (H) of native vegetation was 2.59, with a corresponding Shannon’s Equitability (E) value of 0.88. Average combined H and E values were 2.07 and 0.78, respectively. The lowest equitability score was 0.54, where red maple (Acer rubrum) and sassafras (Sassafras albinium) comprised a combined 70.8% of the individuals in the plot. Across plots, the average number of native species in a plot was 29, with a range of 20 to 48 species. Lastly, the average percent of native species in a plot was 90.0%, with one plot entirely composed of native species. These results indicate a relatively high diversity, broad distribution, and dominance of native plant species on the Sharp’s Ridge forest ecosystem. These findings corroborate similar findings in Europe that remnant and emerging urban forests contain a substantial diversity of native species with great potential for conservation value and ecosystems services, including promising “rewilding” opportunities [42].
The relatively small proportion of herbaceous species compared to what might be expected may indicate poor timing of the sampling, microenvironmental conditions that are not conducive to supporting a greater diversity of herbaceous species, or the more worrying prospect that native herbs are in the process of local extirpation, if not already extirpated. One explanation for this possible extirpation is the high proportion of vining and invasive species found across all strata. Vining species in the understory made up 34.3% of all understory species inventoried. Vines were recorded on an average for 63.7% of overstory trees, 32.1% of which had canopy vines. Vining species can blanket other vegetation and block essential light, or outcompete other vegetation for nutrients by rooting on the forest floor or by parasitically attaching to overstory trees [43]. While some vining species recorded in the vegetation inventory are native and relatively benign in terms of urban forest health, several species, including kudzu (Pueraria montana), Japanese honeysuckle, and oriental bittersweet (Celastrus orbiculatus) are invasive to East Tennessee and can grow aggressively, negatively impacting native biodiversity.
Across all plots, the impact of invasive species was highly variable, ranging from 0% to 90%, with a median impact of 13.5%. Invasive species comprised 9.2% of individuals overall in the midstory, and 15.7% of individuals in the understory. The average proportion of soil modification in plots was 13.4%. The proportion of gaps in the forest canopy, which ranged from 85% to near canopy closure (5% gap), averaged 36% across all plots, indicating that planting efforts may be needed to restore some areas of the forest canopy. Tree damage averaged 20.3%; this could be a result of natural disturbance, such as blowdown and fire damage (found at 41% of plots), or it could also indicate tree mortality due to the spread of disease or invasive insect species such as the emerald ash borer. Snags, fallen logs and branches, and other coarse woody debris are important components for providing habitat and nutrient cycling. Fine woody debris, another important component of nutrient cycling, ranged from 4.5% to 56%, and averaged 20.4%.
Concerning direct anthropogenic impacts, evidence of dumping was apparent throughout the parcel, with implications for wildlife health, soil contamination, and bioaccumulation. Dumping was present in over 75% of plots, with the proportion of trash cover averaging 1.9% of the 0.04-hectare plot area across all plots (due to the sampling design limiting plots at slopes < 25 degrees, these results may not be representative of forest composition and condition across Sharp’s Ridge, where slopes are often much steeper). These findings are important, because anthropogenic disturbances regulate plant invasions in urban forests [44]. Conversely, native plant seedling growth is negatively impacted by anthropogenic disturbances affecting soils in urban natural areas [45].

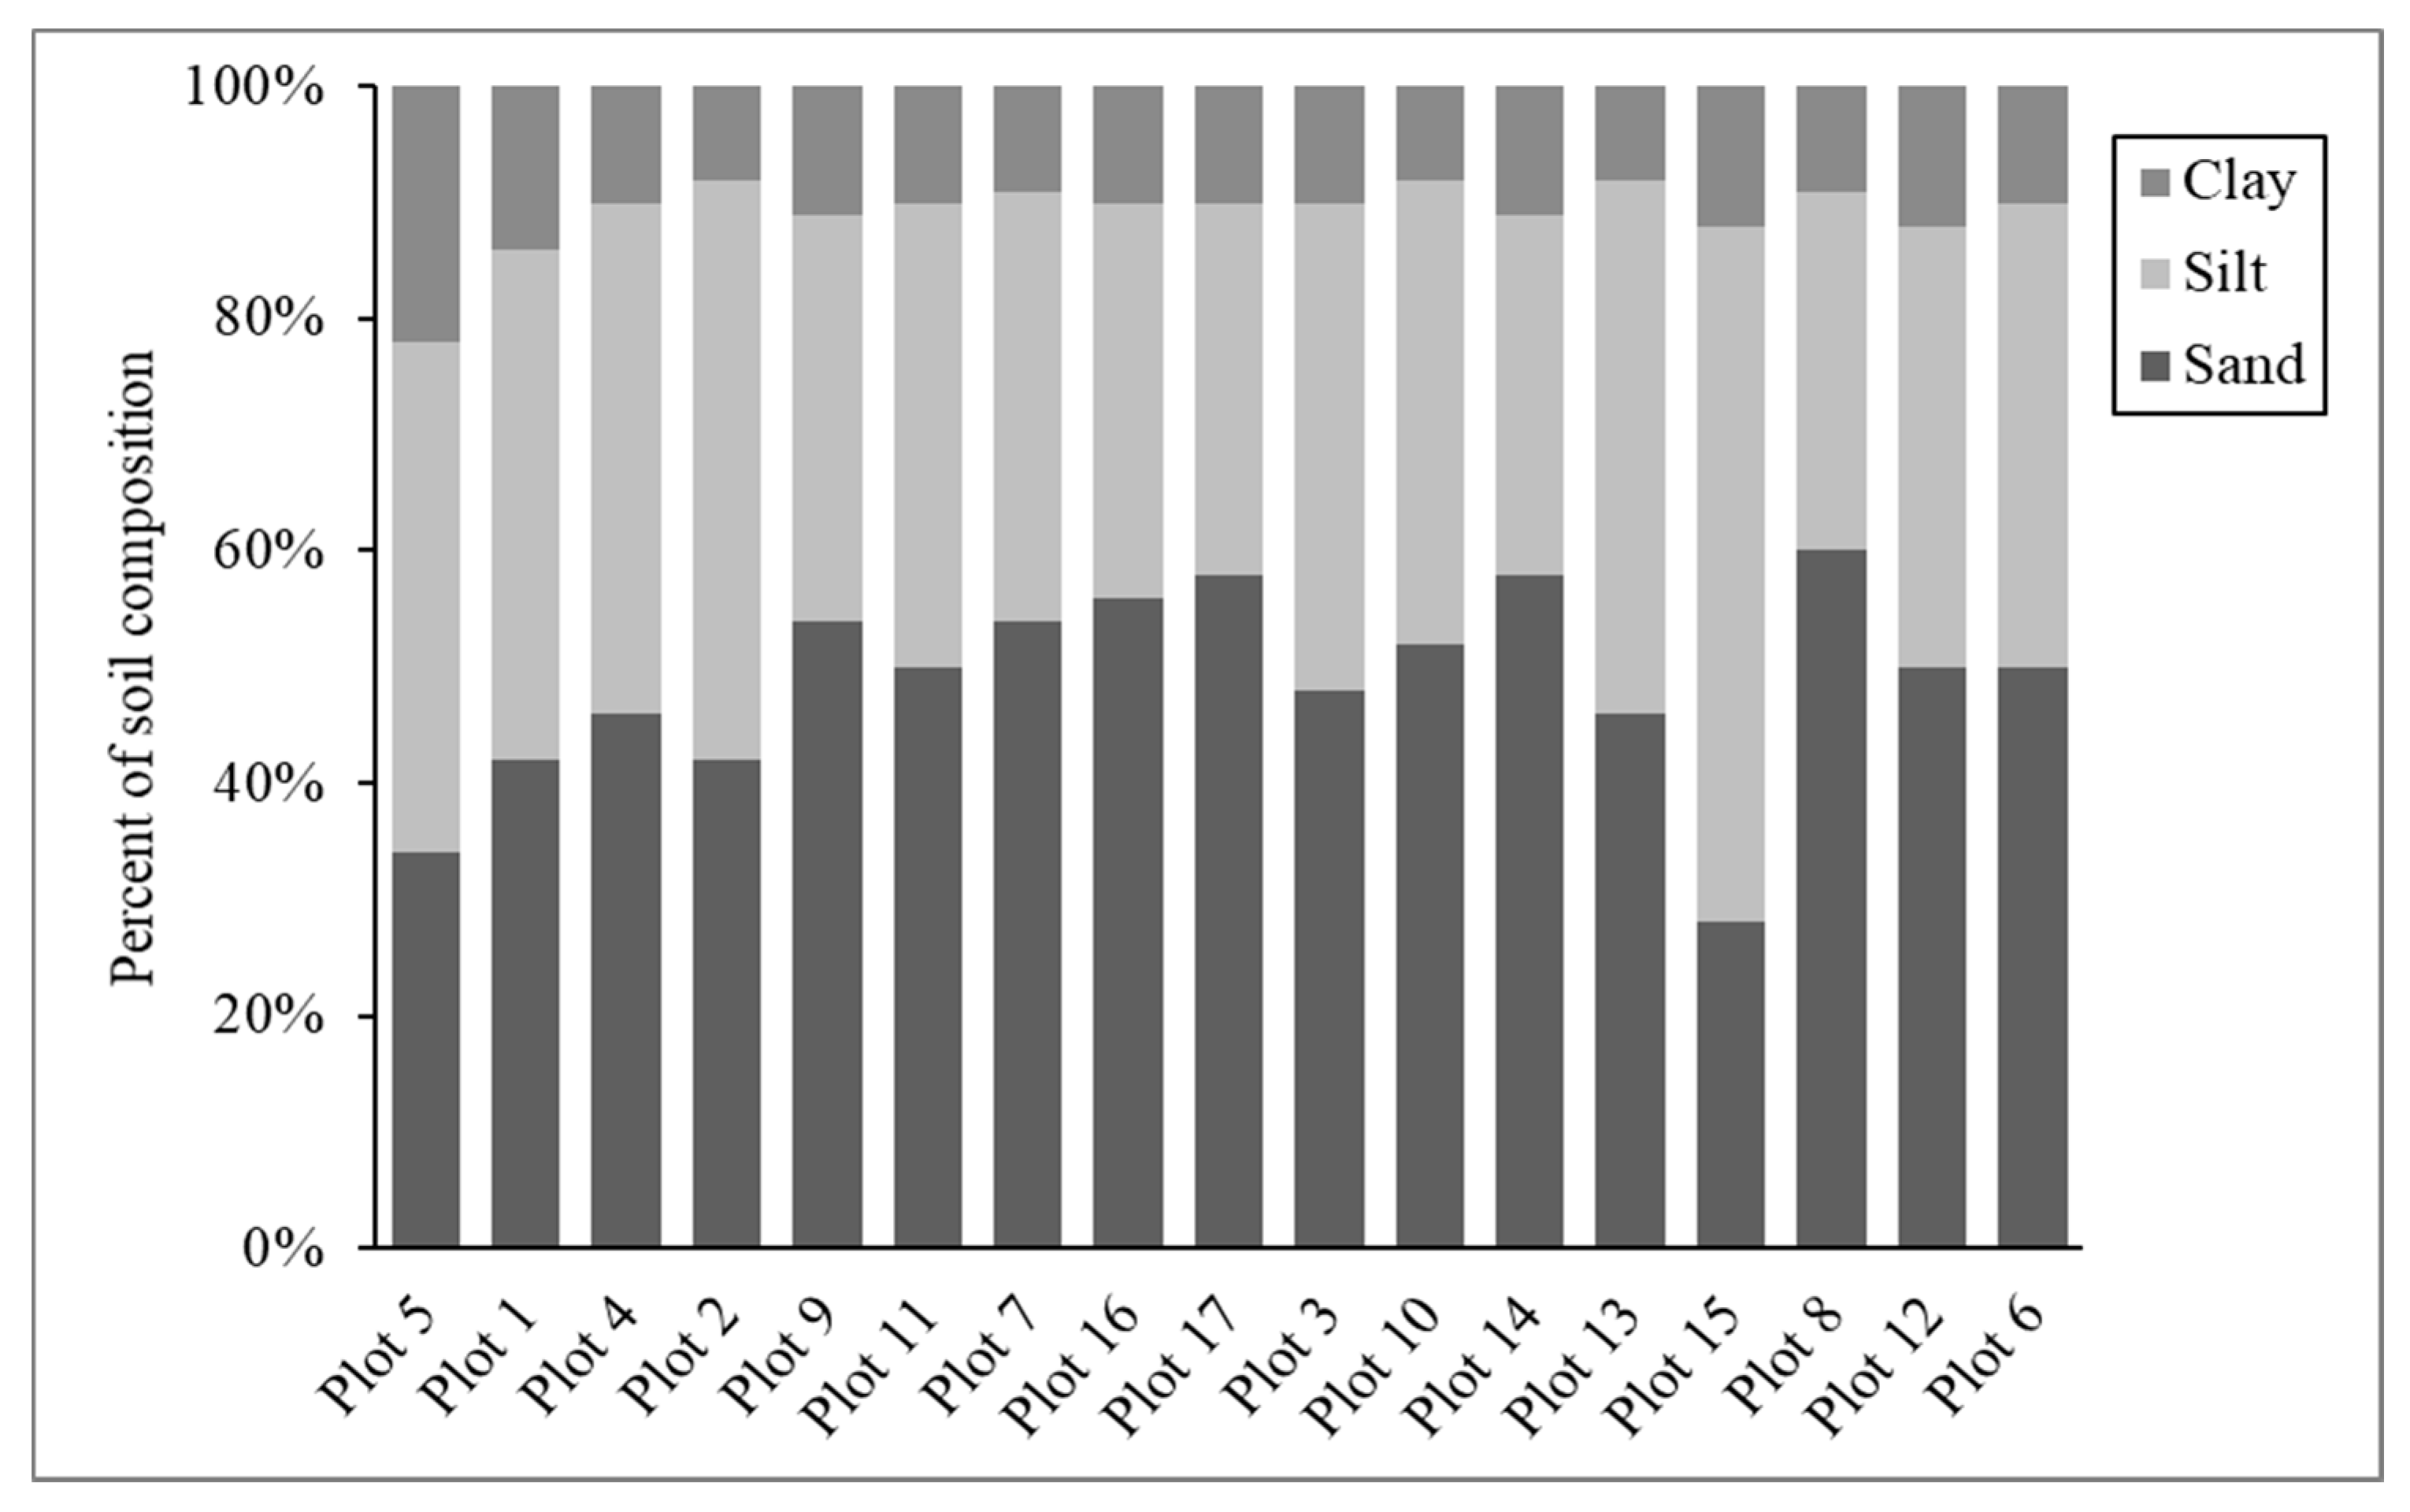
3.2. Soil Attributes

Soil types across plots were identified as loam, sandy loam, and silt loam (Table A3), with the proportion of sand ranging from 28% to 60% (Figure A2), and soil pH values ranging from 4.31 to 6.08 (Table A4). While soil texture and pH attributes promote or limit specific species presence and forest types, vegetation type can also impact pH by way of plant–soil interactions. In forested areas, soil pH levels tend to be more acidic [46], which is the range of pH values observed herein. Additionally, a decrease in soil pH over time due to leaching of soil minerals may be expected, considering the location of Sharp’s Ridge in a warm, humid environment with moderate rainfall and steep slopes. Soils with higher sand content typically have lower buffering capacity (less resistant to changes in pH). Therefore, they are more susceptible to acidification. The average buffer pH of soils across plots was 7.53, indicating moderate resistance to pH changes.
Average soil bulk density across all plots was 1.39 g/cm3, which is ideal for root and plant growth in the soil textures found across the site. However, a variation in bulk density across plots indicates low porosities and compaction that can restrict plant root growth (Table A3) [47]. Bulk densities were significantly negatively correlated with plot elevation, with higher bulk densities occurring at lower elevations (Pearson’s r = −0.580, p = 0.015), and an average plot slope (Pearson’s r = −0.679, p = 0.003) with lower bulk densities found on steeper slopes. A variety of factors could result in soil compaction including tree roots, shallow soil, fallen trees, the presence of worms, wildlife and human disturbance, sampling error, and/or rocky soils.
The average percent soil organic matter (OM) was 5.7%, ranging from 4.0% to 9.8%, and the average percent total carbon was 3.3% and ranged from 2.3% and 5.7% (Table A4). Soil OM in forest soils typically ranges between 1%–5% by weight, tends to be highest at the top of the soil profile, and decreases at greater soil depths [24,48]. Thus, the high organic content of the soil could reflect that a portion of the soil core was collected in the Oa horizon, where a high proportion of plant material is decomposing on the soil surface. While the total carbon in the soil is related to its organic content, given the close proximity of major roadways and a recent waste facility fire, there is also the possibility of soil contamination due to the atmospheric deposition of aerosols and traffic-related emissions, such as hydrocarbons, across the landscape [29]. Regardless, urban soils such as these provide vital ecosystem services, including climate regulation, through the storage of carbon [23].
Measurements of essential plant macro- and micro- nutrients showed considerable variation in nutrient levels within and across plots (Table A4). Phosphorous (P) is a macronutrient essential for plant storage and transport of ATP, which is a photosynthetically produced energy unit, as well as growth and reproduction [49]. Phosphorous levels, which averaged 5.4 kg/ha, were low across all plots, indicating that P is the most limiting nutrient in the soils found at Sharp’s Ridge (Table A4). Phosphorous is a common limited nutrient, because its availability is limited by pH, declining above 7.5 and below 6.5, with the greatest availability at pH 6.5 [50]. Considering the range of soil pH values across samples, low phosphorous levels would be expected. Erosion and water runoff can also result in losses of soil phosphorous [51].
Soil potassium (K) levels across all plots were moderate to high, ranging from 111.0 kg/ha to 315.0 kg/ha (Table A4). Potassium is prevalent in a variety of parent materials and soil minerals, and levels in soil are often high where there is active weathering occurring [50]. However, only certain forms are available in relatively small amounts for plant uptake. Potassium is a plant macronutrient important for transporting water, other nutrients, and carbohydrates throughout plant tissues, and for enzyme activation, which can affect photosynthetic rates [52]. While K deficiencies in soil can lead to leaf chlorosis and eventually necrosis, excessive K levels can be toxic to plants [32].
Across all other nutrients measured, including macronutrients calcium (Ca) and magnesium (Mg), and micronutrients boron (B), iron (Fe), manganese (Mn), sodium (Na), and zinc (Zn), levels in the soil were sufficient for plant growth across most pH values measured (Table A4). Calcium and magnesium in soils are derived from parent materials, and in acidic soils in humid climates such as those on Sharp’s Ridge, are prone to leaching. Deficiencies in Mg negatively affect chlorophyll synthesis, while Ca deficiency can induce toxicity in other nutrients or metals and reduce plant tolerance to water stress [50]. Plant micronutrients are found as trace elements in soil, and many are taken up by plants for use as cofactors in enzyme activation. Due to their importance in chlorophyll formation, deficiencies in any of these micronutrients can lead to chlorosis in different areas of vegetative tissue [32]. Several important considerations should be made when interpreting the results of soil attributes. First, plant nutrient requirements vary greatly depending on species; hence, while the level of a given nutrient may be sufficient for one species, it may be insufficient or toxic for another. Secondly, the quantity and availability of soil nutrients presented are based on agricultural standards, which may not correlate to the productivity of forest species. Lastly, these results apply to a small fraction of the soils sampled across Sharp’s Ridge, and only to the top 10 cm of the soil profile. Heterogeneity in soil attributes is expected across the landscape, and at increasing depths that may be accessible to plants.

3.3. Relationships between Soil Attributes and Forest Bioindicators

Richness, Diversity, Equitability, Native Abundance across Strata

Species richness across all strata was positively related to average bulk density and average soil Zn (Table 2). Increasing numbers of species in each plot were positively correlated to the plot-level abundance of individual plants inventoried (Pearson’s r = 0.518, p = 0.03). Higher plot-level abundance of plants (plant density) will result in a greater density of plant roots in the soil, thereby resulting in higher bulk densities through soil compaction around roots. Additionally, increasing plant abundance may be supported by increasing levels of soil zinc, an essential plant micronutrient that was found in sufficient levels across all plots.
Shannon’s diversity (H) and equitability (E) of native species across the combined overstory and midstory were both significantly and positively related to average soil Zn and Mg levels, while the combined abundance of native individuals in the midstory and overstory was positively related to average soil Zn, and negatively related to average P (Table 2). Magnesium is an essential plant macronutrient that was found in sufficient levels across all plots. If greater amounts of Mg are available in the soil, the soil can support the growth of more plants, and potentially a greater diversity of plant species. Since higher Shannon’s H values are not always indicative of higher values of E, their independent relationships with soil Mg are not necessarily surprising. However, that the positive relationship between soil Mg levels and Shannon’s E is stronger indicates the relative strength of the even distribution of species throughout the community.
The cause of the positive relationship between the abundance of native overstory and midstory individuals and soil Zn levels is likely due the high contribution of midstory individuals to combined native abundances at each plot: species dominant in the midstory are likely contributing the greatest influence on this trend (see within-strata diversity results). The negative relationship between soil P levels and abundance of native individuals may indicate that as plants become more abundant, demands on the availability of this limited macronutrient will increase, potentially leading to lowered P levels in the soil at some sites

3.4. Within-Strata Diversity

Overstory tree diversity was significantly and positively related to the average total C in soils (Table 2). Soil C improves soil structure, thereby decreasing bulk density and improving water-holding capacity, which can support tree growth. Greater overstory diversity may also be related to greater carbon sequestration in the soil. The finding that overstory diversity in particular is positively related to increases in total C in soils is consistent with the findings of a recent study that investigated the relationship between plant biodiversity and soil carbon in natural ecosystems. The researchers found that increases in plant diversity had a positive effect on soil organic carbon storage in several different ecosystem types, including forests [53].
Midstory diversity was most significantly related to average Zn, followed by percent soil silt and average iron (Table 2). As midstory diversity was significantly positively related to midstory vegetation abundance, the positive relationship between Zn levels and midstory species diversity could be related to the ability for soils with increasing Zn levels to support greater densities of midstory vegetation. Silt is a primary component of the soil across Sharp’s Ridge, directly influencing what species can persist there, so native species are expected to be well-adapted to these soils. The positive relationship between the proportion of silt in soils and plant diversity may be explained by the physical properties of silt compared to sand, including water retention and the enhanced ability of nutrient uptake by plants, allowing for a greater diversity of species to be supported [54]. The negative relationship between midstory diversity and Fe levels is unclear, though Fe toxicity is associated with acidic soils [50], which may explain decreases in diversity if certain species avoid or are intolerant of higher Fe levels in soils. Interestingly, understory diversity was not significantly related to any soil attributes.

3.5. Plot-Level Impacts

A summary of plot-level impacts is presented in Table 1. The proportion of gaps in the forest canopy is strongly influenced by the abundance of trees in the overstory and the health of those trees. More canopy openings would be indicative of fewer overstory trees and/or overstory trees in poor health. The proportion of canopy gaps is significantly and positively related to soil Zn (Table 2), which contradicts the finding that greater native abundances across strata are associated with greater Zn levels, and we have no clear explanation for this. Understanding the relationship between soil Zn and canopy gaps requires further investigation into other factors that may be influencing this trend.
Invasive vegetation impacts were significantly positively related to the percent of clay in the soil, and negatively related to soil Fe levels (Table 2). The soils across Sharp’s Ridge are composed primarily of sand and silt (Figure A2), which promotes the growth of certain species types adapted to these conditions [55,56]. Conversely, the lower proportion of clay limits certain species types: clay is also denser and more resistant to water movement than sand and silt, which can inhibit root growth in plant species adapted to loamy soils. Thus, it may be that invasive species with aggressive root systems are capitalizing on this limitation and taking advantage of an open niche in soils with higher clay contents. In a study that investigated the relationship between exotic invasive species and soils in urban wetlands, it was found that soil texture affected the proportion of invasive vegetation and differed between invasive and native species [57]. Gornish and Ambrozio dos Santos [58] also found that soil type was a dominant factor of invasive species cover.
As with midstory diversity, the negative relationship with Fe levels is unclear, and may be a result of potential Fe toxicity in acidic soils [50]. Plant invaders that alter soil properties (e.g., via allelopathy) or thrive in disturbed habitats can readily outcompete native plants that rely on fungal associations, or are sensitive to changes in soil properties and to disturbance [59,60].
The relationship between the proportion of fine woody debris and soil attributes revealed that fine woody debris cover is most significantly related to soil pH, followed by average P and average Na. Fallen leaf litter and decaying materials have a direct impact on soil acidity, so it is unsurprising that fine woody debris is related to soil pH [61]. More interesting is that the greater proportion of fine woody material is related to increases in soil pH, which may help inform management decisions in urban forested natural areas where highly acidic soils may be a concern. Thus, the negative relationship between soil P levels and fine woody debris could be the result of greater abundances of vegetation (discussed earlier), being generally associated with greater amounts of woody debris. The explanation for the positive relationship between soil Na and the proportion of fine woody debris is unclear, but may be associated with the chemical composition of the plant species present, which directly influences the chemical composition of forest litter [50].
For all forest indicators discussed, there are considerable limitations in relating soil attributes to plot-level indicators, primarily due to sampling scale and strategy. While multiple soil cores were collected in each subplot, and the locations across the plot were intended to capture the greatest plot coverage, soil core properties will be more influenced by vegetation in closer proximity to the coring location more than distant vegetation. Differential nutrient requirements between different species will influence local soil conditions, while overstory trees and roots will influence soil properties across broader spatial scales. Plot-level impacts may not be uniformly distributed across the plot. More reliable interpretations of the relationships between forest indicators and soil attributes requires collecting samples at appropriate scales and/or experimental manipulations.

4. Conclusions

As complements to vegetation inventories, baseline soil surveys in urban areas can help inform recreation management and environmental restoration efforts, and help minimize soil losses, pollution, disturbance, erosion, compaction, and risks to human health in urban forests [21,24]; however, such informed management requires much more comparative data on the relationships between soils and biodiversity than is currently available [35]. We argue that this case study has made some progress toward answering these relevant questions: What is the general quality and composition of soil in urban forest remnants? How is biodiversity in urban forest remnants related to the soil composition in those habitats? How are invasive species influenced by soil composition, including litter and other types of soil disturbance?
Regarding the general quality and composition of soil in urban forest remnants, we found considerable spatial variation, as expected from any urban habitat with decades of human activity. Both micro- and macronutrients show this variation; however, overall levels of these soil nutrients were generally adequate for plant growth in most areas measured. Phosphorus appears to be the most limiting nutrient, related in part to natural pH levels as well as erosion and other local processes. We also found that soil was, overall, not heavily disturbed, with only 13.4% as the average proportion of soil modification in plots.
Relating biodiversity to soil composition, we found several intriguing patterns. Zinc stood out as being consistently positively correlated with species richness and abundance, in general, and for native species in the overstory and midstory. Carbon and magnesium were also implicated as important influences that correlated positively with some aspects of plant diversity. Silt and woody debris were also indicated as important correlates of plant diversity.
Finally, we found some relationships between invasive species and soils in this urban remnant forest. Invasive species were highly variable in abundance, ranging from 0-90%, with a median impact of 13.5% overall. Interestingly, invasive vegetation seemed to benefit from increasing clay content and was negatively affected by soil iron levels. Furthermore, dumping occurred in over 75% of plots, indicating anthropogenic disturbances that likely promoted invasive plant establishment.

Author Contributions

Conceptualization: M.T.W., S.J.-P. and M.L.M.; methodology: M.T.W. and S.J.-P.; investigation: M.T.W.; resources: M.L.M.; data curation: M.T.W.; writing—original draft: M.T.W.; writing—review and editing: M.L.M. and S.J.-P.; supervision: M.L.M. and S.J.-P. All authors have read and agreed to the published version of the manuscript.

Funding

This research received no external funding.

Data Availability Statement

All data are available in Excel file format upon request from corresponding author (McKinney).

Conflicts of Interest

The authors declare no conflict of interest.

Appendix A

Figure A1. Soil map for the 17-hectare parcel at Sharp’s Ridge (USDA Natural Resource Conservation Service Web Soil Survey, 2019).
Forests 14 00487 g0a1
Table A1. Soil map legend for Area of Interest presented in Figure A1 (USDA Natural Resource Conservation Service Web Soil Survey, 2019).
Map Unit SymbolMap Unit NameHectares in AOIPercent of AOI
AmDApison-Montevallo complex, 12 to 25 percent slopes0.321.8%
AmEApison-Montevallo complex, 25–35 percent slopes, rocky2.4314.1%
AmFApison-Montevallo complex, 35 to 75 percent slopes, rocky12.0669.8%
SaDSalacoa gravelly loam, 12 to 25 percent slopes2.3913.9%
SbCSalcoa-Apison complex, 5 to 12 percent slopes0.040.3%
UuUrban land-Udorthents complex0.00.1%
Totals for Area of Interest17.24100.0%
Note: Apison–Montevallo (Am) soils are loamy/shaly soils commonly found on ridgetops with varying depths and characterized by shale or siltstone material with sandstone, derived from residuum or colluvium. Salacoa (S) is the deepest, most well-drained soil in this complex, derived from colluvium. The AMS complex type is found in steep mixed woodlands. Urban land-Udorthents are typical in urban areas where soils have been modified by cutting, filling, or mechanical disturbance.
Table A2. Coordinates of 17 ecological sampling plots in this study.
PLOTLATLONG
Plot 136.0025106−83.94927621
Plot 236.00197844−83.95000384
Plot 336.00020893−83.95195902
Plot 436.00213861−83.94895458
Plot 536.00345394−83.94786174
Plot 636.00155746−83.94590983
Plot 735.99924814−83.9530034
Plot 836.00040706−83.94916099
Plot 936.00277919−83.94664926
Plot 1035.99985932−83.95189211
Plot 1136.00015073−83.95275281
Plot 1236.00057602−83.94823461
Plot 1335.9989089−83.9524609
Plot 1436.00200854−83.94619979
Plot 1536.00153933−83.94726715
Plot 1636.00022314−83.95121101
Plot 1736.0010602−83.95088963
Figure A2. Soil texture across all plots by increasing elevation (n = 17).
Forests 14 00487 g0a2
Table A3. Soil volumetric water content, bulk density, and texture analyses and relationships to plot aspect, average slope, and plant root growth.
PlotAspectAvg. SlopeTextureAvg. Volumetric Water Content (%)Avg. Bulk Density (g/mL)Ideal (I), Affected (A), Restricted (R) *
Plot 1W6.2Loam51.251.77A
Plot 2NW19.2Silt Loam44.631.33I
Plot 3S13.8Loam51.381.62A
Plot 4W11.6Loam48.881.72A
Plot 5SW13.0Loam47.251.82R
Plot 6N24.0Loam35.501.30I
Plot 7NW22.8Sandy Loam33.501.12I
Plot 8NE25.1Sandy Loam34.131.06I
Plot 9W11.5Sandy Loam41.501.19I
Plot 10SW17.4Loam35.381.24I
Plot 11SW14.8Loam52.501.82R
Plot 12NW17.6Loam39.881.20I
Plot 13W21.6Loam31.131.39I
Plot 14W21.9Sandy Loam39.751.35I
Plot 15W23.6Silt Loam34.751.29I
Plot 16NW25.5Sandy Loam42.001.32I
Plot 17NE20.6Sandy Loam37.631.09I
Avg.-18.2-41.241.39I
S.D.-5.6-6.96.26-
n1717-17130-
* For the soil textures found, the bulk density for ideal plant root growth is <1.40 g/mL and restricted root growth occurs >1.75–1.80 g/mL (Natural Resources Conservation Service, 2019).
Table A4. Results of organic matter, total carbon, pH, and plant available nutrient analyses (n = 65).
PlotAvg. %
Organic Matter
Avg. %
Total C
Avg.
pH
PKCaMgBFeMnNaZn
(All Nutrients in kg/ha)
Plot 14.4%2.6%4.319.3195.6470.8113.20.76155.3201.211.511.5
Plot 25.7%3.3%4.905.0144.0535.188.60.5454.996.28.48.2
Plot 36.0%3.5%5.723.1209.61153.3172.11.0126.373.88.210.3
Plot 44.0%2.3%5.175.9129.5310.982.70.4548.282.49.07.0
Plot 54.1%2.4%5.235.2191.81116.6212.30.7838.544.210.18.4
Plot 64.5%2.6%5.227.3132.1310.369.80.3967.8165.97.310.1
Plot 75.2%3.0%5.872.7173.61262.5143.00.7227.968.27.210.1
Plot 85.7%3.3%5.565.0213.3792.5125.30.6534.564.56.211.7
Plot 94.9%2.8%5.164.3111.0526.373.20.4852.563.37.16.4
Plot 107.4%4.3%6.087.6251.11877.5282.81.2127.2134.08.49.3
Plot 116.0%3.5%5.652.0200.7839.4163.40.7344.823.98.210.8
Plot 125.5%3.2%4.922.8123.9398.081.30.4876.049.18.47.7
Plot 137.4%4.3%5.883.7158.11729.5179.10.7863.1138.87.616.1
Plot 144.5%2.6%4.993.1123.9194.547.10.3776.231.97.64.8
Plot 154.9%2.8%5.004.5199.3339.495.10.3794.780.28.47.3
Plot 166.7%3.9%6.037.1173.52014.4248.91.2913.2139.96.711.1
Plot 179.8%5.7%5.9612.7315.03107.7293.71.6627.2208.37.813.0
Average5.7%3.3%4.315.4179.1998.7145.40.754.698.08.19.6
Std. Dev.0.01%0.01%4.902.752.6793.276.70.333.956.81.32.7
Avg. Nutrient *--5.72LMSS-SS-S
* L = low, M = medium, S = sufficient.

References

  1. Tratalos, J.; Fuller, R.A.; Warren, P.H.; Davies, R.G.; Gaston, K.J. Urban form, biodiversity potential and eco-system services. Landsc. Urban Plan. 2007, 83, 308–317. [Google Scholar] [CrossRef]
  2. Barrico, L.; Castro, H.; Coutinho, A.P.; Gonçalves, M.T.; Freitas, H.; Castro, P. Plant and microbial biodiversity in urban forests and public gardens: Insights for cities’ sustainable development. Urban For. Urban Green. 2018, 29, 19–27. [Google Scholar] [CrossRef]
  3. Pregitzer, C.C.; Ashton, M.S.; Charlop-Powers, S.; D’Amato, A.W.; Frey, B.R.; Gunther, B.; Hallett, R.A.; Pregitzer, K.S.; Woodall, C.W.; Bradford, M.A. Defining and assessing urban forests to inform management and policy. Environ. Res. Lett. 2019, 14, 085002. [Google Scholar] [CrossRef]
  4. Nowak, D.J.; Greenfield, E.J. US Urban Forest Statistics, Values, and Projections. J. For. 2018, 116, 164–177. [Google Scholar] [CrossRef] [Green Version]
  5. Pregitzer, C.; Forgione, H.; King, K.; Charlop-Powers, S.; Greenfeld, J. Forest Management Framework for New York City; Natural Areas Conservancy: New York, NY, USA, 2018; pp. 1–44. [Google Scholar]
  6. McKinney, M.L.; Ingo, K.; Kendal, D. The contribution of wild urban ecosystems to liveable cities. Urban For. Urban Green. 2018, 29, 334–335. [Google Scholar] [CrossRef]
  7. Miller, J.R. Biodiversity conservation and the extinction of experience. Trends Ecol. Evol. 2005, 20, 430–434. [Google Scholar] [CrossRef]
  8. Kahn, P.H.; Kellert, S.R. Experiencing Nature: Affective, Cognitive, and Evaluative Development in Children. In Children and Nature: Psychological, Sociocultural, and Evolutionary Investigations; The MIT Press: Cambridge, MA, USA, 2002; p. 117151. [Google Scholar] [CrossRef]
  9. Bowler, D.E.; Buyung-Ali, L.M.; Knight, T.M.; Pullin, A.S. A systematic review of evidence for the added benefits to health of exposure to natural environments. BMC Public Health 2010, 10, 456. [Google Scholar] [CrossRef] [Green Version]
  10. Chen, W.Y.; Jim, C.Y. Assessment and Valuation of the Ecosystem Services Provided by Urban Forests. In Ecology, Planning, and Management of Urban Forests International Perspectives; Carreiro, M.M., Song, Y.C., Wu, J., Eds.; Springer: New York, NY, USA, 2008; pp. 53–83. [Google Scholar] [CrossRef]
  11. Lovell, S.T.; Taylor, J.R. Supplying urban ecosystem services through multifunctional green infra-structure in the United States. Landsc. Ecol. 2013, 28, 1447–1463. [Google Scholar] [CrossRef]
  12. Ives, C.D.; Lentini, P.E.; Threlfall, C.G.; Ikin, K.; Shanahan, D.F.; Garrard, G.E.; Bekessy, S.A.; Fuller, R.A.; Mumaw, L.; Rayner, L.; et al. Cities are hotspots for threatened species. Glob. Ecol. Biogeogr. 2016, 25, 117–126. [Google Scholar] [CrossRef]
  13. Nielsen, A.B.; Bosch, M.V.D.; Maruthaveeran, S.; Bosch, C.K.V.D. Species richness in urban parks and its drivers: A review of empirical evidence. Urban Ecosyst. 2014, 17, 305–327. [Google Scholar] [CrossRef]
  14. Zefferman, E.P.; McKinney, M.L.; Cianciolo, T.; Fritz, B.I. Knoxville’s urban wilderness: Moving toward sus-tainable multifunctional management. Urban For. Urban Green. 2018, 29, 357–366. [Google Scholar] [CrossRef]
  15. Pregitzer, C.C.; Charlop-Powers, S.; Bibbo, S.; Forgione, H.M.; Gunther, B.; Hallett, A.; Bradford, M.A. A city-scale assessment reveals that nativeforest types and overstory species dominate New York City forests. Ecol. Appl. 2019, 29, e01819. [Google Scholar] [CrossRef] [PubMed] [Green Version]
  16. Dearborn, D.C.; Kark, S. Motivations for Conserving Urban Biodiversity. Conserv. Biol. 2010, 24, 432–440. [Google Scholar] [CrossRef] [PubMed]
  17. Nowak, D.J.; Crane, D.E.; Stevens, J.C.; Hoehn, R.E.; Walton, J.T.; Bond, J. A Ground-Based Method of Assessing Urban Forest Structure and Ecosystem Services. Arboric. Urban For. 2008, 34, 347–358. [Google Scholar] [CrossRef]
  18. Aronson, M.F.; Lepczyk, C.A.; Evans, K.L.; Goddard, M.A.; Lerman, S.B.; MacIvor, J.S.; Nilon, C.H.; Vargo, T. Biodiversity in the city: Key challenges for urban green space management. Front. Ecol. Environ. 2017, 15, 189–196. [Google Scholar] [CrossRef] [Green Version]
  19. Konijnendijk, C.C. New Perspectives for Urban Forests: Introducing Wild Woodlands. In Wild Urban Woodlands; Springer: Berlin/Heidelberg, Germany, 2005; pp. 33–45. [Google Scholar] [CrossRef]
  20. Forgione, H.M.; Pregitzer, C.C.; Charlop-Powers, S.; Gunther, B. Advancing urban ecosystem governance in New York City: Shifting towards a unified perspective for conservation management. Environ. Sci. Policy 2016, 62, 127–132. [Google Scholar] [CrossRef] [Green Version]
  21. Pavao-Zuckerman, M.A. The Nature of Urban Soils and Their Role in Ecological Restoration in Cities. Restor. Ecol. 2008, 16, 642–649. [Google Scholar] [CrossRef]
  22. Riddle, R. Urban Soils. [Online] United States Department of Agriculture, Natural Resources Conservation Service. 2010. Available online: https://www.nrcs.usda.gov/wps/-portal/nrcs/main/soils/use/urban/ (accessed on 8 July 2020).
  23. Blanchart, A.; Séré, G.; Cherel, J.; Warot, G.; Stas, M.; Noël, C.J.; Morel, J.L.; Schwartz, C. Towards an opera-tional methodology to optimize ecosystem services provided by urban soils. Landsc. Urban Plan. 2018, 176, 1–9. [Google Scholar]
  24. Scheyer, J.M.; Hipple, K.W. Urban Soil Primer. United States Department of Agriculture, Natural Resources Conservation Service, National Soil Survey Center, Lincoln, Nebraska. 2005. Available online: http://soils.usda.gov/use (accessed on 20 July 2020).
  25. Pickett, S.T.A.; Cadenasso, M.L.; Grove, J.M.; Groffman, P.M.; Band, L.E.; Boone, C.G.; Burch, W.R.; Grimmond, C.S.B.; Hom, J.; Jenkins, J.C.; et al. Beyond Urban Legends: An Emerging Framework of Urban Ecology, as Illustrated by the Baltimore Ecosystem Study. Bioscience 2008, 58, 139–150. [Google Scholar] [CrossRef] [Green Version]
  26. Pickett, S.T.A.; Cadenasso, M.L. Altered resources, disturbance, and heterogeneity: A framework for comparing urban and non-urban soils. Urban Ecosyst. 2009, 12, 23–44. [Google Scholar] [CrossRef]
  27. Delbecque, N.; Dondeyne, S.; Gelaude, F.; Mouazen, A.M.; Vermeir, P.; Verdoodt, A. Urban soil properties distinguished by parent material, land use, time since urbanization, and pre-urban geomorphology. Geoderma 2022, 413, 115719. [Google Scholar] [CrossRef]
  28. Craul, P.J. Urban Soils: Applications and Practices; John Wiley & Sons: Hoboken, NJ, USA, 1999. [Google Scholar]
  29. Sauerwein, M. Urban soils–characterization, pollution and relevance in urban ecosystems. In Urban Ecology: Patterns, Processes, and Applications; Cambridge University Press: Cambridge, UK, 2011; pp. 45–58. [Google Scholar]
  30. Gaston, K.J.; Davies, Z.G.; Edmondson, J.L. Urban environments and ecosystem functions. In Urban Ecology; Cambridge University Press: Cambridge, UK, 2010; pp. 35–52. [Google Scholar] [CrossRef]
  31. O’Riordan, R.; Davies, J.; Stevens, C.; Quinton, J.N.; Boyko, C. The ecosystem services of urban soils: A review. Geoderma 2021, 395, 115076. [Google Scholar] [CrossRef]
  32. Morgan, J.B.; Connolly, E.L. Plant-Soil Interactions: Nutrient Uptake. Nat. Educ. Knowl. 2013, 4, 2. [Google Scholar]
  33. Charlop-Powers, Z.; Pregitzer, C.C.; Lemetre, C.; Ternei, M.A.; Maniko, J.; Hover, B.M.; Calle, P.Y.; McGuire, K.L.; Garbarino, J.; Forgione, H.M.; et al. Urban park soil microbiomes are a rich reservoir of natural product biosynthetic diversity. Proc. Natl. Acad. Sci. USA 2016, 113, 14811–14816. [Google Scholar] [CrossRef] [Green Version]
  34. Threlfall, C.G.; Kendal, D. The distinct ecological and social roles that wild spaces play in urban ecosystems. Urban For. Urban Green. 2018, 29, 348–356. [Google Scholar] [CrossRef]
  35. Guilland, C.; Maron, P.A.; Damas, O.; Ranjard, L. Biodiversity of urban soils for sustainable cities. Environ. Chem. Lett. 2018, 16, 1267–1282. [Google Scholar] [CrossRef]
  36. Mooney, L.; Mooney, D.; Trently, D.; Nicholson, C.P. “Sharp’s Ridge Memorial Park.” Tennessee Important Bird Areas, Tennessee Wildlife Resources Agency. 2006. Available online: https://www.tnbirds.org/IBA/SitePages/SharpsRidge.htm (accessed on 22 August 2019).
  37. USDA Natural Resource Conservation Service. Web Soil Survey. 2019. Available online: https://websoilsurvey.sc.egov.usda.gov/App/WebSoilSurvey.aspx (accessed on 7 May 2019).
  38. The Natural Areas Conservancy, the Natural Resources Group of the New York City Parks Department, and the U.S. Forest Service. Natural Areas Conservancy Upland and Forest Assessment Field Protocol, Unpublished Document. Available online: https://fic.naturalareasnyc.org/docs/upland-and-forest-ecological-assessment-protocol-nyc (accessed on 22 August 2019).
  39. IBM Corp. IBM SPSS Statistics for Windows, Version 25.0; IBM Corp: Armonk, NY, USA, 2017. [Google Scholar]
  40. Tabachnick, B.G.; Fidell, L.S.; Ullman, J.B. Using Multivariate Statistics; Pearson: Boston, MA, USA, 2007; Volume 5, pp. 481–498. [Google Scholar]
  41. Gilliam, F.S. The Ecological Significance of the Herbaceous Layer in Temperate Forest Ecosystems. BioScience 2007, 57, 845–858. [Google Scholar] [CrossRef]
  42. Kowarik, I.; Hiller, A.; Planchuelo, G.; Seitz, B.; Von Der Lippe, M.; Buchholz, S. Emerging Urban Forests: Opportunities for Promoting the Wild Side of the Urban Green Infrastructure. Sustainability 2019, 11, 6318. [Google Scholar] [CrossRef] [Green Version]
  43. Putz, J. The Biology of Vines; Cambridge University Press: Cambridge, UK, 1991. [Google Scholar]
  44. Aryal, P.C.; Aryal, C.; Bhusal, K.; Chapagain, D.; Dhamala, M.K.; Maharjan, S.R.; Chhetri, P.K. Forest structure and anthropogenic disturbances regulate plant invasion in urban forests. Urban Ecosyst. 2022, 25, 367–377. [Google Scholar] [CrossRef]
  45. Sonti, N.F.; Pregitzer, C.C.; Hallett, R.A. Native tree seedling growth and physiology responds to variable soil conditions of urban natural areas. Restor. Ecol. 2022, 30, e13653. [Google Scholar] [CrossRef]
  46. Natural Resources Conservation Service. Soil Health: Soil pH. [Online] Soil Health for Educators, United States Department of Agriculture. 2014; pp. 1–6. Available online: https://www.nrcs.usda.gov/Internet/FSE_DOCUMENTS/nrcs142p2_-051574.pdf (accessed on 20 July 2020).
  47. Natural Resources Conservation Service. Soil Health: Bulk Density, Moisture, Aeration. [Online] Soil Health for Edu-cators, United States Department of Agriculture. 2019; pp. 1–11. Available online: https://www.nrcs.usda.gov/Internet/FSE_-DOCUMENTS/nrcs142p2_053260.pdf (accessed on 20 July 2020).
  48. Osman, K.T. Organic Matter of Forest Soils. In Forest Soils; Springer: Cham, Switzerland, 2013; pp. 63–76. [Google Scholar] [CrossRef]
  49. Smeck, N.E. Phosphorus dynamics in soils and landscapes. Geoderma 1985, 36, 185–199. [Google Scholar] [CrossRef]
  50. Kimmins, J.P. Soil. In Forest Ecology; Prentice Hall, Inc.: Upper Saddle River, NJ, USA, 1997; pp. 228–268. [Google Scholar]
  51. Natural Resources Conservation Service. Soil Health: Soil Phosphorous. [Online] Soil Health for Educators, United States Department of Agriculture. 2014; pp. 1–6. Available online: https://www.nrcs.usda.gov/Internet/FSE_DOCUMENTS/-nrcs142p2_051878.pdf (accessed on 22 July 2020).
  52. Kaiser, D.E.; Rosen, C.J. Potassium for Crop Production. [Online] University of Minnesota Extension. 2018. Available online: https://extension.umn.edu/phosphorus-and-potassium/potassium-crop-production (accessed on 22 July 2020).
  53. Chen, S.; Wang, W.; Xu, W.; Wang, Y.; Wan, H.; Chen, D.; Tang, Z.; Tang, X.; Zhou, G.; Xie, Z.; et al. Plant diversity enhances productivity and soil carbon storage. Proc. Natl. Acad. Sci. USA 2018, 115, 4027–4032. [Google Scholar] [CrossRef] [PubMed] [Green Version]
  54. Sheard, R.W. Understanding Turf Management: Sand, Silt, and Clay. [Online] Michigan State University Libraries, Sports Turf Newsletter. 1991, pp. 1–3. Available online: https://archive.lib.msu.edu/tic/stnew/article/1991sep4.pdf (accessed on 22 July 2020).
  55. Bárcenas-Argüello, M.L.; del Carmen Gutiérrez-Castorena, M.; Terrazas, T. The Role of Soil Properties in Plant Endemism—A Revision of Conservation Strategies. In Soil Processes and Current Trends in Quality Assessment; IntechOpen: Rijeka, Croatia, 2013; pp. 381–398. [Google Scholar] [CrossRef] [Green Version]
  56. Hulshof, C.M.; Spasojevic, M.J. The edaphic control of plant diversity. Glob. Ecol. Biogeogr. 2020, 29, 1634–1650. [Google Scholar] [CrossRef]
  57. Ehrenfeld, J.G. Exotic invasive species in urban wetlands: Environmental correlates and implications for wetland management. J. Appl. Ecol. 2008, 45, 1160–1169. [Google Scholar] [CrossRef]
  58. Gornish, E.S.; Ambrozio dos Santos, P. Invasive species cover, soil type, and grazing interact to predict long-term grassland restoration success. Restor. Ecol. 2016, 24, 222–229. [Google Scholar] [CrossRef]
  59. Hierro, J.L.; Callaway, R.M. Allelopathy and exotic plant invasion. Plant Soil 2003, 256, 29–39. [Google Scholar] [CrossRef]
  60. Callaway, R.M.; Thelen, G.C.; Rodriguez, A.; Holben, W.E. Soil biota and exotic plant invasion. Nature 2004, 427, 731–733. [Google Scholar] [CrossRef]
  61. Tóth, J.A.; Nagy, P.T.; Krakomperger, Z.; Veres, Z.; Kotroczó, Z.; Kincses, S.; Fekete, I.; Papp, M. Effect of litter fall on soil nutrient content and pH, and its consequences in view of climate change (Síkfőkút DIRT Project). Acta Sil-Vatica Lignaria Hung. 2011, 7, 75–86. [Google Scholar]
Table 1. Forest health indicators used in this study, derived from ecological field measurements taken at each of the 17 sampling plots (unless otherwise indicated). Note that values of Shannon’s H and Equitability are indicated by ‡ and §, respectively. S.D. = standard deviation. Median and interquartile range are presented for non-normally distributed variables.
Forest Health IndicatorMeanS.D.MedianIQR
Diversity and Equitability
(Shannon’s H ‡ and EH §)
    Overstory (>10 cm DBH)1.47 ‡0.51 ‡
0.84 §0.11 §
    Midstory (2–10 cm DBH)1.75 ‡0.57 ‡
0.71 §0.14 §
    Combined2.07 ‡0.78 ‡
0.47 §0.09 §
Species richness29.87.09
    Abundance
    Overstory144.57
    Midstory7339.43
Relative basal area28.7 m2/ha13.56
Percent of healthy
overstory trees30.80%14.30%
Percent of overstory trees with vines in canopy63.70%27.10%
Percent of plot impacted
Canopy gap36.30%24.20%
Invasive vegetation--13.50%25.00%
Tree damage20.30%12.10%
Fine woody debris (n = 16)22.50%19.50%
Soil modification (n = 16)--10.30%10.50%
Anthropogenic dumping--1.00%2.70%
Table 2. Results of stepwise multiple regression models showing significant relationships between soil attributes and ecological indicators. * p < 0.05; ** p < 0.01; *** p < 0.001.
Ecological IndicatorF ChangeDFAdj R-sqIndep VariablesStd ErrBeta p
Total Species Richness *6.341, 140.478Avg bulk dens4.970.5970.005
Avg Zn0.5270.4550.025
Over+Mid Diversity **11.171, 130.768Avg Zn0.0280.4730.006
% Silt0.0080.4520.003
Avg Mg0.0010.4890.005
Over+Mid Equitability *5.881, 140.537Avg Mg00.7290.001
% Silt0.0020.420.029
Over+Mid Native Abund **13.641, 140.624Avg Zn2.7560.770
Avg P2.743−0.5950.002
Overstory Diversity ***15.191, 150.47Avg Total C0.1080.7090.001
Midstory Diversity *5.541, 130.689Avg Zn0.0330.7030.001
% Silt0.0120.5120.005
Avg Fe0.003−0.360.035
Canopy Gaps *5.591, 150.223Avg Zn0.0220.5210.032
Invasive Vegetation ***15.771, 140.649% Clay1.1650.7070.001
Avg Fe0.126−0.6440.001
Fine Woody Debris *15.971, 120.856Avg pH6.2560.9360.001
Avg P1.08−0.5940.001
Avg Na2.8520.4920.011
Disclaimer/Publisher’s Note: The statements, opinions and data contained in all publications are solely those of the individual author(s) and contributor(s) and not of MDPI and/or the editor(s). MDPI and/or the editor(s) disclaim responsibility for any injury to people or property resulting from any ideas, methods, instructions or products referred to in the content.

