Article

Tissue Metabolic Responses to Artificial Bending and Gravitation Stimuli in Betula platyphylla

State Key Laboratory of Tree Genetics and Breeding, School of Forestry, Northeast Forestry University, Harbin 150040, China
*
Author to whom correspondence should be addressed.
Forests 2023, 14(3), 457; https://doi.org/10.3390/f14030457
Submission received: 17 January 2023 / Revised: 11 February 2023 / Accepted: 16 February 2023 / Published: 22 February 2023
(This article belongs to the Section Forest Ecophysiology and Biology)

Abstract

:
Betula platyphylla Suk (Asian white birch) is an economically important tree species in the paper-pulping and biofuel industries. To investigate the mechanism of wood formation at the metabolic level, we evaluated metabolic responses associated with tension-wood formation. Four-year-old trees were subjected to artificial bending treatment for 6 weeks. The xylem growth rate of tension wood (TW) was significantly faster than that of opposite wood (OW), and it exhibited a higher cellulose content. Metabolomics analysis was performed on metabolites of TW, OW and normal wood (NW), and 183 metabolites were identified, of which levels of 142 were altered between groups. Metabolites related to fatty-acid and amino-acid metabolism, the glycolytic pathway, and the metabolism of fructose, mannose and starch sucrose were abundant in TW. Glucose 1-phosphoric acid, fructose and mannose associated with tension-wood development were elevated. Levels of xylitol and ribosol (related to the conversion of glucose), coniferol (the main monomer of lignin) and shikimic acid (an intermediate in lignin synthesis) were decreased in TW. These metabolites are likely involved in xylem development.

1. Introduction

Wood is a renewable natural resource produced by trees that provides important source material for construction and energy [1]. Wood, also known as secondary xylem, is produced seasonally by the vascular cambium on the periphery of the trunk. This meristem is derived from the procambium and is responsible for the secondary growth of stems and roots [2]. Wood formation is a complex biological process. In response to certain environmental factors such as mechanical stimuli, trees can regulate their growth and tissue differentiation. Trees can grow a special kind of wood, called reaction wood (RW), which has specific mechanical properties, to adjust the orientation of its axis, trunk and branches, and thereby maintain the overall balance of the tree [3,4].
In angiosperms, opposite wood (OW) is formed at the lower side of the leaning trunk, while tension wood (TW) is produced on the top of the inclined axis [5]. This wood is characterised by a particularly long fiber, known as the gelatinous fiber (G fiber), a thick inner G layer mainly composed of pure cellulose. It also contains a higher proportion of fibers and a lower proportion of vessel elements [6,7,8]. By measuring the temporal and spatial deposition of non-cellulose polysaccharides in the cell walls of willow TW, OW and normal wood (NW), it was found that the deposition of non-cellulose polysaccharides made from 1,4-β-D-galactan and mannan was closely related to TW, and usually related to the G layer itself. However, only xylan has a similar distribution in TW, OW and NW [9]. Similarly, Raman spectroscopy analysis of the G layer of poplar TW showed that there was no lignin or other aromatic compounds in the G layer. In addition to cellulose and lignin, cell walls contain numerous non-cellulose polysaccharides that play an important role in their formation and development [10]. Since the structural characteristics and metabolic composition of RW are very different from NW, it is of great significance to reveal the chemical composition and the characteristics of RW [11].
Due to advances in high-throughput omics studies and genetic engineering of woody plants, RW formation has been widely used as an experimental system to analyse the molecular mechanism of wood formation [11]. Transcriptomics, proteomics and metabolomics are affordable and efficient, and can expand our understanding of networks and pathways at the levels of gene expression, the proteome and the metabolome. Although RW formation has been studied using various high-throughput omics approaches, including transcriptomics and proteomics, few studies have been performed on RW formation using metabolomics. However, as the final products of genes, metabolites may be important in the process of RW formation.
Metabonomics can detect and quantify the components and contents of various metabolites in organisms, and reveal aspects and principles of physiological processes [12]. Metabonomics analysis of two Acer species showed that the process of senescence and discolouration exists in leaves of different Acer species, and the regulatory strategy shows species specificity [13]. The main techniques used in plant metabolomics research are gas chromatography–mass spectrometry (GC–MS), liquid chromatography–MS (LC–MS), Fourier-transform ion cyclotron resonance–MS (FTICR–MS), capillary electrophoresis–MS (CE–MS) and nuclear magnetic resonance spectroscopy (NMR) [14,15]. Metabolites in plants change with different environmental factors, indicating that plants have different adaptability to the environment of different latitudes [16]. Therefore, metabonomics is a direct way to study this process, and it has been widely used in plants [17,18]. For example, in cell protection in salt-tolerant barley, hexose phosphate and trichloroacetic acid (TCA) cycling intermediates are increased with the increasing salt concentration [19] and untargeted metabonomics analysis of tea plants showed significant differences in the biosynthesis of phenylalanine and the metabolism of flavonoids and flavonols. Many pathways related to amino-acid metabolism were also altered in Chinese chestnut tea, indicating that intercropping had a great influence on amino-acid metabolism in tea plants [20].
Betula platyphylla Suk (Asian white birch) is a broad-leaved pioneer-tree species that grows and regenerates quickly in disturbed habitats. It has a widespread distribution and plays an important role in stabilising forest ecosystems and in forest regeneration. Birch wood can be used to generate bioenergy, and is widely used in making veneers and in paper pulping [21]. Furthermore, the outer bark of birch is rich in the valuable natural triterpenoid betulin and other substances of medicinal value [22]. The genetic responses of birch xylem to artificial bending and gravity stimuli have been studied. During the formation of TW, genes involved in cellulose biosynthesis were induced while lignin-biosynthesis-related genes were downregulated, resulting in an increase in cellulose content and a decrease in lignin levels in TW [23]. In the present study, through metabolomic analysis, we revealed differential metabolites and changes in metabolic pathways related to the formation of RW. These results help to illuminate the molecular mechanism of wood formation in B. platyphylla.

2. Materials and Methods

2.1. Plant Materials and Treatments

Four-year-old birch (B. platyphylla) clones were grown in pots in a greenhouse and watered thoroughly. Stems of ten trees were bent over at an angle of 45° from vertical by pulling the trunk with ropes during the growth period (May) when the cambium was very active and xylem was developing and another ten upright trees were set as control. After bending for 6 weeks, bark was removed and 50 cm of the developing xylem of the maximum-curved stems was scraped from the upper side of the leaning trunk (TW), the lower side of the leaning trunk (OW) and both sides of the upright trees (NW) at the same height in all trees. These samples were frozen immediately in liquid nitrogen and stored at −80 °C for metabonomics analysis and 5 cm segments from the middle part of the stem samples were prepared for anatomical analysis. Ten biological replicates of TW, OW and NW were used.

2.2. Anatomical Analysis

To examine the formation of TW and OW, cross-sections of the upper and lower sides of the bent stems were prepared using a 1007 sliding microtome (Leica, Nussloch, Germany). Sections were stained with Safranine-O/Fast Green and photographed using an SZX7 camera (Olympus, Tokyo, Japan).

2.3. Extraction of Metabolites

Metabolites from TW, OW and NW (~100 mg of fresh weight) were extracted as described previously [24]. Samples of TW, OW and NW stored at −80 °C were ground into fine powders in a mortar under liquid nitrogen. After transferring into 2 mL centrifuge tubes, 600 μL of 100% ethanol (pre-cooled at −20 °C) was added and vortexed for 10 s, and 60 μL of ribitol (0.2 mg/mL stock in dH2O) was added as an internal quantitative standard and vortexed for 10 s. To homogenise the tissue, two steel balls were added, samples were frozen in liquid nitrogen, and homogenised using a Qiagen Tissuelyzer II (Germantown, MD, USA) for 5 min at 70 Hz. After centrifuging at 11,000× g for 10 min, the supernatant (500 μL) was transferred into a vacuum concentrator for drying. Dried samples were added to 80 μL of 15 mg/μL methoxyamine pyridine solution, vortexed for 30 s, and reacted for 120 min at 37 °C. After adding 80 μL of Bis (trimethylsilyl) trifluoro acetamide (BSTFA) reagent (containing 1% chlorotrimethylsilane (TMCS)) mixtures were reacted for 60 min at 70 °C.

2.4. Detection of Metabolites

After the above reactions, GC time-of-flight (TOF) MS analysis was performed using an Agilent 7890 GC system combined with a Pegasus 4D TOF MS instrument. The system included a DB-5MS capillary column coated with 5% dipheyl cross-linked with 95% dimethylpolysiloxane. A 1 μL aliquot of the analyte was injected in splitless mode. Helium was used as the carrier gas, the front inlet purge flow was 15 mL min−1, and the gas flow rate through the column was 1 mL min−1. The initial temperature was kept at −80 °C for 0.2 min, then raised to 190 °C at a rate of 10 °C min−1, then to 220 °C at a rate of 3 °C min−1, and finally to 280 °C at a rate of 20 °C min−1 for 16.8 min. The injection, transfer line, and ion source temperature were 280, 270 and 220 °C, respectively. The energy was −70 eV in electron impact mode. MS data were acquired in full-scan mode with an m/z range of 20–600 at a rate of 10 spectra per s after a solvent delay of 480 s.

2.5. Analytical Methods

Samples were analysed by GC/TOFMS using L-2-chlorophenylalanine as an internal standard (IS) for batch quality control. In addition, L-2-chlorophenylalanine was employed in assays of process variability during sample preparation and data processing. Metabolite identification was carried out by LECO’s ChromaTOF®® software (LECO, St. Joseph, MI, USA) coupled with LECO-Fiehn Rtx5 (St. Joseph, MI) and National Institute of Standards and Technology (NIST) spectral library databases. The dataset acquired from GC/TOFMS analysis was exported into comma-separated values (CSV) format by ChromaTOF. Peaks generated by noise, column bleed or by-products in the silylation procedure were manually removed. The resulting data were normalised to the area of the IS (IS peaks were removed afterwards), mean-centred, then subjected by unit variance scaling for further statistical analysis. Principal component analysis (PCA), projection to latent structures (PLS) and orthogonal projection to latent structures (OPLS) were performed using the SIMCA-p+ v11.0 software package (Umetrics, Umeå, Sweden). In the OPLS-DA models, metabolites with variable importance in the projection (VIP) >1 were considered important for potential identification. Student’s t-tests (p < 0.05) were used to establish the statistical significance of correlations between experimental parameters and metabolic information.

3. Results

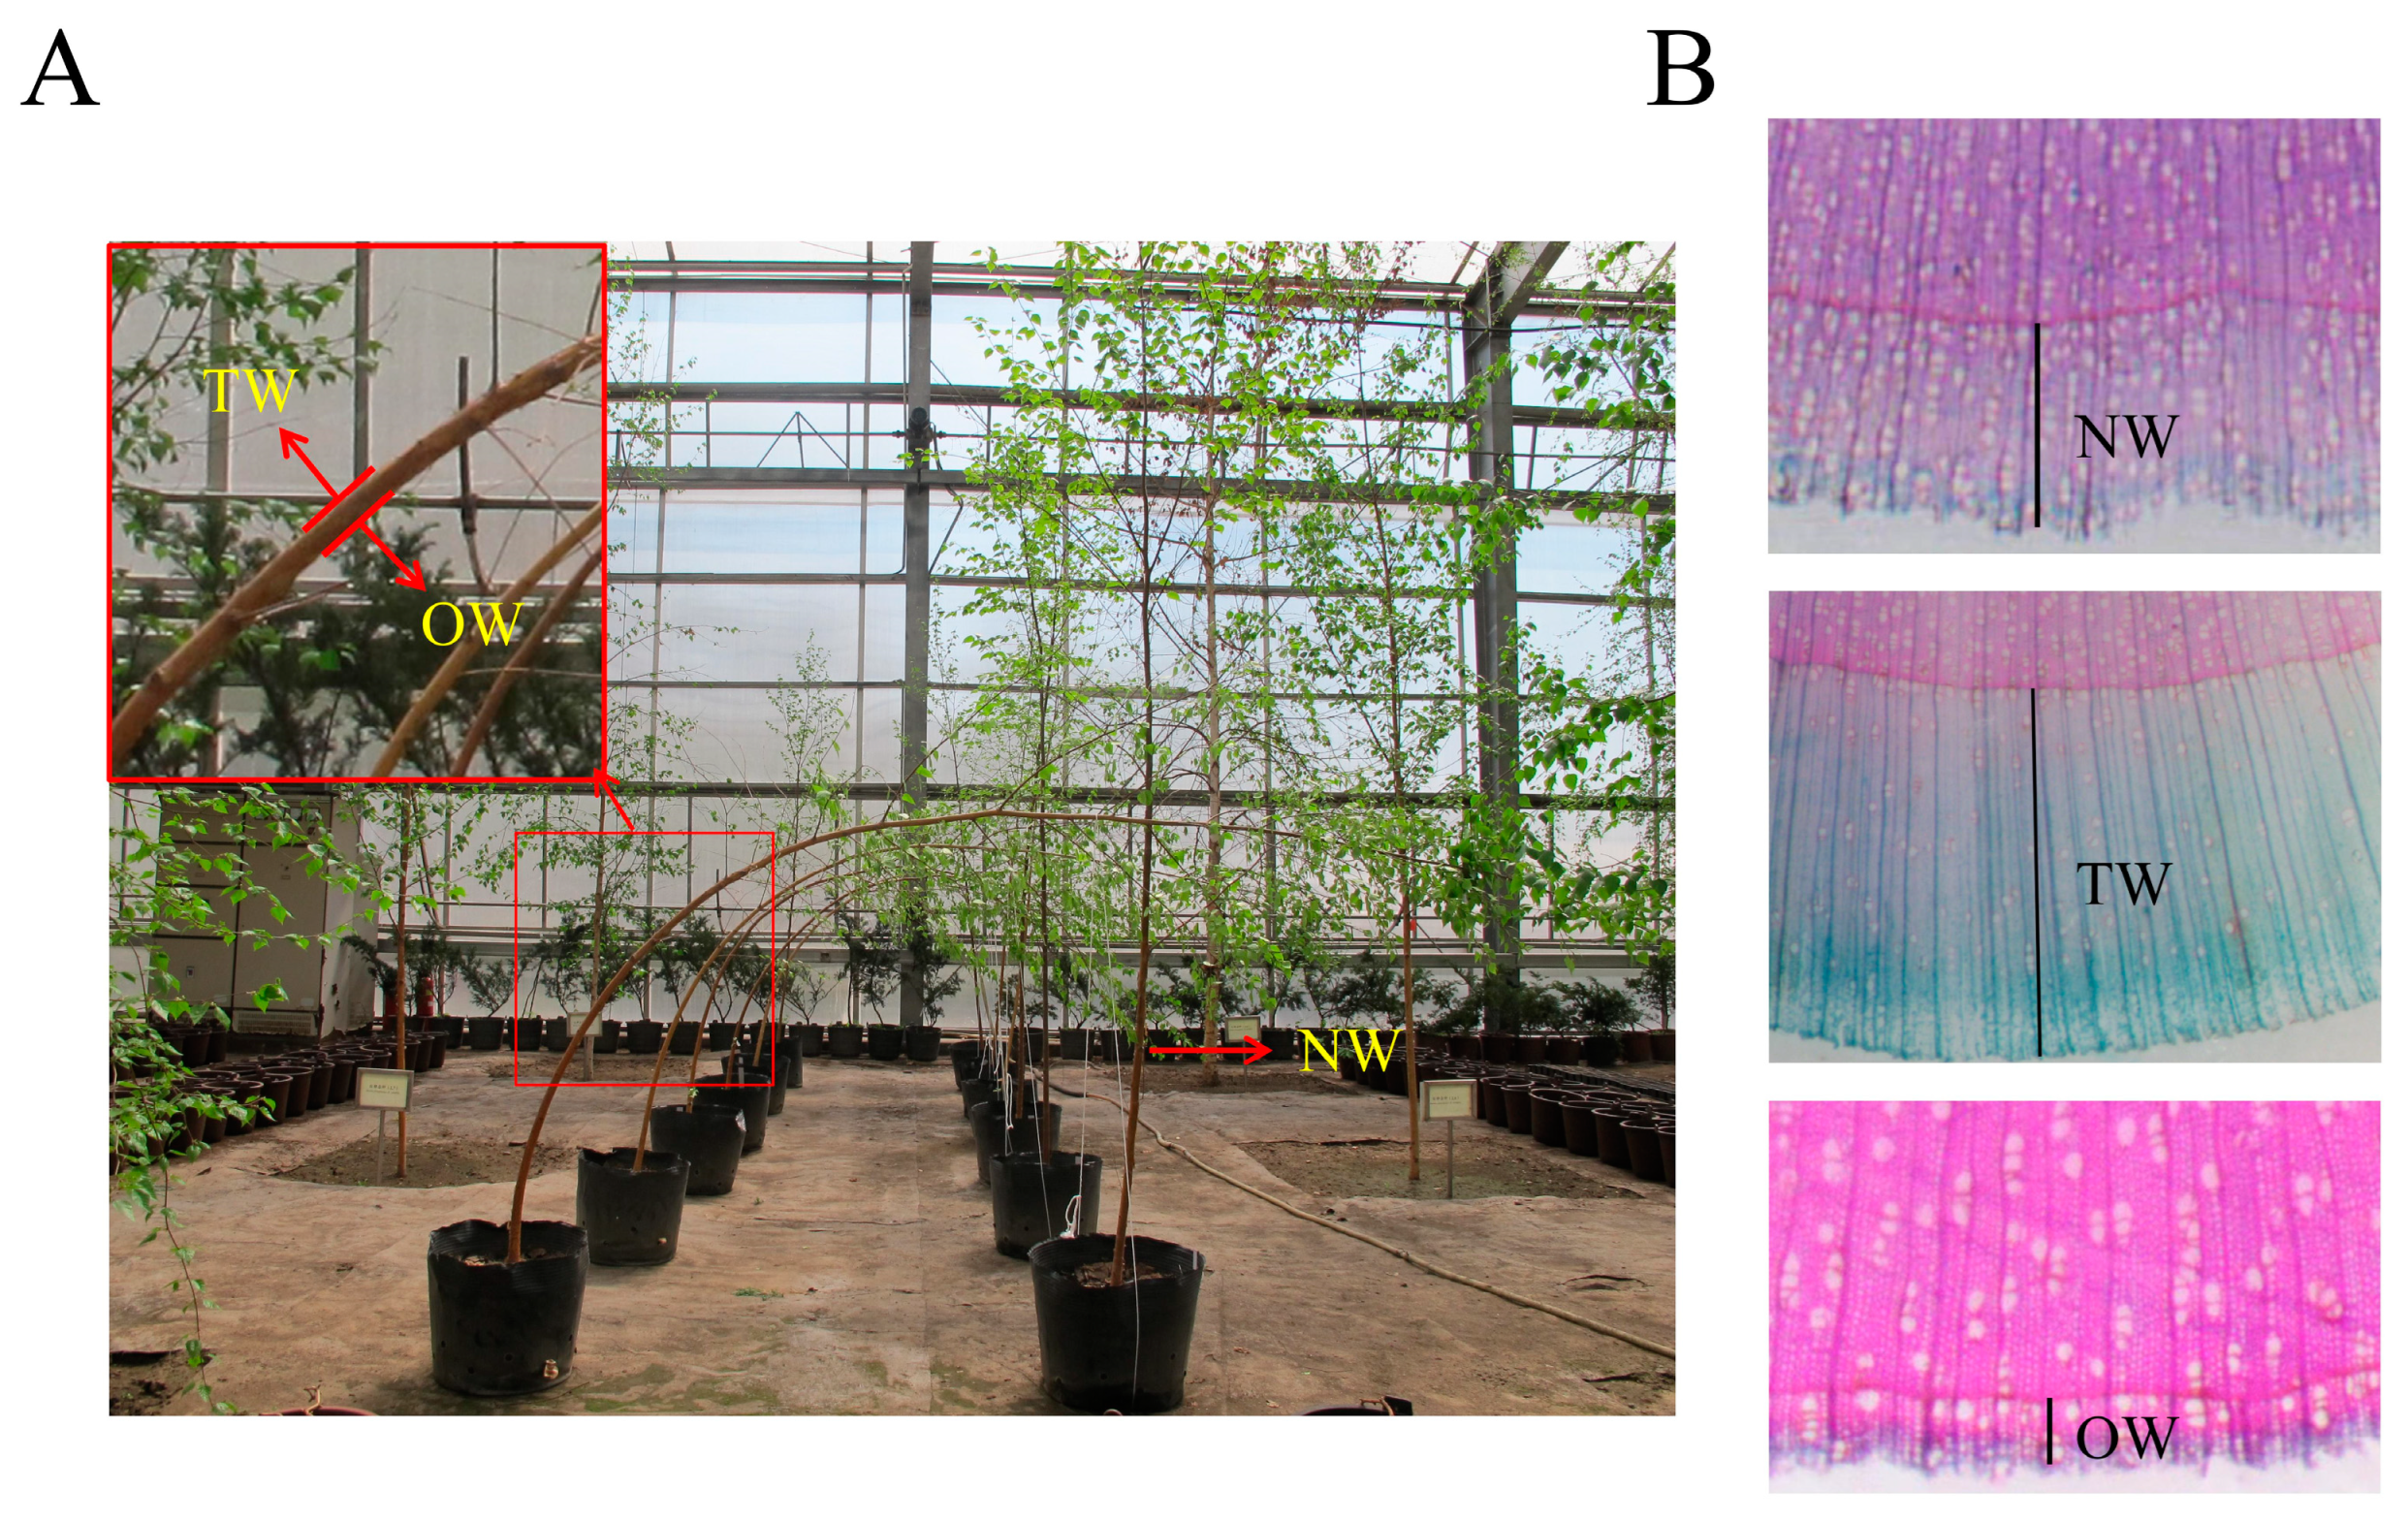
3.1. Growth Performance of TW

Four-year-old birch trees that showed cambium activity starting in May were bent for 6 weeks, developing xylem from upper (TW) and lower (OW) sides was harvested, and developing xylem from straight trees (NW) served as a control. To characterise the growth performance and confirm the formation of TW induced by bending, sections were prepared from TW, OW and NW. Observation of sections revealed obvious differences in growth rates between TW, OW and NW, which led to unusual growth of birch stems and resulted in eccentric growth (Figure 1A). In addition, based on Fast Green staining, TW exhibited higher cellulose levels and a lower proportion of vessel elements, while most OW and NW was stained by Safranin O (Figure 1B).

3.2. Identification of Metabolites in TW, OW and NW

To investigate the mechanisms of TW formation in birch at the metabolic level, metabolites in the TW, OW and NW were identified. A total of 183 metabolites were identified and their concentrations were determined (Table S1). The retention time was reproducible and stable, indicating the reliability of metabolomic analysis. Levels of some metabolites were higher than others in all three samples, including glucose, malic acid, ethanolamine, threonic acid, oxoproline, 4-aminobutyric acid and lactobionic acid (Table 1). Glucose2 was the most abundant in all three tissues, indicating that it is the main metabolite in the cell wall. Isopropyl-beta-D-thiogalactopyranoside was abundant in both TW and OW, implying its role in response to bending treatment of the xylem. The high levels of these metabolites suggest that they may play essential roles in the development of xylem.

3.3. Metabolomics Analysis following Gravitational and Mechanical Bending Stimuli

PCA and PLS-DA revealed clear differences between the three groups (Figure 2). Samples of TW, OW and NW were clearly separated according to PC1, which accounted for 25.6% of the variation. Meanwhile, PC2 distinguished TW, OW and NW and accounted for 18.8% of the variation (Figure 2). Using VIP > 1 for PC1 in the OPLS-DA model, combined with a p < 0.05, 142 differential metabolites were identified among TW, OW and NW (Table S2), of which 85 metabolites were significantly altered (p < 0.05) between TW and OW (62 increased, 23 decreased). In total, 99 metabolites were altered in TW compared with NW (62 increased, 37 decreased). Compared with NW, 38 metabolites were upregulated and 52 metabolites were downregulated in OW, and 90 metabolites differed significantly between OW and NW (Table 2).
The metabolites making the main contributions to PC1 were related to citric acid of the TCA cycle, cis-1,2-dihydronaphthalene-1,2-diol associated with the degradation of aromatic compounds, and linoleic acid from linoleic-acid metabolism. Between TW and NW, the main metabolites contributing to PC1 were arbutin related to glycolysis, cis-1,2-dihydronaphthalene-1,2-diol and linoleic acid, and this was also the case for OW and NW (Table 3). These metabolites may play roles in the xylem responses to gravitational signals and mechanical bending stimuli.

3.4. Analysis of Differential Metabolites Involved in Major Metabolic Pathways

To explore the metabolic pathways related to the xylem developmental responses to bending stimuli, differential metabolites and their Kyoto Encyclopedia of Genes and Genomes (KEGG) pathways were identified, and found to be linked to starch and sucrose metabolism, fructose and mannose metabolism, glycolysis and galactose metabolism, the TCA cycle, fatty-acid metabolism, and amino-acid metabolism (Table S3). A heatmap was plotted to visualise the changes in metabolites among NW, OW and NW in different metabolic pathways (Figure 3).
Glucose-1-phosphate is an intermediate in various pathways including pentose and glucuronate interconversions, starch and sucrose metabolism, fructose and mannose metabolism, and glycolysis and galactose metabolism. Glucose-1-phosphate, fructose and mannose were increased in TW compared with OW and NW (Table S3 and Figure 4). The content of arbutin related to the glycolysis pathway was higher in TW than OW and NW tissues. In the starch–sucrose metabolism pathway, the content of glucuronic acid levels was elevated. However, in the pentose and glucuronate conversion pathways, the contents of xylitol and ribosol in TW were lower than in NW and OW, indicating that xylose synthesis was inhibited in TW (Table S3 and Figure 3).
Lignin is synthesised via the shikimic-acid pathway, the phenylpropanoid-biosynthesis pathway, and the lignin-biosynthesis pathway. Sinapyl alcohol and coniferyl alcohol are the main monolignins in angiosperms. Coniferyl alcohol is the monolignin of G-lignin, and shikimic is the key intermediate related to lignin synthesis. We found that levels of shikimic and coniferyl alcohols were decreased in TW compared with OW and NW, indicating that lignin synthesis was inhibited in TW (Table S3 and Figure 3).
Fatty acids and lipids are essential components of all plant cells, not only providing structural integrity and energy for various metabolic processes, but also serving as signal-transduction mediators [25]. Some metabolites related to fatty-acid metabolism were enriched in TW compared with OW and NW, including 1-monopalmitin, linoleic acid methyl ester, dihydroxyacetone, glycerol, ethanolamine, 2-monoolein, linoleic acid, palmitic acid, linolenic acid and stearic acid (Table S2 and Figure 3). These results suggest that fatty-acid metabolism was affected by artificial bending, and it may positively regulate the formation of TW.
Meanwhile, aspartic acid, isoleucine, norleucin, serine, proline, tyrosine, valine and other amino acids also accumulated to higher levels in TW (Table S3 and Figure 3). This suggests that amino-acid metabolism is of great significance for the formation of TW. Similarly, since these metabolites are also involved in other metabolic pathways, this may explain the complex metabolic programming occurring in TW.
In the present study, l-malic acid, citric acid and maleic acid of the TCA cycle were reduced in TW compared with OW and NW, but enhanced in OW compared with NW. By contrast, fumaric acid of the TCA cycle was increased in TW compared with OW and NW (Table S3 and Figure 3).

4. Discussion

4.1. Unusual Growth and Metabolic Changes in TW, OW and NW

In this study, sections of TW and OW tissues were subjected to 6 weeks of bending, and there were obvious differences in growth rates between TW and OW, which led to unusual growth of the birch stems (Figure 1A). Sections stained with Safranine-O/Fast Green showed that the developing xylem of TW had low levels of lignification, while the developing xylem of OW and NW was more lignified than that of TW (Figure 1B). These results are consistent with the findings of our previous study showing obvious differences in growth rates between TW and OW, and the cellulose content in TW was significantly higher than in OW or NW, whereas the lignin content was significantly lower in TW than in the other types of wood after trees were subjected to bending stress [23]. Wood formation is the result of specific types of metabolism [26]. Previous studies have shown that metabolic change affects the characteristics of plants, hence the construction of wood cell walls may be related to metabolic alterations [27,28,29,30]. Since the growth and composition of cellulose and lignin were altered in birch TW, we speculate that the synthesis of various metabolites in these tissues was also changed, providing an opportunity to study the metabolic regulation of xylem formation. Indeed, in the present metabolome analysis, PCA and OPLS-DA models indicated significant metabolite differences in TW, NW and OW (Figure 2). Therefore, it is feasible to use these samples to analyse metabolite changes during the formation of TW.

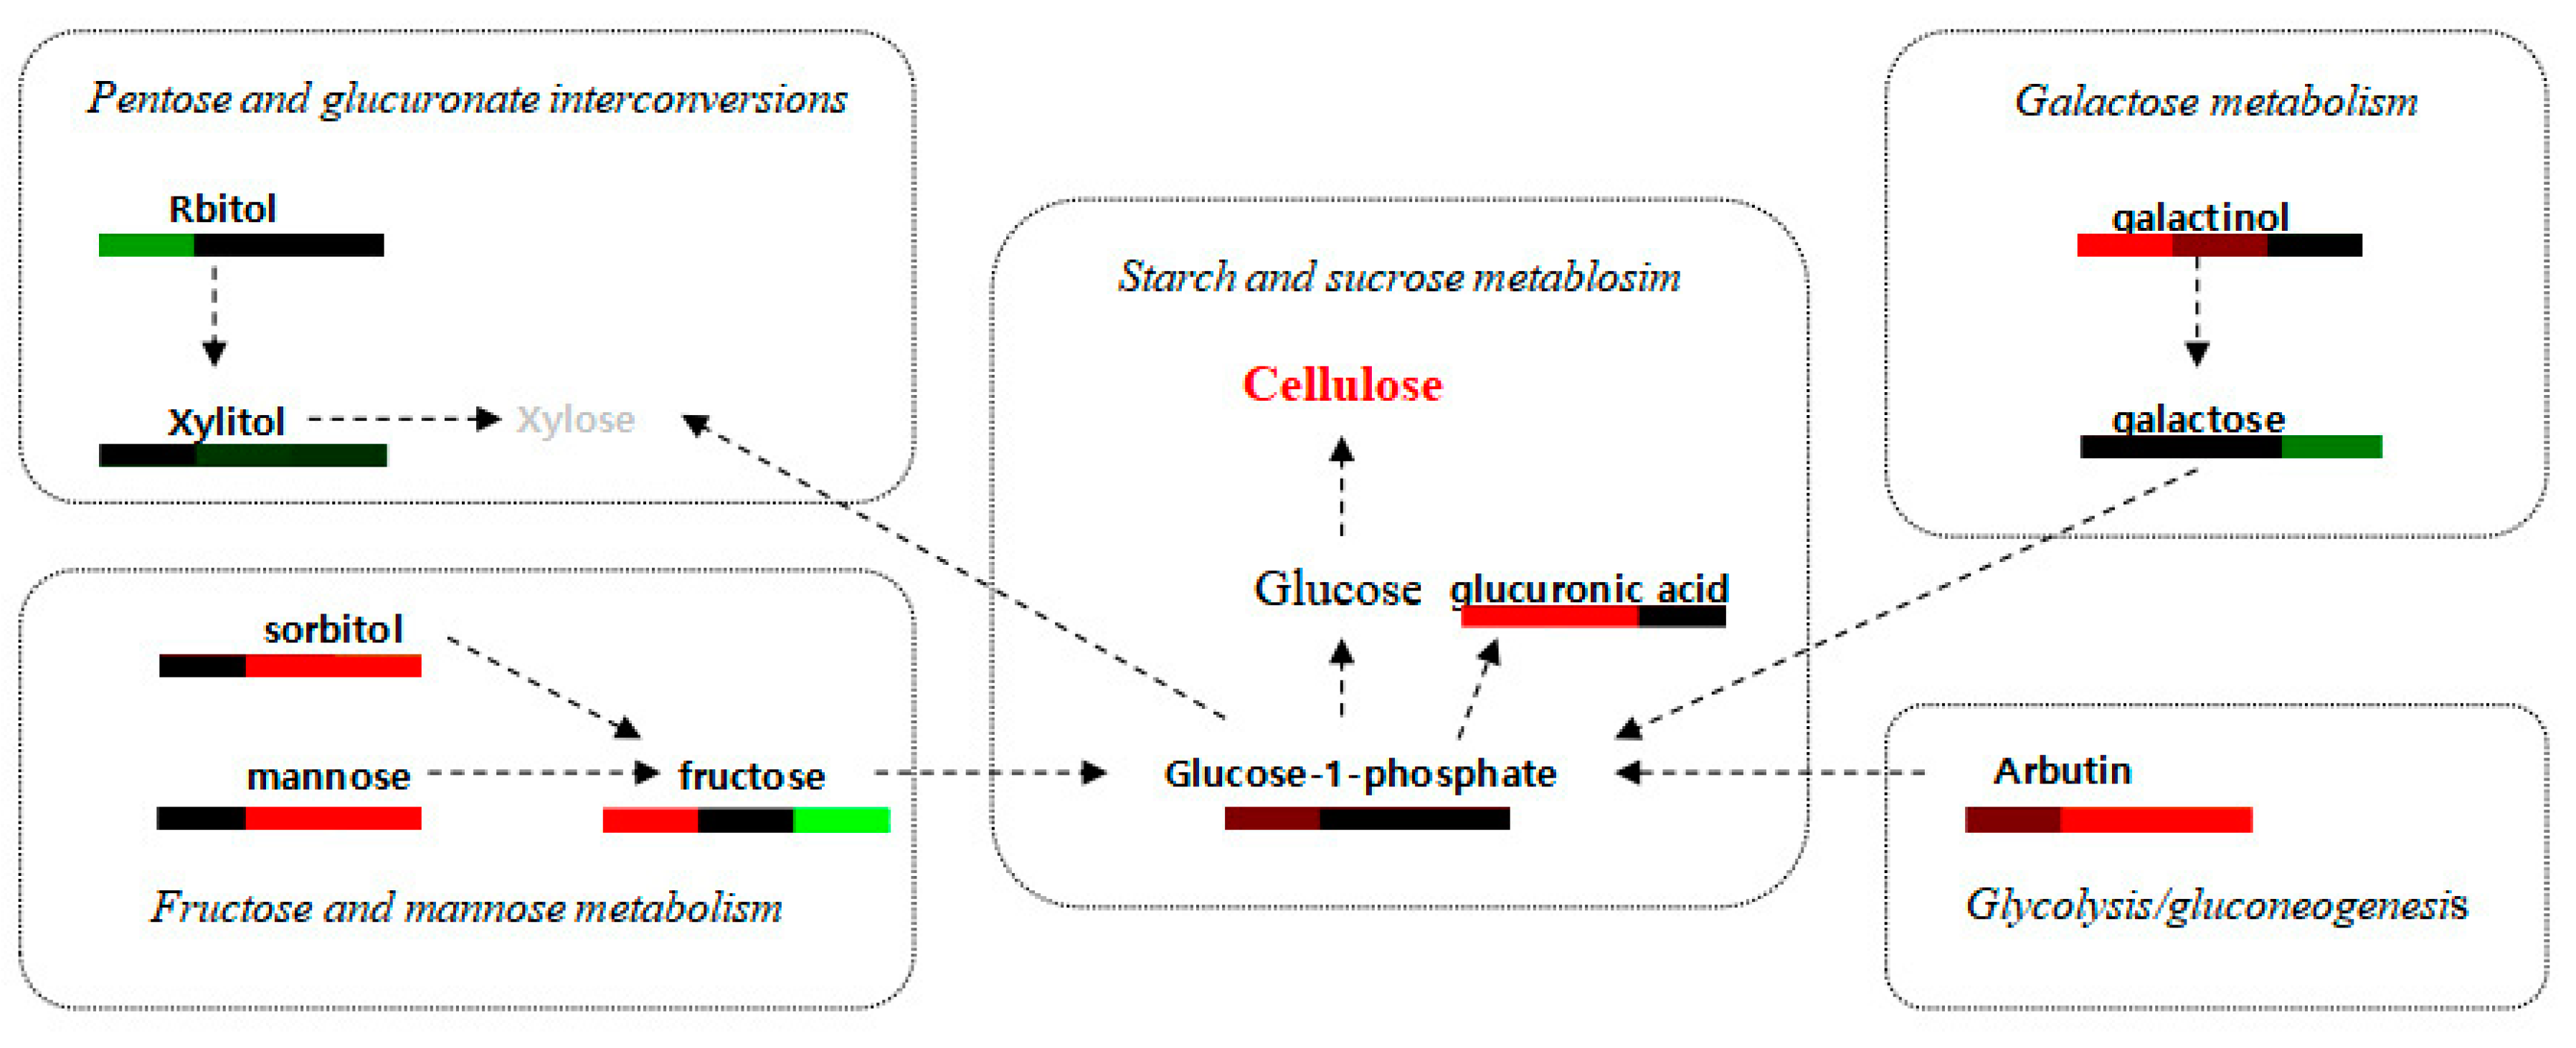
4.2. Metabolites Related to Cellulose and Lignin Biosynthesis Are Altered during Wood Formation

Wood is comprised of the secondary cell wall, a natural polymer material composed of cellulose, hemicellulose, lignin and small amounts of other substances [1]. Cellulose, which accounts for 40%–50% of wood dry matter, is the main component of cell walls and forms a strong carbon sink in plants [31]. Lignin is the second-most-abundant wood component after cellulose, accounting for 15%–35% of wood dry-matter. Cellulose, hemicellulose and lignin biosynthesis in wood cell walls undergoes changes in carbon allocation, primary metabolism and secondary metabolism of sugars [32]. However, the specific mechanism of this carbon flow change during cell wall development is to be further studied.
Under the influence of artificial bending, certain carbohydrates may play an important role in the formation of TW and OW, including glucose, glucose-1-phosphate, fructose, galactose and mannose. UDP-glucose is considered a direct substrate for cellulose biosynthesis, and it can be formed through two pathways. The first pathway is from glucose to glucose-6-phosphate and glucose-1-phosphate, which is converted by pyrophosphatase to UDP-glucose. In our metabolome analysis, glucose was the most abundant metabolite in all of the TW, OW and NW (Table 1), which illustrates its importance in cell wall formation (Table 1). However, there were no significant changes between the three tissues (Figure 3), which may be because it is the initial substrate in many metabolic pathways and the change of this pathway to cellulose synthesis is due to the change of gene or protein expression, rather than the change of substrate glucose, as reports have shown that the expression of pyrophosphatase gene was upregulated in Betula luminifera TW formation [33]. The second pathway involves the conversion of sucrose into UDP-glucose and fructose by sucrose synthase [34]. Studies have reported increased radial growth and wood density in response to bending stress in trees, and accumulation of fructose and sucrose in tissues may be related to the increased diameter of trees exposed to wind compared with control trees. The higher abundance of fructose and sucrose leads to an increase in cellulose production [35] and the cellulose content of TW was found to be higher than that of NW, which contained a large amount of highly crystalline cellulose [11]. Uniformly, in this study, glucose-1-phosphate in the starch sucrose-metabolism pathway, and fructose and mannose in fructose and mannose metabolism were elevated in TW compared with OW and NW (Figure 4), and glucose-1-phosphate and fructose were detected at high levels in all tissues (Table 1). This suggests that accumulation of these substrates promotes the synthesis of cellulose. However, levels of xylitol and ribosol in the pentose to glucuronate conversion pathways were lower in TW than in NW and OW, and the amount in OW was less than in NW (Figure 4), indicating that substrates for xylose synthesis were decreased in TW. It is hypothesised that more glucose-1-phosphate is used in cellulose synthesis. These results reflect the complex metabolic processes of cell wall polysaccharide biosynthesis during TW formation (Table S3 and Figure 4).
The biosynthesis of lignin in wood involves changes in metabolic pathways such as glycolysis, shikimic acid and phenylpropane [36]. Meanwhile, based on the previous research, we constructed a metabolic diagram about changes in metabolites related to the vital metabolic pathway in three tissues shown in Figure 5 [37,38]. When the glucose content in TW, OW and NW had little change (Figure 3, Figure 4 and Figure 5), and the content of ribulose-5-phosphate 2, an important metabolite in the Calvin cycle, did not change in the three sample (Supplementary Materials, Table S1), it is speculated that the carbon flow to lignin or cellulose during TW development is redistributed after glucose synthesis. The shikimate pathway functions in lignin biosynthesis by channelling the flow of carbon from sugar metabolism to the biosynthesis of phenylalanine. Phenylalanine, the precursor of monolignol, is converted into monolignol via the phenylpropanoid- and monolignol-biosynthesis pathways [39,40,41]. In the present study, the shikimic acid content was decreased in TW compared with OW. This suggests that carbon flow into lignin synthesis was limited (Figure 3 and Figure 5). Lignin is usually polymerised from three main types of wood alcohol, sinapyl alcohol (S), coniferyl alcohol (G) and p-coumaryl alcohol (H), in the secondary cell wall, catalysed by peroxidase (POD) and laccase (LAC) [42,43,44]. Coniferyl alcohol composed of G-lignin is the main monolignin in angiosperms, and we revealed that its content was decreased in TW compared with OW and NW (Figure 3 and Figure 5), indicating that lignin synthesis is inhibited in TW. This is consistent with results showing that the shikimic-acid content was reduced, lignin formation was inhibited, carbohydrates were increased, and more C was allocated to cellulose in TW of Populus [11]. Furthermore, the observed differences in metabolites are consistent with our previous findings that the expression levels of genes related to cellulose biosynthesis were upregulated in TW compared with OW and NW, but transcripts of genes involved in lignin biosynthesis were downregulated in TW [23]. These results further illuminate the regulation of metabolic pathways of cellulose synthesis and inhibition of lignin synthesis in TW compared with NW and OW.

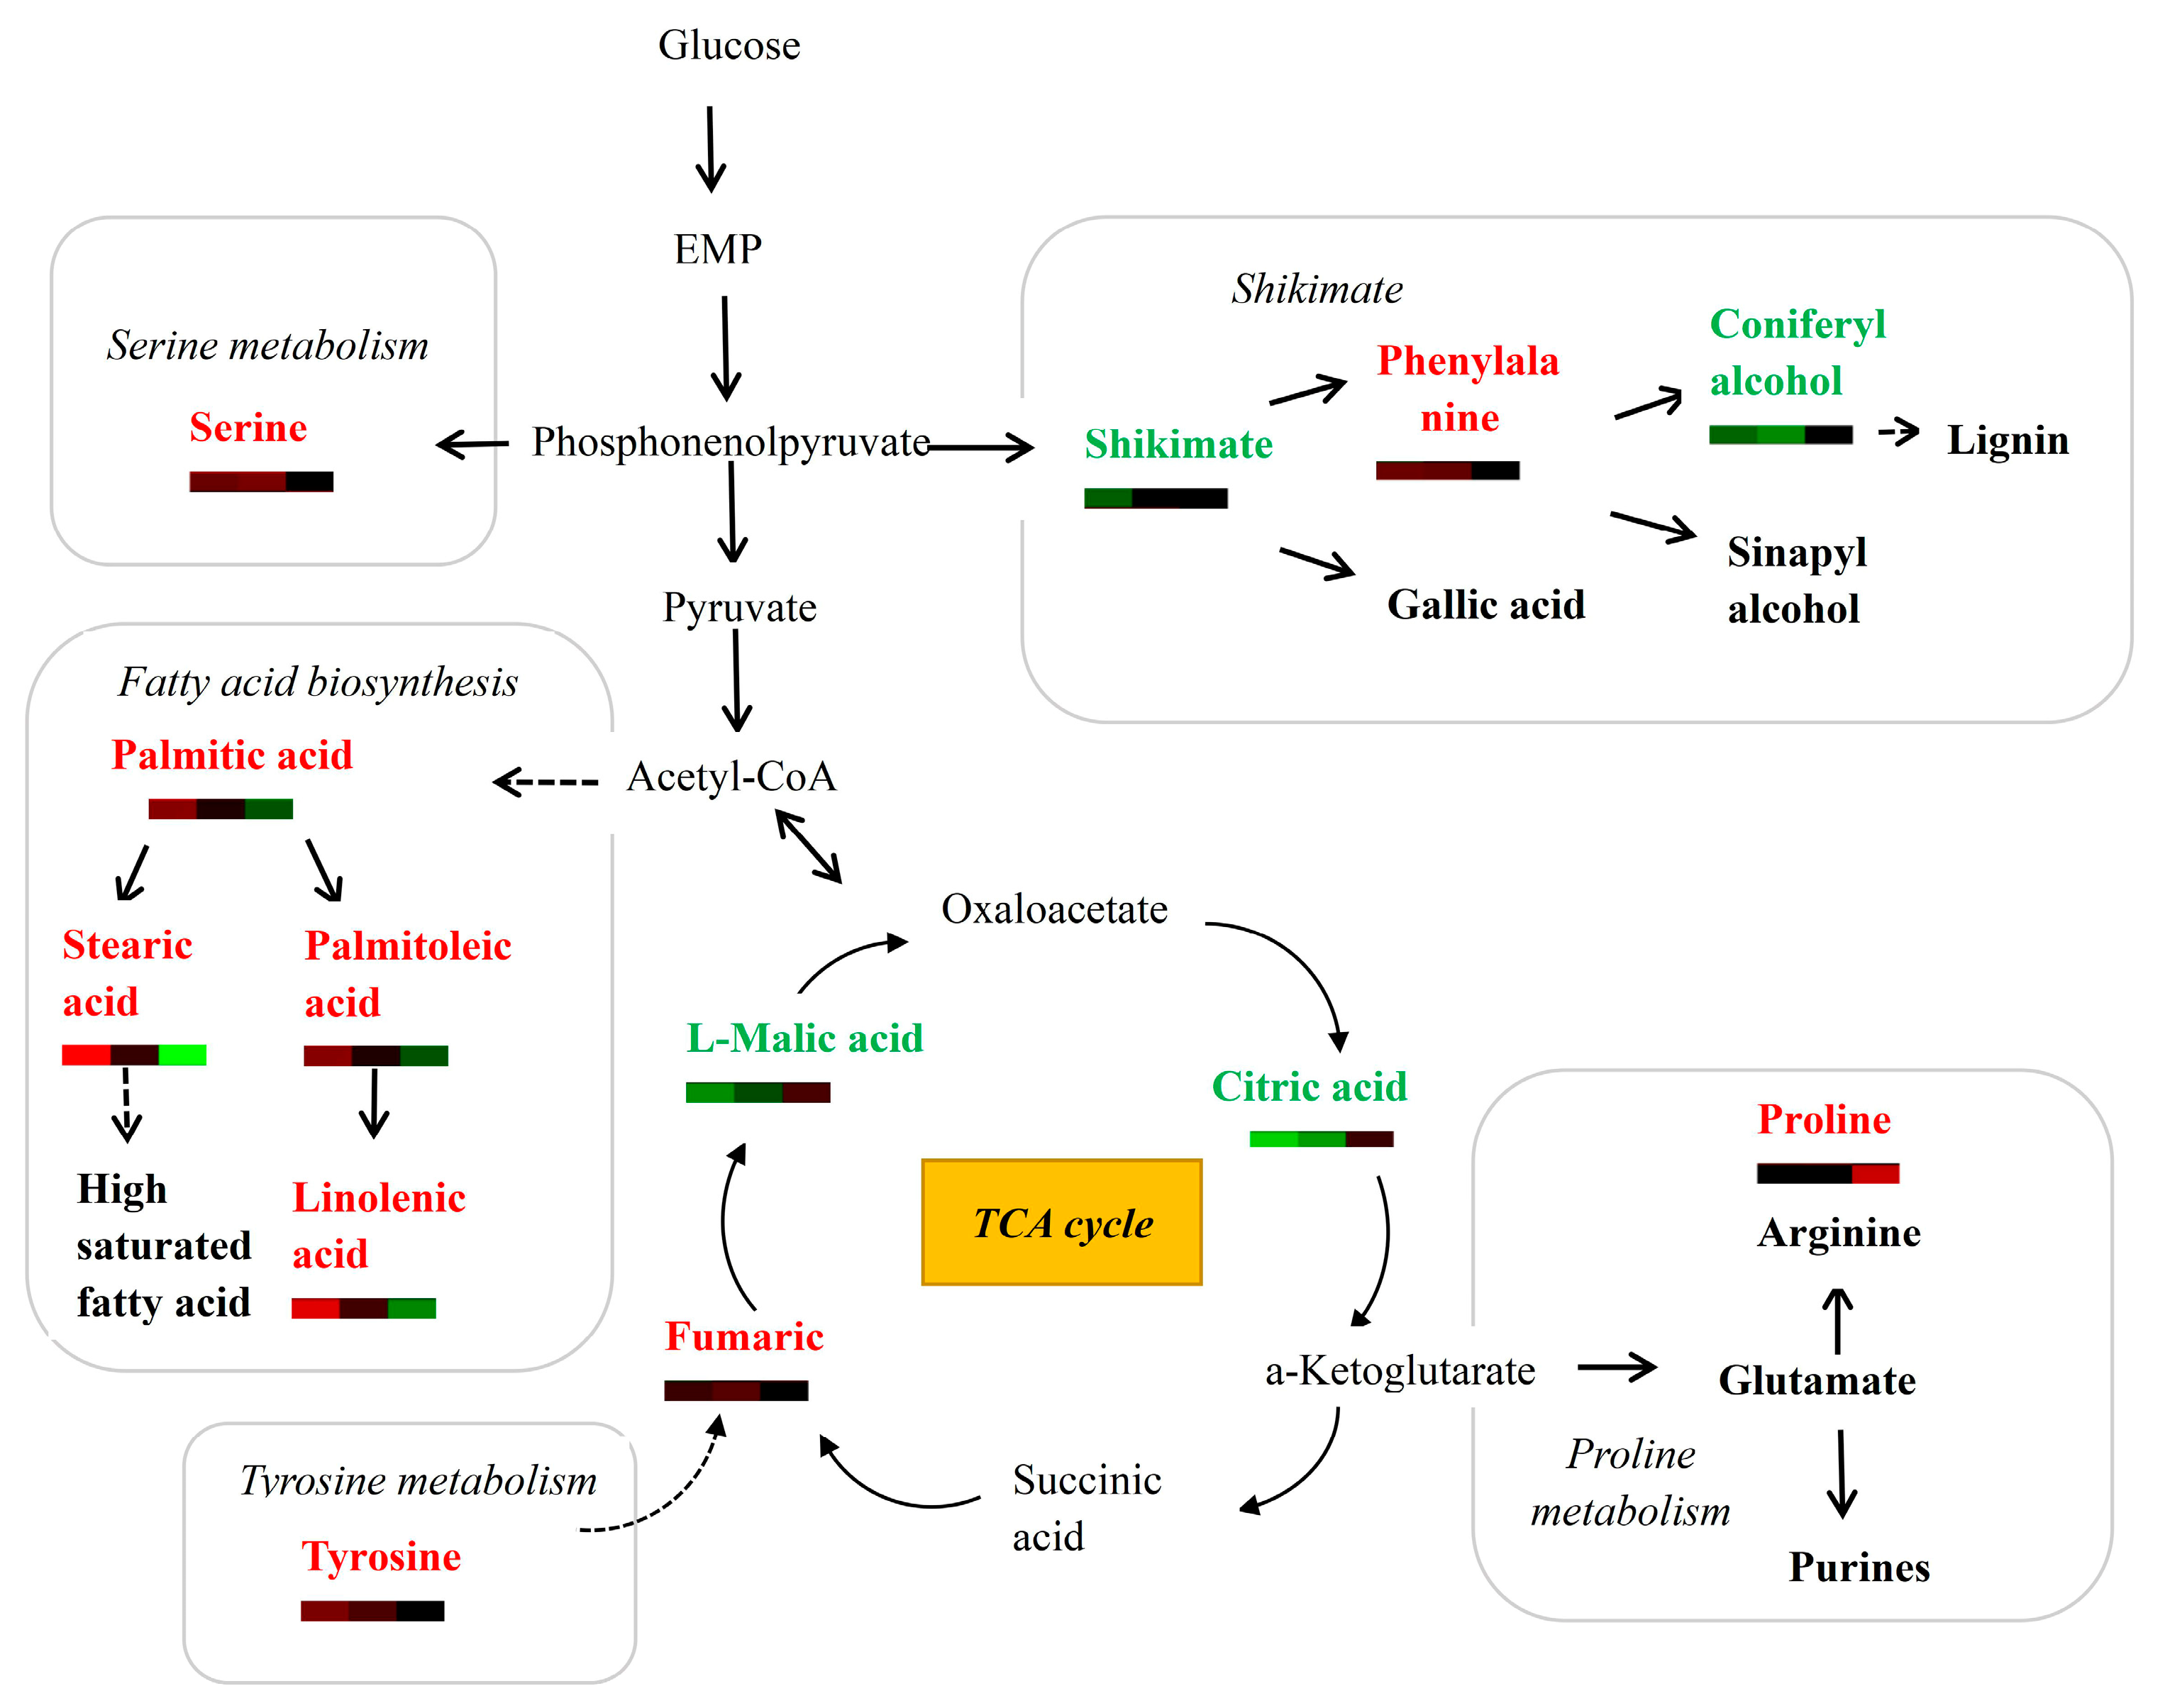
4.3. Metabolites of the TCA Cycle, Fatty-Acid Metabolism and Amino-Acid Metabolism Are Altered during Wood Formation

The TCA cycle is a series of chemical reactions used by aerobic organisms to generate energy from carbohydrates, fatty acids and proteins through the oxidation of acetyl-CoA, and this key pathway connects carbohydrates, fatty acids and proteins [45]. As precursors of various natural plant products, amino acids play an important role in plant growth and development. TCA-cycle intermediates provide the carbon skeleton to support the biosynthesis of most amino acids [46,47]. Likewise, as major components of plasma membrane lipids, fatty acids are thought to be important for wood formation [48]. The suberin fatty acid extracted from the outer bark of birch is a renewable resource that can be used to make fiber materials with excellent waterproof properties [49]. The effects of these metabolic pathways on wood formation have attracted more attention.
In the present study, we investigated the changes in metabolites involved in the TCA cycle, fatty-acid metabolism and amino-acid metabolism during TW development. We found that the l-malic acid, citric acid and maleic acid involved in the TCA cycle were decreased in TW compared with OW and NW (Table S3 and Figure 3). The citric-acid level could distinguish metabolic differences between samples (Table 3). Studies have shown that malate dehydrogenase and citrate synthase are functionally related and operate in certain pathways [50,51]. These results indicate that l-malic acid, citric acid and maleic acid were consumed in large quantities in the TCA cycle. Nevertheless, fumaric acid content was greatly increased in TW compared with OW and NW (Table S3 and Figure 3). In the TCA cycle, induction of the aspartate–argininosuccinate shunt results in the accumulation of fumarate [52]. Our current results also indicated that increasing arginine and tyrosine levels led to the accumulation of fumarate during the formation of TW (Figure 5). In one study, the contents of proline, arginine and leucine of alfalfa leaves were increased significantly under drought conditions, and amino-acid biosynthesis was upregulated [53]. In transcriptomic and metabolomic analyses, many enrichment pathways were found in tobacco under short-term low-temperature stress, and the specific enrichment pathways were shown to be mainly involved in amino-acid metabolism [54]. This suggests that plants can resist external stimuli by improving amino-acid metabolism. Meanwhile, birch juice contains many types of amino acids that are necessary daily for humans [55]. The elevated content of arginine, isoleucine, valine and tyrosine related to the amino-acid metabolism indicates a greater formation of TW.
Biofilm biosynthesis and lipid composition (the ratio of saturated to unsaturated acids) play key roles in plant function. During their growth, plants adapt to adverse conditions by reorganising lipid membranes, through changes in fatty-acid content, altering lipid formation [56]. One study showed that geographical and other factors such as ecology, location, growing conditions, species, altitude, climate, season, soil type, maturity and harvest time can have significant effects on fatty-acid composition [57]. In the present study, in response to artificial bending, some metabolites related to fatty-acid metabolism, such as 1-monopalmitin, linoleic acid methyl ester, glycerol, linoleic acid, palmitic acid, linolenic acid and stearic acid were significantly enriched in TW (Figure 3). These metabolites were also detected in higher levels in developing xylem (Table 1), and they could be used to distinguish metabolic differences between samples (Table 3). When glucose metabolism is enhanced, acetyl-CoA and nicotinamide adenine dinucleotide phosphate (NADPH) provided by sugar oxidation and the pentose-phosphate cycle are increased, and the increase in these raw materials is conducive for fatty-acid synthesis (Figure 5). We speculate that the significant increase in organic acids is a physiological response to stress stimulation, and that metabolic activity becomes more vigorous. Fatty acids such as palmitic acid, linoleic acid, stearic acid and linolenic acid are important nutrients in birch juice [58], and their accumulation in TW indicated that birch juice of TW had more abundant nutrients. In conclusion, our results suggest that biosynthetic pathways of amino acids and fatty acids were upregulated in TW, but citric-acid biosynthesis was inhibited, and these three major metabolic pathways are coordinated and closely related during the formation of TW.

5. Conclusions

Herein, metabolomics analysis was employed to explore the molecular mechanism of TW formation, and 142 metabolites were altered following bending stress in birch stems, of which 99 differed in TW compared with NW, and 90 differed between OW and NW. These results indicate that changes in these metabolites are related to artificial bending stimulation. The metabolic pathways of fatty acids, amino acids, the TCA cycle, glycolysis, pentose and glucuronic-acid-ester conversion were explored, and metabolites involved in these metabolic pathways were altered during TW formation. In addition, we found that the lignin-biosynthesis pathway was inhibited during the formation of TW, while cellulose biosynthesis was promoted. The biosynthetic pathways of amino acids and fatty acids were promoted in TW, but that of citric acid was inhibited. Our results provide a theoretical basis for studying the mechanism of formation of TW and the regulatory network of lignin and cellulose biosynthesis. The findings have important significance for the genetic improvement of wood quality traits and increasing tree biomass.

Supplementary Materials

The following supporting information can be downloaded at: https://www.mdpi.com/article/10.3390/f14030457/s1, Table S1: A total of 183 metabolites were identified and their concentrations were determined; Table S2: A total of 142 metabolites varied among the three groups. Table S3: Changes in the relative content of metabolites related to metabolic pathways in TW, OW, and NW.

Author Contributions

Conceptualization, C.W. and Y.W.: methodology, Y.C.; software, N.Z.; formal analysis, Y.C.; investigation, A.Z. and Y.Y.; writing—original draft preparation, Y.C. and N.Z.; writing—review and editing, Y.C.; visualization, C.W.; funding acquisition, C.W. All authors have read and agreed to the published version of the manuscript.

Funding

This research was funded by the Innovation Project of State Key Laboratory of Tree Genetics and Breeding (Northeast Forestry University) 2021A03, the National High Technology Research and Development Program (‘863’ Program) of China (2011AA100202),the Fundamental Research Funds for the Central Universities (2572016DA01), the Heilongjiang Touyan Innovation Team Program (Tree Genetics and Breeding Innovation Team), and the Overseas Expertise Introduction Project for Discipline Innovation (B16010).

Institutional Review Board Statement

Not applicable.

Informed Consent Statement

Not applicable.

Data Availability Statement

Not applicable.

Conflicts of Interest

The authors declare no conflict of interest. We declare that we have no known competing financial interests or personal relationships that could have appeared to influence the work reported in this paper.

References

  1. Pauly, M.; Keegstra, K. Plant cell wall polymers as precursors for biofuels. Curr. Opin. Plant Biol. 2010, 13, 305–312. [Google Scholar] [CrossRef]
  2. Lachaud, S.; Catesson, A.M.; Bonnemain, J.L. Structure and functions of the vascular cambium. C. R. Acad. Sci. III 1999, 322, 633–650. [Google Scholar] [CrossRef] [PubMed]
  3. Roignant, J.; Badel, É.; Leblanc-Fournier, N.; Brunel-Michac, N.; Ruelle, J.; Moulia, B.; Decourteix, M. Feeling stretched or compressed? The multiple mechanosensitive responses of wood formation to bending. Ann. Bot. 2018, 121, 1151–1161. [Google Scholar] [CrossRef] [PubMed]
  4. Scurfield, G. Reaction Wood: Its Structure and Function Lignification may generate the force active in restoring the trunks of leaning trees to the vertica. Science 1973, 179, 647–655. [Google Scholar] [CrossRef] [PubMed]
  5. Jourez, A.; Riboux, A.; Leclercq, B. Anatomical characteristics of tension wood and opposite wood in young inclined stems of poplar (Populus euramericana cv ‘Ghoy’). Iawa J. 2001, 22, 133–157. [Google Scholar] [CrossRef]
  6. Nishikubo, N.; Awano, T.; Banasiak, A.; Bourquin, V.; Ibatullin, F.; Funada, R.; Brumer, H.; Teeri, T.T.; Hayashi, T.; Sundberg, B.; et al. Xyloglucan endo-transglycosylase (XET) functions in gelatinous layers of tension wood fibers in poplar--a glimpse into the mechanism of the balancing act of trees. Plant Cell Physiol. 2007, 48, 843–855. [Google Scholar] [CrossRef] [Green Version]
  7. Joseleau, J.P.; Imai, T.; Kuroda, K.; Ruel, K. Detection in situ and characterization of lignin in the G -layer of tension wood fibres of Populus deltoides. Planta 2004, 219, 338–345. [Google Scholar] [CrossRef]
  8. Gierlinger, N.; Schwanninger, M. Chemical imaging of poplar wood cell walls by confocal Raman microscopy. Plant Physiol. 2006, 140, 1246–1254. [Google Scholar] [CrossRef] [Green Version]
  9. Gritsch, C.; Wan, Y.; Mitchell, R.A.; Shewry, P.R.; Hanley, S.J.; Karp, A. G-fibre cell wall development in willow stems during tension wood induction. J. Exp. Bot. 2015, 66, 6447–6459. [Google Scholar] [CrossRef] [Green Version]
  10. McNeil, M.; Darvill, A.G.; Fry, S.C.; Albersheim, P. Structure and function of the primary cell walls of plants. Annu. Rev. Biochem. 1984, 53, 625–663. [Google Scholar] [CrossRef]
  11. Andersson-Gunnerås, S.; Mellerowicz, E.J.; Love, J.; Segerman, B.; Ohmiya, Y.; Coutinho, P.M.; Nilsson, P.; Henrissat, B.; Moritz, T.; Sundberg, B. Biosynthesis of cellulose-enriched tension wood in Populus: Global analysis of transcripts and metabolites identifies biochemical and developmental regulators in secondary wall biosynthesis. Plant J. 2006, 45, 144–165. [Google Scholar] [CrossRef] [PubMed]
  12. Lu, X.; Zhao, X.; Bai, C.; Zhao, C.; Lu, G.; Xu, G. LC-MS-based metabonomics analysis. J. Chromatogr. B Analyt. Technol. Biomed Life Sci. 2008, 866, 64–76. [Google Scholar] [CrossRef] [PubMed]
  13. Wu, K.; Liu, Y.; Liu, J.; Ren, Y.; Liu, Y.; Sun, F.; Abozeid, A.; Tang, Z.; Mu, L. Comparison of Seasonally Adaptive Metabolic Response Strategies of TwoAcerSpecies. Forests 2022, 13, 2141. [Google Scholar] [CrossRef]
  14. Griffin, J.L.; Walker, L.A.; Garrod, S.; Holmes, E.; Shore, R.F.; Nicholson, J.K. NMR spectroscopy based metabonomic studies on the comparative biochemistry of the kidney and urine of the bank vole (Clethrionomys glareolus), wood mouse (Apodemus sylvaticus), white toothed shrew (Crocidura suaveolens) and the laboratory rat. Comp. Biochem. Physiol. B Biochem. Mol. Biol. 2000, 127, 357–367. [Google Scholar] [CrossRef]
  15. Fiehn, O. Extending the breadth of metabolite profiling by gas chromatography coupled to mass spectrometry. Trends Analyt. Chem. 2008, 27, 261–269. [Google Scholar] [CrossRef] [PubMed] [Green Version]
  16. Liu, Y.; Chang, Q.-Y.; Tang, Z.-H.; Wu, K.-X.; Abozeid, A.; Mu, L.-Q. The Interrelationship between Latitudinal Differences and Metabolic Differences in the Natural Distribution Area ofTilia amurensis Rupr. Forests 2022, 13, 1507. [Google Scholar] [CrossRef]
  17. Shulaev, V.; Cortes, D.; Miller, G.; Mittler, R. Metabolomics for plant stress response. Physiol. Plant. 2008, 132, 199–208. [Google Scholar] [CrossRef]
  18. Hong, J.; Yang, L.; Zhang, D.; Shi, J. Plant Metabolomics: An Indispensable System Biology Tool for Plant Science. Int. J. Mol. Sci. 2016, 17, 767. [Google Scholar] [CrossRef]
  19. Widodo; Patterson, J.H.; Newbigin, E.; Tester, M.; Bacic, A.; Roessner, U. Metabolic responses to salt stress of barley (Hordeum vulgare L.) cultivars, Sahara and Clipper, which differ in salinity tolerance. J. Exp. Bot. 2009, 60, 4089–4103. [Google Scholar] [CrossRef] [Green Version]
  20. Wu, T.; Zou, R.; Pu, D.; Lan, Z.; Zhao, B. Non-targeted and targeted metabolomics profiling of tea plants (Camellia sinensis) in response to its intercropping with Chinese chestnut. BMC Plant Biol. 2021, 21, 55. [Google Scholar] [CrossRef]
  21. Rastogi, S.; Pandey, M.M.; Kumar Singh Rawat, A. Medicinal plants of the genus Betula--traditional uses and a phytochemical-pharmacological review. J. Ethnopharmacol. 2015, 159, 62–83. [Google Scholar] [CrossRef]
  22. Ekman, R. The Suberin Monomers and Triterpenoids from the Outer Bark of Betula verrucosa Ehrh. Holzforsch.—Int. J. Biol. Chem. Phys. Technol. Wood 1983, 37, 205–211. [Google Scholar] [CrossRef]
  23. Wang, C.; Zhang, N.; Gao, C.; Cui, Z.; Sun, D.; Yang, C.; Wang, Y. Comprehensive transcriptome analysis of developing xylem responding to artificial bending and gravitational stimuli in Betula platyphylla. PLoS ONE 2014, 9, e87566. [Google Scholar] [CrossRef]
  24. Lisec, J.; Schauer, N.; Kopka, J.; Willmitzer, L.; Fernie, A.R. Gas chromatography mass spectrometry-based metabolite profiling in plants. Nat. Protoc. 2006, 1, 387–396. [Google Scholar] [CrossRef] [PubMed]
  25. Lim, G.H.; Singhal, R.; Kachroo, A.; Kachroo, P. Fatty Acid- and Lipid-Mediated Signaling in Plant Defense. Annu. Rev. Phytopathol. 2017, 55, 505–536. [Google Scholar] [CrossRef] [PubMed]
  26. Mellerowicz, E.J.; Sundberg, B. Wood cell walls: Biosynthesis, developmental dynamics and their implications for wood properties. Curr. Opin. Plant Biol. 2008, 11, 293–300. [Google Scholar] [CrossRef]
  27. Rogers, L.A.; Dubos, C.; Cullis, I.F.; Surman, C.; Poole, M.; Willment, J.; Mansfield, S.D.; Campbell, M.M. Light, the circadian clock, and sugar perception in the control of lignin biosynthesis. J. Exp. Bot. 2005, 56, 1651–1663. [Google Scholar] [CrossRef] [PubMed]
  28. Schauer, N.; Semel, Y.; Roessner, U.; Gur, A.; Balbo, I.; Carrari, F.; Pleban, T.; Perez-Melis, A.; Bruedigam, C.; Kopka, J.; et al. Comprehensive metabolic profiling and phenotyping of interspecific introgression lines for tomato improvement. Nat. Biotechnol. 2006, 24, 447–454. [Google Scholar] [CrossRef]
  29. Endler, A.; Persson, S. Cellulose Synthases and Synthesis in Arabidopsis. Mol. Plant 2011, 4, 199–211. [Google Scholar] [CrossRef] [Green Version]
  30. Chang, S.S.; Clair, B.; Ruelle, J.; Beauchêne, J.; Di Renzo, F.; Quignard, F.; Zhao, G.J.; Yamamoto, H.; Gril, J. Mesoporosity as a new parameter for understanding tension stress generation in trees. J. Exp. Bot. 2009, 60, 3023–3030. [Google Scholar] [CrossRef] [Green Version]
  31. Delmer, D.P.; Haigler, C.H. The regulation of metabolic flux to cellulose, a major sink for carbon in plants. Metab. Eng. 2002, 4, 22–28. [Google Scholar] [CrossRef] [PubMed]
  32. Joshi, C.P.; Mansfield, S.D. The cellulose paradox-simple molecule, complex biosynthesis. Curr. Opin. Plant Biol. 2007, 10, 220–226. [Google Scholar] [CrossRef] [PubMed]
  33. Cai, M.; Huang, H.; Ni, F.; Tong, Z.; Lin, E.; Zhu, M. RNA-Seq analysis of differential gene expression in Betula luminifera xylem during the early stages of tension wood formation. PeerJ 2018, 6, e5427. [Google Scholar] [CrossRef] [Green Version]
  34. Babb, V.; Haigler, C.H. Sucrose phosphate synthase activity rises in correlation with high-rate cellulose synthesis in three heterotrophic systems. Plant Physiol. 2001, 127, 1234–1242. [Google Scholar] [CrossRef]
  35. Holbrook, N.M.; PUTZ, F.E. Influence of neighbors on tree form—Effects of lateral shade and prevention of sway on the allometry of liquidambar-styraciflua (sweet gum). Amer. J. Bot. 1989, 76, 1740–1749. [Google Scholar] [CrossRef]
  36. Douglas, C.J. Phenylpropanoid metabolism and lignin biosynthesis: From weeds to trees. Trends Plant Sci. 1996, 1, 171–178. [Google Scholar] [CrossRef]
  37. Li, S.; Su, X.; Abdullah, M.; Sun, Y.; Li, G.; Cheng, X.; Lin, Y.; Cai, Y.; Jin, Q. Effects of Different Pollens on Primary Metabolism and Lignin Biosynthesis in Pear. Int. J. Mol. Sci. 2018, 19, 2273. [Google Scholar] [CrossRef] [Green Version]
  38. Deng, M.; Li, D.; Luo, J.; Xiao, Y.; Liu, H.; Pan, Q.; Zhang, X.; Jin, M.; Zhao, M.; Yan, J. The genetic architecture of amino acids dissection by association and linkage analysis in maize. Plant Biotechnol. J. 2017, 15, 1250–1263. [Google Scholar] [CrossRef] [Green Version]
  39. Alejandro, S.; Lee, Y.; Tohge, T.; Sudre, D.; Osorio, S.; Park, J.; Bovet, L.; Lee, Y.; Geldner, N.; Fernie, A.R.; et al. AtABCG29 is a monolignol transporter involved in lignin biosynthesis. Curr. Biol. 2012, 22, 1207–1212. [Google Scholar] [CrossRef] [PubMed] [Green Version]
  40. Miao, Y.C.; Liu, C.J. ATP-binding cassette-like transporters are involved in the transport of lignin precursors across plasma and vacuolar membranes. Proc. Natl. Acad. Sci. USA 2010, 107, 22728–22733. [Google Scholar] [CrossRef] [Green Version]
  41. Bonawitz, N.D.; Chapple, C. The genetics of lignin biosynthesis: Connecting genotype to phenotype. Annu. Rev. Genet. 2010, 44, 337–363. [Google Scholar] [CrossRef]
  42. Eloy, N.B.; Voorend, W.; Lan, W.; Saleme, M.L.; Cesarino, I.; Vanholme, R.; Smith, R.A.; Goeminne, G.; Pallidis, A.; Morreel, K.; et al. Silencing CHALCONE SYNTHASE in Maize Impedes the Incorporation of Tricin into Lignin and Increases Lignin Content. Plant Physiol. 2017, 173, 998–1016. [Google Scholar] [CrossRef] [Green Version]
  43. Vogt, T. Phenylpropanoid Biosynthesis. Mol. Plant 2010, 3, 2–20. [Google Scholar] [CrossRef] [PubMed] [Green Version]
  44. Tzin, V.; Galili, G. New Insights into the Shikimate and Aromatic Amino Acids Biosynthesis Pathways in Plants. Molecular Plant 2010, 3, 956–972. [Google Scholar] [CrossRef]
  45. Owen, O.E.; Kalhan, S.C.; Hanson, R.W. The Key Role of Anaplerosis and Cataplerosis for Citric Acid Cycle Function. J. Biol. Chem. 2002, 277, 30409–30412. [Google Scholar] [CrossRef] [Green Version]
  46. Mcgarry, J.D. The regulation of ketogenesis from octanoic acid. The role of the tricarboxylic acid cycle and fatty acid synthesis. J. Biol. Chem. 1971, 246, 1149–1159. [Google Scholar] [CrossRef] [PubMed]
  47. Galili, G.; Amir, R.; Fernie, A.R. The Regulation of Essential Amino Acid Synthesis and Accumulation in Plants. Annu. Rev. Plant Biol. 2016, 67, 153–178. [Google Scholar] [CrossRef]
  48. Ghanati, F.; Morita, A.; Yokota, H. Deposition of suberin in roots of soybean induced by excess boron. Plant Sci. 2005, 168, 397–405. [Google Scholar] [CrossRef]
  49. Korpinen, R.I.; Kilpeläinen, P.; Sarjala, T.; Nurmi, M.; Saloranta, P.; Holmbom, T.; Koivula, H.; Mikkonen, K.S.; Willför, S.; Saranpää, P.T. The Hydrophobicity of Lignocellulosic Fiber Network Can Be Enhanced with Suberin Fatty Acids. Molecules 2019, 24, 4391. [Google Scholar] [CrossRef] [Green Version]
  50. Vélot, C.; Mixon, M.B.; Teige, M.; Srere, P.A. Model of a quinary structure between Krebs TCA cycle enzymes: A model for the metabolon. Biochemistry 1997, 36, 14271–14276. [Google Scholar] [CrossRef] [PubMed]
  51. Wu, F.; Minteer, S. Krebs Cycle Metabolon: Structural Evidence of Substrate Channeling Revealed by Cross-Linking and Mass Spectrometry. Angew. Chem. Int. Ed. Engl. 2015, 54, 1851–1854. [Google Scholar] [CrossRef]
  52. Patil, N.K.; Bohannon, J.K.; Hernandez, A.; Patil, T.K.; Sherwood, E.R. Regulation of leukocyte function by citric acid cycle intermediates. J. Leukoc. Biol. 2019, 106, 105–117. [Google Scholar] [CrossRef] [PubMed]
  53. Ma, Q.; Xu, X.; Xie, Y.; Huang, T.; Wang, W.; Zhao, L.; Ma, D. Comparative metabolomic analysis of the metabolismpathways under drought stress in alfalfa leaves—ScienceDirect. Environ. Exp. Bot. 2020, 183, 104329. [Google Scholar] [CrossRef]
  54. Hu, Z.; Yan, W.; Yang, C.; Huang, X.; Hu, X.; Li, Y.; Yang, J.; Xiang, S.; Yi, P.; Hu, R. Integrative analysis of transcriptome and metabolome provides insights into the underlying mechanism of cold stress response and recovery in two tobacco cultivars. Environ. Exp. Bot. 2022, 200, 104920. [Google Scholar] [CrossRef]
  55. Kallio, H. Aroma of birch syrup. Agric. Food Chem. 1989, 37, 1367–1371. [Google Scholar] [CrossRef]
  56. Reszczyńska, E.; Hanaka, A. Lipids Composition in Plant Membranes. Cell Biochem. Biophys. 2020, 78, 401–414. [Google Scholar] [CrossRef] [PubMed]
  57. Tüfekci, F.; Karataş, Ş. Determination of geographical origin Turkish hazelnuts according to fatty acid composition. Food Sci. Nutr. 2018, 6, 557–562. [Google Scholar] [CrossRef] [Green Version]
  58. Ahokas, H. Cytokinins in the spring sap of curly birch (Betula pendula F. Carelica) and the noncurly form. Plant Physiol. 1985, 118, 33–39. [Google Scholar] [CrossRef]
Figure 1. Growth performance of TW, OW and NW. (A) Experimental design to induce TW formation in birch stems. The red box represents the sampling location. (B) Cross-section of a birch stem stained with Safranine-O/Fast Green. Lignified cell walls are coloured red and cellulose-rich cell walls are coloured green. Black bars indicate the locations of tissues sampled for metabonomic analysis prepared from developing xylem. TW, tension wood; OW, opposite wood; NW, normal wood. Scale bar = 100 µm.
Forests 14 00457 g001
Figure 2. Principal component analysis (PCA) of metabolic profiles for TW, OW and NW (10 biological replicates). (A) OPLS-DA models showing metabolic differences between TW, OW and NW; (B) t(1), first principal component and t(2), second principal component. R2X, explaining ratio.
Forests 14 00457 g002
Figure 3. Heatmap showing the differential abundance of metabolites between TW, OW and NW for different metabolic pathways. Relative changes in metabolites are indicated by shades of red (upregulated) or green (downregulated). Brightness represents the degree of change in metabolites. T/O represents T vs. O, the latter is the control, and other comparisons have the same meaning.
Forests 14 00457 g003
Figure 4. Schematic presentation of the metabolite changes in pathways related to cellulose biosynthesis in TW, OW and NW. The three different-coloured squares represent metabolite changes in T vs. O, T vs. N and O vs. N, from left to right. the latter is the control. Red indicates upregulation of metabolites, green indicates downregulation of metabolites, and black indicates no change in metabolites. Dotted arrows represent relationships between substrates and metabolites.
Forests 14 00457 g004
Figure 5. Changes in metabolites associated with lignin synthesis, amino acid synthesis, citric-acid synthesis, fatty-acid synthesis, and their synthesis pathways in TW, OW and NW. Metabolites in red were detected at higher levels in TW than in OW and NW. Metabolites in green were detected at lower levels in TW than in OW and NW. Metabolites in black represent no significant change.
Forests 14 00457 g005
Table 1. Top 30 metabolites in the TW, OW and NW.
RTNameRelative
Contents (N)
RTNameRelative
Contents (O)
RTNameRelative
Contents (T)
20.1654Glucose 25020.92120.1654Glucose 29314.549620.1654Glucose 26869.254
19.9109Glucose 24315.89629.1436Isopropyl-beta-D-thiogalactopyranoside1330.084329.1436Isopropyl-beta-D-thiogalactopyranoside1570.597
23.0188Myo-inositol1051.43314.2641Threonic acid1173.131723.1448Linoleic acid methyl ester1371.975
23.1448Linoleic acid methyl ester830.874423.0188Myo-inositol1166.329523.0188Myo-inositol1027.831
10.494Phosphate637.156823.1448Linoleic acid methyl ester910.8725914.09994-aminobutyric acid 11012.181
29.1854Isopropyl-beta-D-thiogalactopyranoside603.350326.1339Lactobionic acid 1518.1383610.5093Ethanolamine601.9354
10.5093Ethanolamine580.849514.09994-aminobutyric acid 1482.8180426.1339Lactobionic Acid 1518.7005
17.4188Glucose-1-phosphate70.0666610.5093Ethanolamine455.4653814.0543Oxoproline455.243
14.2641Threonic acid408.357929.1854Isopropyl-beta-D-thiogalactopyranoside403.3533334.5937Galactinol 1417.118
14.0543Oxoproline399.045214.0543Oxoproline329.9063914.2641Threonic acid353.2065
14.09994-Aminobutyric acid 1361.93110.494Phosphate299.675548.58041Sarcosine310.7912
26.1339Lactobionic acid 1360.448710.427Glycerol287.1195418.237Shikimic acid110.15552
26.8392Thioctamide 1332.794226.8392Thioctamide 1174.7115218.3135Mucic acid236.3835
34.5937Galactinol 1234.708919.4666Fructose 1160.459710.427Glycerol215.723
19.4666Fructose 1174.085819.9109Glucose 2152.18810.494Phosphate203.4365
23.106Myo-inositol171.547318.3135Mucic acid146.2724922.3688Palmitic acid193.1643
10.427Glycerol167.29334.5937Galactinol 1129.9373220.2773Methyl palmitoleate187.0347
22.3688Palmitic acid147.445118.6615Citrulline 177.74546618.6615Citrulline 1163.7387
18.3135Mucic acid138.698520.2773Methyl palmitoleate121.827716.0655Fructose 1101.4002
17.6124Glucose-1-phosphate131.25078.58041Sarcosine112.6593129.1854Isopropyl-beta-D-thiogalactopyranoside90.85038
8.58041Sarcosine79.4347218.237Shikimic acid244.102124.6155Linoleic acid147.2064
20.2773Methyl palmitoleate113.691513.81Aspartic acid 1107.6623216.26622,2-Dimethylsuccinic acid111.4056
24.6155Linoleic acid90.5407116.0655Fructose 186.69898813.81Aspartic acid 1129.8358
14.63392-Deoxyerythritol72.0733716.26622,2-Dimethylsuccinic acid72.22063426.8392Thioctamide 1129.7325
20.7827Gluconic lactone 285.4675922.3688Palmitic acid74.3786829.8543Valine118.6639
30.4995Xylitol82.6911724.96733-Hydroxynorvaline 278.45536119.4666Fructose 1116.9403
Notes: Relative contents means the value of the peak area of the metabolite after data normalisation. RT, retention time; TW, tension wood; OW, opposite wood; N, normal wood.
Table 2. Distributions of metabolites with different contents between TW, OW and NW.
Number of Differentially Abundant Metabolites
TW vs. OWTW vs. NWOW vs. NW
Total859990
Upregulated626238
Downregulated233752
Notes: Upregulated means the metabolite content is higher in the sample in front of ‘vs.’ and downregulated means the metabolite content is lower in sample in front of ’vs.’.
Table 3. Top 10 metabolites distinguishing TW, OW and NW.
RTNamePubChemKEGGKEGG PathwayVIP
T/O18.4685Citric acid311C00158TCA cycle1.79807
13.393cis-1,2-Dihydronaphthalene-1,2-diol C04314Degradation of aromatic compounds1.78826
24.6155Linoleic acid3931C01595Linoleic-acid metabolism1.77608
24.6943Linolenic acid860C06427Alpha-linolenic-acid metabolism1.75496
25.8734N-Methyl-L-glutamic acid 3 C01046Methane metabolism1.75403
27.2841Analyte 368 1.74
23.74Pentadecanoic acid13,849 1.74
20.5483Methyl heptadecanoate 1.72874
22.3688Palmitic acid985C00249Fatty-acid biosynthesis1.72
27.0315Stearic acid5281C01530Fatty-acid biosynthesis1.72
T/N28.3075Arbutin C06186Glycolysis/gluconeogenesis1.65816
13.393cis-1,2-Dihydronaphthalene-1,2-diol C04314Degradation of aromatic compounds1.65002
19.9514Hexadecane10,459C08260 1.62956
11.4168Uracil1174C00106Pyrimidine metabolism1.61431
28.54721-Monopalmitin 1.5909
8.58041Sarcosine1088C00213Arginine and proline metabolism1.58845
9.8543Valine1182C00183Valine, leucine and isoleucine biosynthesis1.57943
20.7827Gluconic lactone 27027C00198Pentose-phosphate pathway1.5779
9.248694-aminobutyric acid 312,025C11118Arginine and proline metabolism1.56024
19.629Gluconic lactone 17027C00198Pentose-phosphate pathway1.54458
O/N24.6155Linoleic acid3931C01595Linoleic-acid metabolism1.70565
20.03372-Keto-L-gulonic acid440,390 1.69295
24.6943Linolenic acid860C06427Alpha-linolenic-acid metabolism1.6928
27.2841Analyte 368 1.66915
15.2173(+-)-Dihydrocarveol 1.66557
22.3688Palmitic acid985C00249Fatty-acid metabolism1.66189
24.4579Thymidine 5’-monophosphate 19700C00364Pyrimidine metabolism1.65926
23.74Pentadecanoic acid13,849 1.63717
10.8151,5-Anhydroglucitol64,960C07326 1.63427
10.6488Deoxyerythritol 1.62735
Notes: Vital metabolites are sorted according to variable importance in the projection (VIP) value; T/O represents T vs. O, the latter is the control, and other comparisons have the same meaning.
Disclaimer/Publisher’s Note: The statements, opinions and data contained in all publications are solely those of the individual author(s) and contributor(s) and not of MDPI and/or the editor(s). MDPI and/or the editor(s) disclaim responsibility for any injury to people or property resulting from any ideas, methods, instructions or products referred to in the content.

