Abstract
Although Japan’s planted forest resources are mature, efficient timber production and reforest postharvest are hindered by the small-scale forest ownership and private forest owners’ (PFOs’) low willingness to engage in forest management. A New Scheme of Forest Management (NSFM) has been established under which Japan’s municipalities can aggregate forest management rights which PFOs with low future intentions for forest management. Therefore, this study explores the socioeconomic factors that determine PFOs’ future intentions for forest management and examines NSFM challenges. PFOs were surveyed via questionnaires in two regions of Miyazaki Prefecture with different forest ownership sizes. The results showed that forest size and the presence of successors affect PFOs’ future intention for forest management. In addition, PFOs with low future intentions were less aware of their forests, and their forests were the source of reforest abandonment. Although aggregating forest management rights of PFOs with low future intention by the municipalities may contribute to sustainable forest management, the increased workload on municipalities is a challenge. Overall, accessibility to sufficient decision-making information is a prerequisite for evaluating PFOs’ future intention to manage their forests.
1. Introduction
In Japan, planted forests cover 10 million ha or approximately 40% of the 25 million ha of the forest area, of which 65% are privately owned [1]. The planted forest resources, it is mainly converted from primarily broadleaf forests to conifer forests Japanese Cedar (Cryptomeria japonica) and Japanese Cypress (Chamaecyparis obtusa), which were established after World War II have matured; half of them are over 50 years old and are now in their utilization period. Notably, the amount of timber produced increased from 15.1 million m3 in 2002 to 31.2 million m3 in 2020 [1]. However, the Forestry Agency has found that the log supply from clearcutting is approximately 40% of the growing volume of planted forests accumulated, indicating that the resource must be utilized more efficiently.
The Japanese government has promoted forestry promotion policies, including the revision of the Forestry Basic Law in 1964, in response to the declining profitability of the domestic forestry industry against the backdrop of the strong yen and increasing timber imports [2]. Aggregating small-scale forest stands have been promoted as a policy measure to improve operational efficiency and reduce timber production cost in Japan, where the majority of forest owners are small-scale private forest owners (PFOs) [3]. However, as planted forests matured and entered the harvesting stage, further aggregation of forest management was required. In 2019, the Forestry Agency has started a “New Scheme of Forest Management” (NSFM) to solve the following problems: the low willingness of PFOs to manage their forests, the disparity between the intentions of PFOs and forestry managers to expand the scale of their operations, the slow introduction of road network maintenance and high-performance machinery, and low productivity. The small-scale ownership of forest conditions is a major obstacle to efficient timber production, as 74% of forest areas owned by PFOs are less than 5 ha [4]. The NSFM ensures the following: (1) A growth industry is compatible with proper forest management, (2) aggregation of forest management rights, not including ownership, to highly motivated and sustainable forestry enterprises, and (3) improvement conditions for aggregation of forest management [4]. As part of this effort, in 2018, the government enacted a Forest Management Law to achieve effective timber production and appropriate forest management by aggregating forest management rights. Specifically, this law stipulates that PFOs must manage their own forests and are responsible for harvesting, silviculture, and nursery at the appropriate times. It also allows PFOs to entrust forest management to the municipality in accordance with PFOs’ future intentions. Forests suitable for forestry management are re-entrusted to forestry enterprises from the municipality according to their economic values, whereas the municipality manages those that are unsuitable. Thus, the NSFM is based on PFOs’ willingness to manage their forests in the future, and municipalities survey PFOs’ intentions to ascertain their willingness to do so. The survey selection criteria included planted forest owners without a forest management plan and forest management that had not been implemented for the past decade.
The Forest Environment Transfer Tax (FETT) allocation began in 2019 in Japan as a financial resource for municipalities and prefectures that will be directly responsible for NSFM. The FETT amount allocated to municipalities is calculated as follows: 50%, 20%, and 30% of the municipality allocations are based on the area of private forest plantations, forestry worker population, and municipality population, respectively. The area of privately planted forest is corrected according to the forest area ratio, with 1.5 for municipalities with a forest area ratio of 85% or more and 1.3 for municipalities with a forest area ratio of 75% or more but less than 85%. Notably, the criteria for determining the allocation amount deviate from the system’s intention [5]. As FETT has only been operational for a limited time, system evaluation is a future concern. However, the actual situation regarding tax utilization is being assessed for prefectures [6] and large cities [7], prefectural support for municipalities [8,9], urban–rural partnerships [10]. In addition, Ishizaki et al. [11] mentioned the increased workload of municipal officials on the NSFM and the FETT administration.
The Forest Management Law, which directs the future management of the PFOs’ forest according to the PFOs’ willingness, may promote immediate timber production and forest improvement. However, because the transfer of rights related to the property rights of PFOs must be done cautiously, the development of PFOs willing to manage their forests must be balanced with the smooth aggregating forest management rights from PFOs unwilling to manage their forests. Clarifying the factors that influence future management intentions is thus necessary when considering the maintenance or enhancement of PFOs’ willingness to forest management.
Effective forest policy implementation requires identifying the determinants of PFOs’ decisions [12] and developing forest policies that can influence PFOs’ behaviors [13]. Forest owner typologies are being utilized to develop a method for identifying forest owner values [14]. The typology studies are mostly based on ownership objectives [15]. Previous studies noted that forest owners could be divided into five types: “economist,” “multiobjective owner,” “recreationist,” “self-employed,” and “passive owner,” based on the purpose of their forest ownership [12,13]. Boon et al. [12] classified the Danish PFOs into three types: “classic owner,” “hobby owner,” and “indifferent farmer” based on a survey of PFOs’ interest in forests. Ingemarson et al. [13] classified the Swedish PFOs into five types: “traditionalist,” “economist,” “conservationist,” “passive,” and “multiobjective,” according to the purpose of ownership, and showed differences in the forest ownership size, frequency of visits to their own forest, and presence of successors. Ficko and Boncina [15] classified PFOs as “materialists” and “nonmaterialists”. On the other hand, some studies categorized PFOs focused on their forest management behaviors. The willingness of landowners to harvest woody biomass as a characteristic of woody biomass suppliers has been noted as a factor of ownership purpose, owned forest size, tree species structure and composition, and demographics in the southern United States [16]. In contrast to these previous studies, an approach that categorizes PFOs according to their expressed future intention for their forest management and who identifies the underlying factors that can contribute to their decision-making process is required to clarify the issues involved in the NSFM, Japan.
The declining willingness of PFOs to forest management has been identified as a problem [17], with multiple factors influencing PFOs’ management behaviors in Japan. Considering the PFOs’ forest status, these factors included forest ownership size [18], especially planted forest size, and the distance between the residence and owned forest [19,20]. For PFOs’ perceptions and management behaviors, PFOs’ awareness of forests as property [21], the awareness of owned forest boundaries [22], perception of planted forest locations [19,20], and registration status [19,22] are noted. PFOs’ attributes were mentioned in terms of age [23], occupation [24], and the existence of successors [24]. In addition, social relationships in local communities [25], membership in a forest owners’ cooperative (FOC) [22], deteriorated functioning of FOC’s regional organizations [26], and residence or absence in the village have been identified as factors influencing the owner–local community relationship [20]. Since the late 1990s, neglecting reforest postharvest has emerged as a problem resulting from PFOs’ poor forest management practices [27]. Low prices of standing timber as economic factors [28] and the failure to continue the management of forest divisions upon contract expiration as institutional factors contribute to reforest abandonment [29]. Indicated by these results are the factors that define PFOs’ management behaviors and their perception of forests. However, studies on future management intentions are limited. Hayashi et al. [24] mentioned regional differences in the factors that influence PFOs’ willingness to sell, as well as occupation and successors. Kushiro and Ito [30] described that many PFOs, notably absentee village owners, want to disengage from forest management despite acknowledging the necessity of continuing forest management for reasons including uncertainty of inheritance, loss of boundary, and economic evaluation.
This study aimed to identify the socioeconomic factors affecting the future intention for forest management by classifying the PFOs’ future intentions.
2. Methodology
2.1. Study Site
The study survey was conducted in Miyazaki Prefecture, which ranks third in Japan for timber production (1,879 thousand m3) and first for cedar production (1739 thousand m3) [31]. Small-scale PFOs dominate southern Miyazaki Prefecture, whereas large-scale PFOs dominate northern Miyazaki Prefecture, indicating regional variations. Southern PFOs in this prefecture have a low willingness to manage their forests [32]. In addition, the identifying PFOs and their confirming their rights is an obstacle to timber production in the southern region [33,34].
In this study, considering the difference in the forest ownership scale [35], Kunitomi Town (hereafter Kunitomi) was selected as the study site from the southern part (primarily small-scale PFOs), and Kitakata district in Nobeoka City (hereafter Kitakata) (Figure 1) from the northern part (mainly large-scale PFOs) (Figure 2).
Figure 1.
Study site.
Figure 2.
Proportion of forest ownership scale [34].
Kunitomi is a suburban area adjacent to Miyazaki City, the capital city of Miyazaki Prefecture, with a population of 18,027 [35], an area of 130.6 km2, and a forest area of 7736 ha (59.2% forest area) [36]. Ownership of less than 5 ha accounts for 98.8% [37]. Former Kitakata Town merged with Nobeoka City in 2006 and became a part of Nobeoka City. The population is 3321 [38], with an area of 200.1 km2, forest areas of 17,770 ha, and a forest area ratio of 88.4% [36].
2.2. Method and Data Collection
All PFOs who belonged to FOC in both regions were surveyed using questionnaires to collect data. The questionnaires included questions on the following (1) forest conditions, (2) PFOs’ characteristics, and (3) PFOs’ management behaviors and attitudes; these factors were considered to influence the differences in the future intention of forest management. Although relatives of PFOs may have responded to the questionnaire, they were treated as PFOs in this study. In Kunitomi, 502 questionnaires were mailed out, and of the 367 questionnaires sent out, excluding 135 that were unaddressed, 166 were returned (response rate: 45.2%), and the number of valid responses was 162 (valid response rate: 44.1%). In Kitakata, out of 613 letters sent by mail (625 questionnaires were mailed and 12 were unaddressed), 299 questionnaires (response rate: 48.8%) were received, and the number of valid responses was 298 (48.6%). The questionnaire surveys were conducted from October to November 2020 in Kunitomi, and from December 2020 to January 2021 in Kitakata.
Based on the results obtained, the PFOs were classified into two groups according to their future intentions for the forest management scale: “expansion/maintenance PFOs” (hereafter EM group) who want to expand or maintain the management scale, and “decrease PFOs” (hereafter D group) who want to decrease the forest management scale. We then compared the situation in the two regions and examined the effects of regional differences in forest ownership size on PFOs’ future intentions to manage their forests. Then, we compared the forest conditions factors and PFOs’ characteristics. After that, we compare PFOs’ behaviors and attitudes to forest management in each region, elucidating the factors that influence future intentions to forest management and regional differences. The chi-square test was used to make comparisons at a 0.05 significance level. Based on this analysis, we discuss the chances and challenges of NSFM (Figure 3).
Figure 3.
Research structure.
3. Results
3.1. Regional Comparisons
3.1.1. PFOs’ Future Intentions
Differences were observed between the two regions’ PFOs’ intentions regarding the future forest management scale (p = 0.000). In Kunitomi, 47.3% (70 PFOs) belonged to the EM group, whereas 52.7% (78 HHs) belonged to the D group. In Kitakata, 70.9% (185 PFOs) belonged to the EM group, whereas 29.1% (76 PFOs) belonged to the D group.
Differences between the two regions were also seen in forest management intentions (p = 0.000). In Kunitomi, most PFOs (29.7%, 46 PFOs) wanted to “sell and transfer” their land, whereas 25.8% (40 PFOs) were “undecided,” meaning that they were not thinking about or were considering the future management method. However, in Kitakata, “undecided” was the most common response (30.8%, 88 PFOs), followed by “entrustment” (28.7%, 82 PFOs). PFOs who answered “sell or transfer” accounted for 13.6% (39 PFOs). Overall, these results indicate that PFOs’ future management intentions were low in Kunitomi and that many PFOs were willing to relinquish their land (Table 1, Table A1).
Table 1.
Comparison of future intention to manage forests between two regions.
3.1.2. Forest Ownership Size and Forest Conditions
Forest ownership size between the two regions differed, and Kunitomi tended to have smaller forest ownership size than Kitakata (p = 0.000). The most prevalent response in both regions was that PFOs were unaware of their forest sizes, with 29.2% (45 PFOs) in Kunitomi and 38.7% (106 PFOs) in Kitakata. Concerning the trends by size of PFOs who were aware of their forest areas, Kunitomi had the highest percentage of PFOs with a forest ownership size of 1–3 ha (34.4%, 53 PFOs), followed by PFOs with a forest ownership size of less than 1 ha. In Kitakata, the highest percentage of PFOs owned 10–30 ha (16.1%, 44 PFOs), followed by those who owned 5–10 ha (11.7%, 32 PFOs). Similarly, the planted forest size was unknown, with the highest percentage of PFOs in Kunitomi (40.1%, 59 PFOs) and Kitakata (41.4%, 110 PFOs). Kunitomi tended to have smaller PFOs than Kitakata (p = 0.000) based on the planted forest size known.
Regarding the degree of maturity of planted forests, 46.7% (70 PFOs) of the PFOs in Kunitomi and 60.0% (168 PFOs) in Kitakata indicated that their planted forests were “mature,” whereas 0.7% (1 PFOs) in Kunitomi and 2.5% (7 PFOs) in Kitakata said they were “partially” at the harvest stage. The northern region tended to have a greater proportion of mature forests (p = 0.014). In addition, 20.7% (31 PFOs) of the respondents in Kunitomi and 12.9% (36 PFOs) in Kunitomi answered that they were unsure. No significant difference was observed between the two regions in the status of the cadastral survey, with 60.9% (95 PFOs) completed in Kunitomi and 58.5% (172 PFOs) in Kunitomi (p = 0.161).
Regarding forest registration methods, Kunitomi tended to favor single-title registration, whereas Kitakata favored shared-title registration (p = 0.002).
These results indicate that Kunitomi has smaller forest and planted forest areas than Kitakata and that Kunitomi’s forest ownership size is smaller than that of Kitakata. In both regions, most PFOs were unaware of their own forest areas and planted forests (Table 2).
Table 2.
Comparison of forest conditions between the two regions.
3.1.3. Demographic Characteristics of PFOs
The largest proportion of PFOs in both regions were in their 60s (Kunitomi: 31.0%; Kitakata: 37.9%), followed by those in their 70s (Kunitomi: 29.0%; Kitakata: 29.1%) (p = 0.371). Gender was predominantly male (Kunitomi: 86.5%; Northern: 87.8%) (p = 0.764). The relationship between the PFO and FOC was as follows: in Kunitomi, 50.7% (74 PFOs) were cooperative members, 15.1% (22 PFOs) were heirs of cooperative members, and 34.2% (50 PFOs) were unknown. In Kitakata, 83.4% (226 PFOs) were cooperative members, 3.7% (10 PFOs) were heirs of cooperative members, and 12.9% (35 PFOs) were unknown, indicating that more PFOs in Kitakata were cooperative members than in Kunitomi, whereas more PFOs in Kunitomi were unaware of their relationship with FOC than Kitakata (p = 0.000). No differences existed in the two regions regarding the PFOs’ primary source of income. 59.1% (94 PFOs) of PFOs in Kunitomi and 63.5% (183 PFOs) in Kitakata reported having a successor (p = 0.362).
3.1.4. Awareness of Forest Ownership and Forest Management Behaviors
The proportion of respondents who were registered PFOs was 78.2% (122 PFOs) in Kunitomi and 72.1% (202 PFOs) in Kitakata, with no significant difference between the two regions (p = 0.097). The forest was primarily managed by its PFOs in both regions (Kunitomi: 55.0%, Kitakata: 64.0%). In comparison, 40.0% (64 PFOs) of the PFOs in Kunitomi and 28.1% (82 PFOs) in Kitakata indicated that they did not manage the forest (p = 0.190). The proportion of PFOs recognizing their forest locations was 75.6% (121 PFOs) in Kunitomi and 73.1% (209 PFOs) in Kitakata, whereas the proportion of PFOs not recognizing the location was 10.6% (17 PFOs) in Kunitomi and 10.8% (31 PFOs) in Kitakata, showing a similar trend (p = 0.573). Furthermore, in Kunitomi, 60.9% (98 PFOs) were aware of the PFO’s boundaries, whereas 21.1% (34 PFOs) were unaware, and in Kitakata, 67.8% (192 PFOs) were aware, whereas 15.2% (43 PFOs) were unaware. No differences were observed between the two regions (p = 0.149). The PFOs’ frequency of visits to the forests did not differ between the two regions (p = 0.650). The most common response in Kunitomi was “rarely” (23.8%, 38 PFOs), followed by “once a year” (21.9%, 35 PFOs); 3.8% (6 PFOs) of PFOs visited monthly, 18.1% (29 PFOs) visited several times a year; and 9.4% (15 PFOs) of the PFOs never visited. The most common response in Kitakata was “once every few years” (25.7%; 76 PFOs), followed by “almost never” (22.0%; 65 PFOs); 3.0% of PFOs visited monthly (9 PFOs), 19.6% (58 PFOs) visited several times a year; and 6.4% (19 PFOs) of the PFOs never visited (Table A1).
Notably, 73 PFOs (46.8%) in Kunitomi and 125 PFOs (44.8%) in Kitakata (p = 0.690) had harvesting experience within the previous five years. Of these, 72 PFOs (excluding 1 PFO in Kunitomi due to no response) and 125 PFOs in Kitakata were compared. The “suitable age of harvesting” was answered by 26.4% (19 PFOs) of the respondents in Kunitomi and 45.6% (57 PFOs) in Kitakata (p = 0.010); 6.9% (5 PFOs) of the respondents in Kunitomi and 16.8% (21 PFOs) in Kitakata responded “to earn extra income” (p = 0.052). “Recommended from FOC” was selected by 1.4% (1 PFO) in Kunitomi and 6.4% (8 PFOs) in Kitakata (p = 0.159). “Recommended from the private logging company” was 51.4% (37 PFOs) in Kunitomi and 25.6% (32 PFOs) in Kitakata (p = 0.000). An “increase in timber prices” was unobserved in Kunitomi but was 0.8% (1 PFO) in Kitakata (p = 1.000). The “expiration of sharing contract” was unobserved in Kunitomi but was 6.4% (8 PFOs) in Kitakata (p = 0.028). “Wind damage, disease, and insect damage” accounted for 11.1% (8 PFOs) in Kunitomi and 3.2% (4 PFOs) in Kitakata (p = 0.033). “Others” accounted for 9.7% (7 PFOs) in Kunitomi and 10.4% (13 PFOs) in Kitakata (p = 1.000).
We then determined whether these PFOs had reforested postharvest. The results showed that 29.6% (21 PFOs) of the PFOs in Kunitomi and 55.2% (64 PFOs) in Kitakata had reforested, whereas 57.7% (41 PFOs) in Kunitomi and 37.1% (43 PFOs) in Kitakata had not reforested, indicating that more PFOs in Kitakata had reforested (p = 0.026). Regarding the intention to conduct harvest and reforest in the future, 20.6% (32 PFOs) of the PFOs in Kunitomi and 31.3% (89 PFOs) in Kitakata wanted to conduct both harvesting and reforestation. In comparison, 10.3% (16 PFOs) in Kunitomi and 8.5% (24 PFOs) in Kitakata wanted only to harvest and not reforest (24 PFOs) in Kitakata. The PFOs who answered that they had no plans to do so were the most numerous in both areas, with 66.5% (103 PFOs) in Kunitomi and 57.7% (164 PFOs) in Kitakata.
When comparing the factors that would be important in the decision-making process for harvesting, the most common factors that differed between the two regions were “reasonable profit” (Kunitomi: 40.4%; Kitakata: 54.6%, p = 0.007) and “sell with the land” (Kunitomi: 66.7%; Kitakata: 12.6%, p = 0.000). No differences were indicated for “trust of buyer” (p = 0.098), “reforestation postharvest” (p = 0.211), “only harvesting” (p = 1.000), and “the adjacent landowner also harvesting” (p = 0.800) (Table 3).
Table 3.
Comparison of reasons for harvesting/reforestation and harvesting decisions between the two regions.
3.2. In the Case of Kunitomi
3.2.1. Size of Ownership and Forest Conditions in Kunitomi
The EM group owned most (34.8%) of the forest management size (1–3 ha), whereas the D group had most (36.8%) of the PFOs who did not know the size, but no difference was indicated in the trend of the forest size (p = 0.112). Similarly, the size of plantations did not differ (p = 0.094), but the EM group had the largest number of PFOs with 1–3 ha (34.8%), whereas the D group had the largest number of PFOs who did not know the size of their plantations (48.8%). The maturity of planted forests was most frequently answered by PFOs of both the EM group (47.0%) and the D group (60.0%) as mature, whereas the D group had the largest proportion of PFOs who did not know the status (p = 0.518). Land cadastral surveys (p = 0.316) and land registration titles were most often under a single title, with no differences indicated (p = 0.159) (Table 4).
Table 4.
Comparison of forest conditions between the two groups in Kunitomi.
3.2.2. Demographic Characteristics of PFOs
The age distribution of PFOs (p = 0.108), gender (p = 0.430), relationship with the FOC (p = 0.960), and PFOs’ primary income source showed no differences between the two groups. Significant differences were observed in the presence or absence of successors, with the D group tending to have no successors (p = 0.019) (Table 5).
Table 5.
Comparison of PFOs’ characteristics between the two groups in Kunitomi.
3.2.3. PFOs’ Forest Management Behaviors and Attitudes
In both regions, the registered person was typically the principal owner (p = 0.521). Most primary managers were owners themselves (74.3%) in the EM group, whereas the majority were not managing (50.6%) in the D group (p = 0.002). A difference existed in the number of respondents who knew the location of their forest, with the EM group tending to have a higher percentage of respondents who knew the location of their forest (p = 0.010). The same was true for the boundaries, with the EM group tending to have more PFOs who knew the boundaries in person (p = 0.020). Comparing the frequency of forest visits revealed that the EM group tended to visit the forest more frequently (p = 0.002) (Table 6).
Table 6.
Comparison of forest management behaviors between the two groups in Kunitomi.
No differences between regions were indicated in the percentage of PFOs who harvested in the last five years (p = 0.742), and the reasons that led to harvesting were similar. Regarding reforestation postharvest, 46.4% of the PFOs in the EM group reforested, whereas 17.1% in the D group did, indicating that PFOs with low motivation for forest management tended not to reforest (p = 0.037). The EM group was likelier to prioritize the following factors in their decision to log: the prospect of substantial profit (p = 0.015) and reforestation postharvest (p = 0.030). However, the D group demonstrated a greater likelihood of selling stumpage with the land (p = 0.000) (Table 7).
Table 7.
Comparison of reasons for harvesting/reforestation and harvesting decisions between the two groups in Kunitomi.
3.3. In the Case of Kitakata
3.3.1. Future Intentions of PFOs
Most PFOs in the EM and D groups reported that they were unsure of their forest size (EM group: 32.4%; D group: 48.5%). Most respondents in the EM group (18.8%) owned 10–30 ha, whereas most respondents in the D group (13.2%) owned 1–3 ha, indicating that the EM group tended to own a larger forest. In contrast, a higher percentage of respondents in the D group did not know their owned forest size (p = 0.007). Similarly, the plantation forest size of the EM group was the most common (32.0% in the EM group; 57.6% in the reduced size group). As with the forest size, the EM group tended to have a larger planted forest size and to know the size (p = 0.000). The maturity of planted forests was most frequently reported as mature by both the EM (63.8%) and D groups (57.5%), although a higher percentage of PFOs in the D group did not know the condition (p = 0.006). No differences were observed in the implementation of cadastral surveys (p = 0.199) or the method of land registration title (p = 0.570) (Table 8).
Table 8.
Comparison of forest conditions between the two groups in Kitakata.
3.3.2. Demographic Characteristics of PFOs
No differences were found between the two groups in the PFOs’ age distribution (p = 0.863) or gender (p = 0.156). As for the relationship with FOC, the D group was likelier to be unaware of whether they were members (p = 0.004). Regarding succession, the D group was likelier to have no successor (p = 0.000). In addition, a higher proportion of the EM group was in agriculture (p = 0.042) and forestry (p = 0.028) as the primary income sources for the PFOs (Table 9).
Table 9.
Comparison of PFOs’ characteristics between the two groups in Kitakata.
3.3.3. PFOs’ Forest Management Behaviors and Attitudes
Both groups had the highest percentage of respondents, in which the principal was the registered owner (p = 0.981). The principal administrator was the owner himself in both the EM (78.6%) and D groups (64.9%). In both groups, the owner recognized the location (p = 0.355) and boundaries (p = 0.051) of the owned forest; the highest percentage of owners themselves managed the forest, whereas a higher percentage of the D group did not (p = 0.000). Comparing the frequency of visits to the forest revealed that the EM group tended to visit more frequently (p = 0.000) (Table 10). No difference was observed between the two groups in the percentage of PFOs harvested in the past five years (p = 0.679). Likewise, no difference was observed in the reasons for harvesting among PFOs who had logged before. Regarding reforest postharvest, 63.4% of the PFOs in the EM group fully reforested, whereas 51.6% of those in the D group did not, indicating that PFOs with low motivation for forest management tended not to reforest (p = 0.029).
Table 10.
Comparison of forest management behaviors between the two groups in Kitakata.
Differences were also observed in the factors that were important in the decision to harvest. A high percentage of the EM group indicated that they expected to make a substantial profit (p = 0.005), whereas a high percentage of the D group indicated that they were willing to sell the land with stumpage (p = 0.000) (Table 11).
Table 11.
Comparison of reasons for harvesting/reforestation and harvesting decisions between the two groups in Kitakata.
4. Discussion and Conclusion
The NSFM aims to realize efficient and sustainable timber production based on consolidating the forest land of PFOs with low future intentions. In this study, we administered a questionnaire to PFOs in Miyazaki Prefecture, one of the most active areas for timber production in Japan, to examine the socioeconomic factors that affect PFOs’ future intentions.
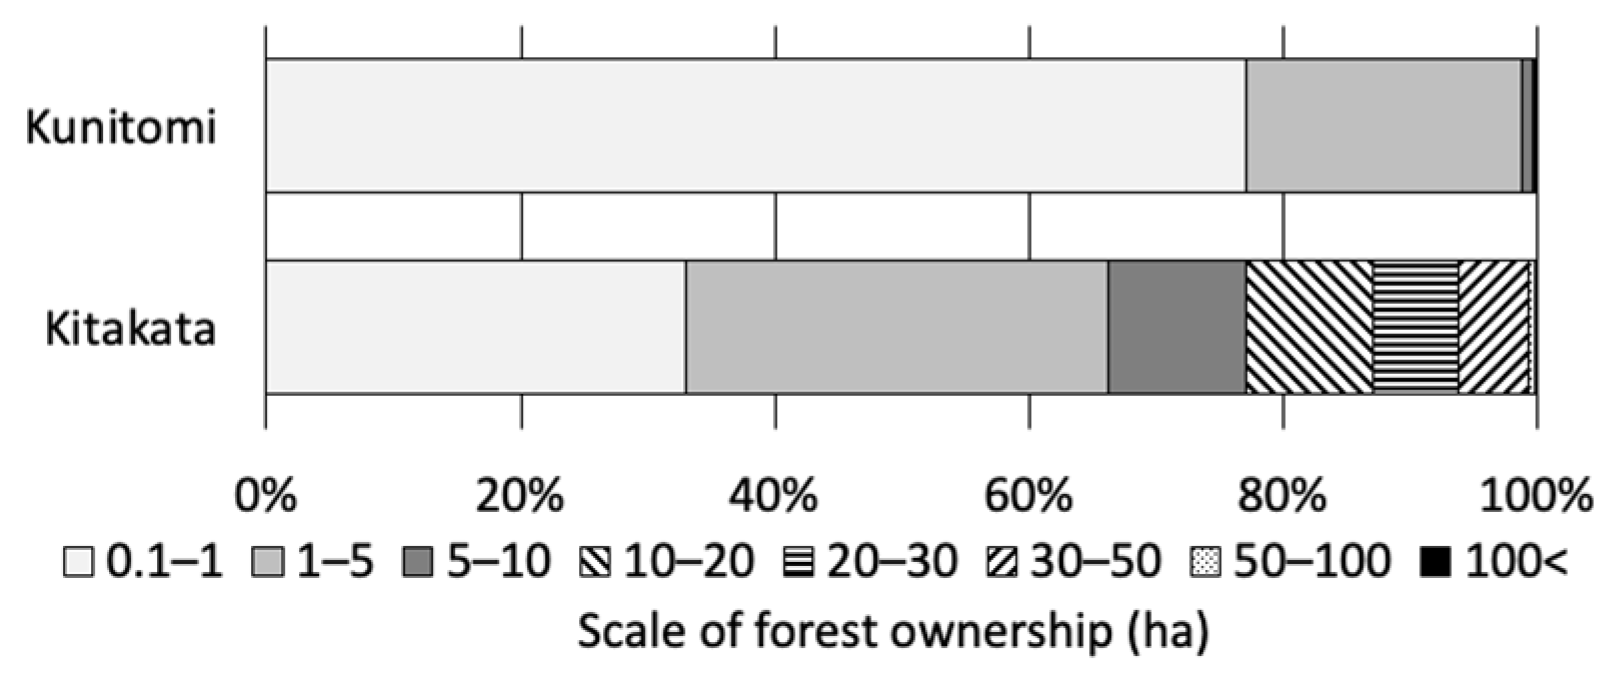
The PFOs’ willingness to manage forests varies by region [32]. First, this study compared PFOs’ future intentions and the factors that might influence them across regions with different forest ownership sizes. In the small-scale region, 52.7% of PFOs desired to reduce the future management scale, whereas 70.9% of PFOs in the large-scale region desired to maintain or increase the management scale. A comparison of the two regions revealed the problems in private forest management. A common problem in small and large regions was the lack of awareness of forests owned by PFOs themselves. In particular, the fact that many PFOs were unaware of the size of their forests and planted forests indicated that PFOs do not have the sources to understand the value of their forests and consider the direction of future forest management. The importance of successors in forest management was also indicated. Additionally, this study revealed the challenges specific to the small-scale regions. The small-scale regions showed fewer future intentions to manage forests. Many PFOs were unaware of the maturity of their planted forests as well as the size of their forests. This may be attributed to the lack of understanding in many PFOs regarding the economic value of their planted forests, which may be one factor that reduces their willingness to manage their forests. Since many PFOs did not understand the value of their forests, their decision-making process regarding forest management was passive, as evidenced by the reasons for their decision to harvest their forest. Additionally, many PFOs wanted to quit forestry, whereas many did not reforest postharvest (Table 12). These results indicated the need to develop a framework to provide PFOs with enough information to consider future management directions while implementing NSFM. At the same time, since small-scale regions are less willing to manage forests than large-scale regions, aggerating forest management right by municipalities is promising for the sustainable management of forests. However, since the workload of municipalities is excessive [11], the prefectural government should support municipalities in small-scale areas with an emphasis on small-scale regions. PFOs’ low willingness to manage their forests may harm timber production, as owner identification and rights identification are particular barriers to timber production in the small-scale region [33,34]. Similar results were obtained for forest and planted forest size, as they influenced the current willingness to manage [13,16,18,19,20].
Table 12.
Inter-regional differences of forest management problems.
Next, based on the survey results, we examined the factors affecting the future intentions of PFOs and the forest management behaviors of PFOs with low future intentions. The factor affecting future intention in small-scale regions was the presence of successors [24]. No difference was found in the forest size [13,16,18,19,20], which was considered a factor while analyzing the results, likely because the forest size was biased toward small-scale. In contrast, forest size, planted forest size, and planted forest maturity were the factors of forest condition that influenced the future intentions in large-scale regions. These results suggest that the economic value of forests affects the future intentions of the PFOs in large-scale regions. In addition, the existence of successors, the relationship with the FOC, and forestry’s position as an income source were also indicated as factors. Since it is essential to clarify the forest management behaviors of the PFOs with low future intentions to consider forestry policies, we summarized the characteristics of the forest management behaviors and attitudes of the D group. Among the common issues associated with both regions, the D group tended to have scarce forest management and be willing to dispose of their forestlands. Therefore, these PFOs tended not to implement reforestation because they had less emphasis on the reforest postharvest. In small-scale regions, few PFOs had future management directions and were unaware of the location and boundaries of their forests (Table 13). The D group was not considered interested in the economic value of the forest. There could be two possible causes behind the lack of interest in economic value: first, they do not have information about the forests, and second, they must dispose of the forests due to the absence of successors to inherit them.
Table 13.
The factors affecting the PFOs’ future intention, tendency of D group’s forest management behaviors.
Under the Forest Management Law, municipalities must conduct surveys of PFOs’ intentions, and some have already begun to do so. Many PFOs are likely to respond to this survey without having all the facts they need to decide on their future forest management intentions. A procedural flaw can be identified regarding the intention survey, which encourages PFOs to make decisions without information about their forests. Before the survey, the government must provide an opportunity for the PFOs to know the location and boundaries of the forest, resource status, and other information. In addition, the omission of local forest ownership size from the criteria for allocating FETT to municipalities is a flaw of this system [5]. FETT is used for “expenses related to forest improvement and its promotion, such as thinning, human resource development and securing of bearers, promotion of timber use, and public awareness.” The areas requiring enhanced forest improvement are those with low future management intentions. Furthermore, the results of this study suggest that many PFOs in small-scale regions would like to outsource management or relinquish their land. Therefore, the administrative burden of conducting the survey and forest management aggregation in municipalities with small-scale regions is considered high. For municipalities, securing finances is the most critical aspect of operating NSFM [30]. These results suggest that FETT allocation criteria could still be considered based on the regional characteristics of ownership size. Differences were also observed in the factors that influenced the decision of forest PFOs to harvest between the two regions with different ownership sizes.
This study examined the factors that influence the PFOs’ future intentions in small and large regions by categorizing them by their future intentions and comparing the two types. Comparing the two groups revealed that the EM group prioritized economic benefits and the sustainability of the forest resource in their harvesting decisions. In contrast, the D group had more PFOs who wanted to relinquish their land and withdraw from forestry management. The EM group tended to own more forestland, suggesting that the size or economic value of their forest holdings influenced their future willingness to manage their forests. The D group was characterized by less frequent forest visits and a greater proportion of PFOs who lacked basic forest knowledge, such as area, location, and boundaries. These findings suggest that PFOs’ lack of knowledge about their forests may result in uninterested in forest management.
The existence of successors is an essential factor in the continuity of forest management [24], in addition to the size, especially planted forest size [18,19,20]. Therefore, information on the forest owned, forest area, and the availability of successors are factors influencing willingness to future forest management. The forest management behaviors of PFOs with low future willingness to manage revealed issues regarding forest sustainability. In terms of harvesting decisions, the EM group emphasized the economic benefits and sustainability of the resource. However, the D group saw the logging decision as an opportunity to withdraw from forestry management and passively made logging decisions. This suggests that forests owned by PFOs with low future intention goals are a source of the increased abandonment of reforested.
To better reflect effective forest policy through PFOs typologies [14], examining the factors underlying the decisions of typified PFOs is necessary [12]. PFOs who wish to reduce the size of their future management have poorer forest management behaviors and are likelier to abandon the reforested area. Therefore, the method of categorizing PFOs based on their future willingness to manage the forest with resource sustainability and efficiency of operations was considered reasonable. However, promoting the transfer of forests owned by PFOs with a low future intention to forest management is insufficient; measures are also required to increase PFOs’ willingness to forest management. Furthermore, PFOs must be given more opportunities to learn enough about their forests to make informed decisions about future management direction. Especially, the NSFM must consider the ways to develop forest information, provide PFOs with opportunities to obtain such information, encourage PFOs who are willing to manage their forests, and strengthen municipal work structures [11].
Therefore, the role of FOCs who have a good understanding of the status of local forests is crucial [26]. In large areas where the economic value of forests is relatively high, strengthening the relationship between PFOs and FOCs may be effective in motivating PFOs to manage the forests. It is expected that PFOs will be more likely to obtain information on their forests from FOCs, which will provide an opportunity for PFOs to recognize the economic value of their forests. In addition, since many PFOs are willing to dispose their lands in small-scale regions, the aggregation of the forest management rights by the municipalities will be required for sustainable forest management. As the workload of municipalities is expected to increase due to this policy, it will be necessary for the prefectural government to support the municipalities with small forest ownership in a focused manner [6,8].
Author Contributions
Conceptualization, N.O. and S.O.; methodology, N.O.; formal analysis, N.O.; investigation, N.O. and S.O.; writing—original draft preparation, N.O.; writing—review and editing, N.O., S.O. and N.T.; supervision, N.T.; project administration, N.O.; funding acquisition, N.O. and N.T. All authors have read and agreed to the published version of the manuscript.
Funding
This research received JSPS KAKENHI Grant Numbers JP19K20509, JP19KK0027 and JP21H03709.
Institutional Review Board Statement
Not applicable.
Informed Consent Statement
Not applicable.
Acknowledgments
The authors wish to thank the respondents for their valuable contribution to the completion of this paper.
Conflicts of Interest
The authors declare no conflict of interest.
Appendix A
Table A1.
Comparison of forest management behaviors between two regions.
Table A1.
Comparison of forest management behaviors between two regions.
| Kunitomi | Kitakata | p-Value | Kunitomi | Kitakata | p-Value | |||||||
|---|---|---|---|---|---|---|---|---|---|---|---|---|
| n | % | n | % | n | % | n | % | |||||
| Registration name | 0.097 | Person or organization aware of boundary | 0.149 | |||||||||
| Owner | 122 | 78.2 | 202 | 72.1 | Owner | 98 | 60.9 | 192 | 67.8 | |||
| Previous generation | 30 | 19.2 | 56 | 20.0 | Relatives | 5 | 3.1 | 13 | 4.6 | |||
| Varies depend on site | 2 | 1.3 | 4 | 1.4 | FOC | 2 | 1.2 | 9 | 3.2 | |||
| Unknown | 2 | 1.3 | 18 | 6.4 | Municipality | 16 | 9.9 | 15 | 5.3 | |||
| Total | 156 | 100.0 | 280 | 100.0 | Not recognized | 34 | 21.1 | 43 | 15.2 | |||
| Managing person | 0.190 | Others | 6 | 3.7 | 11 | 3.9 | ||||||
| Owner | 88 | 55.0 | 187 | 64.0 | Total | 161 | 100.0 | 283 | 100.0 | |||
| Relatives | 3 | 1.9 | 6 | 2.1 | Frequency of owned forest visits by owner | 0.650 | ||||||
| FOC | 3 | 1.9 | 9 | 3.1 | Every month | 6 | 3.8 | 9 | 3.0 | |||
| Private company | 0 | 0.0 | 1 | 0.3 | Several times a year | 29 | 18.1 | 58 | 19.6 | |||
| Not managing | 64 | 40.0 | 82 | 28.1 | Once a year | 35 | 21.9 | 55 | 18.6 | |||
| Varies depend on site | 0 | 0.0 | 3 | 1.0 | Once every few years | 31 | 19.4 | 76 | 25.7 | |||
| Others | 2 | 1.3 | 4 | 1.4 | Almost never | 38 | 23.8 | 65 | 22.0 | |||
| Total | 160 | 100.0 | 292 | 100.0 | Never | 15 | 9.4 | 19 | 6.4 | |||
| Person or organization aware of location | 0.573 | Varies depends on site | 6 | 3.8 | 14 | 4.7 | ||||||
| Owner | 121 | 75.6 | 209 | 73.1 | Total | 160 | 100.0 | 296 | 100.0 | |||
| Relatives | 3 | 1.9 | 9 | 3.1 | ||||||||
| FOC | 3 | 1.9 | 14 | 4.9 | ||||||||
| Municipality | 10 | 6.3 | 16 | 5.6 | ||||||||
| Not recognized | 17 | 10.6 | 31 | 10.8 | ||||||||
| Others | 6 | 0.7 | 7 | 2.4 | ||||||||
| Total | 160 | 100.0 | 286 | 100.0 | ||||||||
References
- Forestry Agency. Annual Report on Trends in Forest and Forestry in Japan Fiscal Year 2021 Japan; National Forestry Extension Association in Japan: Tokyo, Japan, 2022; pp. 53–116. (In Japanese) [Google Scholar]
- Ota, I. The shrinking profitability of small-scale forestry in Japan and some recent policy initiatives to reverse the trend. Small-Scale For. 2002, 1, 25–37. [Google Scholar] [CrossRef]
- Hosaka, K.; Konoshima, M.; Uemura, R.; Aruga, K. Optimizing aggregation of small forest stands for thinning operations: A case study in Nasushiobara, Tochigi Prefecture, Japan. Small-Scale For. 2022, 21, 369–392. [Google Scholar] [CrossRef]
- Forestry Agency. Annual Report on Trends in Forest and Forestry in Japan Fiscal Year 2017 Japan; National Forestry Extension Association in Japan: Tokyo, Japan, 2018; pp. 13–36. (In Japanese) [Google Scholar]
- Yoshihiro, K. A study of calculating divided benchmarks of special purpose tax for maintaining forest. Mon. Rev. Local Gov. 2019, 45, 3–20. (In Japanese) [Google Scholar]
- Kohsaka, R.; Uchiyama, Y. Forest Environmental Taxes at multi-layer national and prefectural levels. J. Jpn. For. Soc. 2019, 101, 246–252. (In Japanese) [Google Scholar] [CrossRef]
- Uchiyama, Y.; Kohsaka, R. Utilization of Forest Environment Transfer Tax in ordinance-designated cities. J. Jpn. For. Soc. 2020, 102, 173–179. (In Japanese) [Google Scholar] [CrossRef]
- Aikawa, T. Municipality support by prefectures. For. Econ. 2020, 72, 3–15. (In Japanese) [Google Scholar]
- Kohsaka, R.; Uchiyama, Y. Forest Environment Transfer Tax, prefectural forest policy, and support for municipalities. J. Jpn. For. Soc. 2021, 103, 134–144. (In Japanese) [Google Scholar] [CrossRef]
- Kohsaka, R.; Osawa, T.; Uchiyama, Y. Forest Environment Transfer Tax and urban-rural collaboration. J. Jpn. For. Soc. 2020, 102, 127–132. (In Japanese) [Google Scholar] [CrossRef]
- Ishizaki, R.; Kanomata, H.; Sasada, K. Size and expertise of municipal forest administration staff: Results of a survey on actual conditions of municipal forest administration (Conducted in 2020). J. Jpn. For. Soc. 2022, 104, 214–222. (In Japanese) [Google Scholar] [CrossRef]
- Boon, T.E.; Meilby, H.; Thorsen, B.J. An empirically based typology of private forest owners in Denmark: Improving communication between authorities and owners. Scand. J. For. Res. 2004, 19, 45–55. [Google Scholar] [CrossRef]
- Ingemarson, F.; Lindhagen, A.; Eriksson, L. A typology of small-scale private forest owners in Sweden. Scand. J. For. Res. 2006, 21, 249–259. [Google Scholar] [CrossRef]
- Ficko, A.; Lidestav, G.; Dhubháin, Á.N.; Karppinen, H.; Zivojinovic, I.; Westin, K. European private forest owner typologies: A review of methods and use. For. Pol. Econ. 2019, 99, 21–31. [Google Scholar] [CrossRef]
- Ficko, A.; Boncina, A. Probabilistic typology of management decision making in private forest properties. For. Pol. Econ. 2013, 27, 34–43. [Google Scholar] [CrossRef]
- Joshi, O.; Mehmood, S.R. Factors affecting nonindustrial private forest landowners’ willingness to supply woody biomass for bioenergy. Biomass Bioenergy 2011, 35, 186–192. [Google Scholar] [CrossRef]
- Sakai, M. Minds of forest owners for management and forest resource policy: For using and sustaining the resources of artificial forest. J. For. Econ. 1999, 45, 3–8. (In Japanese) [Google Scholar]
- Ito, N.; Hiroshima, T.; Shiraishi, N. Analysis of factors affecting forest management performance: A case study of Gifu prefecture. Jpn. J. For. Plan. 2005, 39, 49–57. (In Japanese) [Google Scholar] [CrossRef]
- Haga, D.; Katano, Y. Regional variations of resident and absentee forest owners in forest management activity. J. For. Econ. 2020, 66, 1–15. (In Japanese) [Google Scholar]
- Katano, Y. The underlying conditions of abandoned forests in the underpopulated area. J. For. Econ. 2016, 62, 21–30. (In Japanese) [Google Scholar]
- Hayashi, M.; Noda, I. Factors affecting owners’ attitude toward forest operations: An analysis of data from questionnaire survey at Kumamoto, Japan. J. For. Econ. 2005, 51, 1–9. (In Japanese) [Google Scholar]
- Kajima, S.; Uchiyama, Y.; Kohsaka, R. Private forest landowners’ awareness of forest boundaries: Case study in Japan. J. For. Res. 2020, 25, 299–307. [Google Scholar] [CrossRef]
- Noriko, S.; Premysl, M.; Takafumi, F. Attitudes of small-scale forest owners to their properties in an ageing society: Findings of survey in Yamaguchi prefecture, Japan. Small-Scale For. 2006, 5, 97–110. [Google Scholar]
- Hayashi, M.; Noda, I.; Yamada, Y. Factors affecting owners’ attitude toward forest management: An analysis of data from surveys at Oita, Japan. J. For. Econ. 2006, 52, 1–11. (In Japanese) [Google Scholar]
- Hayashi, M.; Oka, H.; Tanaka, W. Decision making of forest owners and social relationships: A view from transaction cost economics. J. For. Econ. 2011, 57, 9–20. (In Japanese) [Google Scholar]
- Sasada, K.; Tsuzuki, N. The actual situation and problems of district committee members and regional organizations that work to encourage members of forest owners’ cooperatives. J. Jpn. For. Soc. 2021, 103, 22–32. (In Japanese) [Google Scholar] [CrossRef]
- Yamamoto, M. Regional appearance of abandoning plantation forest practices and future of forest management: Issues of reforestation in Hokkaido. For. Econ. 2001, 54, 16–20. (In Japanese) [Google Scholar]
- Fujikake, I. Intensifying logging and replantation abandonment on non-national plantation forests in Miyazaki Prefecture. J. For. Econ. 2007, 53, 12–23. (In Japanese) [Google Scholar]
- Kohroki, K. A case study on non-reforestation and forest holding structure in South Kyushu, Miyazaki Prefecture. J. For. Econ. 2007, 53, 24–35. (In Japanese) [Google Scholar]
- Kushiro, T.; Ito, K. A study on the New Forest Management System. J. For. Econ. 2021, 67, 1–10. [Google Scholar]
- Department of Environment and Forestry Miyazaki Prefecture. Miyazaki Prefecture Forestry Statistics Handbook 2022; Department of Environment and Forestry Miyazaki Prefecture: Miyazaki, Japan, 2022. [Google Scholar]
- Mochida, H.; Shiga, K. The development of logging industry and the trend of forest owners in Miyazaki prefecture. T. Jpn. For. Soc. 1998, 109, 79–82. (In Japanese) [Google Scholar]
- Toyama, K.; Shiraishi, N. Questionnaire survey on the perceptions of logging contractors in Miyazaki Prefecture for the aggregation of private forests. Kyushu J. For. Res. 2010, 63, 5–8. (In Japanese) [Google Scholar]
- Onda, N.; Chinen, Y.; Owake, T.; Okuyama, Y. Influence of small-scale forest ownership on roundwood production and stumpage trade. For. Econ. 2021, 73, 1–11. [Google Scholar]
- Curent population. Available online: http://www.town.kunitomi.miyazaki.jp/main/welcome/page000568.html (accessed on 19 October 2022).
- 2015 Census of Agriculture and Forestry in Japan Report and Data on the Results. Available online: https://www.e-stat.go.jp/stat-search/files?page=1&layout=datalist&toukei=00500209&tstat=000001032920&cycle=0&tclass1=000001077437&tclass2=000001077396&tclass3=000001093235&tclass4=000001093483&stat_infid=000031515119&tclass5val=0 (accessed on 24 November 2022).
- Ministry of Agriculture, Forestry and Fisheries. 1990 Census of Agriculture and Forestry in Miyazaki Prefecture; Association of Agriculture and Forestry Statistics: Tokyo, Japan, 1992. [Google Scholar]
- Statistics of Nobeoka City. Available online: https://www.city.nobeoka.miyazaki.jp/soshiki/1/1364.html (accessed on 19 October 2022).
Disclaimer/Publisher’s Note: The statements, opinions and data contained in all publications are solely those of the individual author(s) and contributor(s) and not of MDPI and/or the editor(s). MDPI and/or the editor(s) disclaim responsibility for any injury to people or property resulting from any ideas, methods, instructions or products referred to in the content. |
© 2023 by the authors. Licensee MDPI, Basel, Switzerland. This article is an open access article distributed under the terms and conditions of the Creative Commons Attribution (CC BY) license (https://creativecommons.org/licenses/by/4.0/).