1. Introduction
Material costs and conversion efficiency directly influence wood products industries’ sustainability and profitability. The processing efficiency is particularly significant for highly refined wood products, e.g., furniture, multi-layered flooring, and other joinery products. In parquet and other engineered wood flooring (EWF), raw material availability is critical for retaining the market share of wood-based flooring coverings [
1]. Using wood for flooring coverings, when compared to other materials, has a lower environmental impact [
2] and contributes to enhanced human well-being [
3] but requires a higher investment cost [
4], mainly attributed to raw material cost. Using scarce raw materials implies thoroughly reviewing the production processes and technologies. A source of overprocessing waste in typical wood product manufacturing is the sawing of thin lamellae. Lamellae sawing generates waste due to the required kerf of the cutting tool and by limiting the lamella minimum thickness that can be sawn.
With currently available technology, wood slicing can be viewed as the only low-waste alternative to lamellae sawing. Slicing or flat-slicing of wood slabs allows for fast wood processing into thinly sliced lamellae (SLs) that could be integrated into various products, e.g., EWF and other multi-layered panels where the crown-cut wood appearance is desired.
Flat-slicing is primarily represented by plain slicing, the industry standard, due to its high processing speed, but lengthwise slicing may result in superior SL quality [
5]. Despite the apparent advantages in material yield and processing speeds offered by plain slicing, the slicing check defect poses a significant quality challenge. Slicing checks occur due to material compression ahead of the knife edge, resulting in tensile stresses surpassing wood strength perpendicular to the grain [
6]. Slicing check defect impacts mechanical [
5,
7], glue bond [
8,
9], and coating [
10] characteristics. Additionally, the slicing check defect is considered to influence the occurrence of surface-checking (SC) [
10,
11,
12].
The surface-checking (SC) defect appears on the surface of the veneer and SL-based products when subject to desorption, resulting in small but visible cracks [
10]. SC in solid wood and multi-layered wood products has been attributed to several phenomena: anisotropic shrinkage [
13,
14,
15,
16], drying gradient presence between the surface and a structure core [
12,
17,
18], and restricted shrinkage [
19,
20]. SC reduces customer value due to decreased surface aesthetics, smoothness, and in-service performance due to possible moisture intrusion and retention in the crack cavities [
21]. Moreover, no remedy is known for SC-affected products [
10]. Conclusively, the SC quality issue is a determinant of a relatively low industrial acceptance of the plain slicing technology and requires further studies to improve the knowledge of sliced lamellae’s influence on product characteristics.
Prior research has quantified veneer quality in relation to slicing check presence using parameters such as check depth ratio (CDR) and check frequency (CF) [
9,
11,
22,
23,
24,
25]. CDR was defined as the check depth relative to the nominal veneer thickness, while CF was defined as the number of checks per inspected material’s length. Slicing checks presence was proved independent of SL thickness [
23], and CDR was shown to increase with an increase in lamella thickness [
22], be somewhat independent of the lamella thickness [
23], or decrease with lamellae thickness [
24]. CDR and CF are usually positively correlated [
7].
Studies on SC evaluated variables such as slicing-checks side orientation [
12,
16,
26,
27], yielding mixed results. Oak SLs typically inherit a CDR higher than 50% [
10]; thus, a check-side-down orientation is recommended [
11,
27]. The adhesive type and veneer moisture content (MC) significantly influenced SC [
12]. Multi-factorial interactions were found for adhesive, slicing and core type, and slicing check side orientation [
26]. Slicing check measurements were typically conducted manually under a magnification lens [
11,
23] or automatically using image-based detection procedures [
22,
24,
25]. Similarly, SC has commonly been measured using manual detection under a magnification lens and SC counting [
12,
16]. More recently, digital image correlation (DIC) has proven helpful for in-situ observations of the occurring drying cracks [
28]. The method was adapted and developed to measure SC of finished veneer-based panels [
26,
28] and thick SL-based EWF [
29].
EWF can be categorized according to the thickness of the top layer into two main categories, i.e., parquet and veneer-based elements. A small percentage of wood flooring coverings also constitute single-layer solid wood flooring [
1]. EWF accounts for 82% of European flooring production [
1]. Parquet EWF elements have a cross-laminated structure where the top-layer lamella has a minimum thickness of 2.5 mm and is comprised of valuable hardwood species, mostly of oak (81.8%) and ash (
Fraxinus excelsior L.) (5.6%) species in Europe [
1]. Compared to veneer-based flooring, the intrinsic value of parquet structure is the potential for resurfacing through sanding and coating while in service.
A core of a parquet EWF element is commonly constructed using softwood species lamellae glued together lengthwise and pressed into a back-end structural veneer layer. Veneer-based EWF is usually constructed with a medium and high-density fiberboard and typically lacks a back-end layer.
During EWF production, different processes and variables significantly impact the performance of finished products, e.g., raw material characteristics, moisture content and processing environment, pressing parameters, coating methods, and substances. The adhesive type choice is a critical variable in EWF production as it impacts product performance, such as resistance to delamination, formaldehyde emissions, dimensional stability, and costs. However, an adhesive choice involves long-term high investment costs related to pressing equipment. Therefore, alternative adhesive types are less likely to be considered once an EWF production line has been established.
The presence of slicing checks is presumed to influence SC. Nevertheless, few studies, if any, have discussed the correlation between these two defects. Consequently, understanding the relationship between slicing checks characteristics and SC is critical for enabling the development of high-quality SL-based products. The objective of this study was to evaluate the influence of critical EWF construction parameters, SL thickness, and EWF core type on SC. Additionally, the study aimed to explore the potential correlation between known check properties, CDR, and SC of finished EWF elements. The goal is to provide insights into product characteristics influencing surface quality concerning SC occurrence.
2. Materials and Methods
This study investigated the impact of core type and top-layer lamellae thickness on SC during an induced sorption and desorption cycle, characteristic of indoor heated environments. The surface quality of EWF elements was assessed based on the calculated surface-checking index (CI), corresponding to the length measurement of independent SC, detected using a DIC procedure [
29].
2.1. Material and Sample Manufacturing
The study adhered to a randomized factorial design, with SL thickness and the core type as the independent factors and CI as the dependent variable. To evaluate the effect of SL thickness, SLs were produced at distinct levels between 1.5 mm and 4.5 mm at 1 mm intervals, i.e., 1.5, 2.5, 3.5, and 4.5 mm. The flooring elements produced with 1.5 and 2.5 mm SL would be categorized as veneer-based EWF, while those with 3.5 mm and 4.5 mm would be classified as parquet EWF elements [
30].
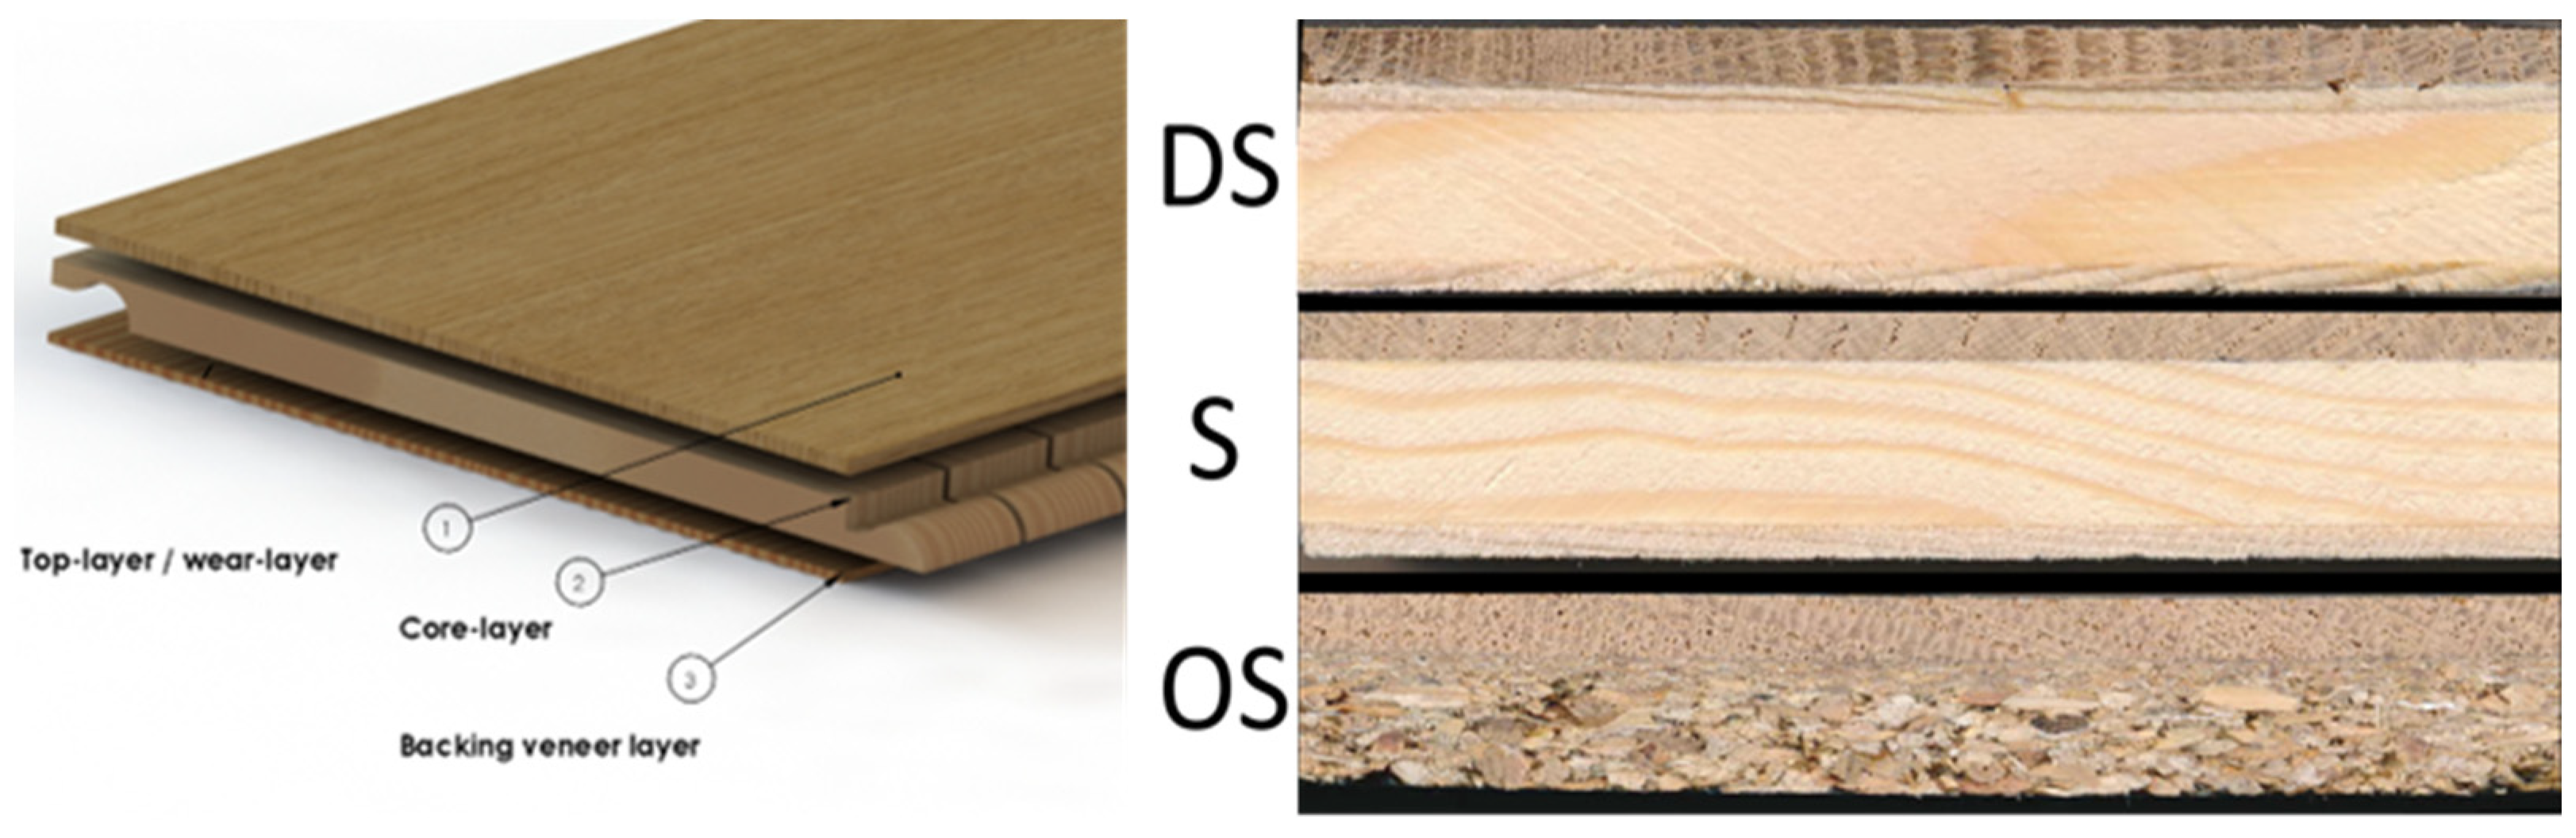
Three core types were considered for this study: a standard solid wood lamellae with a veneer back-end layer (S), a standard solid wood lamellae core with veneer back-end layers on the two sides (DS), and a single-layer oriented strand board (OS) (
Figure 1). The S-type cores were produced using softwood lamellae of approximate dimensions 190 × 32 × 10 mm glued-edgewise and pressed into a rotary-cut softwood veneer of 2 mm thickness. DS cores bear similarities to the S-cores, except a veneer layer is pressed on both sides of the solid wood lamellae core (
Figure 1). DS and S-cores were provided by a local flooring producer. The OS core represented a non-standard core type and was selected as a cost-effective and sustainable alternative owing to its potential for incorporating reclaimed wood. The S and OS cores had a total thickness of 12 mm, while the DS cores had a 14 mm nominal thickness. Four thickness levels and the three core types resulted in twelve distinct combinations repeated on four specimens, which resulted in 48 testing specimens.
The material used in this study comprised plain sliced oak (Quercus robur L. and Quercus petraea (Matt). Liebl.) lamellae. The inability to differentiate between species is attributable to the material selection, performed on sawn timber slabs. Both species are deemed to have equivalent material properties and commercial value. SL were produced from 32 sawn slabs with the nominal dimensions 2500 × 210 × 85 mm. Slabs were plasticized by water-soaking at 90 °C for 58 h. Lamellae slicing was performed on industrial vertical slicers with a proprietary operator knowledge of optimal parameters given the raw material characteristics and output thicknesses, e.g., knife-edge recession, adjusted gap, lead, pressure and cutting speed. The SLs of 1.5 mm thickness were cut on a Cremona VS vertical slicer, where slabs were fixed using a vacuum table. A Babcock-BSH vertical slicer was used to slice SLs with thicknesses of 2.5, 3.5, and 4.5 mm. The knife angle was constant for both slicing equipment using a slicing knife with an 18° bevel angle.
Drying procedures varied depending on SL thickness: SL of 1.5 and 2.5 mm were dried using conveyor-belt dryers at 80 °C for 8 and 13 min, respectively, whereas those of 3.5 and 4.5 mm thickness were initially seasoned indoors for 48 h, followed by conventional kiln drying for approximately four (3.5 mm thick SLs) and six (4.5 mm thick SLs) days at 40 °C. The targeted MC was 6.5%, hence, after the transportation to the laboratory storage, the 1.5 and 2.5 mm SLs had an MC range of 5.4%–6.8%, while 3.5 and 4.5 mm thick SLs had an MC range of 8.2%–8.6%. After drying, the SLs were stored at 21 °C and 65% relative humidity (RH) preceding specimen manufacturing.
The testing material was selected from the central part of the sliced flitch, with a random selection of one or two SLs per flitch. The selected SLs had a density of 703.7 ± 35.6 kg/m3, measured at 12% equilibrium MC. The SLs and cores were conditioned at 21 °C and 40% RH condition for one and two weeks, respectively, corresponding to an SL-measured MC of 6.7%. The production environment was approximately 20% RH and 21 °C.
Pressing of SLs onto the cores employed a two-component urea-formaldehyde adhesive (Akzo Nobel 1274, Akzo Nobel 2545), common to flooring production with a solid content of 67%–70%. To adequately cover the entire surface, different adhesive consumption rates were necessitated for the three core substrates, i.e., 140 g/m2 for the OS core, 170 g/m2 for the S-core, and 210 g/m2 for the DS-core. The different adhesive consumption rates are attributable to various surface roughness among the three substrates, i.e., oriented strandboard, solid wood, and veneer. The EWF elements were pressed during the same day, with four EWF elements being prepared and pressed at once following the combination grouping. Pressing was performed using a hydraulic veneer press at 90 °C, pressure of 6 MPa/m2 and pressing time of 5–10 min depending on the top-layer thickness and according to adhesive manufacturer recommendations. During sample handling, one S-core was destroyed (combined with 1.5 mm thick SL), reducing the full-length EWF elements to 47. After pressing, EWF elements were edge-trimmed, holes were filled with wood putty, and thickness was measured to ensure proper sanding thickness. Sanding thickness was 1 mm from the top surface and was achieved using a three-roller belt sander equipped with a 100, 120, and 180 grit size through two passes. After sanding, EWF elements were stored for at least one week at the storing climate of 21 °C and 65% RH until DIC pattern application.
The DIC pattern application used a spray gun, ensuring uniformity and compliance with the desired speckle size. An acrylic-based matte-finish paint, typical for indoor wood products, was used for both background (white) and speckles (black). The paint coating was assumed to have a similar effect to the missing lacquer layer in EWF products. The two coating layers were applied within a 24-h interim period. After the DIC pattern application, the EWF elements were returned to the storing climate for at least one week before testing. Constraints related to the climate chamber size, DIC system (the optical system and the pattern resolution), and relatively long test period necessitated the use of smaller EWF specimens than the full-length elements. Consequently, EWF specimens with a nominal size of 180 × 180 mm were extracted from the central part of the full-length EWF elements prior to test beginning.
2.2. Testing Procedures
The testing procedures involved exposing the EWF specimens to an accelerated, yet realistic, sorption and desorption cycle, characteristic of heated indoor environments. For each test run, six specimens were affixed to a polycarbonate plate to reduce free deformations using an ethylene-vinyl acetate hot-melt glue, and were edge-coated with a silicon layer and wrapped in plastic foil to restrict moisture flow to the top surface. Extreme cupping was observed during preliminary tests for the OS core specimens. Hence, gluing down the specimens was visually assessed to reduce deformations and possible bias due to out-of-plane displacements.
Subsequently, the specimens underwent a humid exposure at 85% RH at 21 °C for at least 48 h. Specimens were then swiftly transferred to a dry climate of 20% RH and 30 °C for the DIC acquisition during 48 h [
29].
The optical system consisted of a single DMK 33GX183 camera equipped with a Fujinon CF25ZA-1S 23MP 25 mm focal length lens at f/1.8. For illumination, an SVL R80 ring light was used. The working distance was 1.11 m, resulting in a surface resolution of 8.9 pixels/mm. DIC acquisition was enabled for the entire duration of the desorption cycle with one-hour intervals between frames.
DIC Analysis
DIC analysis was performed using the 2D augmented Lagrangian digital image correlation (ALDIC) [
31,
32]. Displacements and strains were calculated using the finite difference method. The strain was computed for the infinitesimal strain type. Post-processing parameters, i.e., subset size and step, were selected based on incremental changes and validation measurements for visible under microscope SC, based on the findings in [
29].
Full-field strain data in the direction perpendicular to the SC length orientation was processed into binary objects using a strain peak threshold of 1.5%. Small (narrow) and late-emerging SC could be detected positively at this strain rate. The output of the SC was assigned as a checking index (
CI). The CI was determined regarding the total length of checks (
CL in m) over an inspected area (
A in m
2, in Equation (1)) [
29].
2.3. Statistical Analysis
Testing results indicate that a significant portion of the specimens exhibited no or extremely low detectable SC. Namely, data indicated right-skewed and zero-inflated distribution, similar to checking density measurements in veneered panels [
26]. One way to characterize non-normally distributed data may employ a Tweedie compound Poisson distribution [
26,
33]. The number of checks (
N) represented a Poisson distributed random variable while the length of the individual check (
Yi) is the Gamma random variable [
26,
33]. The
CIt, the total length of observed checks of an EWF specimen at a specific stage, was defined as:
CI data represented the highest
CIt value obtained within the 48-h desorption cycle. Subsequently, a general linear model was fitted, studying fixed effects of the main variables, SL thickness and core type, and the interaction between the two factors. A drawback of a compound distribution, such as Tweedie compound Poisson, is the impossibility of the normalizing quantity to be analytically tractable and its density to be expressed in a closed form [
33]. Therefore, bootstrapping was used to estimate the given variable combinations’ point estimates and confidence intervals. The bootstrap method is a statistical resampling technique used to estimate the sampling distribution of a statistical model by randomly sampling the data with replacement to create multiple bootstrap samples [
34]. The statistic of interest is calculated from each bootstrap sample, and the resulting distribution can be used to estimate confidence intervals, standard errors, or test hypotheses. This process is repeated in a large number, e.g., 9999 in this study.
Statistical analysis was performed in R (version 4.0) with RStudio (version 2023.03.0) using the cplm package (version 0.7-11) that uses the Tweedie compound Poisson distribution (R Foundation for Statistical Computing, Vienna, Austria) [
33]. Confidence intervals were calculated using the boot package, similar to the procedure described in [
35].
3. Results
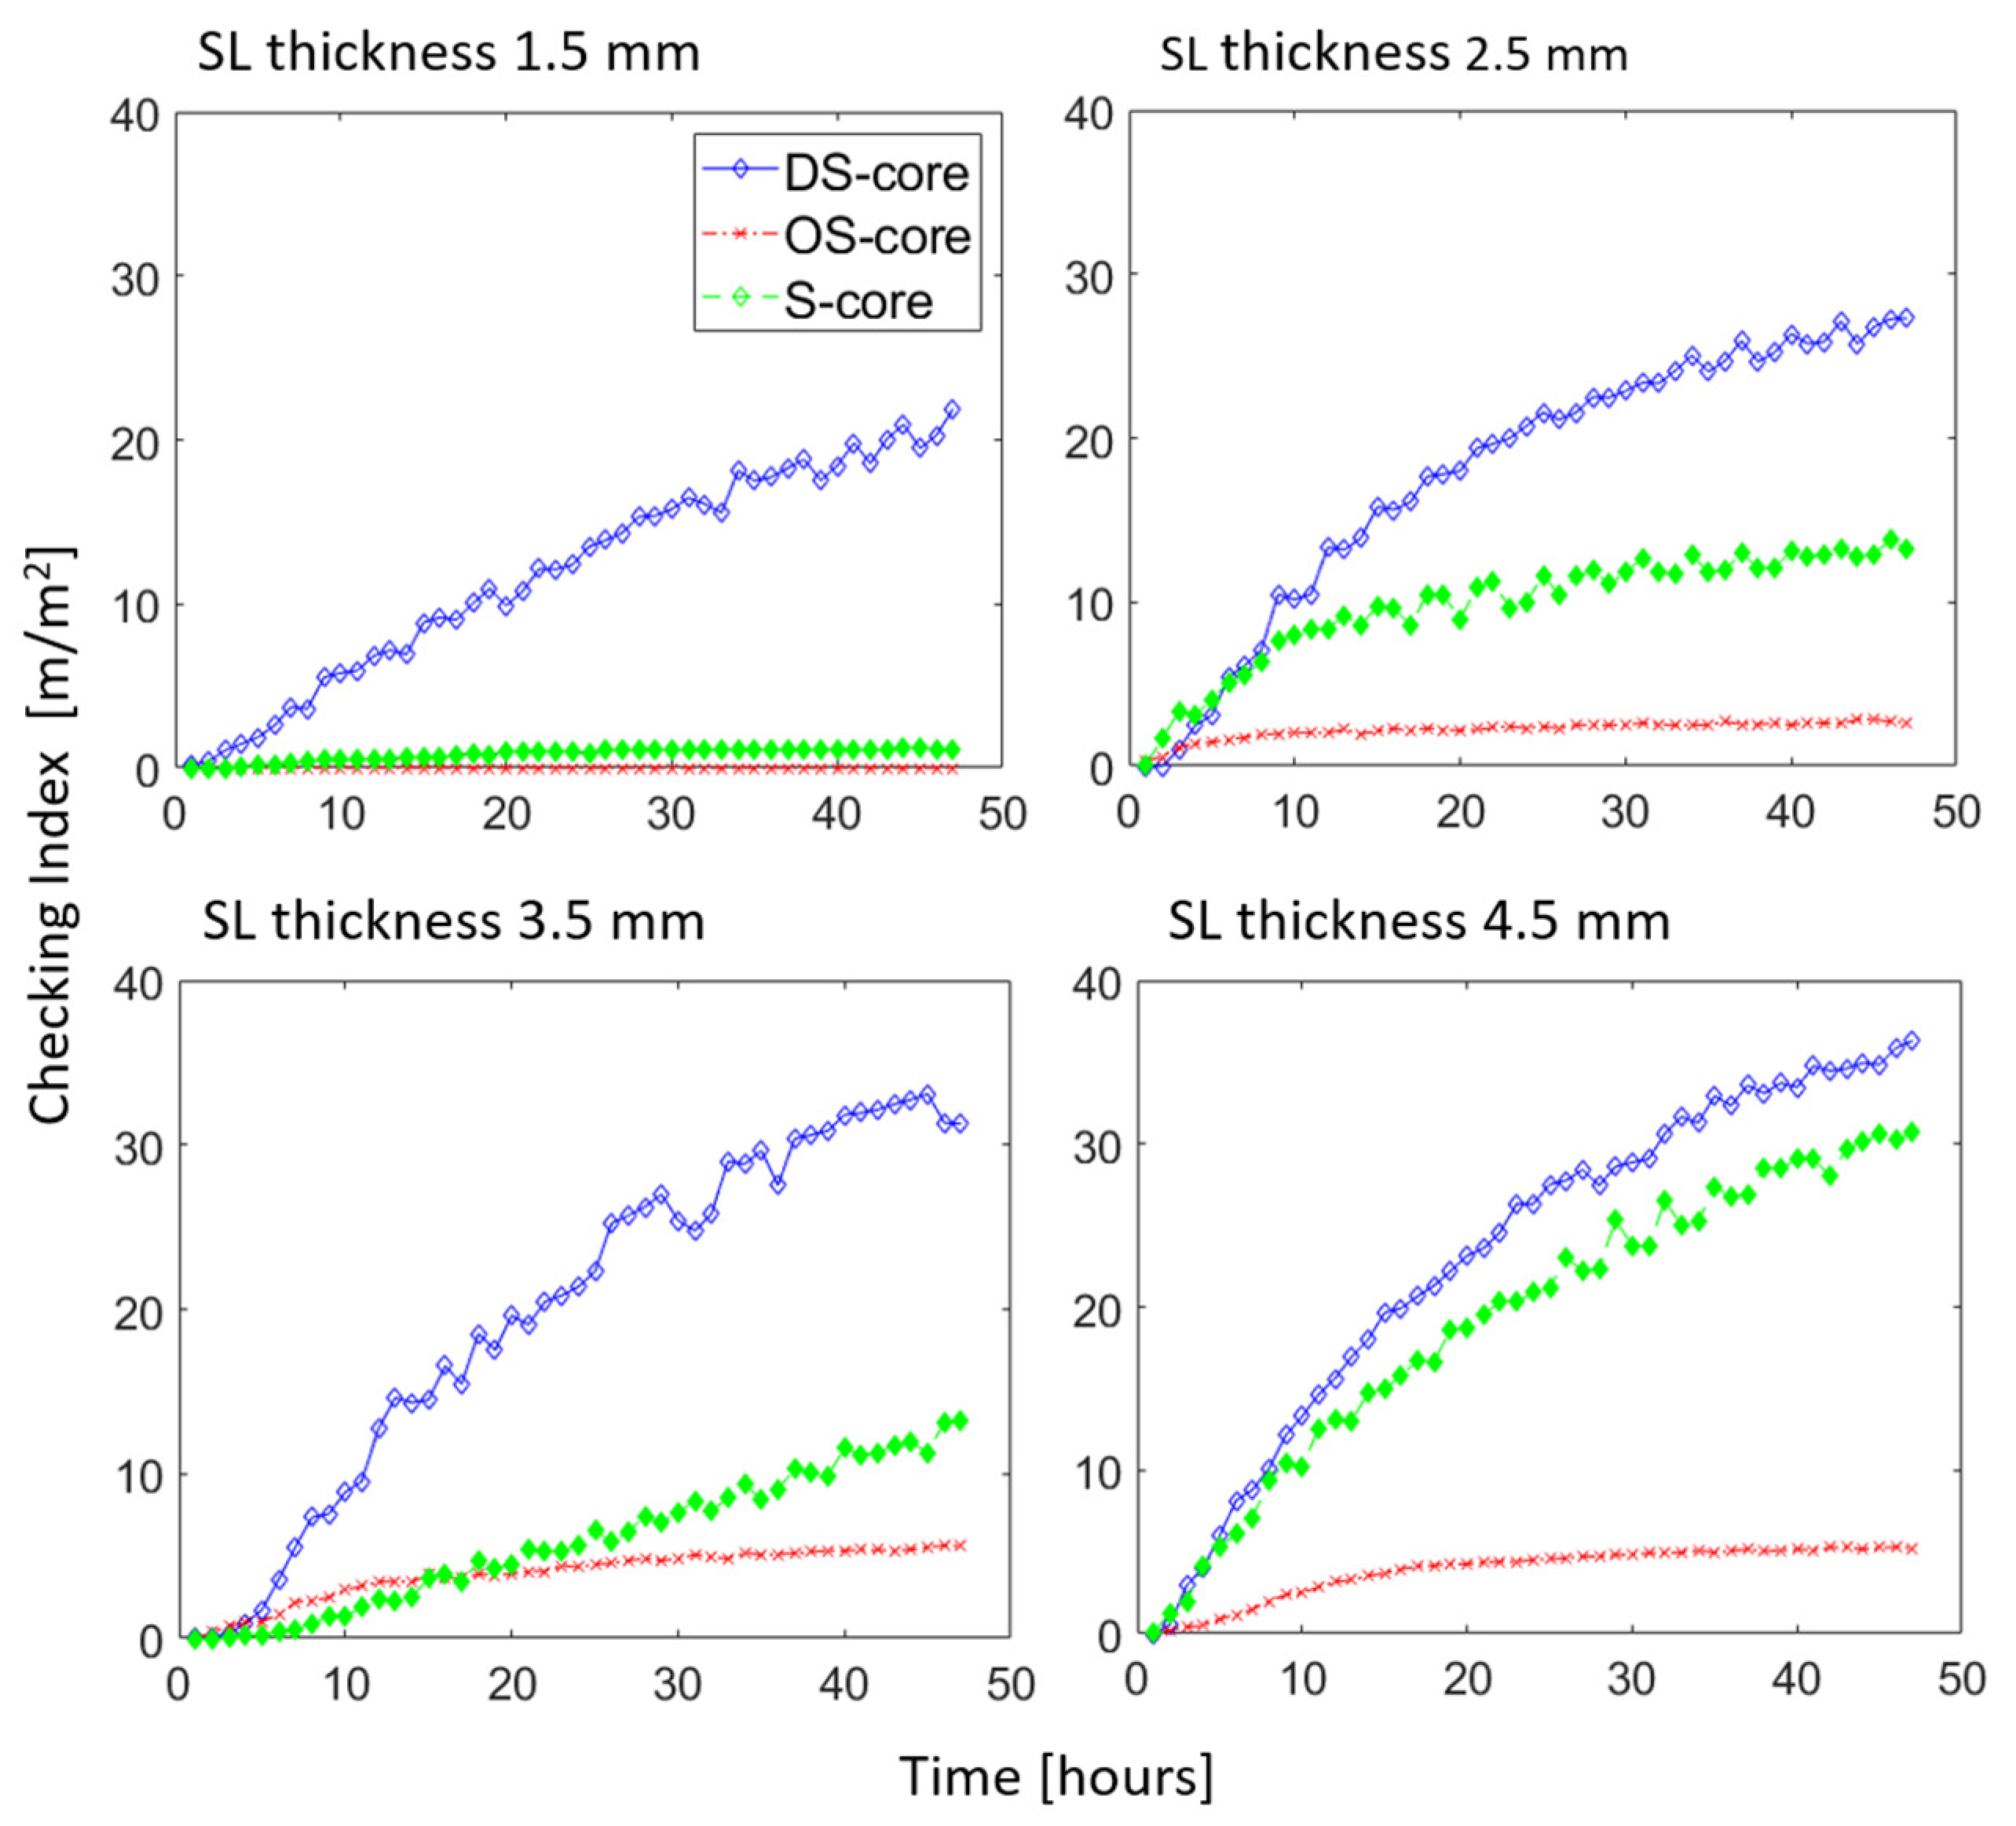
The SC was detectable on the tested EWF specimens, particularly toward the end of the 48-h desorption cycle. While the CI is anticipated to increase beyond the examined timeframe, the slope of the CI progression may provide insights into long-term SC behavior. The progression of CI during the desorption phase is illustrated in
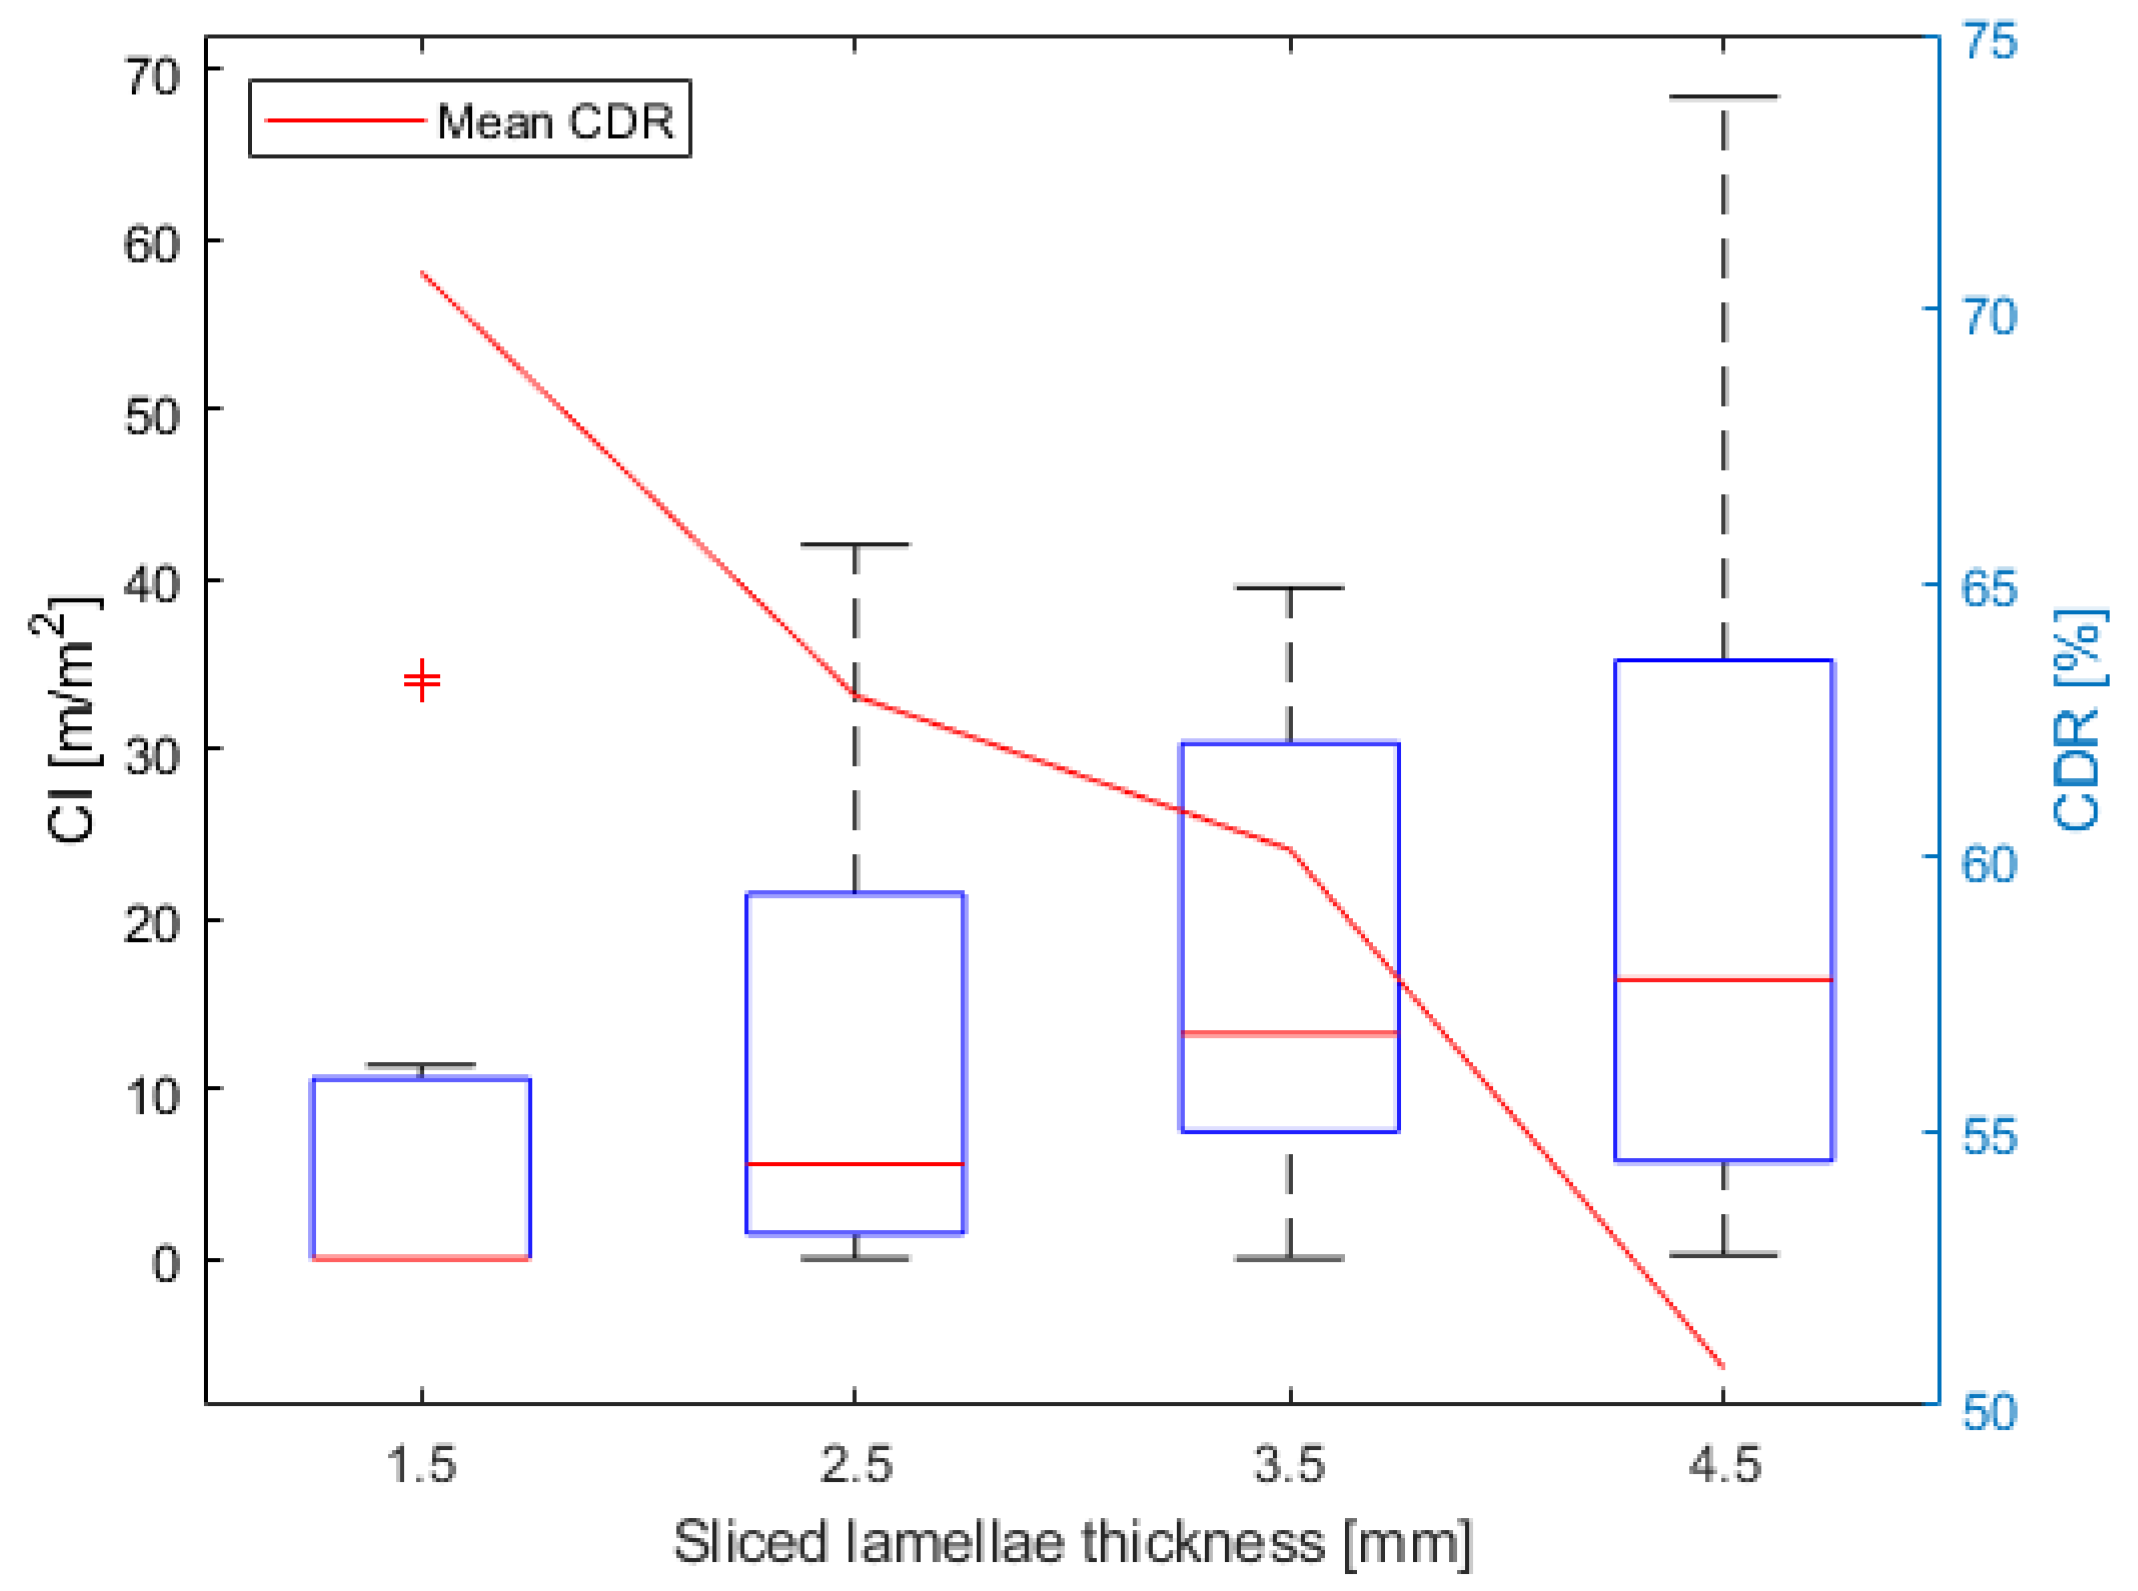
Figure 2. The steepest CI increase was observed on specimens with DS-core type, while OS core specimens exhibited negligible or no SC. CI distribution grouped per SL thickness may indicate a slight positive correlation between SL thickness and CI (
Figure 3). CDR measurements exhibited a slight decrease from approximately 70% for SLs with 1.5 mm thickness to about 51% for SLs with a 4.5 mm thickness (
Figure 3). Consequently, it can be observed that SL’s CDR did not impact CI.
A low CI was characteristic for specimens with S-cores with 1.5- and 2.5 mm thick SL and for the OS core specimens, i.e., below 10 m/m
−2 (
Table 1). The highest SC was recorded for specimens with 4.5 mm thick SLs for both S and DS cores. For these combinations, relatively large CI variations were observed, such as 4.6 to 68.4 m/m
−2 CI for the specimens of S-core and 4.5 mm thick SLs.
The generalized linear model fit was assessed by comparing estimated and observed CI values (
Table 1). The measured CI fell outside the 95% confidence interval for one treatment, which comprised null values for all four replicates (OS core and 1.5 mm thick SLs).
The general linear model overview, which reflects the influences of SL thickness and core type on CI, is shown in
Table 2. Although the core type was assessed to be significant at a probability level Pr < 0.001 (
Table 2, TypeS, TypeOS), the model unveiled a significant S-type core and thickness interaction (
Table 2, TypeS:Thickness), thus complicating the interpretation of individual factors.
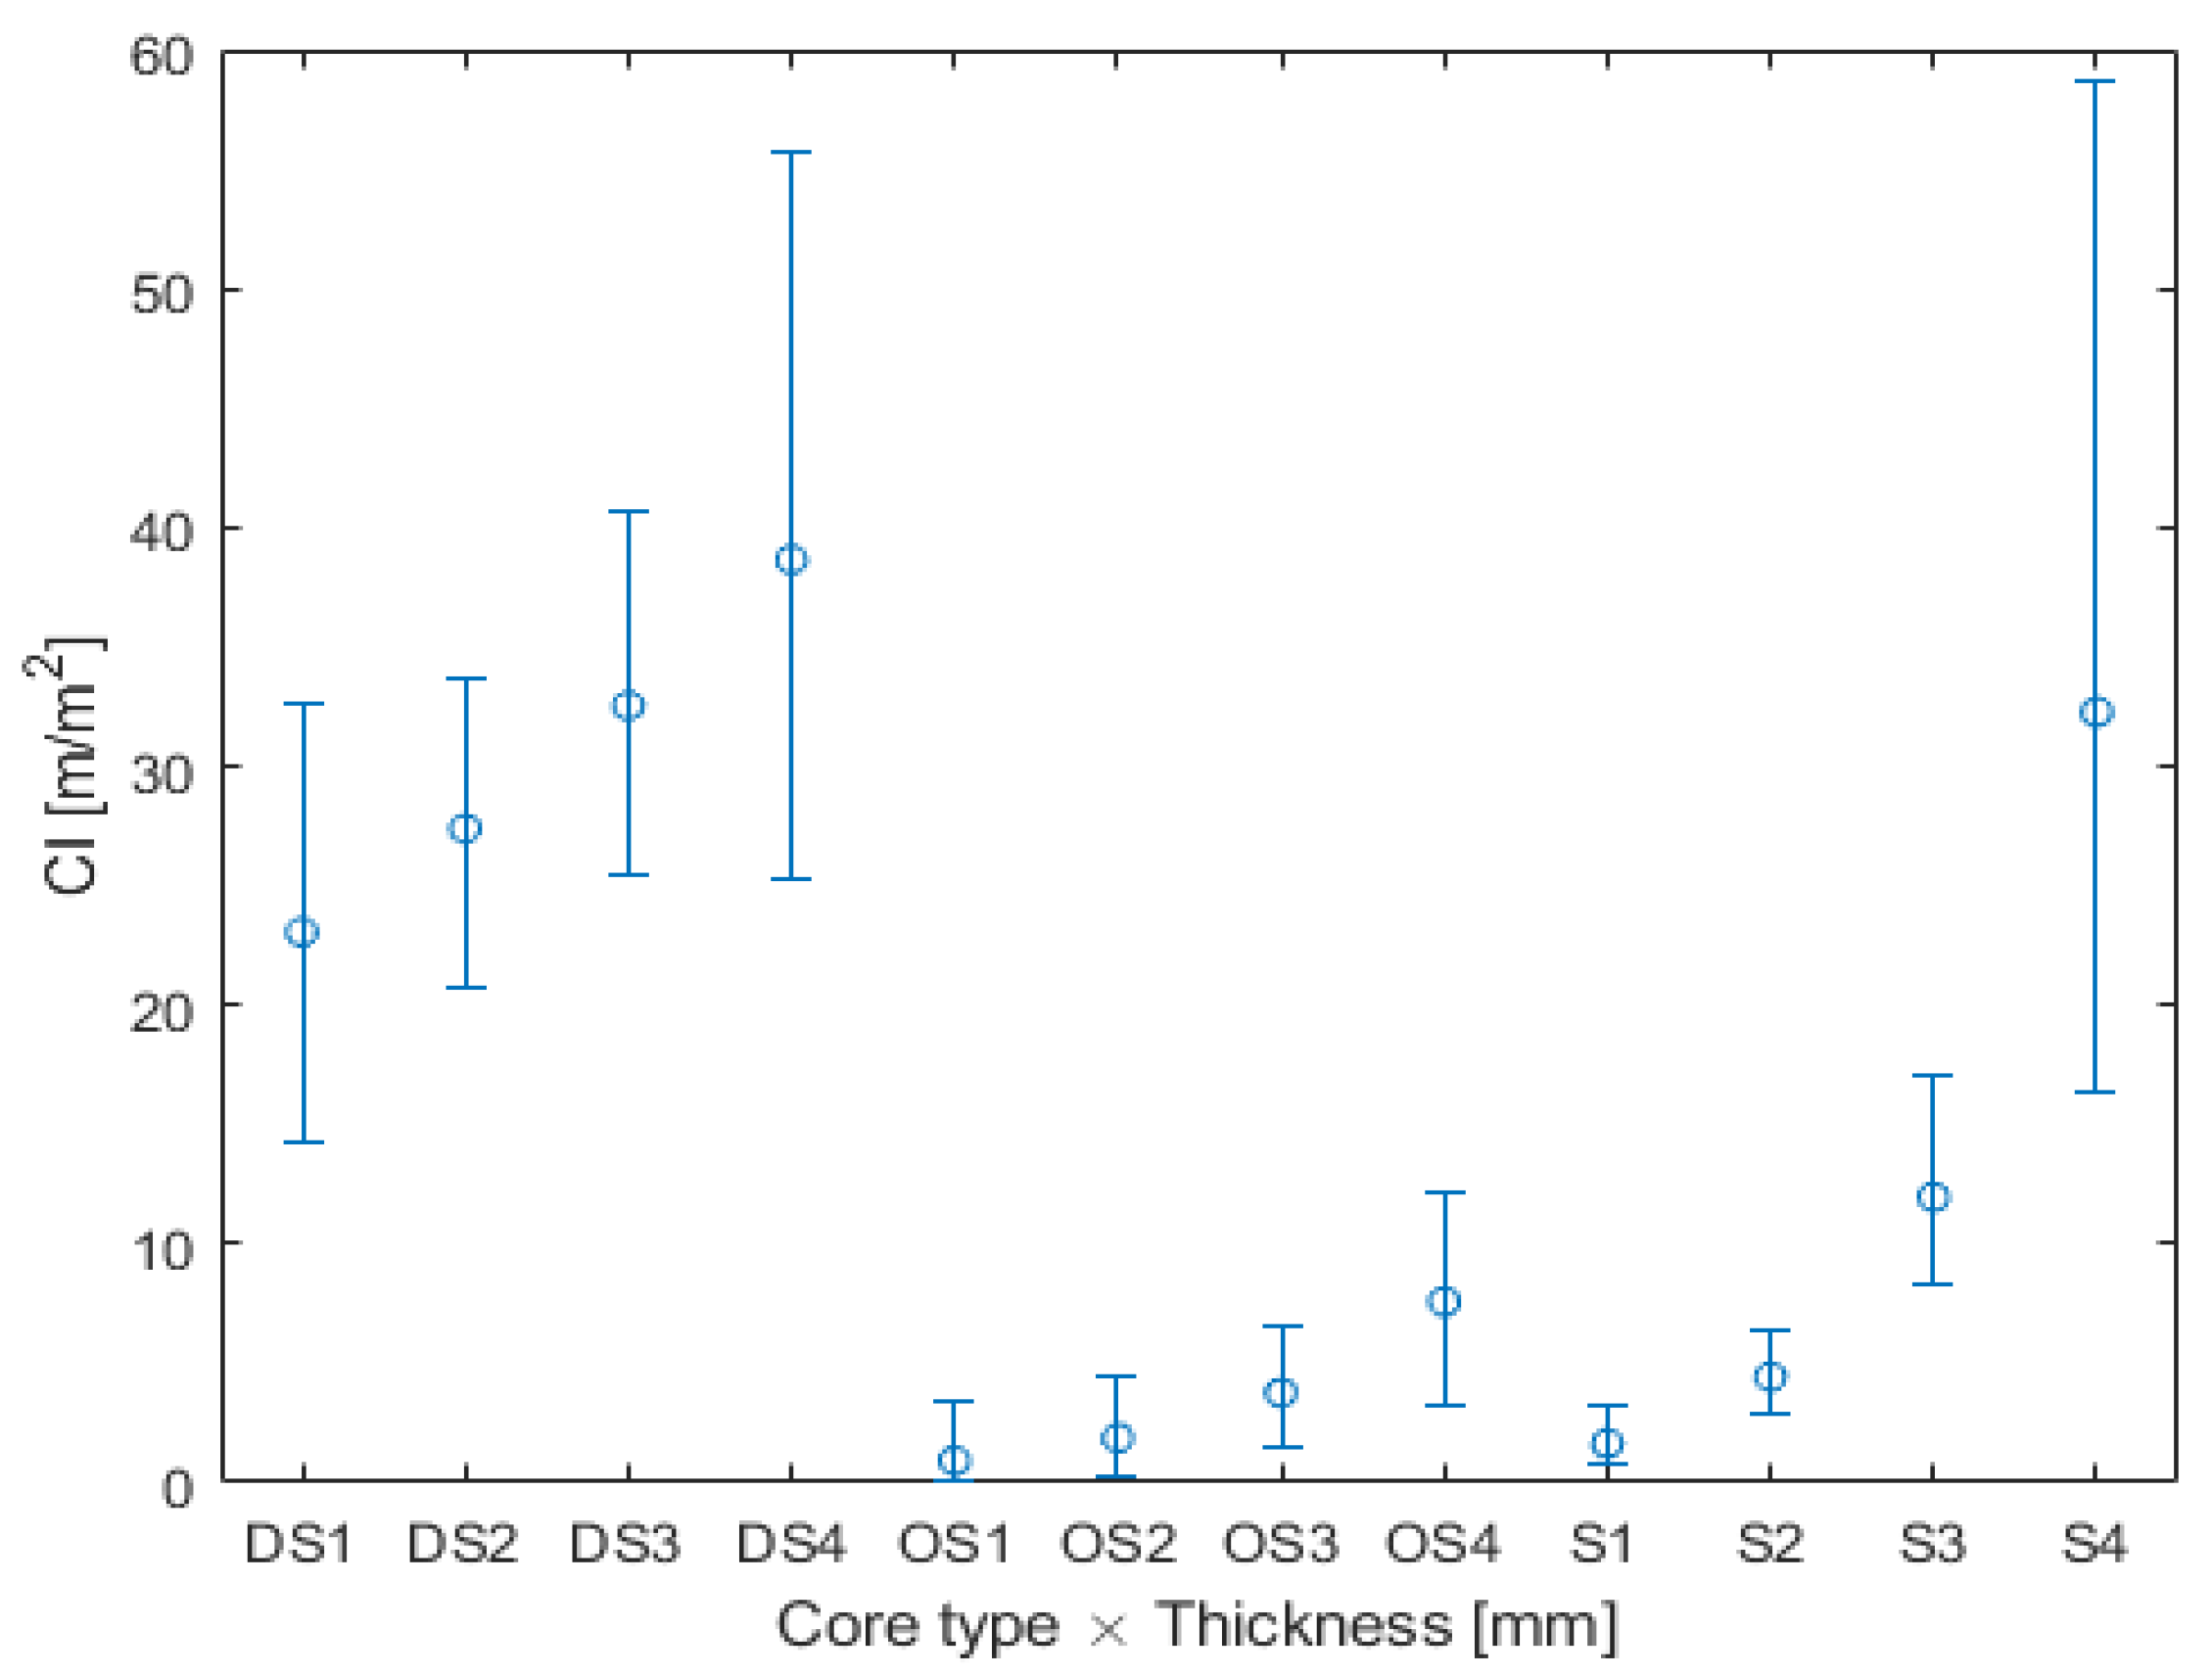
Figure 4 illustrates the estimated CI values and 95% confidence intervals for the investigated factorial combinations. While not statistically significant, model estimates indicate a positive correlation between SL thickness and CI across all considered core types.
4. Discussion
Customer complaints concerning SC of SL-based products are more likely with an increased SC [
26]. The occurrence of null CI in only one of the twelve combinations (OS core × 1.5 mm SL thickness) underscores the need to consider the SC defect when using SL in product realization. The selected EWF construction factors and their levels resulted in a pronounced CI variability, ranging from 0 to 68.36 m/m
−2.
Significant CI variation was attributable to the core type (
Table 2, TypeS, TypeOS). The DS-core specimens exhibited high SC (mean CI of 30.4 m/m
−2), while OS core specimens had a low CI outcome (3.49 m/m
−2 mean value). The low SC in the OS core specimens may be attributed to a low deformation restraint due to similar deformation vectors between the core and surface due to the two layers’ parallel wood grain orientation. Conversely, in dimensionally stable cores, such as DS and S, the outer layers’ wood grain direction is perpendicular to the core layer’s, resulting in inter-ply shrinking vector differences impacting restrained shrinking.
Another potential explanation for various SC may relate to a core type-derived factor not encompassed by the experimental design, namely adhesive consumption. For DS-core specimens (veneer top surface), the adhesive consumption was approximately 50% higher than in the OS core specimens due to subsurface adhesive penetration. This aspect altered the sub-surface properties, assumingly affecting the moisture gradient during the desorption phase. With increasing glue bond thickness, a reduction in moisture flow and a steep moisture gradient is expected [
36]. A moisture gradient is generally assumed to induce residual tensile stresses in the top-lamella surface and cause the SC defect.
The significance of the interaction between studied factors is likely attributable to a steep CI increase concurrent with an increase in SL thickness for S-type core specimens. A potential explanation for this behavior may relate to the warping-balancing effect within a multi-layered structure [
15]. For the S-core specimens, a low top-layer thickness resulted in the outer (SL) and inner (back-end veneer) layers being in a dimensionally balanced state [
15]. As the top layer thickness increases, the structure balance diminishes, and the top layer’s anisotropic shrinkage and inter-ply shrinkage restrain influence SC. A low top-layer thickness was also identified to contribute to low warping [
17]. In the case of DS-core specimens, the four-ply structure is considered unbalanced, which may have accounted for the high SC occurrence.
The results of CI and slicing checks, characterized by CDR results, indicate a lack of interpretable correlation between the two measures. The assumption that an unchecked wood layer beneath an EWF surface would decrease the SC was dismissed. However, results might be influenced by non-homogenous slicing check characteristics along SL, restrained specimen size, and error variance of the two inspection methods.
Practical implications of the findings relate to CI results for EWF specimens constructed using low-thickness SL in combination with standard solid wood lamellae cores. A low SL thickness has a significant positive impact on the material yield and drying efficiency. The primary drawback of such an EWF structure represents a limited possibility of resurfacing (sanding and finishing after installation). Full-length EWF elements and longer-duration climate exposure would be required to validate these findings.
The tested variables of this study could be further expanded to gain a complete understanding of the SC phenomenon. For instance, concerning the core type, commonly used veneer EWF cores, such as medium and high-density fiberboards, should be evaluated in subsequent studies. Regarding SL thickness, a lower thickness increment is deemed to be critical for product design optimization procedures. The glue bond characteristics, influenced by adhesive consumption and its properties, are also presumed to impact SC significantly and should be further evaluated in a more controlled experimental design.


