
Landscape Health Assessment of Suburban Forest Park: A Case Study Based on Multiple Sampling Units and Functional Characteristics


Abstract
:1. Introduction
2. Materials and Methods
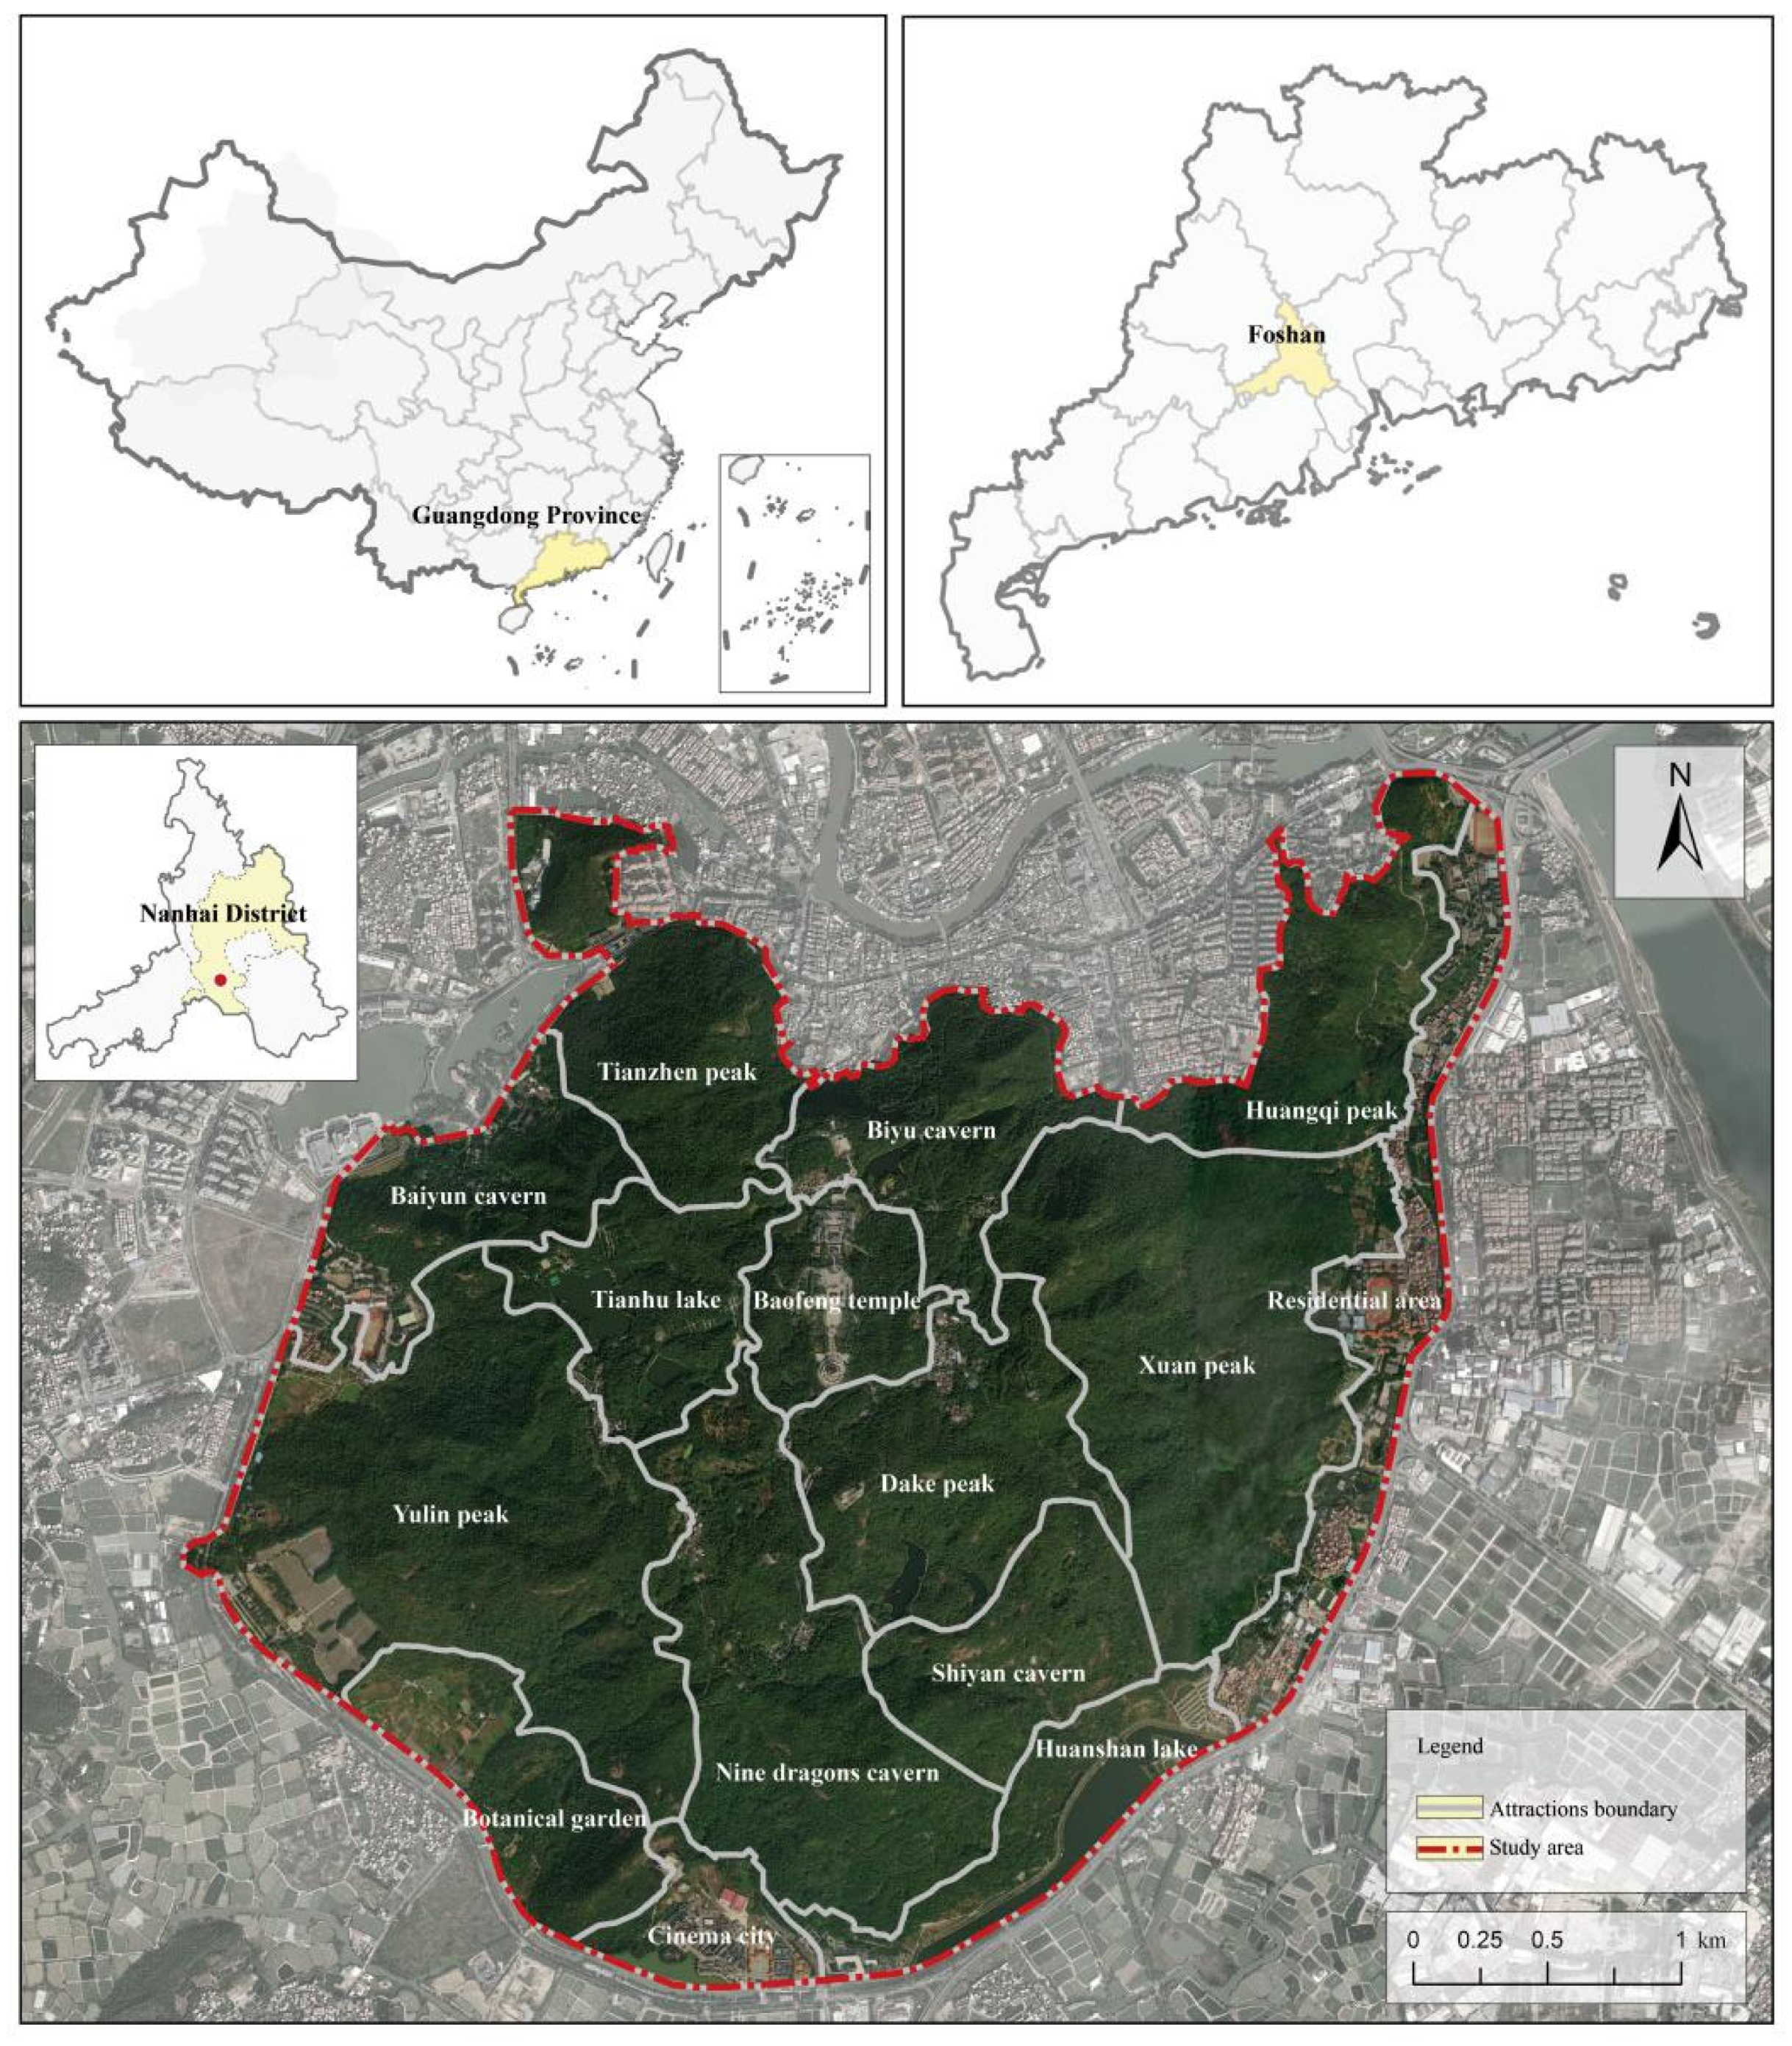
2.1. Study Area
2.2. Data Sources
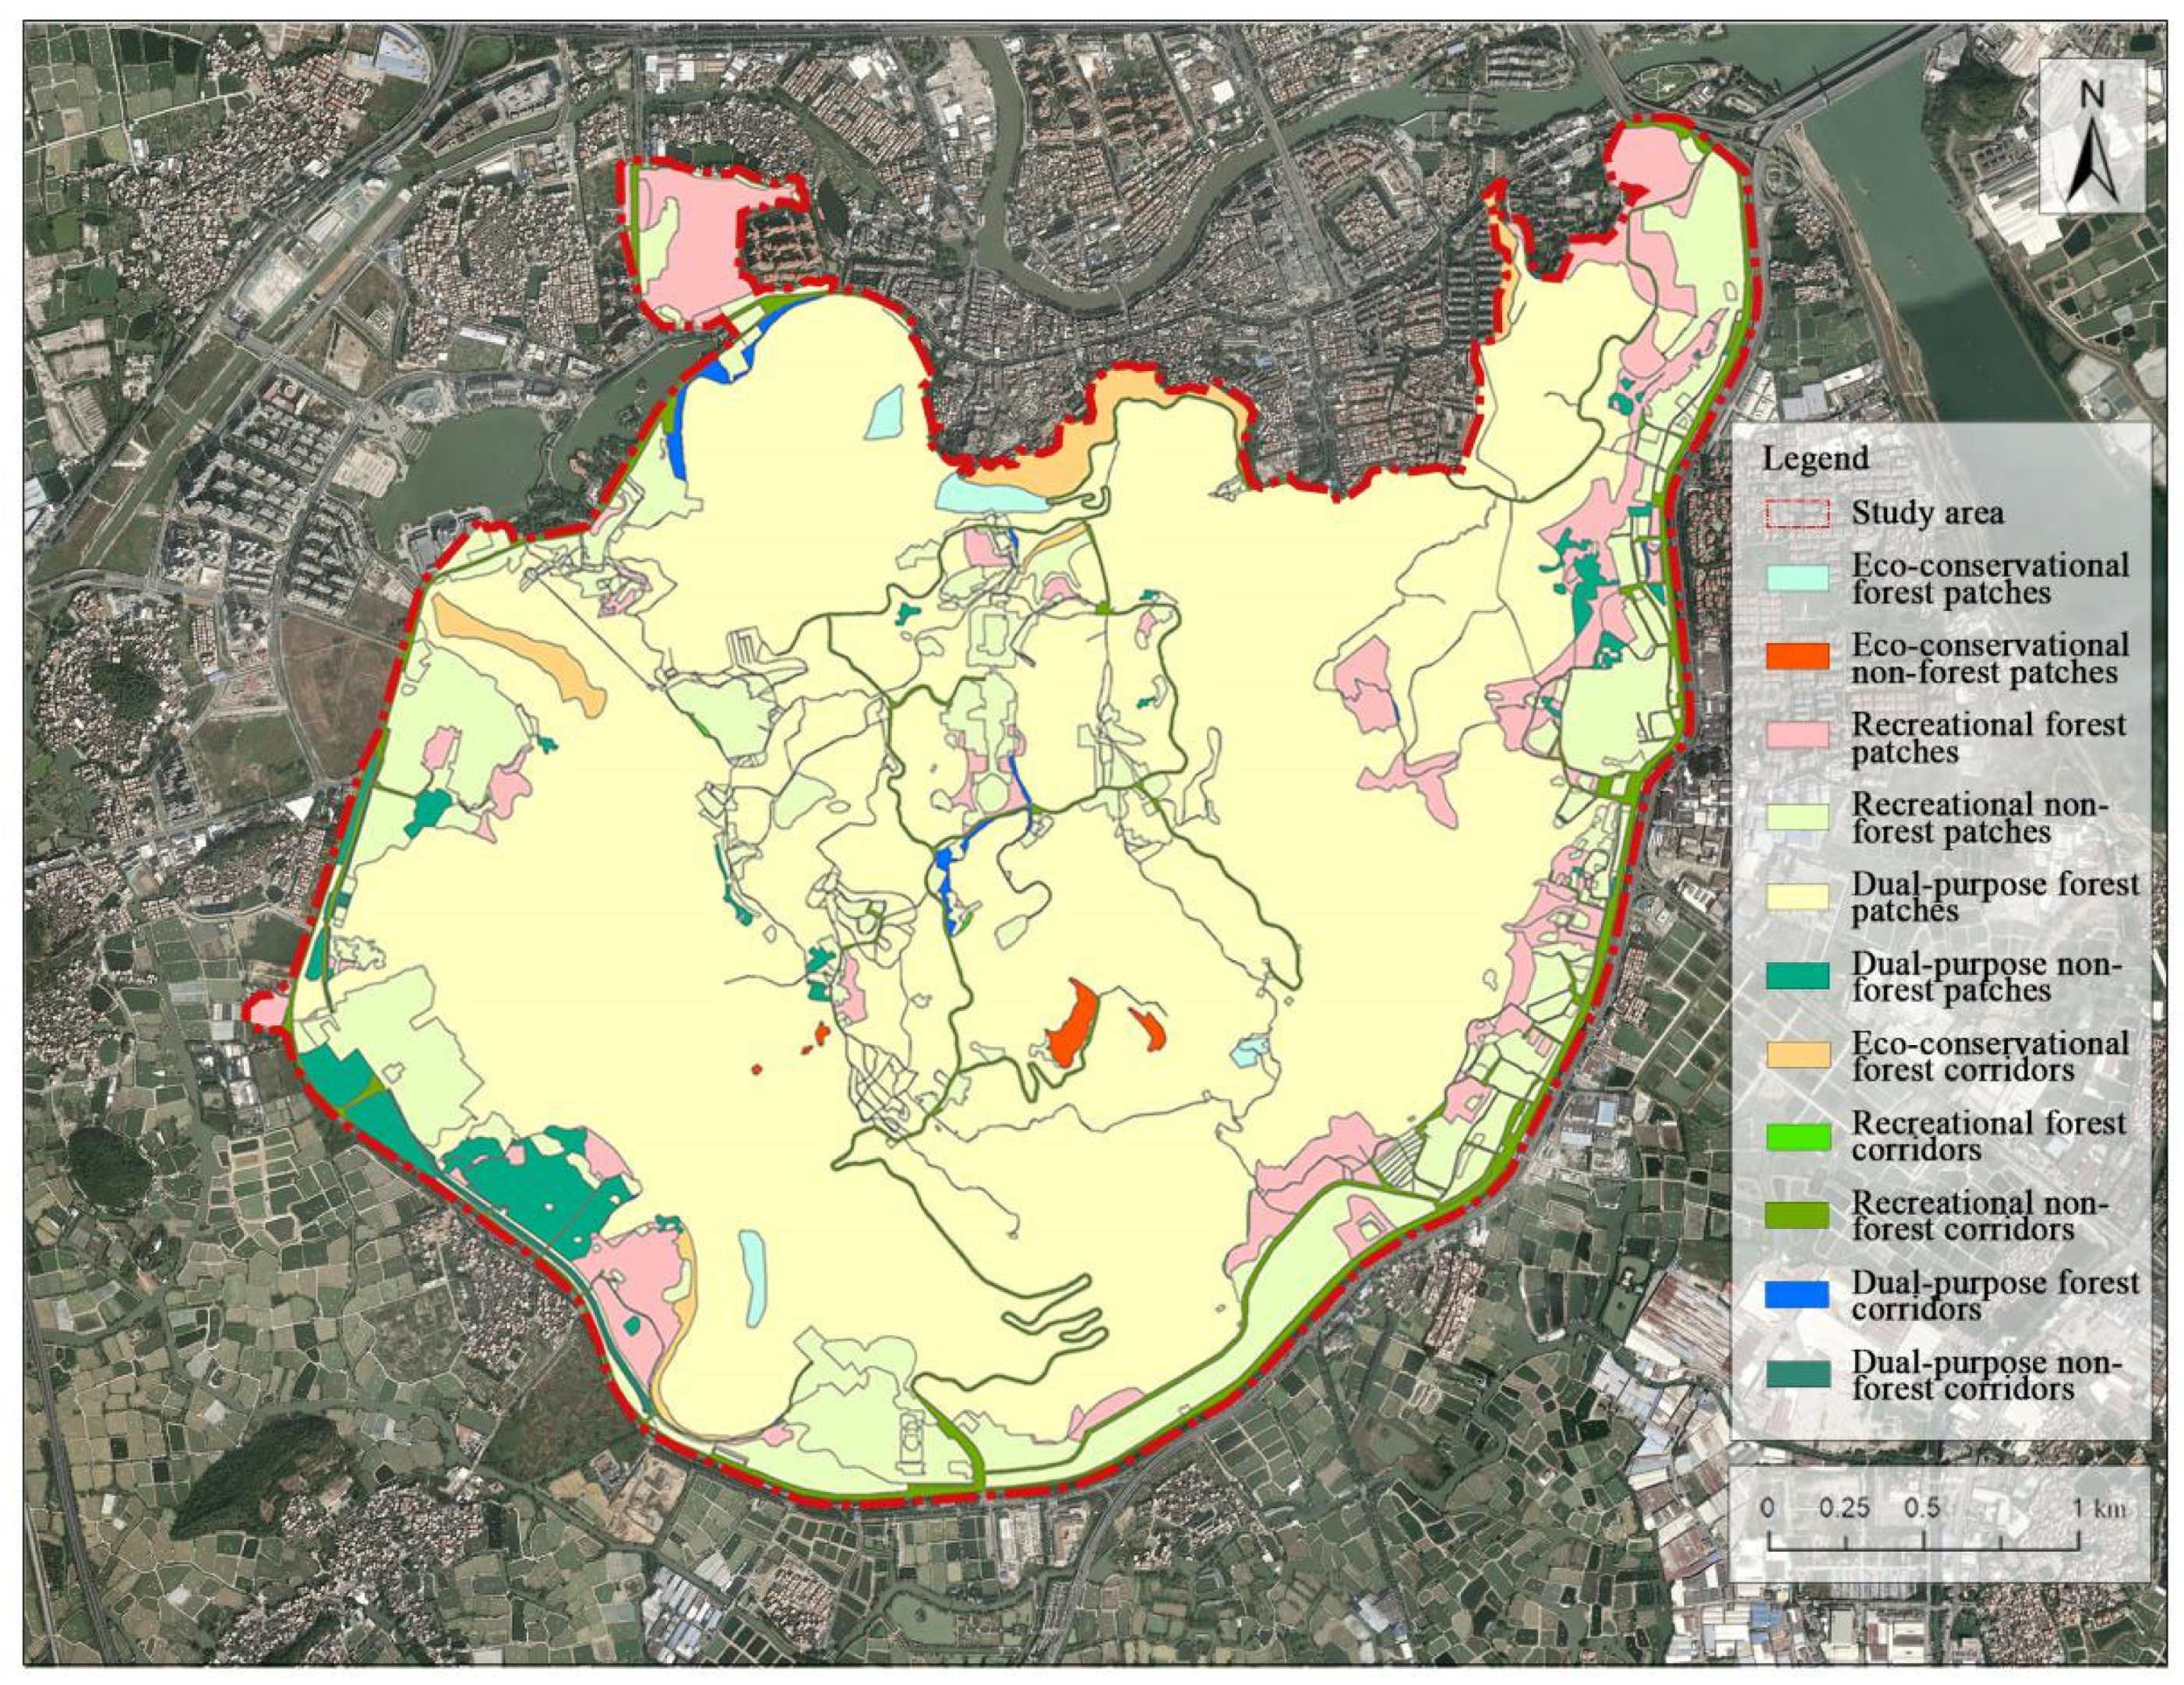
2.3. Landscape Classification
2.4. Landscape Function Classification
2.5. Index System and Methods to Evaluate Landscape Health
2.6. Methods to Comprehensively Evaluate Landscape Health
2.6.1. Determination of Index Weights
2.6.2. Landscape Health Assessment
2.7. Method Framework
3. Results
3.1. Spatial Distribution Characteristics of Landscape Health
3.2. Landscape Health Disparity Analysis
3.3. The Relationship between Landscape Health and Internal Landscape Factors in Forests
4. Discussion
4.1. Spatial Distribution of Landscape Health in Xiqiao Mountain National Forest Park under Multiple Sampling Units and Functions
4.2. Effect of Varying Sampling Unit Sizes on the Landscape Health of Xiqiao Mountain National Forest Park under Multi-Functions
4.3. The Relationship between Landscape Health and Interior Landscape Factors within the Forest in Xiqiao Mountain National Forest Park with Multiple Sampling Units and Functions
4.4. Limitations and Future Research
5. Conclusions
Author Contributions
Funding
Data Availability Statement
Conflicts of Interest
Appendix A

| Number | Primary Classification | Secondary Classification | Description |
|---|---|---|---|
| 1 | Farmland | Farmland | Farmland dedicated to the cultivation of water-dependent crops, such as rice and lotus. In addition, this includes areas in which the practice of crop rotation between water-based and dryland crops, and cultivated land that relies on artificial irrigation for the cultivation of dryland crops, including vegetables. |
| 2 | Grassland | Grassland | Artificially planted grassland with a tree canopy density of <0.1, intended for scenic viewing or recreational relaxation, and barren grassland with a tree canopy density of <0.1, characterized by a soil surface and the growth of various weeds. |
| 3 | Water body | Water body | Natural or artificially excavated rivers, lakes, ponds, as well as artificially constructed ditches used for water diversion, drainage, and irrigation. |
| 4 | Protective forest | Protective forest | A forest primarily designed to preserve soil, prevent wind and sand erosion, conserve water sources, regulate climate, reduce pollution, and improve the ecological environment and human production and living conditions. |
| Timber forest | A forest primarily intended for the production of timber and wood fiber. | ||
| No-timber forest | A forest primarily intended for the production of non-timber forest products such as fruits, edible oilseeds, beverages, spices, industrial raw materials, and medicinal plants. | ||
| Scenic forest | A forest primarily intended for aesthetic purposes, providing opportunities for people to relax, play, and enjoy natural scenery. | ||
| 5 | Construction land | Square land | A public space primarily intended for recreational activities, fitness, commemoration, gatherings, and refuge. |
| Built-up land | Refers to residential homes as well as buildings such as restaurants and hotels. | ||
| Landscape and management facility | Refers to leisure landscape facilities such as pavilions, walkways, and pergolas in forest parks, as well as management and service facilities such as restrooms, dining establishments, convenience stores, and visitor centers. | ||
| Special land | Refers to land designated specifically for military purposes, religious activities, or burial sites. | ||
| Road | Mainly refers to roadways for vehicles and pedestrian walkways. |
| Functional Attributes | Evaluation Indicators | 18 m × 18 m Basic Sampling Unit | 36 m × 36 m Basic Sampling Unit | 54 m × 54 m Basic Sampling Unit | |||
|---|---|---|---|---|---|---|---|
| Entropy Value | Weight | Entropy Value | Weight | Entropy Value | Weight | ||
| Eco-conservation function | X1 | 0.87 | 16.36% | 0.86 | 14.14% | 0.83 | 13.99% |
| X2 | 0.84 | 20.55% | 0.80 | 20.57% | 0.77 | 18.48% | |
| X3 | 1.00 | 0.12% | 0.98 | 2.40% | 0.97 | 2.31% | |
| X4 | 0.84 | 20.53% | 0.79 | 20.71% | 0.76 | 18.99% | |
| X5 | 0.84 | 20.55% | 0.80 | 20.57% | 0.77 | 18.52% | |
| X6 | 0.99 | 0.85% | 0.99 | 1.18% | 0.94 | 4.64% | |
| X7 | 0.99 | 1.56% | 0.98 | 2.39% | 1.00 | 0.00% | |
| X8 | 1.00 | 0.38% | 0.86 | 14.44% | 0.97 | 2.52% | |
| X9 | 0.88 | 15.59% | 1.00 | 0.00% | 0.76 | 18.93% | |
| X10 | 1.00 | 0.32% | 1.00 | 0.25% | 0.98 | 1.61% | |
| X11 | 1.00 | 0.00% | 1.00 | 0.00% | 1.00 | 0.00% | |
| X12 | 1.00 | 0.00% | 1.00 | 0.00% | 1.00 | 0.00% | |
| X13 | 1.00 | 0.00% | 1.00 | 0.00% | 1.00 | 0.00% | |
| X14 | 0.97 | 3.20% | 0.97 | 3.34% | 1.00 | 0.00% | |
| Recreational function | Y1 | 0.89 | 11.38% | 0.88 | 8.01% | 0.87 | 10.83% |
| Y2 | 0.90 | 10.50% | 0.90 | 6.96% | 0.90 | 8.30% | |
| Y3 | 1.00 | 0.36% | 0.99 | 0.81% | 0.95 | 4.29% | |
| Y4 | 1.00 | 0.24% | 1.00 | 0.24% | 0.99 | 0.73% | |
| Y5 | 0.90 | 10.50% | 0.90 | 7.01% | 0.90 | 8.30% | |
| Y6 | 0.87 | 13.62% | 0.85 | 10.16% | 0.83 | 13.85% | |
| Y7 | 0.91 | 9.54% | 0.90 | 6.53% | 0.97 | 2.15% | |
| Y8 | 0.88 | 12.71% | 0.86 | 9.18% | 0.88 | 10.02% | |
| Y9 | 0.84 | 16.38% | 0.86 | 9.39% | 0.88 | 10.05% | |
| Y10 | 0.99 | 1.04% | 0.86 | 9.39% | 0.93 | 6.09% | |
| Y11 | 1.00 | 0.00% | 0.97 | 1.84% | 1.00 | 0.00% | |
| Y12 | 0.98 | 2.27% | 0.87 | 8.49% | 0.88 | 9.65% | |
| Y13 | 0.91 | 8.86% | 0.81 | 12.89% | 0.85 | 12.14% | |
| Y14 | 0.97 | 2.61% | 0.87 | 9.12% | 0.96 | 3.61% | |
| Dual-purpose functionality | Z1 | 0.97 | 6.70% | 1.00 | 0.00% | 0.94 | 6.87% |
| Z2 | 0.95 | 10.47% | 0.98 | 4.33% | 0.98 | 2.87% | |
| Z3 | 1.00 | 0.35% | 0.99 | 2.05% | 0.96 | 5.43% | |
| Z4 | 1.00 | 0.40% | 0.97 | 4.72% | 0.97 | 4.09% | |
| Z5 | 0.97 | 5.87% | 0.98 | 4.33% | 0.98 | 2.87% | |
| Z6 | 0.86 | 33.06% | 0.84 | 27.34% | 0.84 | 20.24% | |
| Z7 | 0.99 | 2.24% | 0.99 | 0.91% | 0.98 | 3.11% | |
| Z8 | 1.00 | 0.53% | 1.00 | 0.86% | 0.97 | 4.36% | |
| Z9 | 0.86 | 32.03% | 0.79 | 36.92% | 0.83 | 21.37% | |
| Z10 | 0.99 | 1.41% | 0.99 | 2.22% | 0.97 | 3.71% | |
| Z11 | 1.00 | 0.00% | 1.00 | 0.00% | 1.00 | 0.00% | |
| Z12 | 1.00 | 0.78% | 1.00 | 0.00% | 0.87 | 16.28% | |
| Z13 | 1.00 | 0.39% | 0.98 | 2.65% | 0.95 | 6.65% | |
| Z14 | 0.97 | 5.77% | 0.92 | 13.67% | 0.98 | 2.15% | |

References
- Wang, R.; Liu, J.M.; Chen, T.; Tian, D.J. Distribution of recreational area in suburban metropolis: A case study of Beijing. Acta Geogr. Sin. 2010, 65, 745–754. [Google Scholar] [CrossRef]
- Liu, Y.S.; Li, J.T.; Yang, Y.Y. Strategic adjustment of land use policy under the economic transformation. Land Use Policy 2018, 74, 5–14. [Google Scholar] [CrossRef]
- Liu, Y.S.; Zhang, Z.W.; Zhou, Y. Efficiency of construction land allocation in China: An econometric analysis of panel data. Land Use Policy 2018, 74, 261–272. [Google Scholar] [CrossRef]
- Yang, C.G.; Guo, J.Y.; Li, Z.L. Planning of recreation tourism in suburb forest parks—A case study of Niushou Mountain in Nanjing. J. Northwest For. Univ. 2013, 28, 233–237. [Google Scholar] [CrossRef]
- Liu, Y.P.; Hu, M.J.; Zhao, B. Interactions between forest landscape elements and eye movement behavior under audio-visual integrated conditions. J. For. Res. 2020, 25, 21–30. [Google Scholar] [CrossRef]
- Frondoni, R.; Mollo, B.; Capotorti, G. A landscape analysis of land cover change in the municipality of Rome (Italy): Spatio-temporal characteristics and ecological implications of land cover transitions from 1954 to 2001. Landsc. Urban Plan. 2011, 100, 117–128. [Google Scholar] [CrossRef]
- Leopold, A. A Sand County Almanac: With Other Essays on Conservation from Round River; Oxford University Press: New York, NY, USA, 1966. [Google Scholar]
- Mageau, M.T.; Costanza, R.; Ulanowicz, R.E. The development and initial testing of a quantitative assessment of ecosystem health. Ecosyst. Health 1995, 1, 201–213. [Google Scholar]
- Rapport, D.J.; Gaudett, C.; Karr, J.R.; Baron, J.S.; Bohlen, C.; Jackson, W.; Jones, B.; Naiman, R.J.; Norton, B.; Pollock, M.M. Evaluating landscape health. J. Environ. Manage. 1998, 53, 1–15. [Google Scholar] [CrossRef]
- Zhao, Q.; Tang, H.H.; Gao, C.J.; Wei, Y.H. Evaluation of urban forest landscape health: A case study of the Nanguo Peach Garden, China. iForest-Biogeosci. For. 2020, 13, 175–184. [Google Scholar] [CrossRef]
- Shu, H.; Xiao, C.W.; Ma, T.; Sang, W.G. Ecological health assessment of Chinese National Parks based on landscape pattern: A case study in Shennongjia National Park. Int. J. Environ. Res. Public Health 2021, 18, 11487. [Google Scholar] [CrossRef]
- Wang, H.; Hou, P.; Jiang, J.B.; Xiao, R.L.; Zhai, J.; Fu, Z.; Hou, J. Ecosystem health assessment of Shennongjia National Park, China. Sustainability 2020, 12, 7672. [Google Scholar] [CrossRef]
- Wajchman-Świtalska, S.; Zajadacz, A.; Woźniak, M.; Jaszczak, R.; Beker, C. Recreational evaluation of forests in urban environments: Methodological and practical aspects. Sustainability 2022, 14, 15177. [Google Scholar] [CrossRef]
- Levandovská, N.; Šerá, B.; Žarnovičan, H.; Akbar, K.F. Determination of recreation potential in three urban forests. Sylwan 2021, 165, 627–638. [Google Scholar] [CrossRef]
- Fang, X.S.; Liu, S.; Chen, W.Z.; Wu, R.Z. An effective method for wetland park health assessment: A case study of the Guangdong Xinhui National Wetland Park in the Pearl River Delta, China. Wetlands 2021, 41, 44. [Google Scholar] [CrossRef]
- García-Ayllón, S.; Martínez, G. Analysis of correlation between anthropization phenomena and landscape values of the territory: A GIS framework based on spatial statistics. ISPRS Int. J. Geo-Inf. 2023, 12, 323. [Google Scholar] [CrossRef]
- Schüpbach, B.; Kay, S. Validation of a visual landscape quality indicator for agrarian landscapes using public participatory GIS data. Landsc. Urban Plan. 2024, 241, 104906. [Google Scholar] [CrossRef]
- Das, M.; Das, A.; Mandal, A. Research note: Ecosystem Health (EH) assessment of a rapidly urbanizing metropolitan city region of eastern India—A study on Kolkata Metropolitan Area. Landsc. Urban Plan. 2020, 204, 103938. [Google Scholar] [CrossRef]
- Das, S.; Pradhan, B.; Shit, P.K.; Alamri, A.M. Assessment of wetland ecosystem health using the pressure–state–response (PSR) model: A case study of Mursidabad District of West Bengal (India). Sustainability 2020, 12, 5932. [Google Scholar] [CrossRef]
- Li, Y.F.; Dong, L. Assessment and forecast of Beijing and Shanghai’s urban ecosystem health. Sci. Total Environ. 2014, 487, 154–163. [Google Scholar] [CrossRef]
- Tehrani, N.A.; Shafri, H.Z.M.; Salehi, S.; Chanussot, J.; Janalipour, M. Remotely-Sensed Ecosystem Health Assessment (RSEHA) model for assessing the changes of ecosystem health of Lake Urmia Basin. Int. J. Image Data Fusion 2022, 13, 180–205. [Google Scholar] [CrossRef]
- Peng, J.; Liu, Y.X.; Wu, J.S.; Lv, H.L.; Hu, X.X. Linking ecosystem services and landscape patterns to assess urban ecosystem health: A case study in Shenzhen City, China. Landsc. Urban Plan. 2015, 143, 56–68. [Google Scholar] [CrossRef]
- Haase, R.; Nolte, U. The invertebrate species index (ISI) for streams in southeast Queensland, Australia. Ecol. Indic. 2008, 8, 599–613. [Google Scholar] [CrossRef]
- De Toro, P.; Iodice, S. Ecosystem health assessment in urban contexts: A proposal for the Metropolitan Area of Naples (Italy). Aestimum 2018, 72, 39–59. [Google Scholar]
- Ma, Z.L.; Chen, L.H.; Han, P.; Yu, X.W.; Nie, S. Study on health assessment of scenic forest in Jiufeng National Forest Park. Res. Soil Water Conserv. 2010, 17, 207–211. [Google Scholar]
- Wang, J.W.; Zhang, J.H.; Wang, P.J.; Ma, X.B.; Yang, L.J.; Zhou, L.Y. Progress in ecosystem health research and future prospects. Sustainability 2022, 14, 15814. [Google Scholar] [CrossRef]
- Han, X.; Hu, J.L.; Liu, C.S.; Wang, X.Y. Mountain landscape health diagnosis and pattern evolution based on remote sensing: Case study in Xinjiang Tianshan Karajun-Kurdening. Acta Ecol. Sin. 2021, 41, 6451–6465. [Google Scholar] [CrossRef]
- Chen, M.T.; Zhou, J.Y.; Bao, Z.T.; Hua, G.D.; Li, J.L. Study on risk assessment of provincial wetland degradation—Based on multi-scale analysis of geographical grids and landscape character units. Chin. Landsc. Archit. 2023, 39, 52–58. [Google Scholar] [CrossRef]
- Wang, F.; Ye, C.S.; Hua, J.Q.; Li, X. Coupling relationship between urban spatial expansion and landscape ecological risk in Nanchang City. Acta Ecol. Sin. 2019, 39, 1248–1262. [Google Scholar] [CrossRef]
- Wang, Y.S.; Tang, D.; Yan, X.D.; Li, S.X.; Yu, Z.X.; Wu, L. Research on ecological security evaluation of Central Baoshan City based on grid scale. J. Southwest For. Univ. 2021, 41, 80–87. [Google Scholar]
- Zuo, Q.; Zhou, Y.; Li, Q.; Wang, L.; Liu, J.Y.; He, N. Spatial and temporal variations of landscape ecological risk in the mountainous region of southwestern Hubei Province based on the optimal scale. Chin. J. Ecol. 2023, 42, 1186–1196. [Google Scholar] [CrossRef]
- Li, Y.F.; Liu, H.Y.; Cao, X.; Zheng, N. Spatial differences of landscape health in urban wetland parks: A case study of Xixi Wetland Park in Hangzhou. Acta Geogr. Sin. 2010, 65, 1429–1437. [Google Scholar] [CrossRef]
- Wiens, J.A. Landscape ecology: The science and the action. Landsc. Ecol. 1999, 14, 103. [Google Scholar] [CrossRef]
- Li, Y.F.; Liu, H.Y.; Zhang, H.B.; Sun, Y.M.; Li, Y.L. The study of landscape health based on landscape structure and water environment: A case study of Xixi Wetland Park in Hangzhou. J. Nat. Resour. 2015, 30, 761–771. [Google Scholar] [CrossRef]
- Yang, Y.H. Elements of information theory. J. Am. Stat. Assoc. 2008, 103, 429. [Google Scholar] [CrossRef]
- Ogwang, T.; Cho, D.I. Olympic rankings based on objective weighting schemes. J. Appl. Stat. 2021, 48, 573–582. [Google Scholar] [CrossRef] [PubMed]
- Liu, H.Y.; Liu, Y.C.; Meng, L.H.; Jiao, K.Q.; Zhu, M.Y.; Chen, Y.K.; Zhang, P.F. Research progress of entropy weight method in water resources and water environment. J. Glaciol. Geocryol. 2022, 44, 299–306. [Google Scholar] [CrossRef]
- Navalho, I.; Alegria, C.; Roque, N.; Quinta-Nova, L. Mapping forest landscape multifunctionality using multicriteria spatial analysis. Floresta Ambiente 2019, 26, e20170702. [Google Scholar] [CrossRef]
- Liu, H.Y.; Li, Z.F.; Li, Y.F.; Lin, Z.S. Evaluation of sustainable capacity of national wetland park ecological analysis based on constraint and support function. Resour. Sci. 2015, 37, 805–814. [Google Scholar]
- Chen, W.Y.; Li, X. Urban forests’ recreation and habitat potentials in China: A nationwide synthesis. Urban For. Urban Green. 2021, 66, 127376. [Google Scholar] [CrossRef]
- Masek, J.G.; Hayes, D.J.; Hughes, M.J.; Healey, S.P.; Turner, D.P. The role of remote sensing in process-scaling studies of managed forest ecosystems. For. Ecol. Manag. 2015, 355, 109–123. [Google Scholar] [CrossRef]
- Johnston, D.; Lowell, K. Forest volume relative to cartographic boundaries and sample spacing, unit size and type. Geogr. Environ. Modell. 2000, 4, 105–120. [Google Scholar] [CrossRef]
- Gupta, K.; Kumar, P.; Pathan, S.K.; Sharma, K.P. Urban neighborhood green index—A measure of green spaces in urban areas. Landsc. Urban Plan. 2012, 105, 325–335. [Google Scholar] [CrossRef]
- Chmiel, J. Cultural landscape as both a threat and an opportunity to preserve a high conservation value of vascular flora: A case study. Diversity 2023, 15, 211. [Google Scholar] [CrossRef]
- Hao, Z.Z.; Wang, C.; Sun, Z.K.; van den Bosch, C.K.; Zhao, D.X.; Sun, B.Q.; Xu, X.H.; Bian, Q.; Bai, Z.T.; Wei, K.Y.; et al. Soundscape mapping for spatial-temporal estimate on bird activities in urban forests. Urban For. Urban Green. 2021, 57, 126822. [Google Scholar] [CrossRef]
- Gioia, A.; Paolini, L.; Malizia, A.; Oltra-Carrió, R.; Sobrino, J.A. Size matters: Vegetation patch size and surface temperature relationship in foothills cities of northwestern Argentina. Urban Ecosyst. 2014, 17, 1161–1174. [Google Scholar] [CrossRef]
- Maseko, M.S.T.; Zungu, M.M.; Ehlers Smith, D.A.; Ehlers Smith, Y.C.; Downs, C.T. Effects of habitat-patch size and patch isolation on the diversity of forest birds in the urban-forest mosaic of Durban, South Africa. Urban Ecosyst. 2020, 23, 533–542. [Google Scholar] [CrossRef]
- Gratzfeld, J.; Wen, X.Y.; Jones, M.; Rivers, M. Safeguarding China’s native trees—A review of integrated conservation practices between 2008 and 2020. Glob. Ecol. Conserv. 2022, 35, e02101. [Google Scholar] [CrossRef]
- Thomas, E.; Jalonen, R.; Loo, J.; Boshier, D.; Gallo, L.; Cavers, S.; Bordács, S.; Smith, P.; Bozzano, M. Genetic considerations in ecosystem restoration using native tree species. For. Ecol. Manag. 2014, 333, 66–75. [Google Scholar] [CrossRef]
- He, J.H.; Pan, Z.Z.; Liu, D.F.; Guo, X.N. Exploring the regional differences of ecosystem health and its driving factors in China. Sci. Total Environ. 2019, 673, 553–564. [Google Scholar] [CrossRef]
- Cao, Y.; Xiao, D.N.; Ou, Y.H.; Chen, G. Analysis of landscape change drivers in the Ejina natural oasis. Acta Ecol. Sin. 2004, 24, 1895–1902. [Google Scholar]
- Klaus, V.H.; Kiehl, K. A conceptual framework for urban ecological restoration and rehabilitation. Basic Appl. Ecol. 2021, 52, 82–94. [Google Scholar] [CrossRef]


| Primary Classification | Secondary Classification | Tertiary Classification | Description |
|---|---|---|---|
| Landscape patches | Eco-conservational landscape patches | Eco-conservational forest patches | The predominant landscape features are characterized by naturalized forest landscapes, exhibiting complex landscape structures, diverse ecosystems, and a variety of vertical and horizontal elements within these patches. These include forest patches with specific functions—such as soil and water conservation, water resource conservation, windbreaking, and sand-fixation—as well as stands of parent trees for specialized tree species and environmental protection forests. |
| Eco-conservational non-forest patches | These are non-forest-type patches formed naturally within the landscape, excluding naturalized forest landscapes. They include naturally occurring bodies of water and grasslands dominated by natural herbaceous plants, such as natural lakes and uncultivated grasslands. | ||
| Recreational landscape patches | Recreational forest patches | These are predominantly artificially planted forest landscapes characterized by a simple structure and a single ecosystem type, offering various recreational and scenic functions. These patches encompass economic forests, timber forests, experimental forests within special-use forests, and recreational forests. | |
| Recreational non-forest patches | Artificially excavated water bodies, decorative lawns, and other man-made natural patches, including artificial ponds, man-made grasslands, and similar features. In addition, these include patches characterized by hard or semi-hard artificial surface spatial structures, encompassing areas such as plazas, commercial and service land, special-purpose land, and other types of developed land. | ||
| Dual-purpose landscape patches | Dual-purpose forest patches | Primarily artificially planted quasi-natural forest landscapes with multiple functions, including ecological, cultural, scenic, and military functions. These forest patches encompass national defense forests, scenic forests, and revolutionary memorial forests of historical and cultural significance. | |
| Dual-purpose non-forest patches | Non-forest patches primarily consist of crop cultivation areas and bare land, including paddy fields, irrigated fields, bare soil areas, and bare rocky gravel areas. | ||
| Landscape Corridors | Eco-conservation landscape corridors | Eco-conservational forest corridors | A complex landscape structure, diverse ecosystems, and ecological corridors with functions for species and material migration activities. These mainly include forest strips and forest networks in protective forests with a width of ≥12 m. |
| Eco-conservational non-forest corridors | Naturally formed rivers. | ||
| Recreational landscape corridors | Recreational forest corridors | Mainly composed of artificially planted forest landscapes with simple structures and a single ecological system, these corridors serve various recreational and scenic functions. They primarily consist of forest strips and networks within protective forests with widths less than 6 m. | |
| Recreational non-forest corridors | Artificially constructed channels and corridors characterized by hard or semi-hard surface structures, primarily designated for road use. | ||
| Dual-purpose landscape corridors | Dual-purpose forest corridors | Corridors primarily characterized by artificially planted forest landscapes with simple structures and a single ecological system, providing various recreational and scenic functions. These corridors are typically forest belts and networks within protective forests, with widths ranging from 6 m to 12 m, inclusive. | |
| Dual-purpose non-forest corridors | Artificially excavated rivers. |
| Evaluation Index | Eco-Conservation Index | Landscape Recreation Index | Dual-Purpose Functionality Index |
|---|---|---|---|
| Patch | X1 Eco-conservation patch area ratio + | Y1 Landscape recreation patch area ratio + | Z1 Dual-purpose functionality patch area ratio + |
| X2 Eco-conservation patch density − | Y2 Landscape recreation patch density − | Z2 Dual-purpose functionality patch density − | |
| X3 Eco-conservation patch edge density + | Y3 Landscape recreation patch edge density+ | Z3 Dual-purpose functionality patch edge density + | |
| X4 Eco-conservation patch fragmentation − | Y4 Landscape recreation patch accessibility + | Z4 50% Eco-conservation patch fragmentation + 50% Recreation patch accessibility | |
| X5 Eco-conservation patch isolation − | Y5 Landscape recreation patch isolation − | Z5 Dual-purpose functionality patch isolation − | |
| X6 Eco-conservation patch diversity + | Y6 Landscape recreation patch diversity + | Z6 Dual-purpose functionality patch diversity + | |
| X7 Eco-conservation patch fractal dimension + | Y7 Landscape recreation patch fractal dimension+ | Z7 Dual-purpose functionality patch fractal dimension + | |
| Corridor | X8 Eco-conservation corridor naturalness + | Y8 Landscape recreation corridor density − | Z8 50% Eco-conservation corridor naturalness + 50% Recreational corridor density |
| X9 Eco-conservation corridor curvature − | Y9Landscape recreation corridor curvature − | Z9 Dual-purpose functionality corridor curvature − | |
| X10 Eco-conservation corridor width ratio + | Y10 Landscape recreation corridor width ratio + | Z10 Dual-purpose functionality corridor width ratio + | |
| X11 Eco-conservation corridor loopiness + | Y11 Landscape recreation corridor loopiness + | Z11 Dual-purpose functionality corridor loopiness + | |
| X12 Eco-conservation corridor point-line ratio + | Y12 Landscape recreation corridor point-line ratio + | Z12 Dual-purpose functionality corridor point-line ratio + | |
| X13 Eco-conservation corridor connectivity + | Y13 Landscape recreation corridor connectivity + | Z13 Dual-purpose functionality corridor connectivity + | |
| X14 Eco-conservation corridor fractal dimension + | Y14 Landscape recreation corridor fractal dimension + | Z14 Dual-purpose functionality corridor fractal dimension + |
| Index | Calculation Formula | Formula Interpretation | Meaning of the Indicators |
|---|---|---|---|
| Patch area ratio | represents the patch area ratio. represents the area of the patch type. represents the area of the basic sampling unit. | It reflects the dominant position of patch types. | |
| Patch density | represents patch density. represents the count of patch types. represents the area of the basic sampling unit. | It reflects the degree of patch fragmentation. The larger the value, the wider the distribution of patches, indicating a higher degree of fragmentation. | |
| Patch edge density | represents the edge density; represents the length of patch edge; represents the area of the patch type. | It reflects the complexity of the patch boundaries; a larger value indicates a more complex patch edge shape. | |
| Eco-conservation patch fragmentation | represents the patch fragmentation index; represents the ratio of the minimum patch area to the basic sampling unit area; represents the ratio of the average patch area to the minimum patch area; represents the total number of patches for eco-conservation function. | It reflects the degree of disruption in the patch landscape structure. A higher value indicates poorer stability in the landscape structure. | |
| Recreational patch accessibility | Recreational patch accessibility is quantitatively estimated based on cost distance in ArcGIS and minimum cumulative resistance methods. | It reflects the minimum cost distance to reach adjacent patches; the closer the distance, the better the accessibility. | |
| Patch isolation | represents the patch separation degree; represents the distance index of patch type; represents the area ratio of the patch type; represents the area of the patch type; is the area of fundamental sampling units; is the patch type; is the total number of patches. | It reflects the patch’s dispersion level; a smaller value indicates better connectivity among patch clusters. | |
| Patch diversity | represents the Shannon–Wiener index; represents the patch type; represents the proportion of the basic sampling unit area it occupies; represents the total count of patch types. | It reflects the complexity of patches, and as the value increases, the diversity and complexity of the landscape structure also increase. | |
| Patch fractal dimension | represents the patch fractal dimension; represents the patch perimeter; represents the area of the patch type. | It reflects the deviation of actual patch shapes from standard shapes (circle or square). The closer the value to 1, the simpler the shape, indicating a greater degree of disturbance. | |
| Eco-conservation corridor naturalness | represents the naturalness of the eco-conservation corridor; represents the corridor density. | It reflects the naturalness of the corridors; a higher value indicates less disturbance and is more favorable for the survival of wildlife. | |
| Recreational corridor density | represents the density of recreational corridors; represents the length of corridor type ; represents the area of the basic sampling unit. | It reflects the degree of corridor fragmentation. A higher value indicates greater landscape fragmentation. | |
| Corridor curvature | represents the corridor curvature; represents the actual length of the corridor; represents the straight-line distance from the starting point to the endpoint of the corridor. | It reflects the curvature of the corridor, and a higher value indicates longer travel time and greater energy consumption during movement. | |
| Corridor width ratio | represents corridor width ratio; represents the width of corridor type ; represents the side length of the sampling unit. | As the width ratio increases, the corridor’s capacity for passage improves, leading to an increased edge, increased interior species, and enhanced environmental heterogeneity. | |
| Corridor loopiness | represents the corridor loopiness; is the count of edges in the network; is the count of nodes. | It reflects the complexity of the corridor network and characterizes the degree of choice in energy flow, material flow, or species migration routes in the corridor network. | |
| Corridor point-line ratio | represents the corridor point-line ratio; represents the count of edges; represents the count of nodes. | It reflects the average number of connecting lines for each node in the corridor network, indicating the ease or difficulty of connectivity between nodes. | |
| Corridor connectivity | represents the corridor point-line ratio; represents the count of edges; represents the count of nodes. | It reflects the degree to which all nodes within a corridor network are connected. | |
| Corridor fractal dimension | represents the corridor fractal dimension; represents the total length of the corridor type; represents the area of the corridor type. | It reflects the deviation of the actual corridor shape from the standard shape (circle or square). The closer the value to 1, the simpler the shape, indicating a higher degree of disturbance. | |
| Size of Basic Sampling Units | Landscape Health Category | Forest-to-Non-Forest Area Ratio/Quantity Ratio of Eco-Conservational Landscapes | Forest-to-Non-Forest Area Ratio/Quantity Ratio of Recreational Landscapes | Forest-to-Non-Forest Area Ratio/Quantity Ratio of Comprehensive Landscapes |
|---|---|---|---|---|
| 18 m × 18 m | Very poor | 3.34/1.91 | 34.50/18.79 | 36.72/19.10 |
| Poor | 1.95/1.51 | 0.62/0.58 | 0.67/0.64 | |
| Fair | — | 2.02/1.43 | 1.06/0.76 | |
| Good | 5.26/2.11 | 0.36/0.34 | 1.23/0.99 | |
| Very good | 2.76/2.99 | 0.58/0.50 | 7.83/2.70 | |
| 36 m × 36 m | Very poor | 3.46/1.54 | 49.95/20.39 | 5.89/3.53 |
| Poor | 0.98/0.74 | 0.83/0.78 | 1.37/0.85 | |
| Fair | 9.49/6.00 | 1.66/0.87 | 1.65/0.89 | |
| Good | 12.22/1.81 | 0.87/0.62 | 0.93/0.81 | |
| Very good | 3.55/2.69 | 0.99/0.78 | 2.23/1.24 | |
| 54 m × 54 m | Very poor | 3.34/1.28 | 76.38/21.65 | 7.41/3.72 |
| Poor | 4.32/1.55 | 1.18/0.88 | 1.72/0.90 | |
| Fair | 3.88/0.80 | 3.69/1.51 | 1.40/0.81 | |
| Good | 4.93/2.34 | 0.76/0.53 | 1.60/0.90 | |
| Very good | 24.23/3.00 | 0.83/0.68 | 4.41/0.91 |
Disclaimer/Publisher’s Note: The statements, opinions and data contained in all publications are solely those of the individual author(s) and contributor(s) and not of MDPI and/or the editor(s). MDPI and/or the editor(s) disclaim responsibility for any injury to people or property resulting from any ideas, methods, instructions or products referred to in the content. |
© 2023 by the authors. Licensee MDPI, Basel, Switzerland. This article is an open access article distributed under the terms and conditions of the Creative Commons Attribution (CC BY) license (https://creativecommons.org/licenses/by/4.0/).
Share and Cite
Luo, H.; Zhao, Q.; Zhang, L.; Gao, C.; Wu, X.; Nie, Y. Landscape Health Assessment of Suburban Forest Park: A Case Study Based on Multiple Sampling Units and Functional Characteristics. Forests 2023, 14, 2237. https://doi.org/10.3390/f14112237
Luo H, Zhao Q, Zhang L, Gao C, Wu X, Nie Y. Landscape Health Assessment of Suburban Forest Park: A Case Study Based on Multiple Sampling Units and Functional Characteristics. Forests. 2023; 14(11):2237. https://doi.org/10.3390/f14112237
Chicago/Turabian StyleLuo, Hao, Qing Zhao, Lingyu Zhang, Changjun Gao, Xiaojun Wu, and Yuying Nie. 2023. "Landscape Health Assessment of Suburban Forest Park: A Case Study Based on Multiple Sampling Units and Functional Characteristics" Forests 14, no. 11: 2237. https://doi.org/10.3390/f14112237
APA StyleLuo, H., Zhao, Q., Zhang, L., Gao, C., Wu, X., & Nie, Y. (2023). Landscape Health Assessment of Suburban Forest Park: A Case Study Based on Multiple Sampling Units and Functional Characteristics. Forests, 14(11), 2237. https://doi.org/10.3390/f14112237