Article

Spatiotemporal Variation and Pattern Analysis of Air Pollution and Its Correlation with NDVI in Nanjing City, China: A Landsat-Based Study

1
College of Landscape Architecture, Nanjing Forestry University, Nanjing 210037, China
2
Co-Innovation Center for the Sustainable Forestry in Southern China, Nanjing Forestry University, Nanjing 210037, China
3
Jin Pu Research Institute, Nanjing Forestry University, Nanjing 210037, China
4
Research Center for Digital Innovation Design, Nanjing Forestry University, Nanjing 210037, China
5
College of Art and Design, Nanjing Forestry University, Nanjing 210037, China
*
Author to whom correspondence should be addressed.
Forests 2023, 14(10), 2106; https://doi.org/10.3390/f14102106
Submission received: 25 September 2023 / Revised: 17 October 2023 / Accepted: 18 October 2023 / Published: 20 October 2023

Abstract

:
The rapid socio-economic development and urbanization in China have led to a decline in air quality. Therefore, the spatial and temporal distribution patterns of urban air pollution, as well as its formation mechanisms and influencing factors, have become important areas of research in atmospheric environment studies. This paper focuses on nine monitoring sites in Nanjing, where concentration data for six air pollutants and vegetation index data were collected from 2013 to 2021. The objective of this study is to investigate the changes in air pollutants and vegetation index over time and space, as well as their relationship with each other, and to assess the social and environmental impacts of air pollution. The findings reveal a spatial distribution pattern of air pollution in Nanjing that exhibits significant variability, with pollutant concentrations decreasing from the city center towards the surrounding areas. Notably, the main urban area has lower air quality compared to the peripheral regions. The results obtained from best-fit linear regression models and correlation heatmaps demonstrate a strong correlation (coefficient of determination, R2 > 0.5) between the normalized difference vegetation index (NDVI) and pollutants such as SO2, NO2, PM2.5, PM10, and O3 within a radial distance of 2 km from the air pollutant monitoring sites. These findings indicate that NDVI can be an effective indicator for assessing the distribution and concentrations of air pollutants. Negative correlations between NDVI and socio-economic indicators are observed under relatively consistent natural conditions, including climate and terrain. Therefore, the spatiotemporal distribution patterns of NDVI can provide valuable insights not only into socio-economic growth but also into the levels and locations of air pollution concentrations.

1. Introduction

With the rapid socio-economic development and acceleration of urbanization in China, the issue of air pollution has become increasingly severe, thereby negatively impacting human health, climate, and the sustainable development of cities [1,2]. Mainly, particulate matter (PM) is composed of toxic and harmful substances with high fluidity, which can linger in the atmosphere for extended periods, leading to elevated rates of cardiovascular and respiratory diseases and subsequent morbidity and mortality [3]. To address this severe air pollution problem, the State Council of the People’s Republic of China issued the “Action Plan on Prevention and Control of Air Pollution” in September 2013, focusing explicitly on regional air pollution and addressing characteristic pollutants such as inhalable and fine PM. The plan entails various measures implemented by the Chinese government, including expanding green spaces in urban areas, reducing motor vehicle usage, and increasing clean energy. While the concentrations of air pollutants have reduced to some extent since 2017, exceedances still persist [4]. Nanjing, as the political and cultural hub of East China and a significant center of the eastern Chinese economy, is densely populated with well-developed industrial and agricultural sectors. As of 2021, the permanent population of Nanjing stands at 9.42 million people, with a population density of 1430.6 persons per square kilometer. However, due to rapid economic and population growth, as well as its unique topographical and climatic characteristics, air pollution has become an increasing concern as a widespread issue in Nanjing.
Recent research on regional air pollution has primarily centered on pollution source profiling [5], the relationship between air pollutants and meteorological conditions [6], and the analysis of spatiotemporal variations [7]. Among the meteorological conditions, wind speed is recognized as the primary driver of nitrogen-related air pollution. For example, Banerjee et al. found that atmospheric NO2 concentration was most influenced by wind speed, followed by the weekly average temperature [8]. Wang et al. reported that higher temperatures, lower surface pressures, and increased wind speed facilitated the dispersion of air pollutants [9]. Jia et al. also emphasized the significant impact of temperature and wind speed on air pollutants [10]. Hrishikesh et al. identified temperature as the main influencing factor, with NO2 exhibiting a strong correlation with temperature during the monsoon season and humidity during winter [11]. Guo et al. and Cui et al. conducted analyses of air pollution in Nanjing, investigating its spatiotemporal distribution, patterns, and potential sources of pollutants [12,13]. Yuan et al. used machine learning research methods to identify unreasonable NOx/VOCs emissions reduction as the main factor contributing to the overall extension of ozone in the Pearl River Delta in spring and winter [14]. Ersin, O.O. discovered, through the employment of the dynamic Panel STAR method, that CO2 emissions are an accumulated process with path-dependence related to the history of emissions and economic growth [15]. However, these studies have primarily focused on the composition, distribution, and concentrations of air pollutants, neglecting the importance of environmental management. Consequently, it is crucial and urgent to conduct research on the spatiotemporal variations of air pollutants, the drivers influencing their concentrations, and environmentally proactive measures to mitigate and prevent these pollutants.
Recent evidence has highlighted the significant role of technological innovations in determining emissions [16]. Currently, two main approaches are employed in studies on air pollution management. The first approach utilizes chemical methods and technologies to address air pollution. For instance, Escobedo et al. employed photocatalytic technology to degrade air pollutants [17]. Wang et al. utilized analytical techniques to investigate dust deposition on streets [18]. Kaya et al. applied green analytical chemistry to mitigate air pollution [19]. The second approach focuses on ecological or environmental management, employing green methods where plants play a vital role in the adsorption, transformation, assimilation, and degradation of air pollutants. This approach also aims to rehabilitate or restore ecosystems affected by air pollution [20]. Plant leaves respond sensitively to air pollution and serve as significant pathways for energy exchange between vegetation and the external environment. Consequently, studying the complex and dynamic interactions between air pollutants and vegetation growth and development has emerged as a prominent research topic. For instance, Freer-Smith et al. demonstrated that plant leaves intercept and immobilize atmospheric PM due to their surface properties [21]. Prusty et al. indicated that plants can absorb air pollutants and reduce atmospheric dust concentrations [22]. Nowak et al. estimated that vegetation in American cities removes a total of 711,000 tons of air pollutants from the atmosphere, providing an economic benefit of USD 3.8 billion. They further revealed that vegetation effectively controls air pollution and enhances the cleanliness of urban environments [23].
Various evaluation indices have been proposed to quantify vegetation, including the normalized difference vegetation index (NDVI), leaf area index, living vegetation volume, green cover index, green visual ratio, and fractional vegetation cover [24,25,26,27,28,29]. NDVI is derived from a combination of linear and non-linear spectral bands, allowing it to capture the spatiotemporal growth and distribution of vegetation effectively. Furthermore, NDVI demonstrates a strong correlation with vegetation cover and, to some extent, can reflect the socio-economic status of a city [30]. Recent advancements in remote sensing technology have facilitated the exploration of the relationship between urban green spaces on a large scale and the mitigation of urban air pollution [31]. For instance, Sun, S. et al. conducted a correlation analysis between NDVI and air pollution in Beijing, Tianjin, and Hebei, China [32]. Similarly, Huang, G.J. et al. investigated the correlation between PM2.5 concentration and fractional vegetation cover in Liupanshui, Guizhou [33]. However, to the best of our knowledge, no studies have been conducted thus far on the spatiotemporal variations and patterns of air pollutants in Nanjing, as well as the impact of vegetation on air pollutants.
The normalized difference vegetation index (NDVI) serves as a standardized vegetation index that effectively characterizes the extent of vegetation coverage within a specific region. By examining the correlation between NDVI and atmospheric pollutants, the development of ecologically responsible urban green spaces with varying purification capacities can be facilitated. This innovative approach utilizes plant-based remediation to control air pollution. Vertical greening, as a viable botanical remediation solution, effectively mitigates the presence of airborne pollutants such as volatile organic compounds (VOCs) and PM, concurrently enhancing urban vegetation coverage within constrained horizontal spaces [34]. Srbinovska et al. reported that vertical greening, through plant-based absorption mechanisms, resulted in a notable reduction of 25.0% and 37.0% in PM2.5 and PM10 levels, respectively, thereby affirming its capacity to sequester deleterious fine particulate matter [35]. Additionally, Pettit et al. discerned the capacity of vertical greening in purifying NO2 and O3 emissions from combustion by-products, registering purification rates of 121 and 50 m3/(h·m2) for these pollutants, respectively [36]. These findings are of considerable significance for urban landscaping, environmental planning, and the construction of ecological environments. Air pollution can cause direct and indirect adverse effects on fauna, flora, and human health on a regional scale, as seen in Iran [37]. Furthermore, it exerts a significant socio-economic impact on both public health and photovoltaic energy efficiency [38]. Therefore, the objective of this study is to analyze the spatiotemporal variations and patterns of six air pollutants (SO2, NO2, CO, O3, PM2.5, and PM10) in relation to NDVI in Nanjing from 2013 to 2021 while also exploring the spatiotemporal relationships among air pollutants, NDVI, and socio-economic indicators. The outcomes of this study provide insights into sustainable development strategies and practices for governing Nanjing, as well as macro-economic regulation and environmental management.

2. Materials and Methods
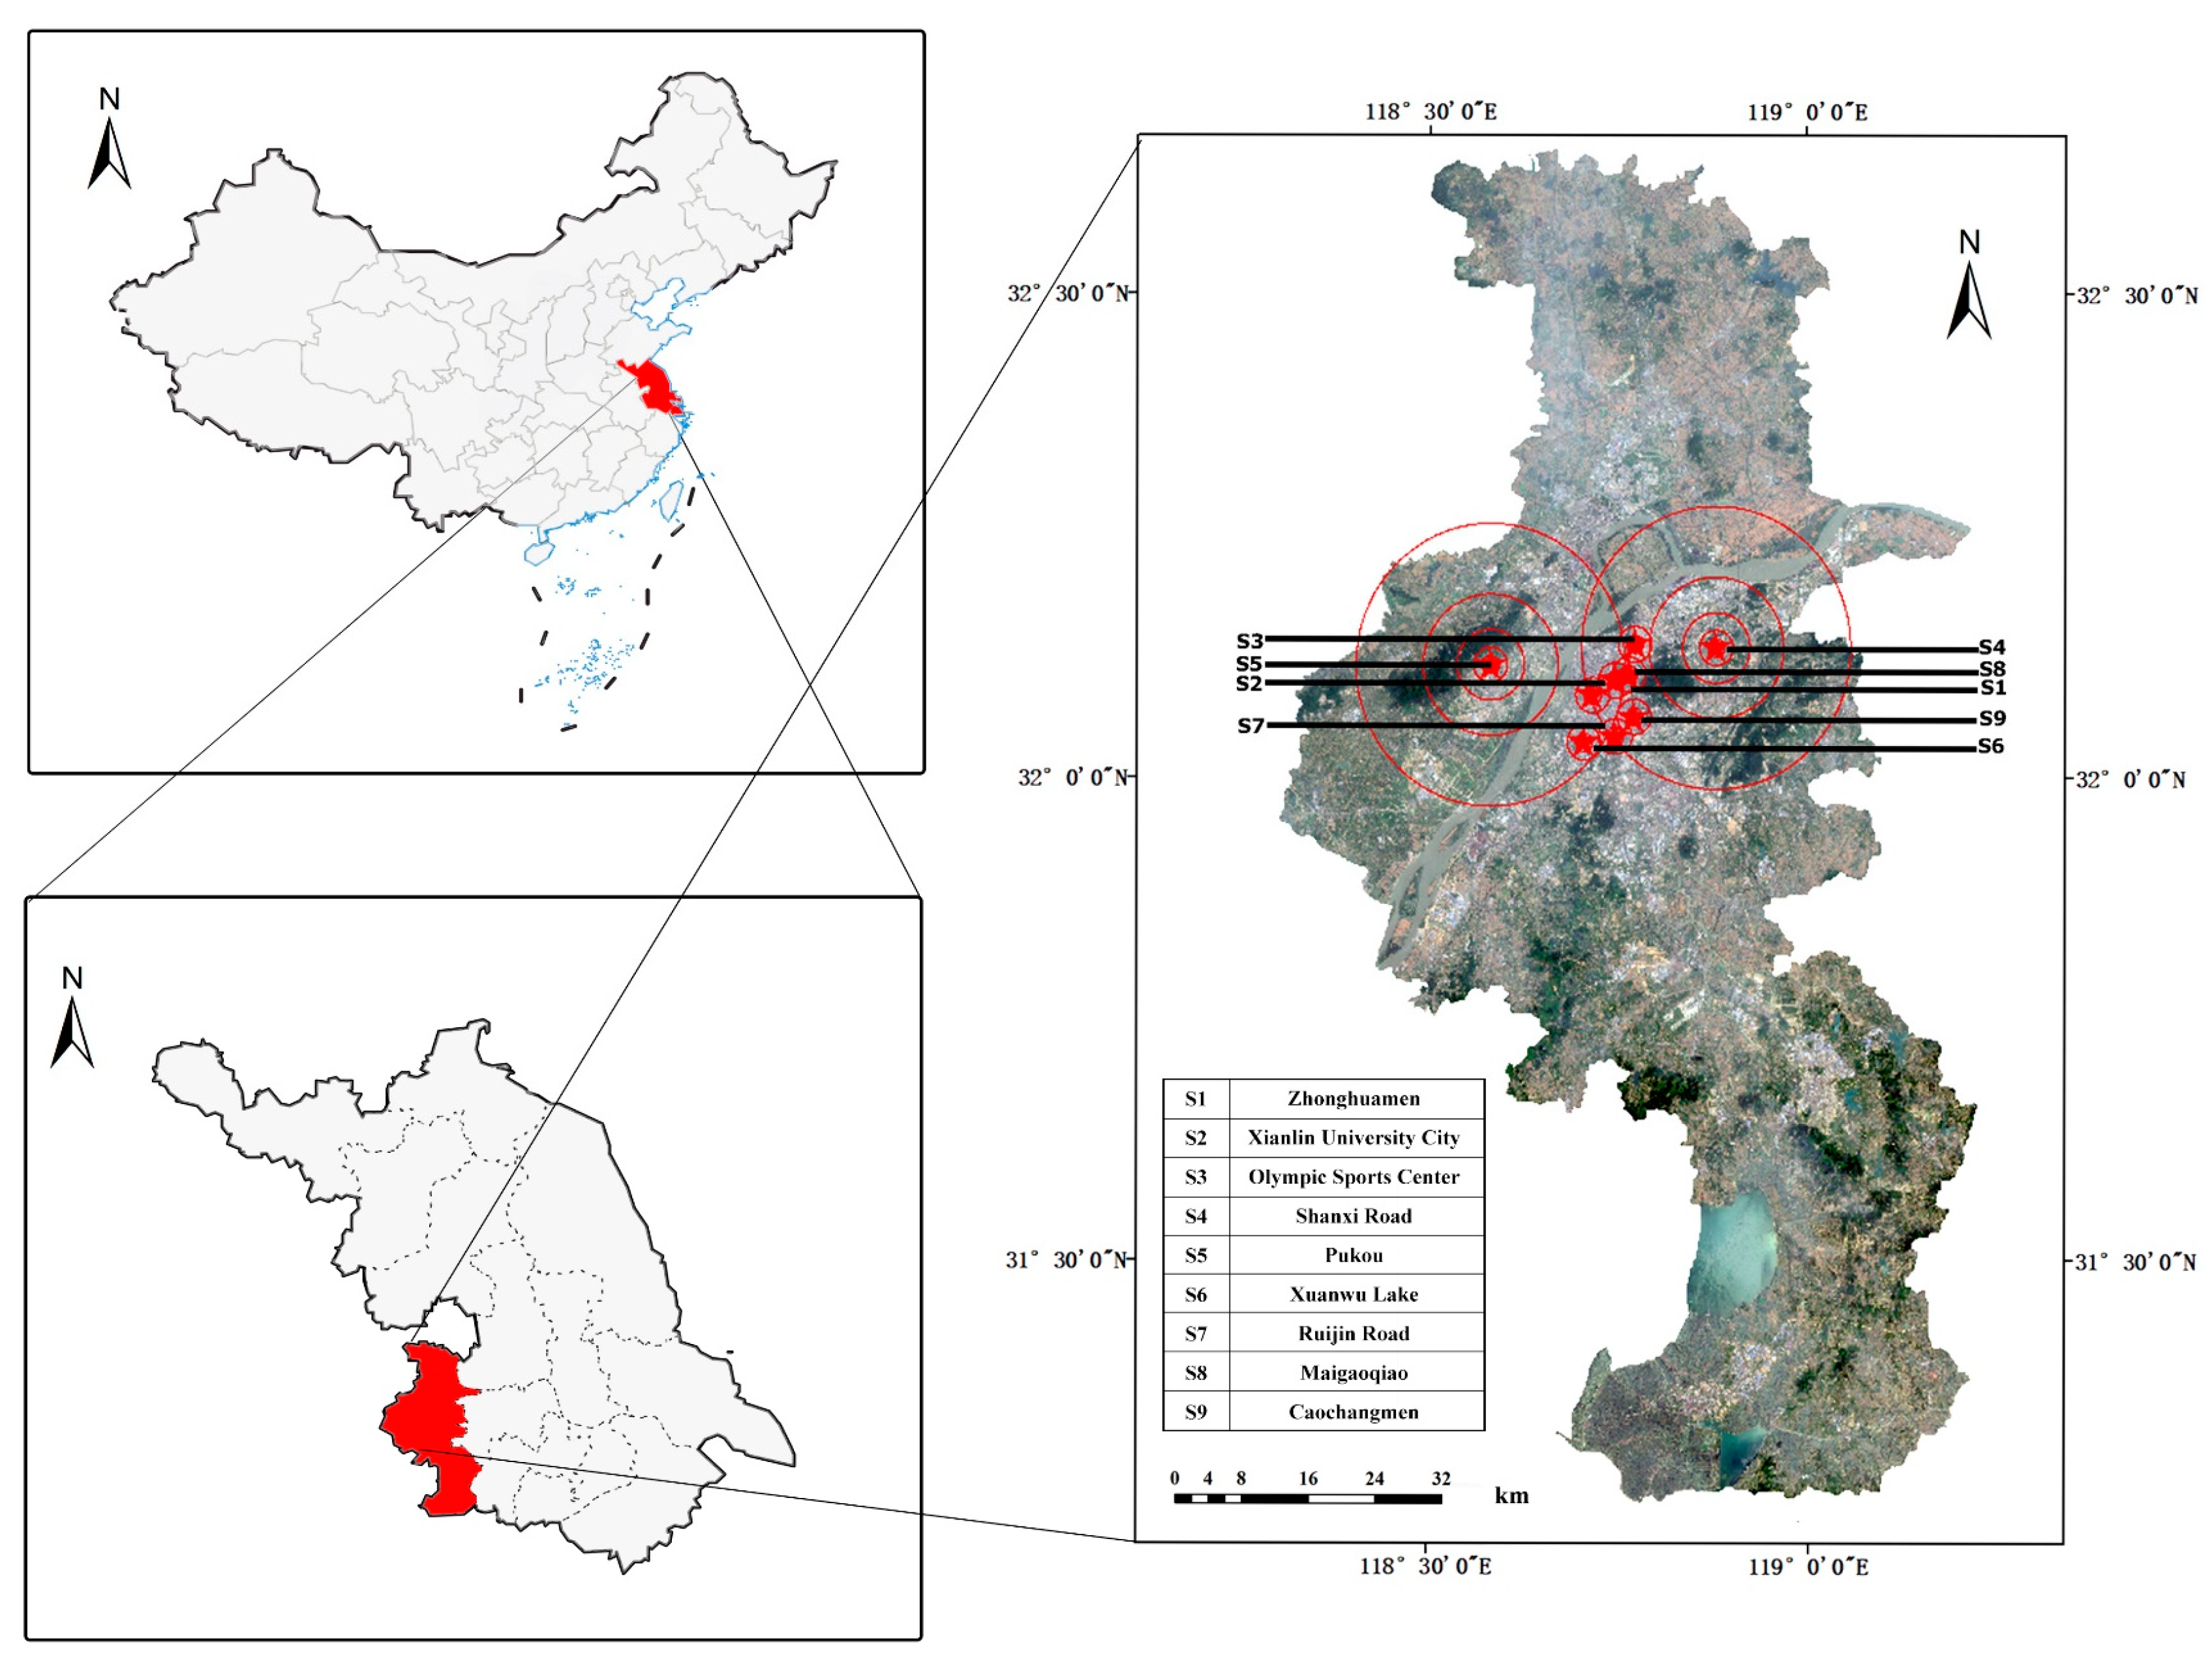
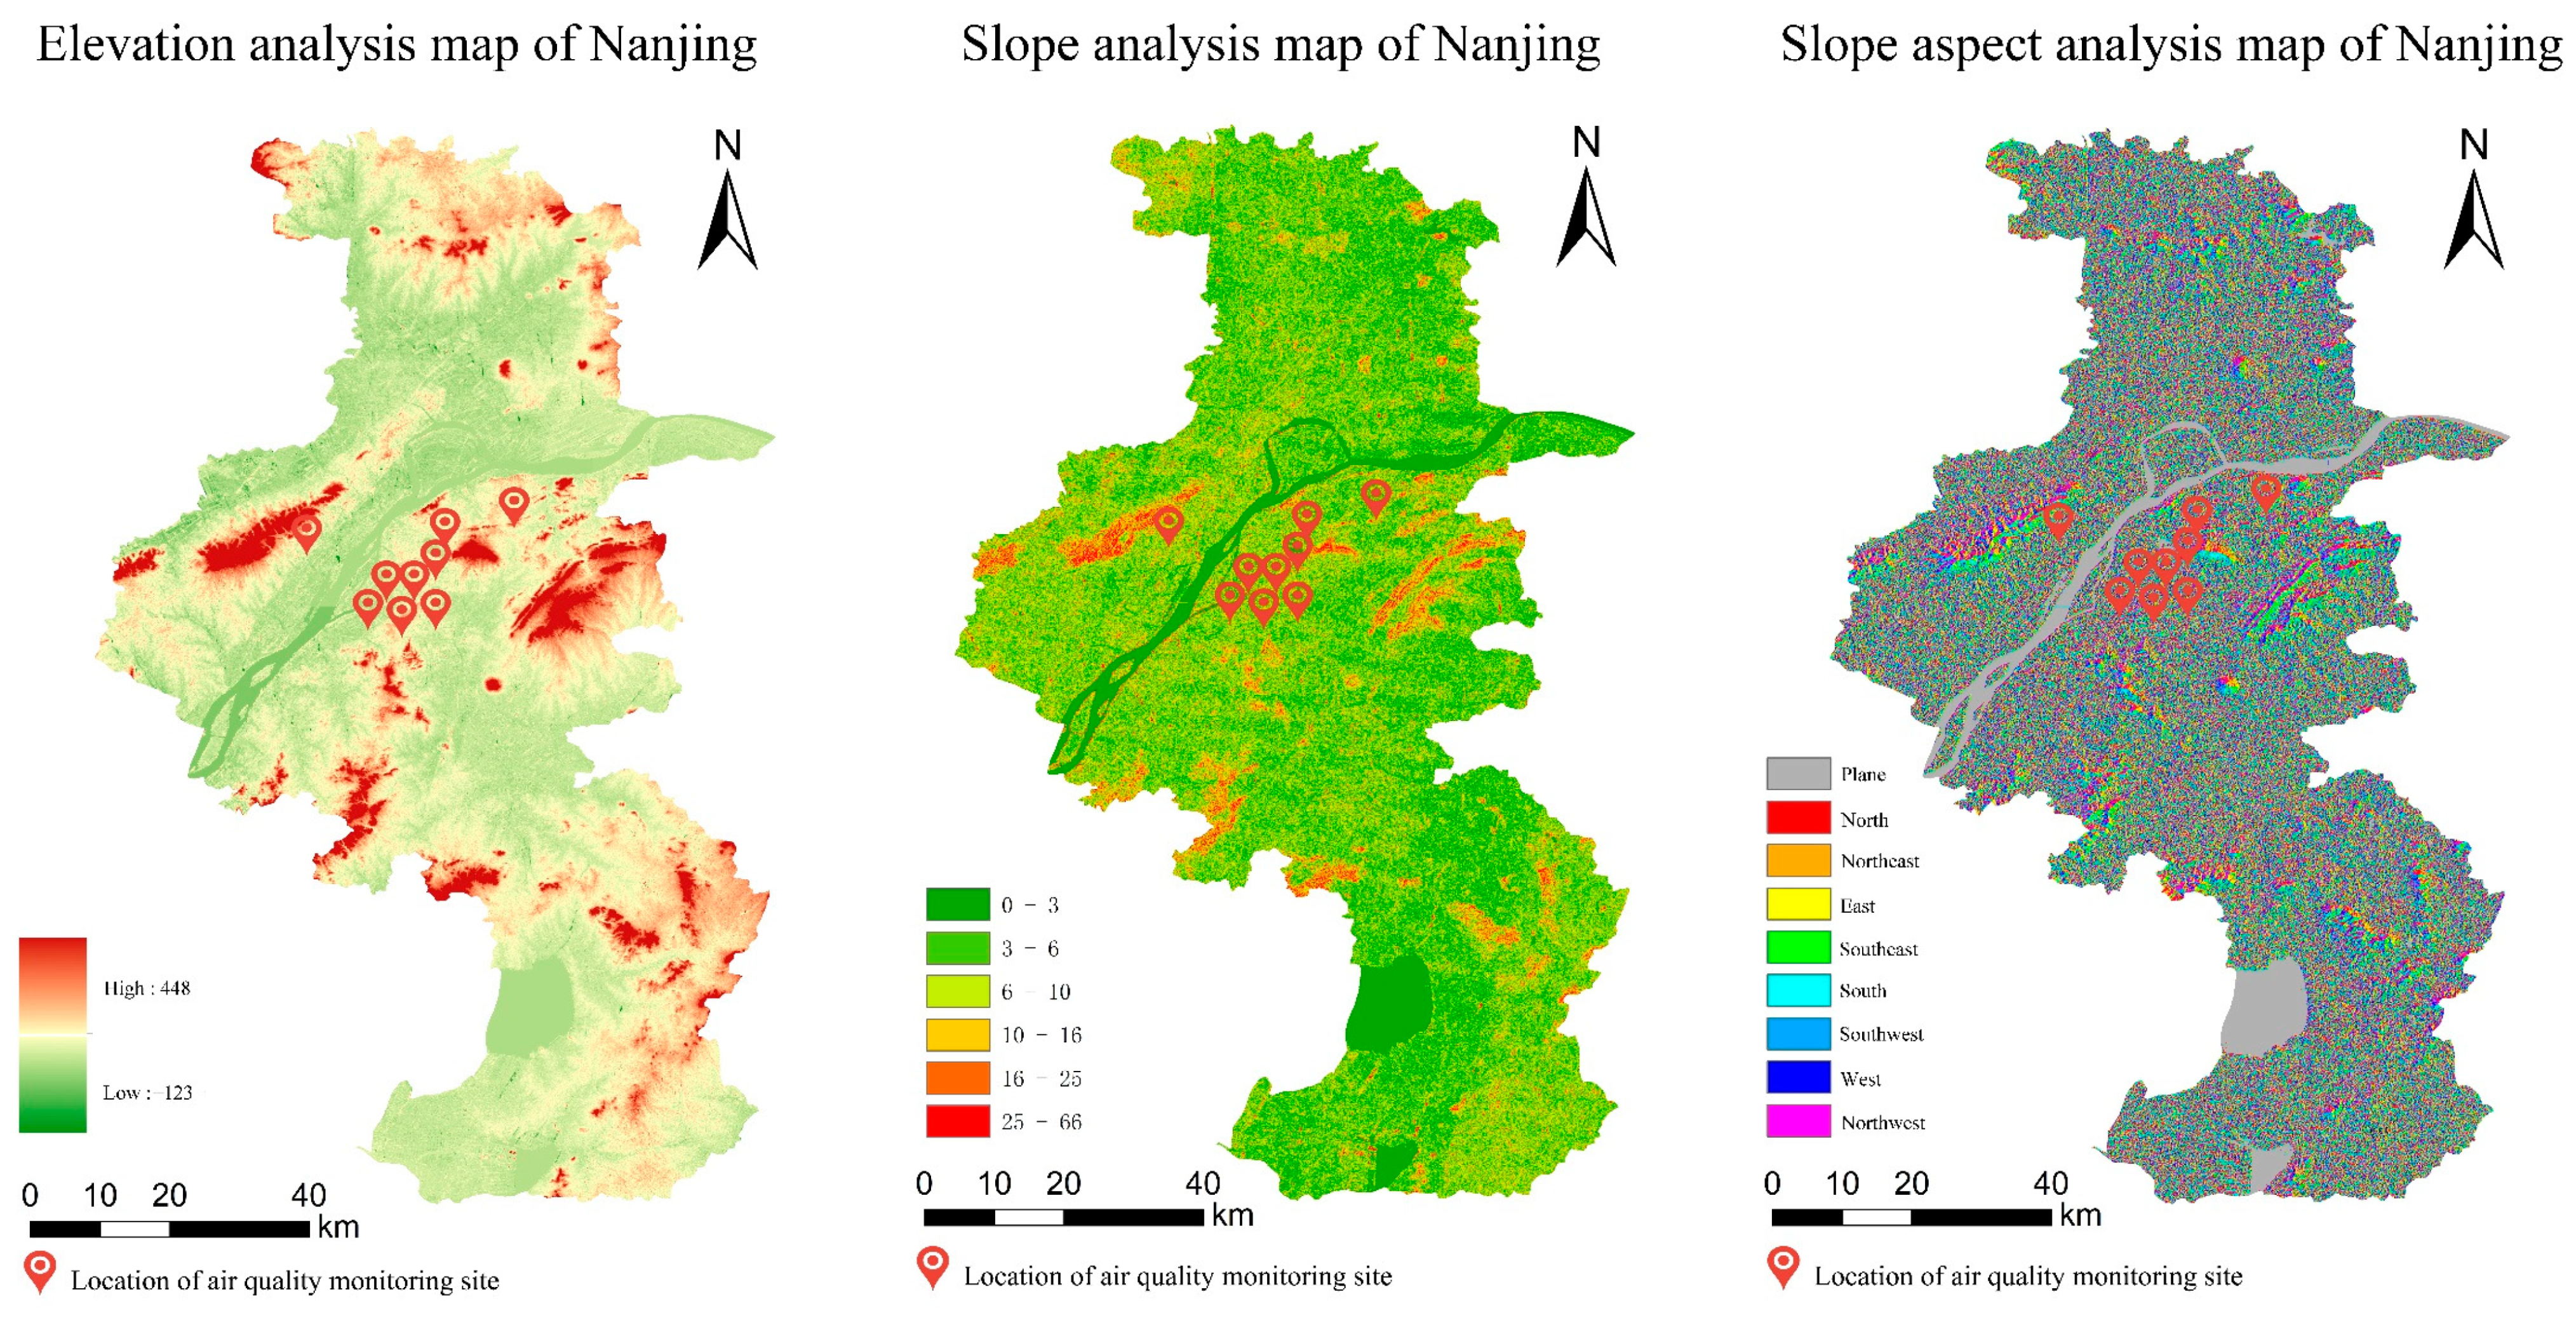
2.1. Study Region

Nanjing, the capital of Jiangsu Province, is situated in eastern China downstream of the Yangtze River. It serves as a catalyst for the development of central and western China, radiating from the Yangtze River Delta. Nanjing resides in the Nanjing–Zhenjiang–Yangzhou Hilly Region, characterized by predominantly flat land, low mountains, and hills, with a diverse array of land uses and covers [39]. Surrounded by mountains on three sides and the river on the remaining side, Nanjing boasts an expansive area of mountains and forest vegetation, forming the foundational framework of its green space system [40]. This study focuses on nine air quality monitoring stations located across different districts in Nanjing, as detailed in Table 1.

2.2. Data Sources

For this study, satellite images from the Landsat 8 Operational Land Imager (OLI) were employed. These images consist of nine spectral bands with a spatial resolution of 30 m, along with a 15 m panchromatic band. The coverage of the imagery spanned an area of 185 × 185 km. These image data were acquired from the Landsat 8 dataset, which is available through the Resources and Environmental Science and Data Center of the Chinese Academy of Sciences (https://www.resdc.cn/, accessed on 16 December 2022). The dataset encompasses the period from 2013 to 2021.
In this study, we employed index calculation techniques and utilized the ENVI 5.3 software, developed by Harris Geospatial, to combine and overlay data from various bands of Landsat 8 spanning the period from 2013 to 2021 in Nanjing. Through index calculation, we derived mean values of NDVI, the ratio vegetation index (RVI), and the green vegetation index (GVI) for the spring, summer, autumn, winter, and annual periods. The analysis primarily focused on the NDVI, air pollutants, and socio-economic data from the summer and winter seasons. Statistical methods were applied to determine the average NDVI values within different buffer zones surrounding each air quality monitoring site.
In this study, the nine monitoring sites served as central points for analysis. For the monitoring sites in the city center, a radial range of 100, 200, 300, 400, and 500 m was selected due to their relatively short distances. On the other hand, the monitoring sites in suburban areas were chosen with radial ranges of 500 m, 1 km, 2 km, 4 km, 8 km, and 16 km as they were spatially further apart. Figure 1 demonstrates that the selection of these ranges ensured that the surface feature categories and NDVI values remained representative, avoiding issues of being too close or too far apart.
Meter-level accurate DEM data were acquired from the Google Maps Elevation API (Figure 2), offering a spatial resolution of 5 m. To generate a Nanjing DEM with precise geographic information, the obtained DEM data underwent processing in ArcGIS 10.8. This involved mask extraction, spatial adjustment, and coordination system specification, resulting in an accurate representation of Nanjing’s terrain. Socio-economic data, including industrial gross value added, GDP per capita, and other relevant information, were sourced from the statistical yearbooks of Nanjing covering the period from 2013 to 2019 [41].

2.3. Data Processing

2.3.1. Determination of NDVI, RVI, and GVI Values

For this study, monitoring points near the city center of Nanjing, specifically along the river basin, were carefully selected. Each monitoring point had a radius ranging from 100 m to 32 km. Among these points, Caochangmen, Shanxi Road, Maigaoqiao, the Olympic Sports Center, the Zhonghuamen, Ruijin Road, and Xuanwu Lake had radii varying from 100 m to 2 km. On the other hand, Pukou and Xianlin University City had radii ranging from 2 km to 32 km. This selection ensured that the indicators obtained from each data point were representative [32]. Using ArcGIS 10.8 software, we calculated various indicators, such as NDVI, RVI, and GVI, within the coverage zones of these monitoring.

2.3.2. Spatiotemporal Distributions and Concentrations of Air Pollutants

The data for the six air pollutants in different areas underwent a screening process to eliminate any missing, abnormal, or invalid entries. The data corresponding to the air pollutants at the nine monitoring points for each year were then classified and screened to determine the concentrations of six specific pollutants: SO2, NO2, CO, O3, PM2.5, and PM10. Mean annual values of pollutant concentrations at each monitoring point were subsequently calculated. The air pollution data were also compared to the Chinese national concentration limits for key ambient air pollutants (Table 2). For the purpose of analysis, data from three years (2013, 2017, and 2021) within the 2013–2021 timeframe were chosen and averaged. To obtain spatial distribution maps illustrating the levels of atmospheric pollutants at each monitoring point in the Nanjing region, the Kriging method was employed for the interpolation of annual mean concentration values. The application of the Kriging interpolation method facilitated the creation of spatial distribution maps depicting the levels of air pollutants at each monitoring point [42].

2.3.3. Heatmap Generation

This study aims to examine the correlations between air pollutants, socio-economic indicators, and NDVI in Nanjing from 2013 to 2021. To assess the socio-economic indicators, we selected six representative variables based on the Nanjing Statistical Yearbook. These indicators include gross industrial product, the first industry, the secondary industry, the third industry, GDP per capita, and urban population density [43,44]. For the generation of the heatmap, we utilized Origin 2022 software.

2.3.4. Correlation Analysis

In order to examine the relationships between air pollutants, minimum, average, and maximum NDVI values in various buffer zones (500 m, 1 km, and 2 km) at the nine monitoring sites and socio-economic indicators in Nanjing, a correlation analysis was conducted. This analysis aimed to determine the strength and direction of the linear relationships between the variables. The correlation coefficient (R2) was utilized, ranging from −1 to 1. The proximity of the r value to 1 or −1 indicates a more substantial positive or negative correlation between the variables, respectively [45].

3. Results and Discussion

3.1. Spatial Characteristics of Air Pollutants in Nanjing

The average daily concentrations of the six air pollutants in Nanjing between 2013 and 2021 were examined, and their spatial distribution and patterns in each area are depicted in Figure 3. Among the nine monitoring points, Ruijin Road exhibited the highest levels of SO2, NO2, CO, and PM2.5, with maximum concentrations of 44 μg/m3 for SO2 and 116 μg/m3 for NO2. The upper range of SO2, NO2, CO, and PM2.5 concentrations fell within the interval of 23, 62, 1.3, and 68 μg/m3, respectively. Based on the “Ambient Air Quality Standards” issued by the Ministry of Environmental Protection of the People’s Republic of China, all nine monitoring points, including residential, mixed-use, cultural, industrial, and rural areas, were classified as “Class 2 areas.” The daily mean concentration limits for SO2 and NO2 in these areas are 150 and 80 μg/m3, respectively. While the mean daily concentration of SO2 fell within the regulatory range, the concentration of NO2 significantly exceeded the standard limit. Although the concentrations of certain air pollutants remained relatively stable within specific intervals at the monitoring points, their magnitudes of change were notably high at certain times. For instance, the maximum PM2.5 concentration at each monitoring point increased by over three times the box model value, primarily between 2013 and 2015. The concentrations of SO2 and NO2, as the critical traffic-related pollutant gases, also demonstrated significant fluctuations exceeding 200% at three monitoring points, namely Ruijin Road, Shanxi Road, and Zhonghuamen, with the fluctuation primarily occurring between 2013 and 2016. This analysis confirms that the spatiotemporal characteristics of different monitoring points influence the concentrations of air pollutants. Among the monitoring points, Maigaoqiao displayed the lowest O3 concentration; however, the steady-state box model values ranged between 47 and 57.7 μg/m3, with a peak value of 176 μg/m3, indicating an increase of over 300%. The O3 concentration did not exhibit significant variations across the nine points.
Spatial distribution maps were generated to depict the locations of the different districts where the monitoring points were situated (Figure 4). Between 2013 and 2021, all six pollutant concentrations exhibited a downward trend. The highest concentrations of CO and NO2 at the monitoring points decreased from 1.17 mg/m3 and 54.13 μg/m3 to 0.92 mg/m3 and 38.49 μg/m3, respectively. The concentration of O3 initially increased and then decreased, reaching a peak value of 77.38 μg/m3 in 2017 before decreasing to 67.72 μg/m3 in 2021. Notably, the PM10 concentration exhibited the most significant reduction, declining from a maximum value of 103.77 μg/m3 in 2013 to 76.77 μg/m3 in 2021. The highest concentration of SO2 decreased from 38.24 μg/m3 in 2013 to 7.54 μg/m3 in 2021, while the PM2.5 concentration similarly decreased from 74.85 μg/m3 to 33.24 μg/m3. Overall, Pukou District and Qixia District displayed the best ambient air quality, while Xuanwu District and Gulou District had relatively poorer air quality. Significantly, the concentration of environmental air pollutants gradually decreased from the center to the surrounding areas of the central urban region.
In this study, nine monitoring sites were carefully selected to ensure accurate measurements of pollutants across different spatial scales [46,47]. The results revealed variations in the concentrations of the six air pollutants among these sites in Nanjing. Ruijin Road and Shanxi Road stood out as locations with notably higher pollutant levels. In contrast, recreational areas like Xuanwu Lake showcased relatively low pollutant concentrations. As expected, monitoring sites near roads, densely populated areas, and industrial zones exhibited higher pollutant levels compared to standard values due to exhaust and industrial emissions. Conversely, areas with well-designed landscape patterns demonstrated lower pollutant concentrations. The monitoring sites located near roads and densely populated urban areas showed more pronounced intensity in pollutant concentration and sensitivity. These findings align with Zhao, Y.Y. et al., who conducted a similar analysis on the influence of socio-economic activities on air pollutants [48]. Previous studies have also reported significant outcomes by employing a radial buffer range of 3 km to study air pollutants, such as PM2.5, and assess vegetation patterns and urban green spaces [49].

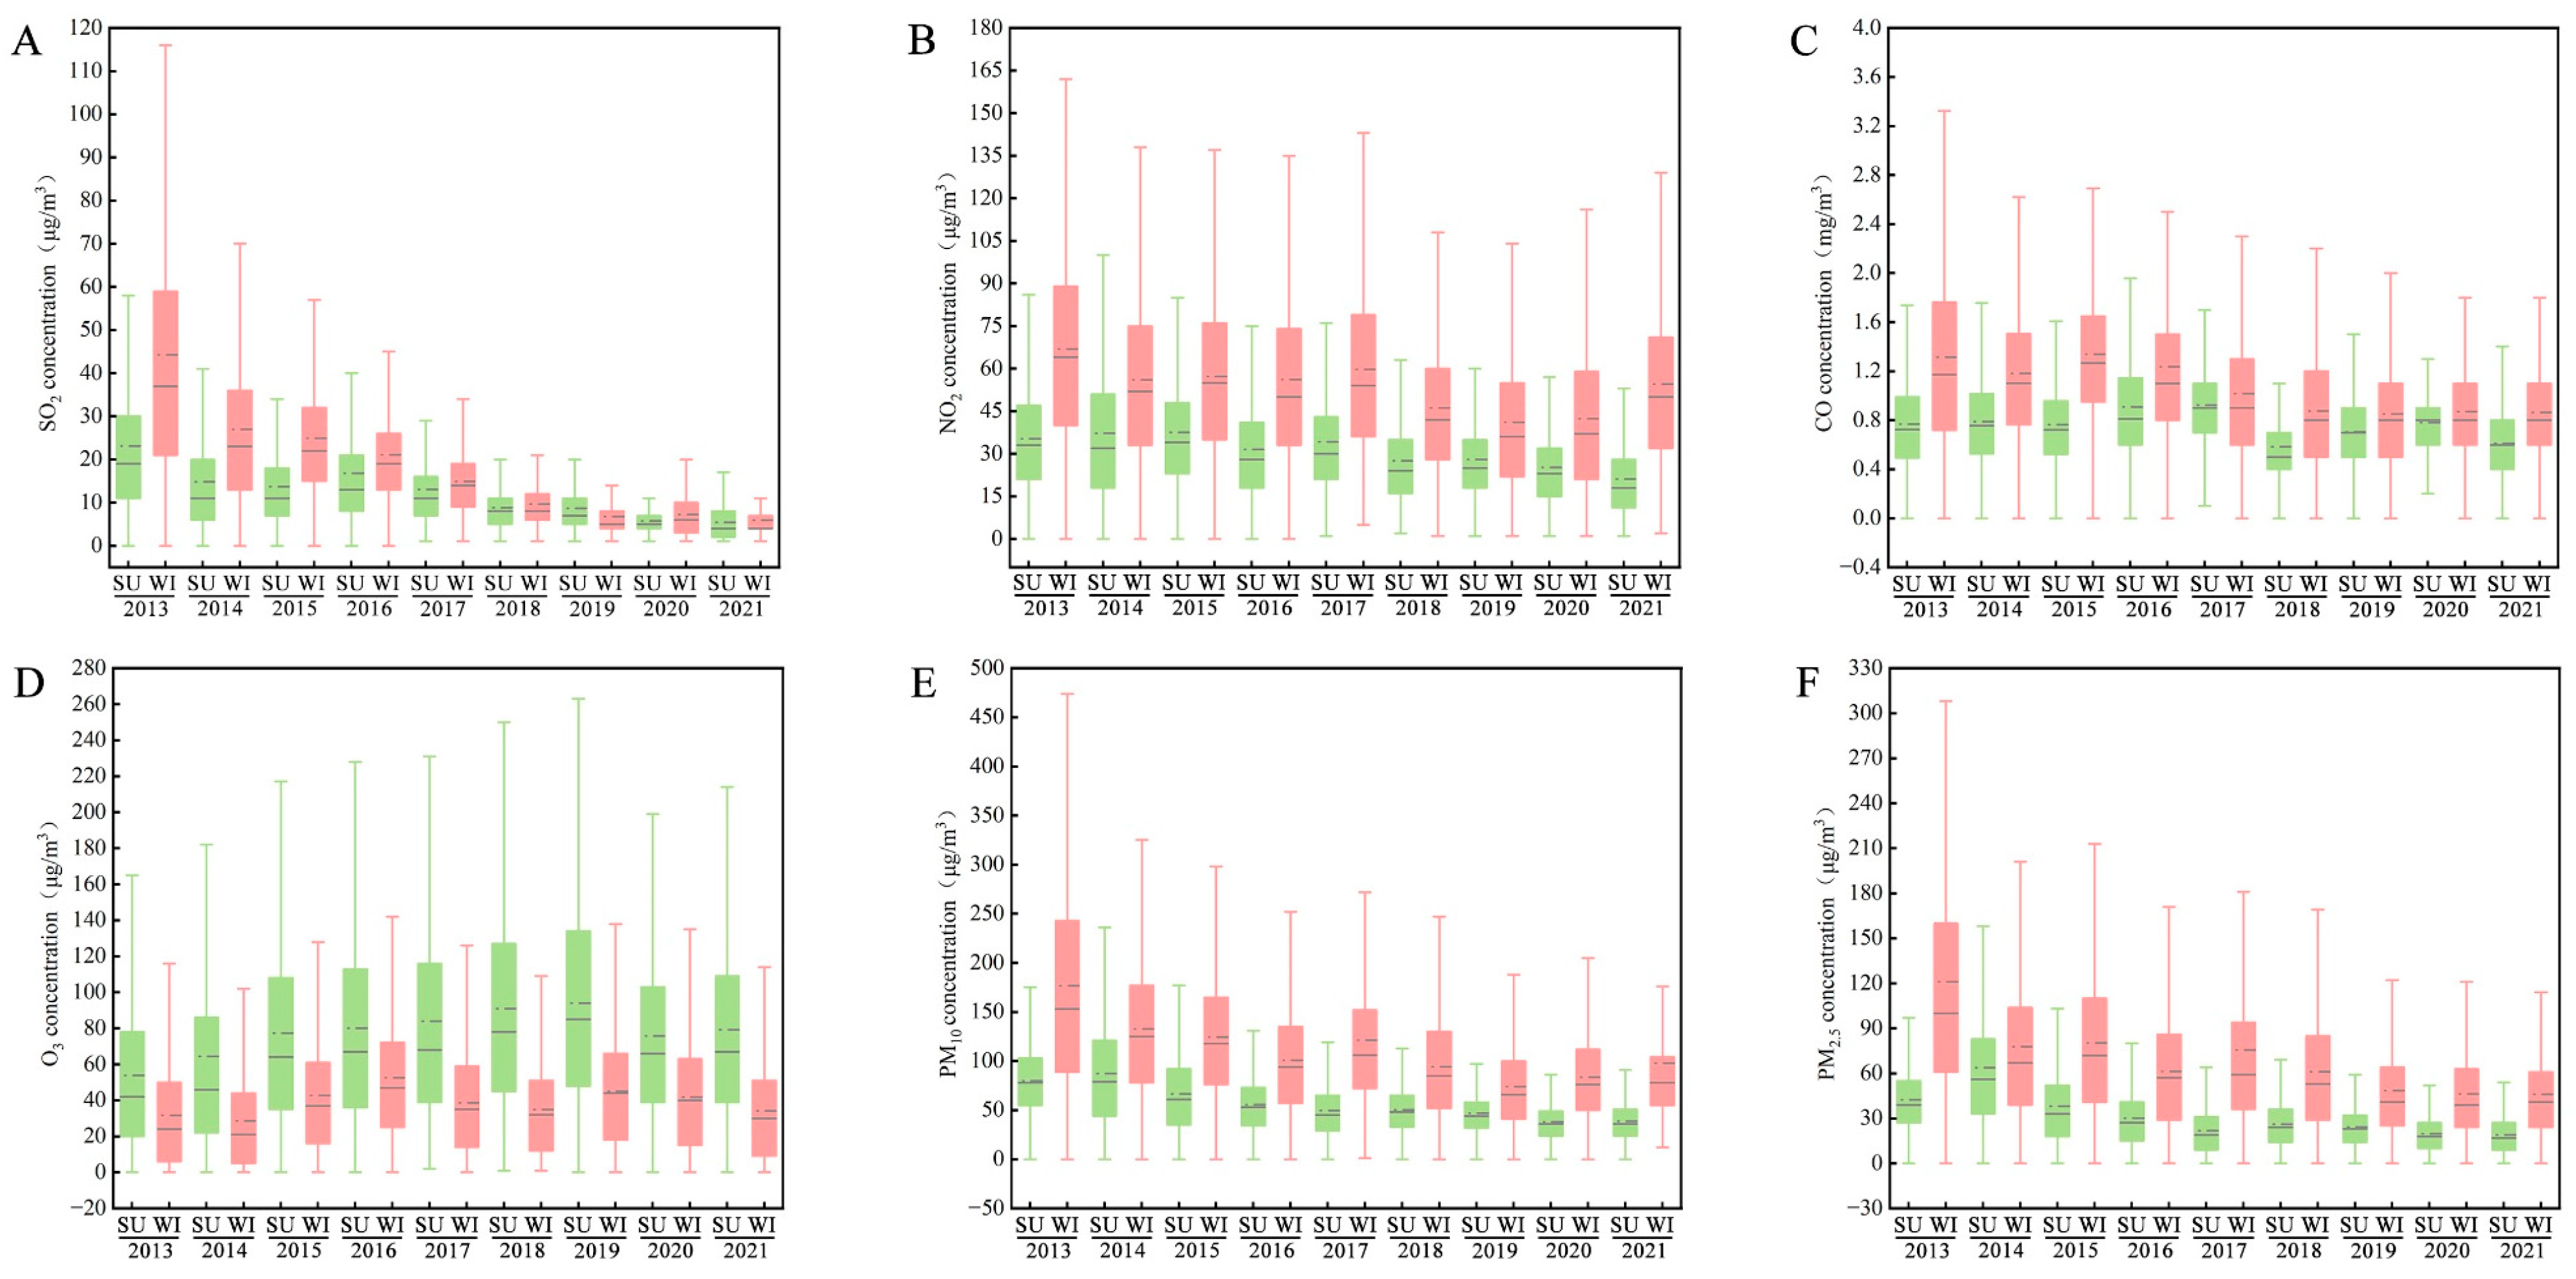
3.2. Temporal Variation Patterns of Air Pollutants in Nanjing

Based on long-term meteorological data, the study period was divided into winter (December–February) and summer (June–August) seasons. The seasonal fluctuations in NO2, CO, SO2, PM2.5, and PM10 (except for O3) between 2013 and 2021 exhibited a consistent pattern, with higher concentrations observed in winter and lower concentrations in summer (Figure 5). Throughout the entire period, the mean concentration of SO2 was highest in the winter of 2013, peaking at 44.25 μg/m3. However, by 2021, both the mean summer and winter concentrations of SO2 were low and similar, measuring 5.4 and 5.9 μg/m3, respectively. The concentration of SO2 gradually decreased over time during both winter and summer seasons. The mean concentration of NO2 in summer exhibited a clear downward trend, reaching 21.05 μg/m3 in 2021, which was below the secondary emission standard for NO2. In contrast, the average concentration of NO2 in winter was 66.95 μg/m3 in 2013 and remained relatively stable at around 54 μg/m3 until 2021. The summer concentration of CO exhibited a gradual decline with slight fluctuations ranging from 0.6 to 0.9 mg/m3. In contrast to other air pollutants, the variation in the concentration of O3 differed, with lower levels observed in winter and higher levels in summer. Starting from 2013, the concentration of O3 continuously increased, reaching its peak of 263 μg/m3 in the summer of 2019. Both PM2.5 and PM10 showed similar variations, with their highest concentrations occurring in winter each year. In the winter of 2013, the maximum values of PM2.5 and PM10 were recorded as 30 and 474 μg/m3, respectively. Over the course of the study, both PM2.5 and PM10 concentrations decreased in both winter and summer seasons.
The study examined the average concentration of seasonal pollutants and determined that in summer, the concentrations of PM2.5, SO2, NO2, CO, and PM10 were lower compared to winter. These results align with a previous study by Liu et al., which also found a notable negative correlation between air temperature and the concentrations of PM2.5, SO2, NO2, and other pollutants in Luoyang [50]. In this study, it was observed that seasonal summer winds exhibited greater intensity and frequency compared to winter winds. Similar findings were reported by Tao et al. [51], who also noted that during winter, air pollutant dispersion was not apparent in the absence of consistent wind direction, resulting in higher pollutant accumulation. Analyzing the yearly time dimension, a gradual decrease in the concentrations of PM2.5, SO2, NO2, CO, and PM10 was observed. Notably, the decrease in SO2 concentration was the most remarkable, with a reduction of approximately 75% between 2013 and 2021. The remaining four pollutants displayed less fluctuation but exhibited an overall decreasing trend over time. Since the occurrence of a rare haze event in East China in 2013, Nanjing has taken swift measures towards industrial restructuring and accelerated economic transformation [52]. The Nanjing Municipal Government has implemented a series of progressive environmental protection policies and measures, such as the “13th Five-Year Plan for Ecological Environment Protection in Nanjing” (2016) and the “Nanjing Environmental Protection Regulations” (2017). As a result, the quality of the ecological environment in Nanjing has consistently improved over the years [53]. However, unlike other air pollutants, concentrations of O3 increased. O3 was the only pollutant with higher concentrations in summer compared to winter. These findings align with the studies conducted by Xu et al. in Chongqing and Shao et al. in Jiazhangkou [54,55]. The higher concentrations of O3 in summer can be attributed to the elevated temperatures and intense solar radiation, which provide favorable conditions for its formation. Overall, the concentrations of air pollutants were higher in winter than in summer, primarily due to the drier climate and lower wind speeds during winter, as well as human-induced factors like vehicle exhaust emissions and heating [56]. The overall efficiency of vegetation in removing pollutants was also lower during winter compared to summer.

3.3. Analysis of NDVI, GVI, and RVI Indexes in Nanjing

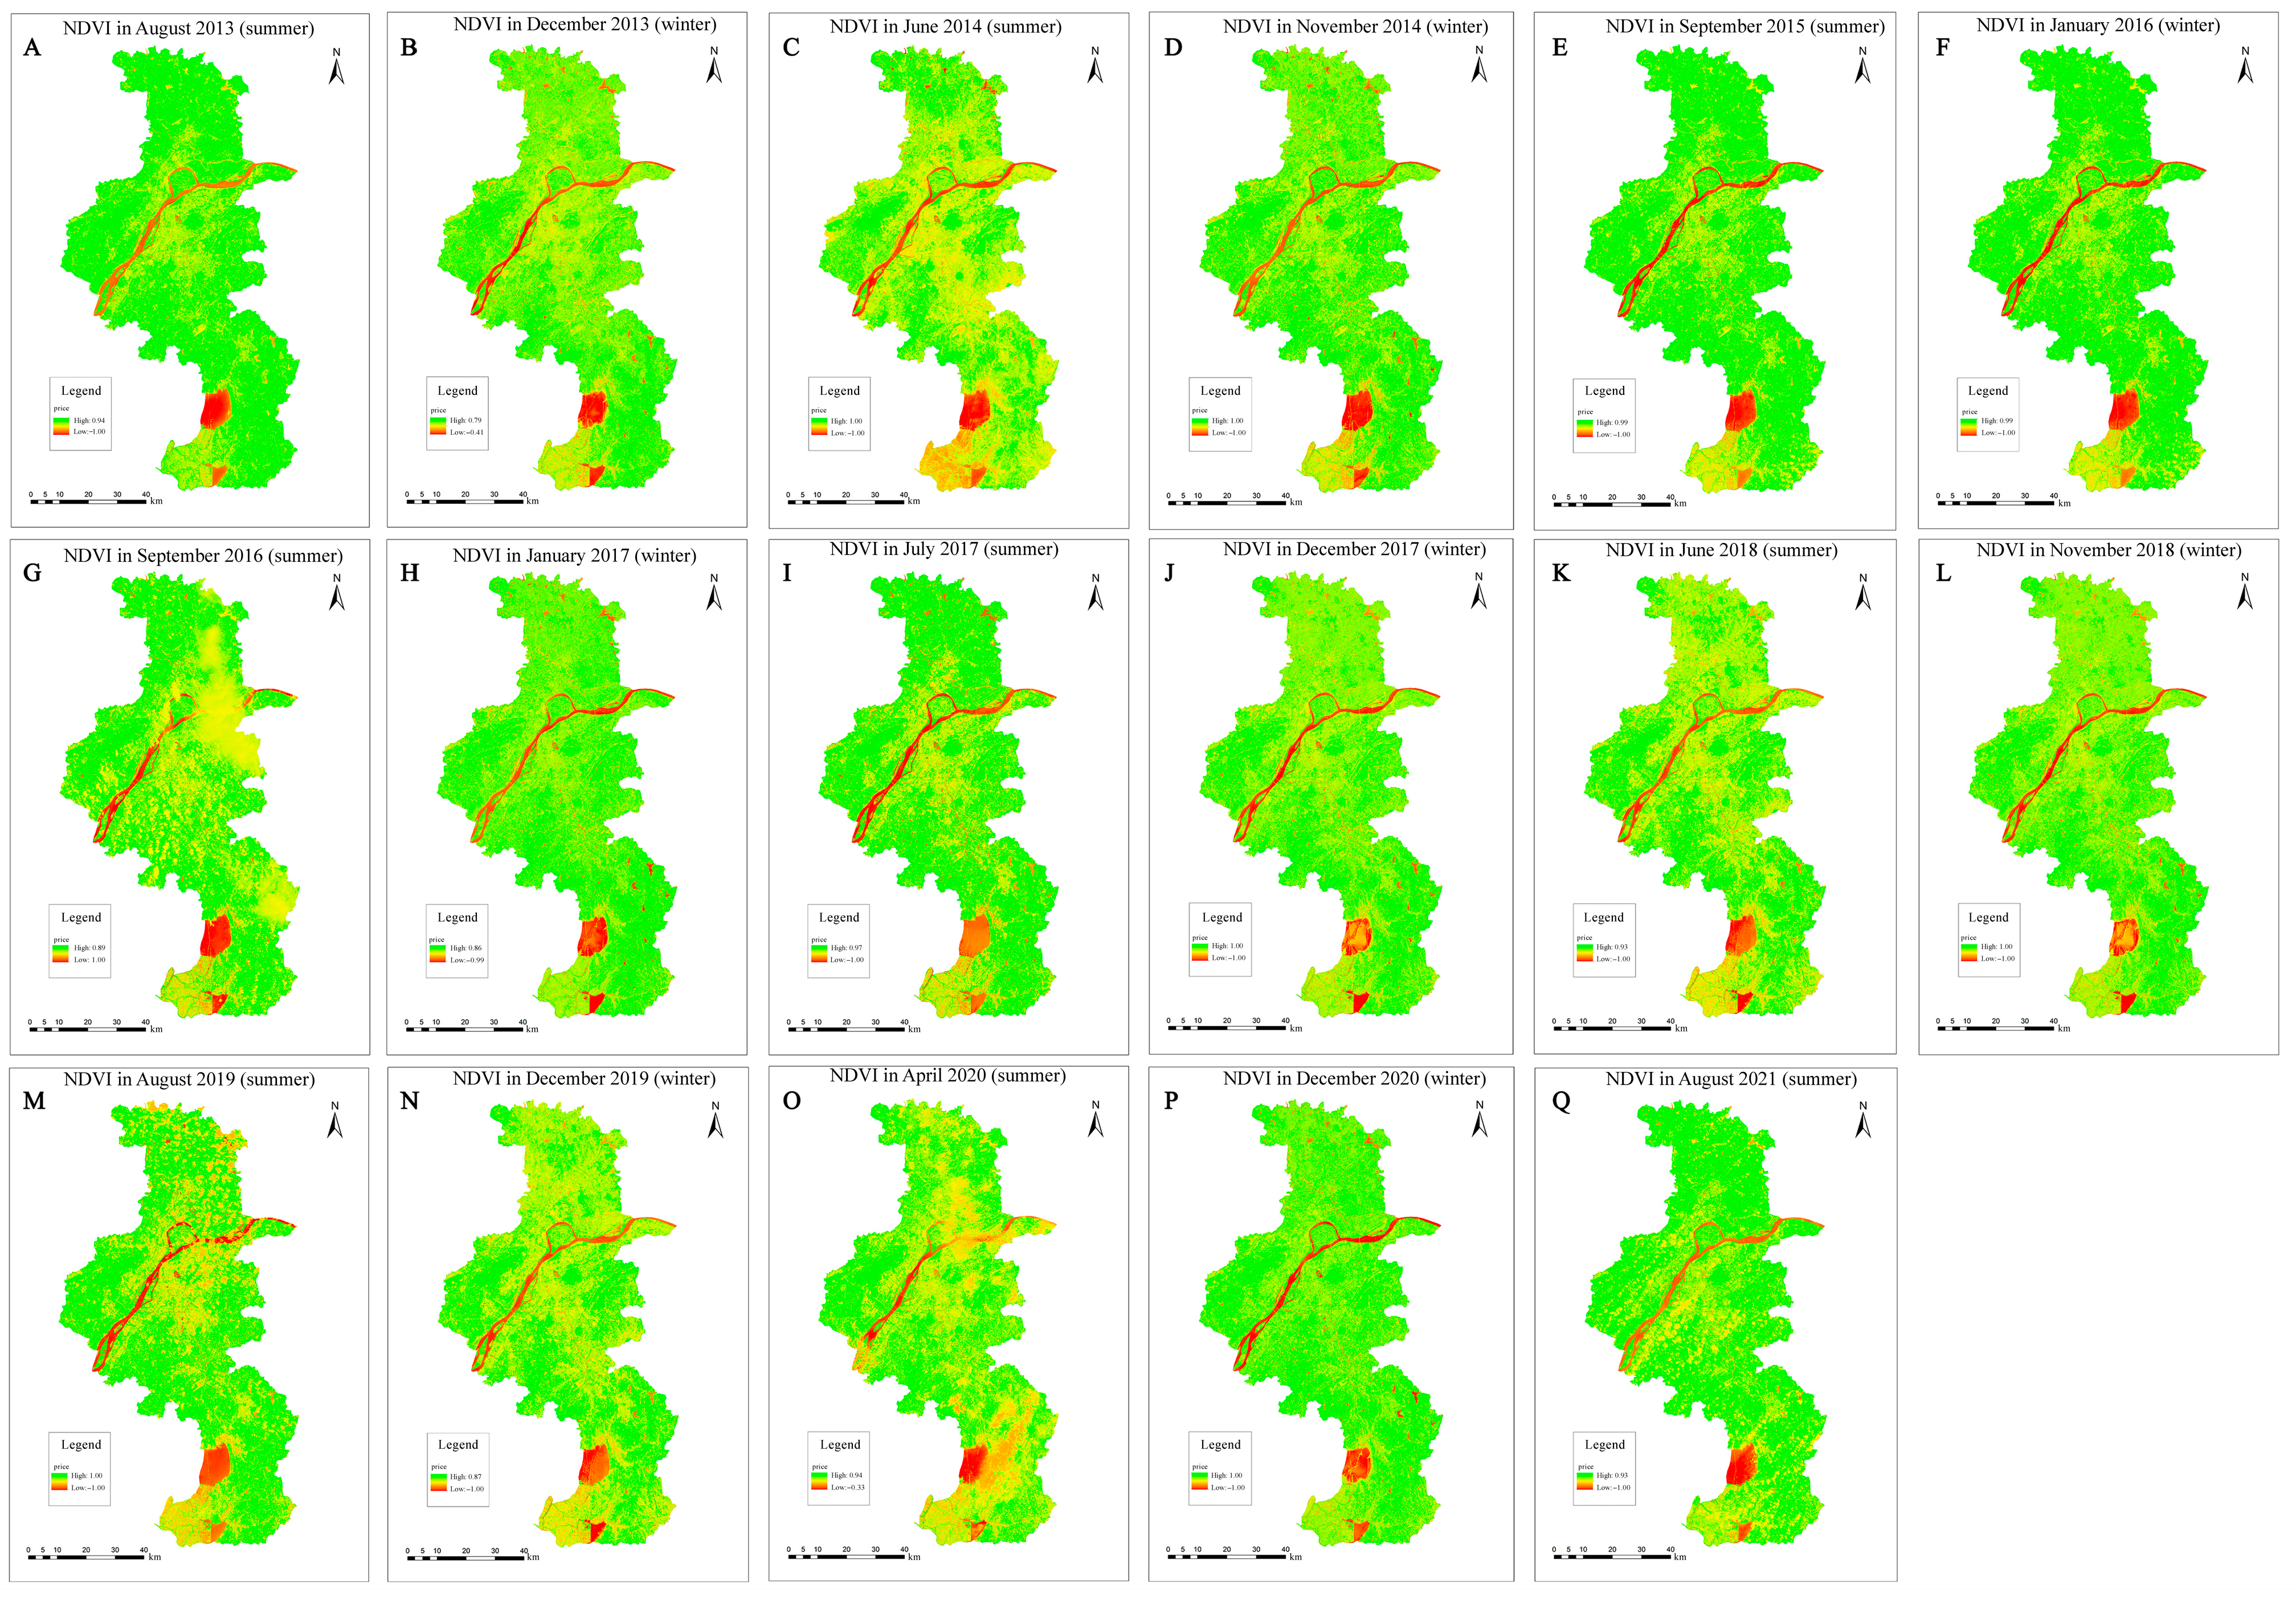
3.3.1. NDVI Variation

Figure 6 presents the spatial pattern of NDVI values in Nanjing from 2013 to 2021. The pattern observed was as follows: the north region exhibited the highest values, followed by the west, east, and south regions. In terms of seasonal variation, the overall variation was lower during winter compared to summer. The maximum NDVI value ranged between 0.79 and 1, with the lowest value recorded in 2013. Conversely, the minimum NDVI value ranged between −1 and −0.33, with −1 being the lowest except for the winter of 2013 (−0.41) and the summer of 2020 (−0.33). Specifically, the northwestern part of Nanjing, characterized by forest land, displayed high NDVI values. In the eastern area, where farmland predominates, the NDVI values were higher during the summer and autumn. The central area along the river, primarily composed of built-up land, exhibited a low NDVI value, indicating poor vegetation cover and a limited ability to reduce surface dust. Finally, the southwestern area, which mainly comprises water bodies, notably Shijiu Lake, also displayed a low NDVI value.
In this study, variations in land use classes were found to correspond to variations in vegetation cover. The Xuanwu Lake area, designed and managed as a recreational site, exhibited high NDVI values and relatively low concentrations of air pollutants. The spatial analysis of NDVI displayed lower values in areas with limited vegetation cover, such as lakes, farmlands, and densely built-up areas. As depicted in Figure 7, there was no significant disparity in NDVI between summer and winter. Zheng et al. [57] discovered that climate factors, including precipitation and temperature, influence the vegetation index in the China–Pakistan Corridor, with the correlation between precipitation and temperature being more robust than that of temperature alone. The relatively minor variance in NDVI between summer and winter may be attributed to insufficient rainfall in recent years or potentially influenced by other factors like human activities.

3.3.2. RVI Variation

Figure 7 illustrates that the RVI values attained their peak in the northern part of the city and recorded their lowest values in the central region. Regarding seasonality, the RVI values were lower in winter compared to summer. The summer of 2014 saw the highest RVI value of 255, marking an 85% increase in comparison to the RVI value recorded during the winter of the same year. From the summer of 2013 to the summer of 2021, there was a notable decrease in the highest RVI value, declining from 36.312 to 23.501, reflecting a 22% decrease. In contrast to summer, the maximum RVI value witnessed an 88% increase from the winter of 2013 to the winter of 2020, rising from 7.961 to 126. Notably, the winter of 2020 recorded the highest RVI value among all winters within the nine-year period. In general, the index values exhibited substantial variation, aside from the relatively consistent RVI values observed in the northwest and southeast regions of the city. Furthermore, the vegetation index values were lower in the area north of the Yangtze River compared to its southern counterpart. Overall, the RVI value was significantly lower during winter than during summer.

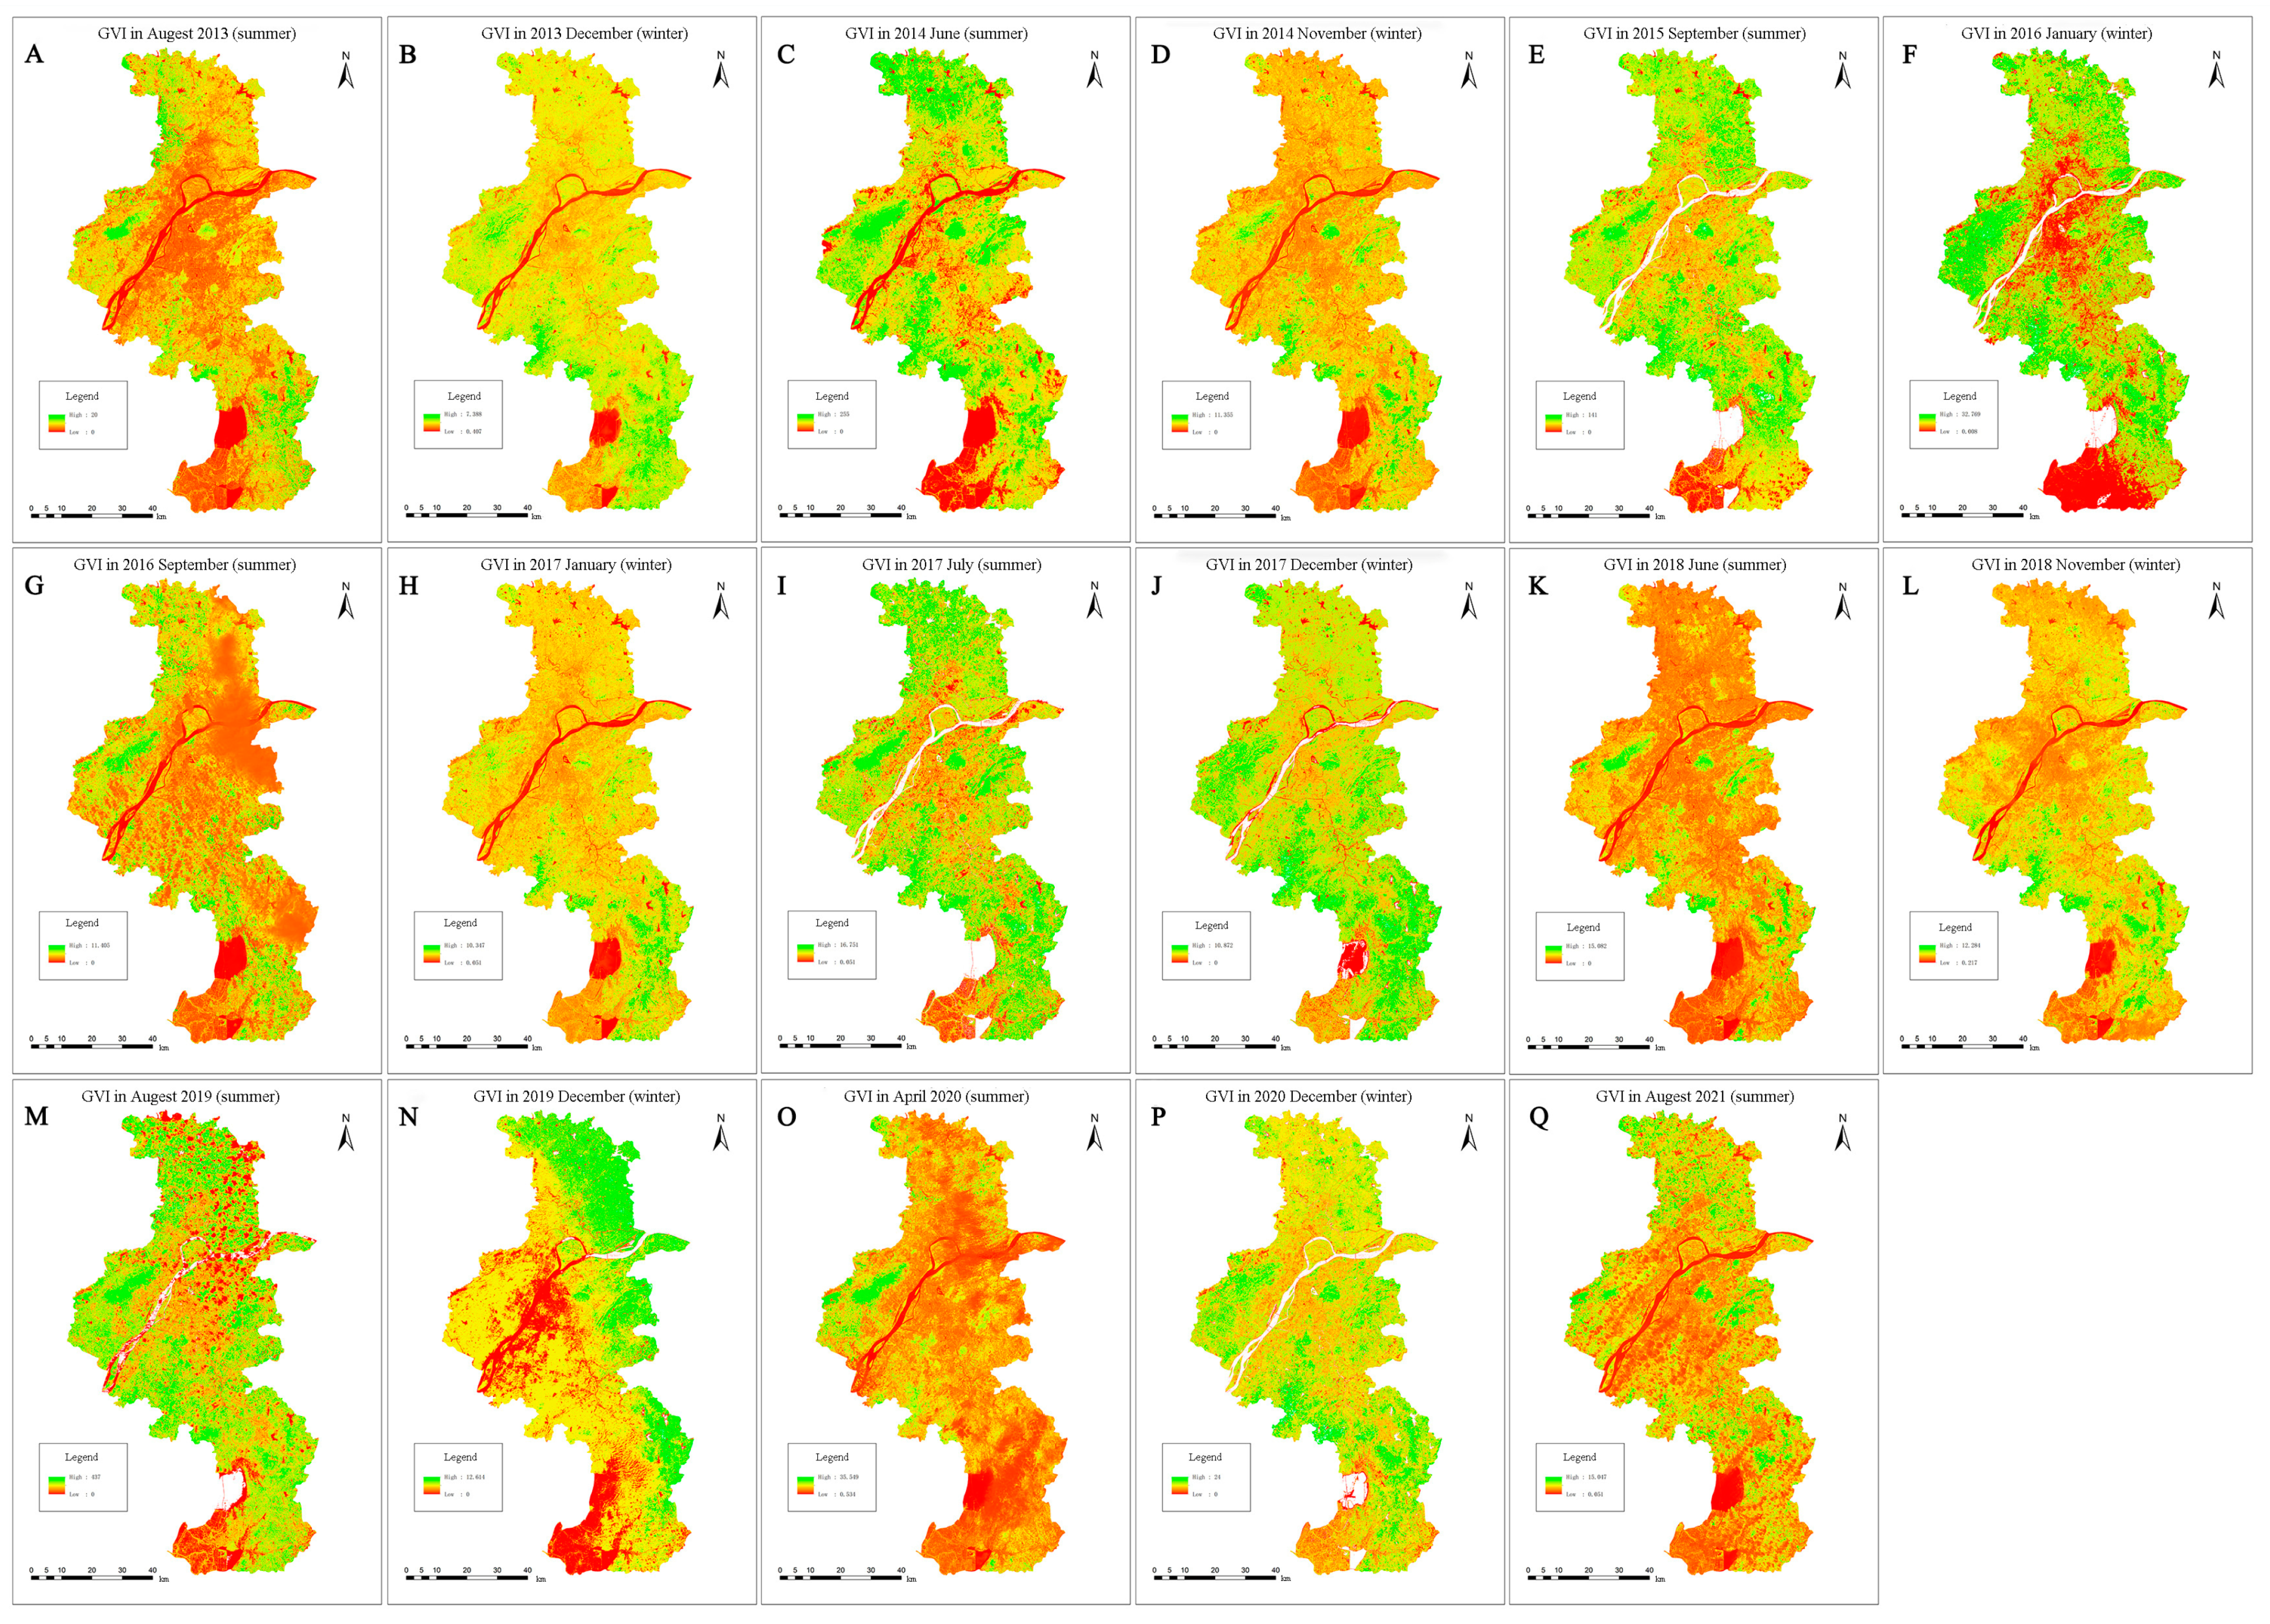
3.3.3. GVI Variation

The GVI serves as a means to assess the level of plant greenness. As depicted in Figure 8, there was an overall upward trend in the GVI values over time, which exhibited a partial positive correlation with the seasonal variations observed in the RVI values. To illustrate, the RVI values for the summers of 2014, 2015, and 2019 exceeded the GVI values for the other summers, recording values of 255, 141, and 457, respectively. The maximum GVI values for the remaining summers fell within the range of 11.405 to 35.549. In contrast, the GVI values during winter demonstrated an increasing pattern over time. The highest GVI value was observed in the winter of 2013, reaching 7.388, while in the winter of 2020, it reached 24, presenting a 53% increase. Comparatively, the GVI values were higher during summer than in winter, and the central area exhibited lower GVI values in contrast to the surrounding areas with higher values.

3.4. Effects of Vegetation Indices on Air Pollutants

Given the intricate spatiotemporal interactions between urban landscape patterns and atmospheric effects [58], urban planning must be formulated and implemented while considering the interconnectedness of all ecosystem components. Similarly, the complexity lies in the multitude of factors and their interactions within the urban landscape, influencing its capacity to mitigate air pollutants. The vegetation index serves as a means to assess the association between vegetation cover and plant growth vitality, with consideration for multiple aspects related to air pollution. Through data processing with ArcGIS 10.8 software, it was observed that external factors exerted a more substantial influence on the spatial distributions of GVI. RVI demonstrated a weaker sensitivity to areas with limited vegetation cover. Conversely, NDVI exhibited a closer relationship with vegetation distribution and dynamics compared to the other indices. Consequently, this study focused on exploring the correlations between NDVI and air pollutants.

3.4.1. Correlation Analysis of NDVI and Air Pollutants

Based on the findings from the linear regression model, which was selected as the best fit for all three buffer zones and the six air pollutants (refer to Table 3), the relationships between NDVI and the minimum and average concentrations of the six pollutants were characterized by relatively low R2 values. However, within the 500 m distance range, the maximum NDVI values demonstrated stronger correlations with the concentrations of SO2, PM10, and PM2.5, with respective R2 values of 0.6280, 0.6350, and 0.6881. These findings suggest that these three pollutants exhibit a strong alignment with the NDVI values. In the 1 km distance range, while the correlation between NDVI and CO concentration was low, the R2 values for the remaining five pollutants were all above 0.5. Notably, the correlation between PM2.5 and NDVI exceeded 0.8. Furthermore, in the 2 km buffer zone, the R2 values between each air pollutant and NDVI were consistent with those observed in the 1 km range. Overall, the expansion of the buffer zone resulted in an increasing trend in both NDVI values and the fitting results for the six pollutants.

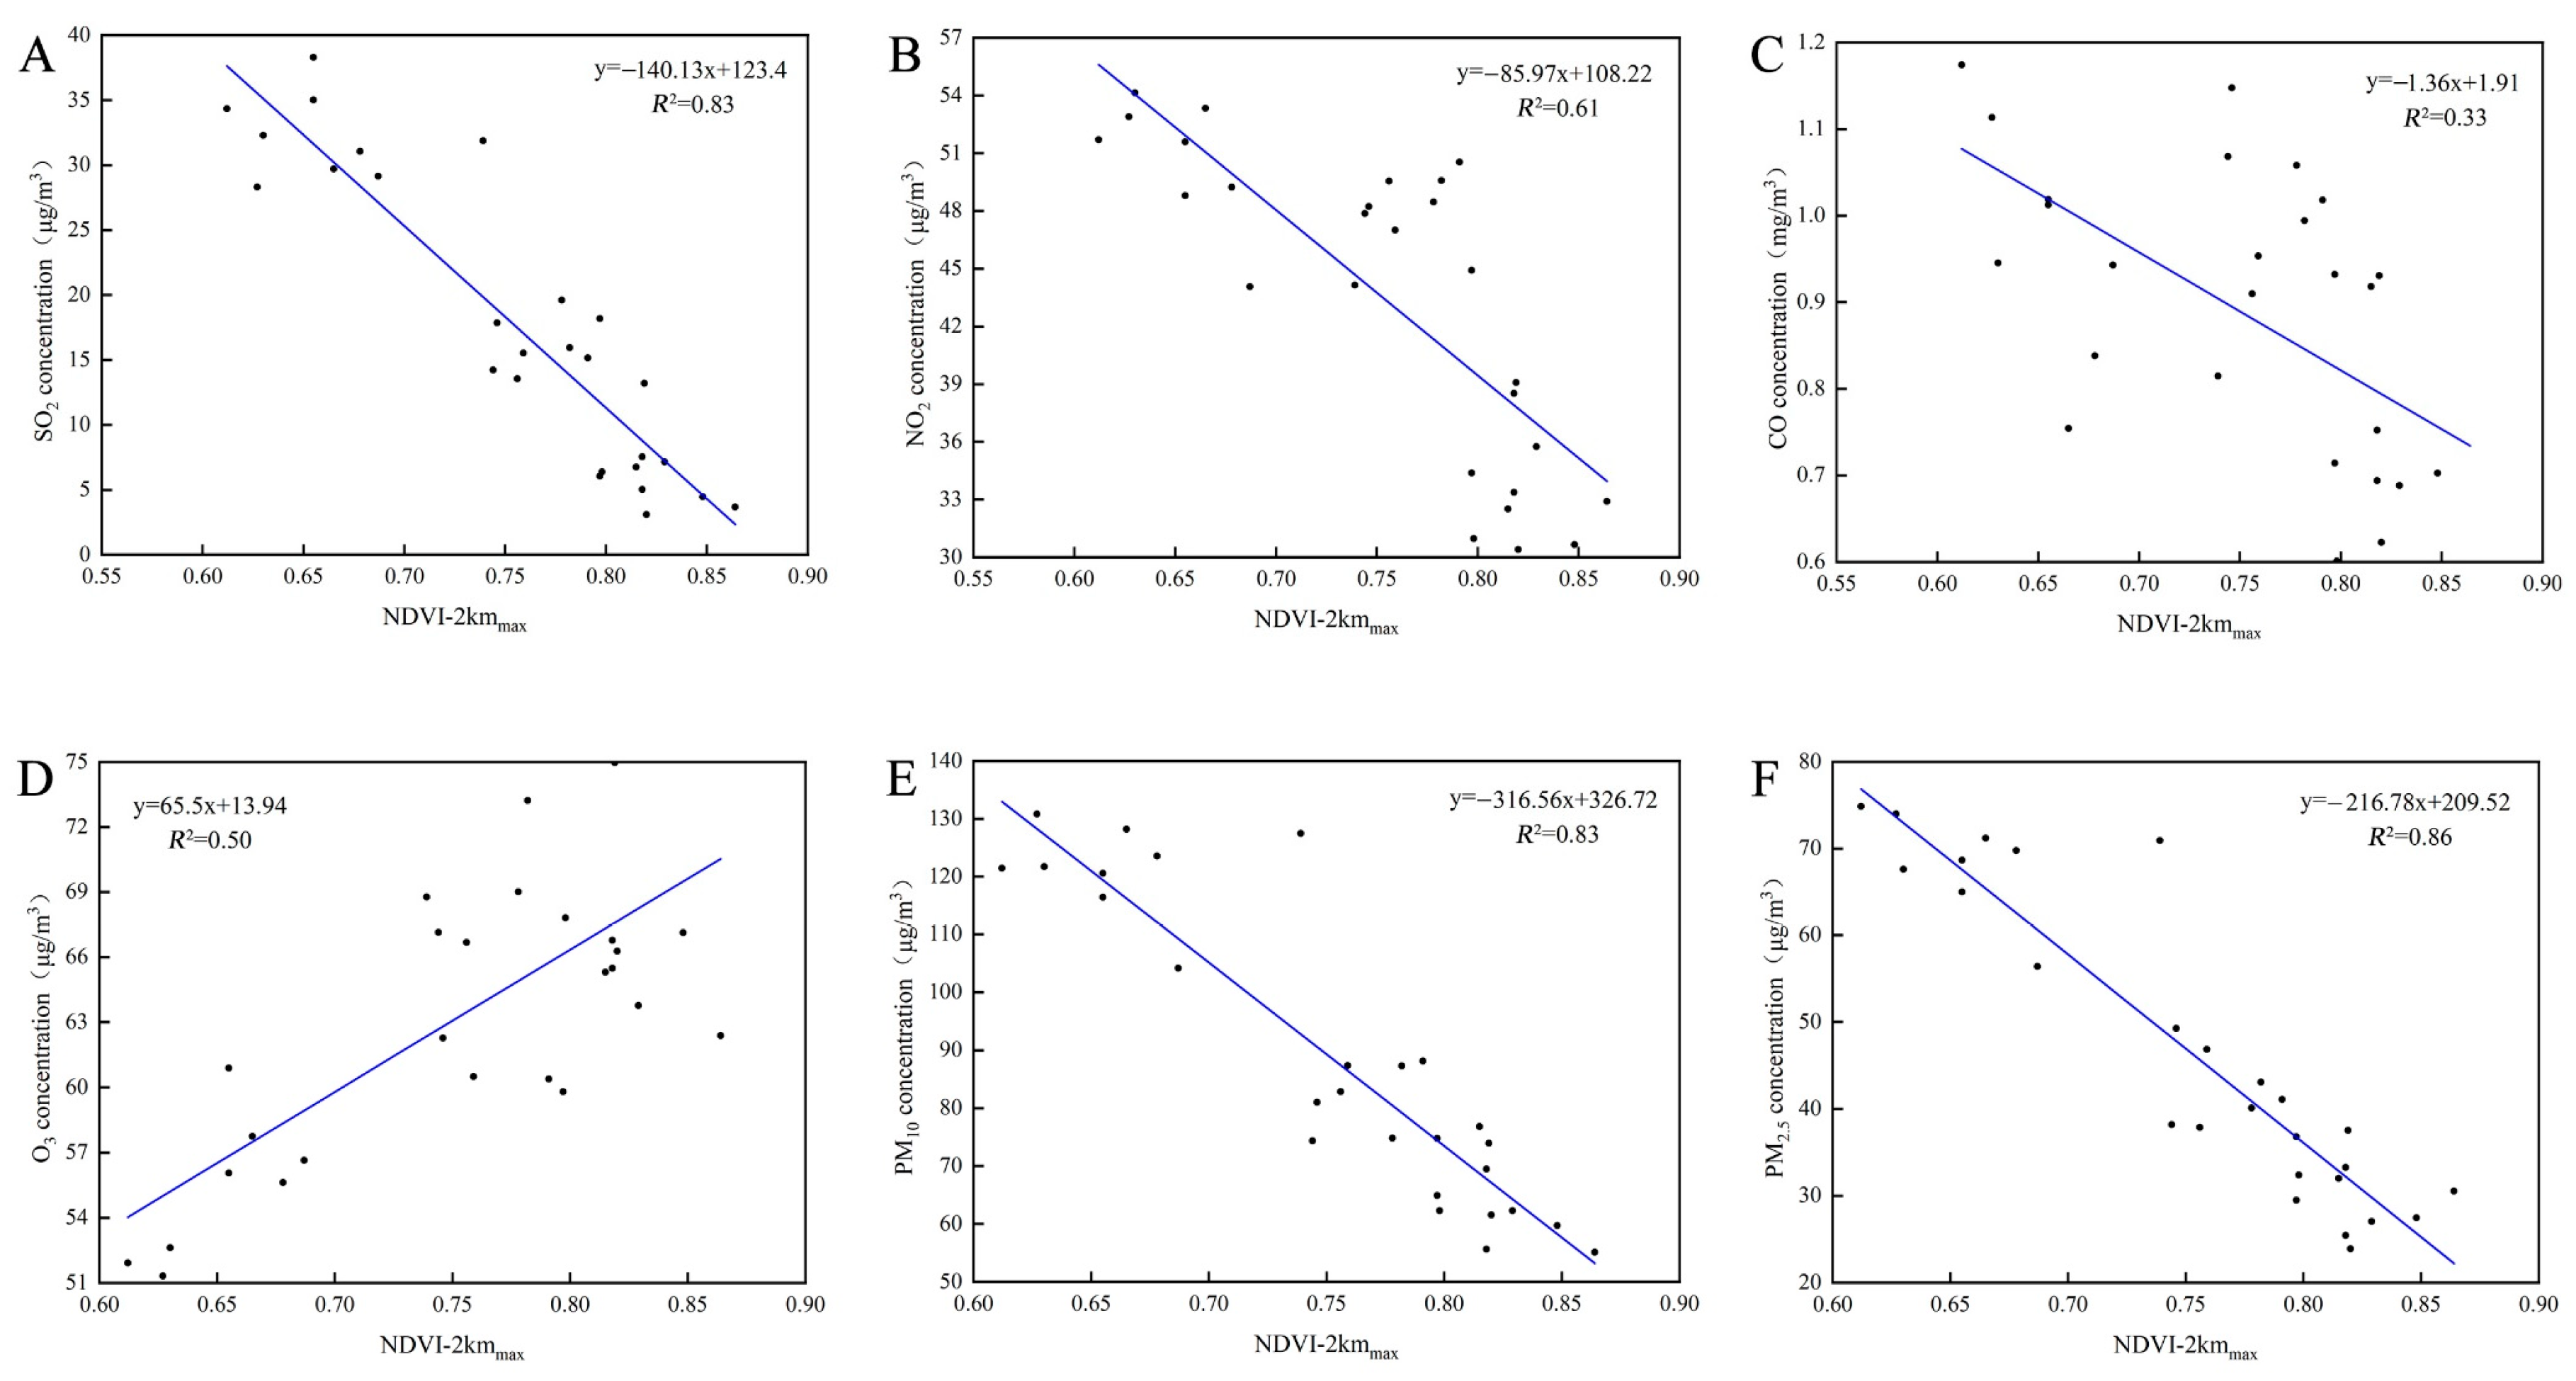
3.4.2. Effects of NDVI on Air Pollutants

Within the range of 500 m to 2 km from the monitoring sites, significant correlations between NDVI and SO2, PM2.5, and PM10 were observed. Given the relatively stable relationships between NDVI and each air pollutant in the 2 km range, our analysis focused on this specific range. As depicted in Figure 9, a decreasing trend in SO2, NO2, CO, PM10, and PM2.5 concentrations, particularly the latter two, was evident as NDVI levels increased. This pattern can be attributed to the implementation of the “Air Pollution Prevention and Control Action Plan,” which has contributed to reducing air pollutants, notably PM2.5, in Nanjing. Figure 10 displays small statistical dispersions for PM2.5, PM10, and NDVI, with respective R2 values of 0.83 and 0.86. Consistent with Zang et al. (2021), who explored Henan Province, PM2.5 and PM10 demonstrated significant negative correlations with NDVI and precipitation [59]. In our study, the relationship between CO and NDVI exhibited a large statistical dispersion, with an R2 value of only 0.33. This discrepancy may be attributed to the lower concentrations of CO itself, making it more susceptible to other factors not extensively examined in this study, such as land management practices [60] and dust emissions [61]. Notably, among all pollutants, O3 displayed a positive correlation with NDVI (R2 = 0.5). This finding aligns with the results reported by Miao et al. [62]. However, their study indicates that the relationship between O3 pollution levels and vegetation growth was insignificant. Distinct from other pollutants, the increased concentrations of O3 noted in our study emphasize its potential as a primary factor influencing air quality.

3.5. Correlation Analysis of NDVI, Air Pollutants and Socio-Economic Data

Currently, numerous scholars employ NDVI values as indicators to assess vegetation growth, development, environmental and ecological changes, as well as to analyze their correlation with atmospheric pollutants and socio-economic factors [63,64,65]. In light of this, the present study aims to delve deeper into the correlation between NDVI values and atmospheric pollutants alongside local socio-economic data, specifically in the context of Nanjing.

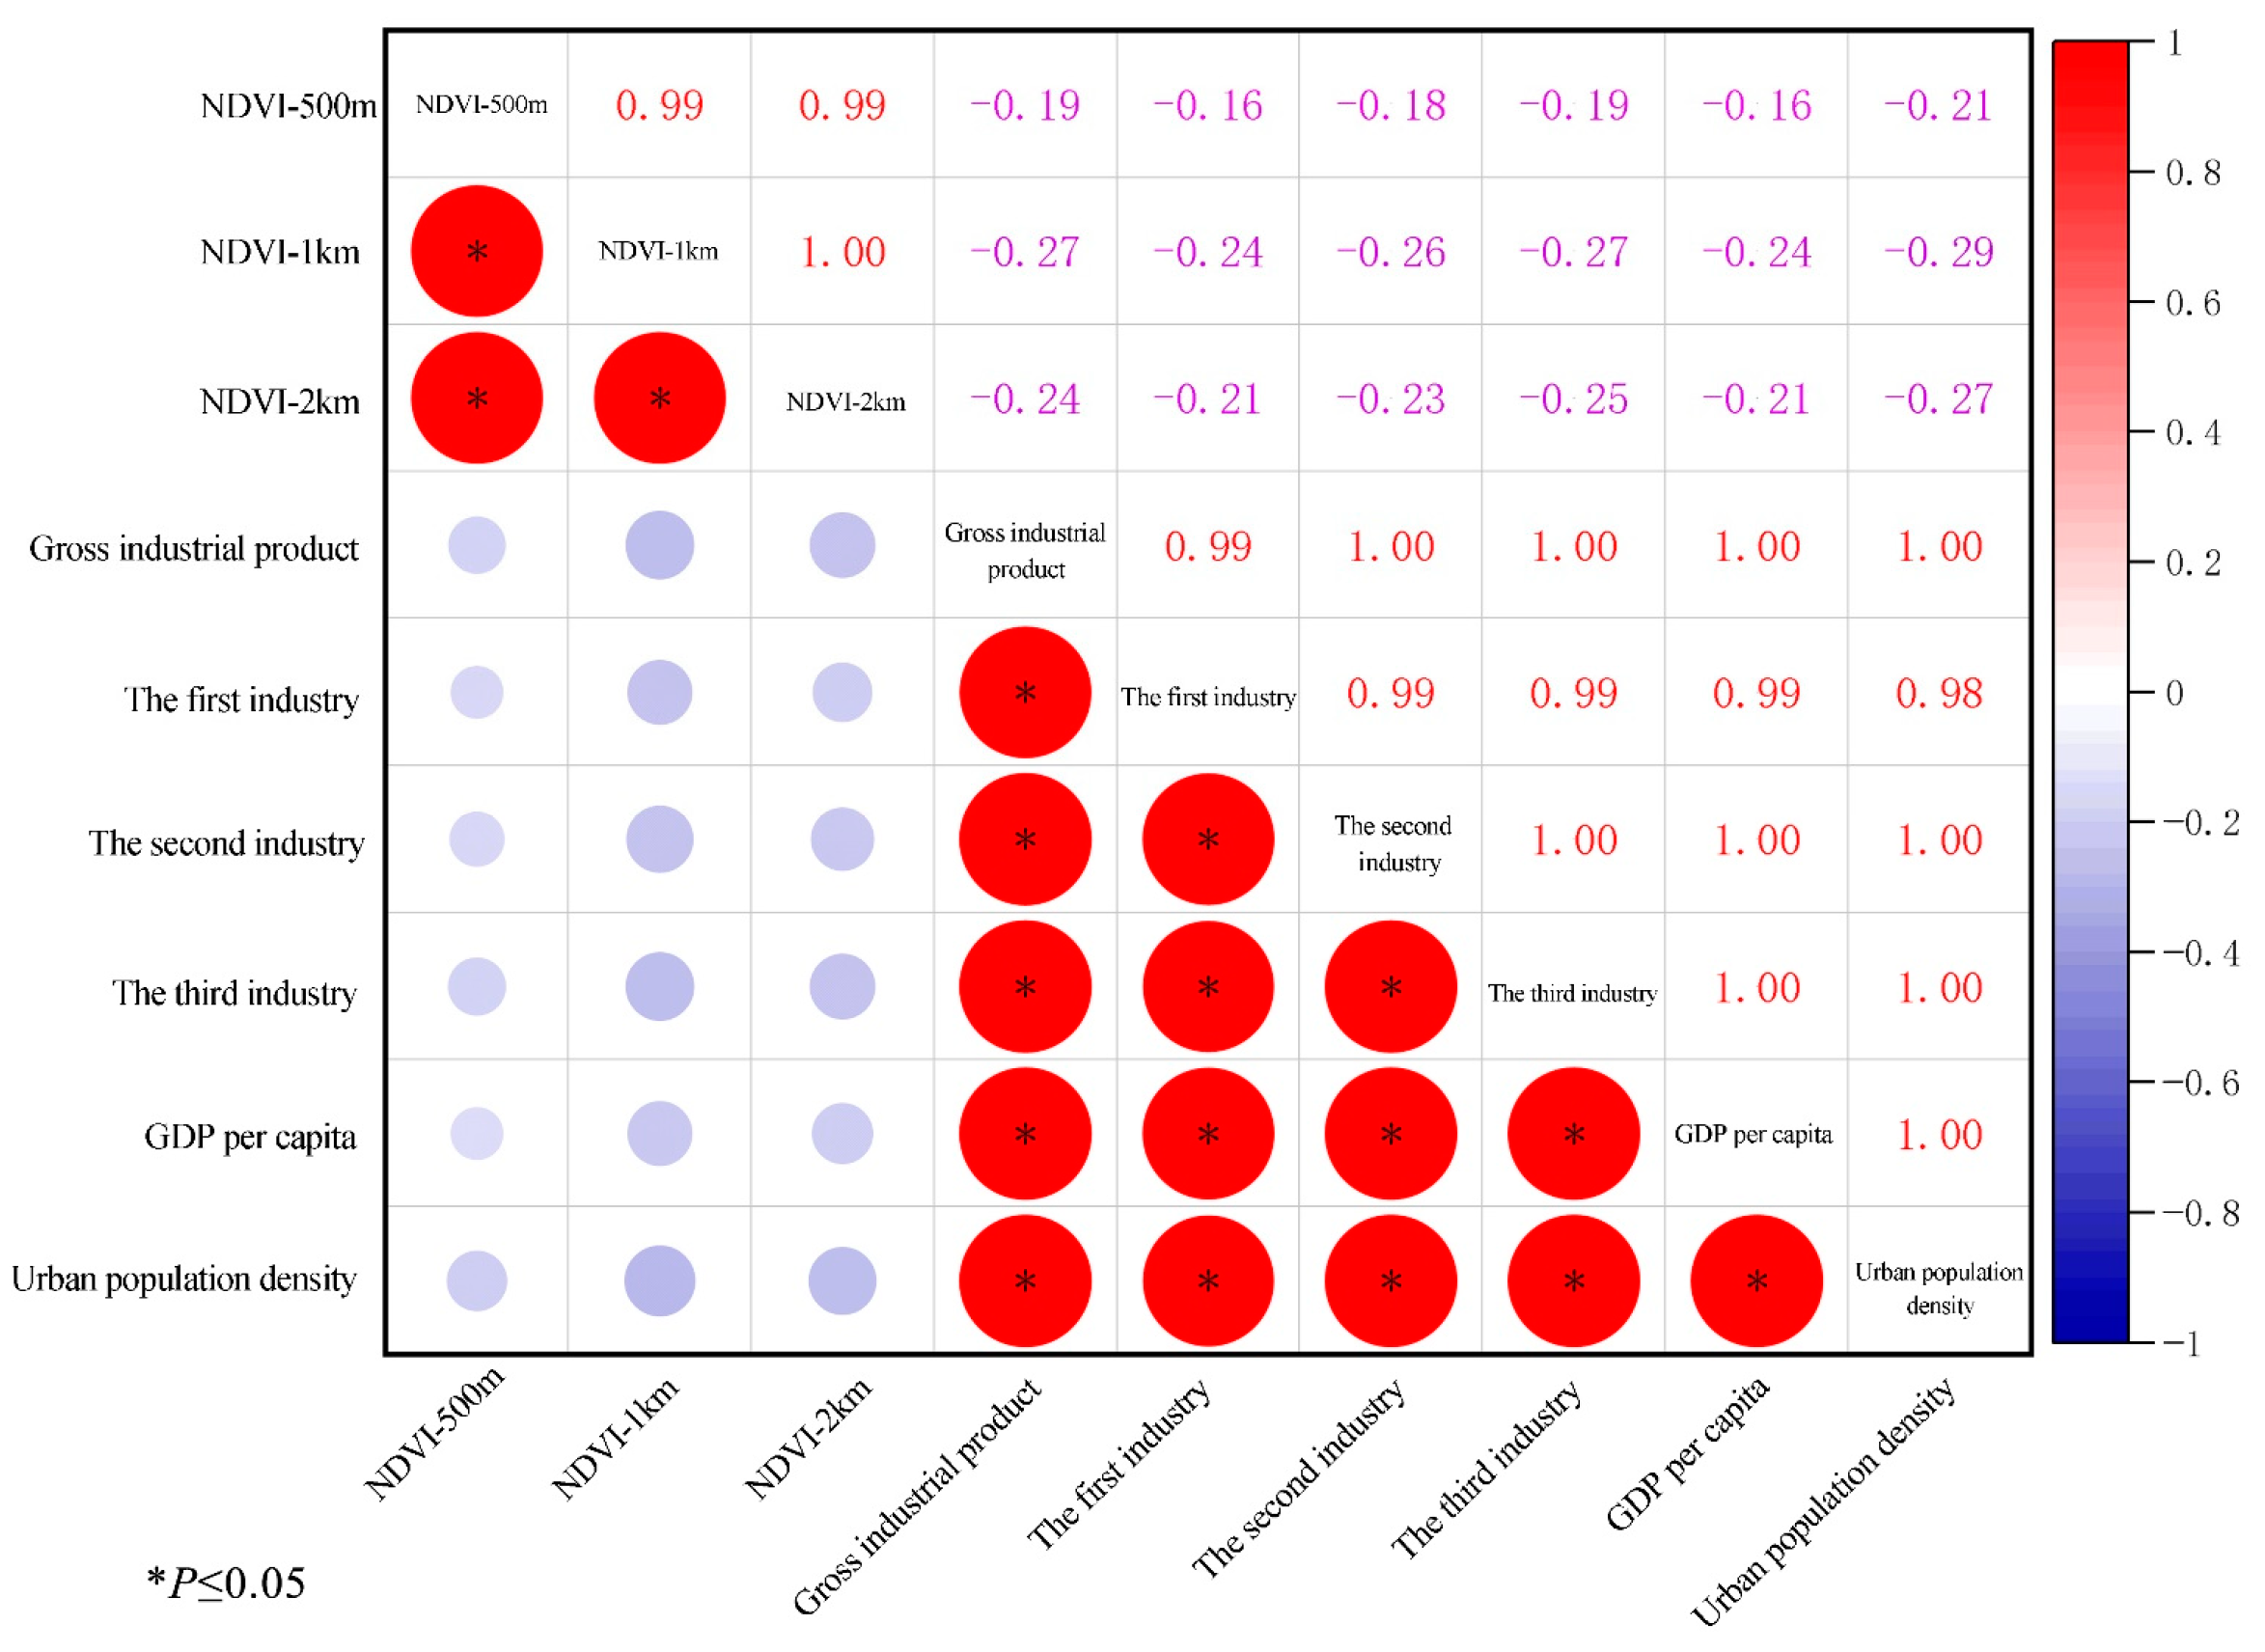
3.5.1. Heatmap Analysis of Correlation between NDVI and Socio-Economic Data

The socioeconomic state of Nanjing was assessed using indicators such as Industrial Gross Value Added, population, GDP, and urban population density. The relationships between NDVI and these socioeconomic indicators, as well as air pollution data, were analyzed through best-fit linear regression models. As depicted in Figure 10, NDVI values within all three buffer zones displayed negative correlations with the socioeconomic indicators, although these correlations were not statistically significant. Notably, a significant correlation between NDVI and economic growth was observed within the 1 km buffer zone, while urban population density exhibited the strongest correlation with NDVI. In essence, increased urban population density and economic growth had a detrimental impact on vegetation.

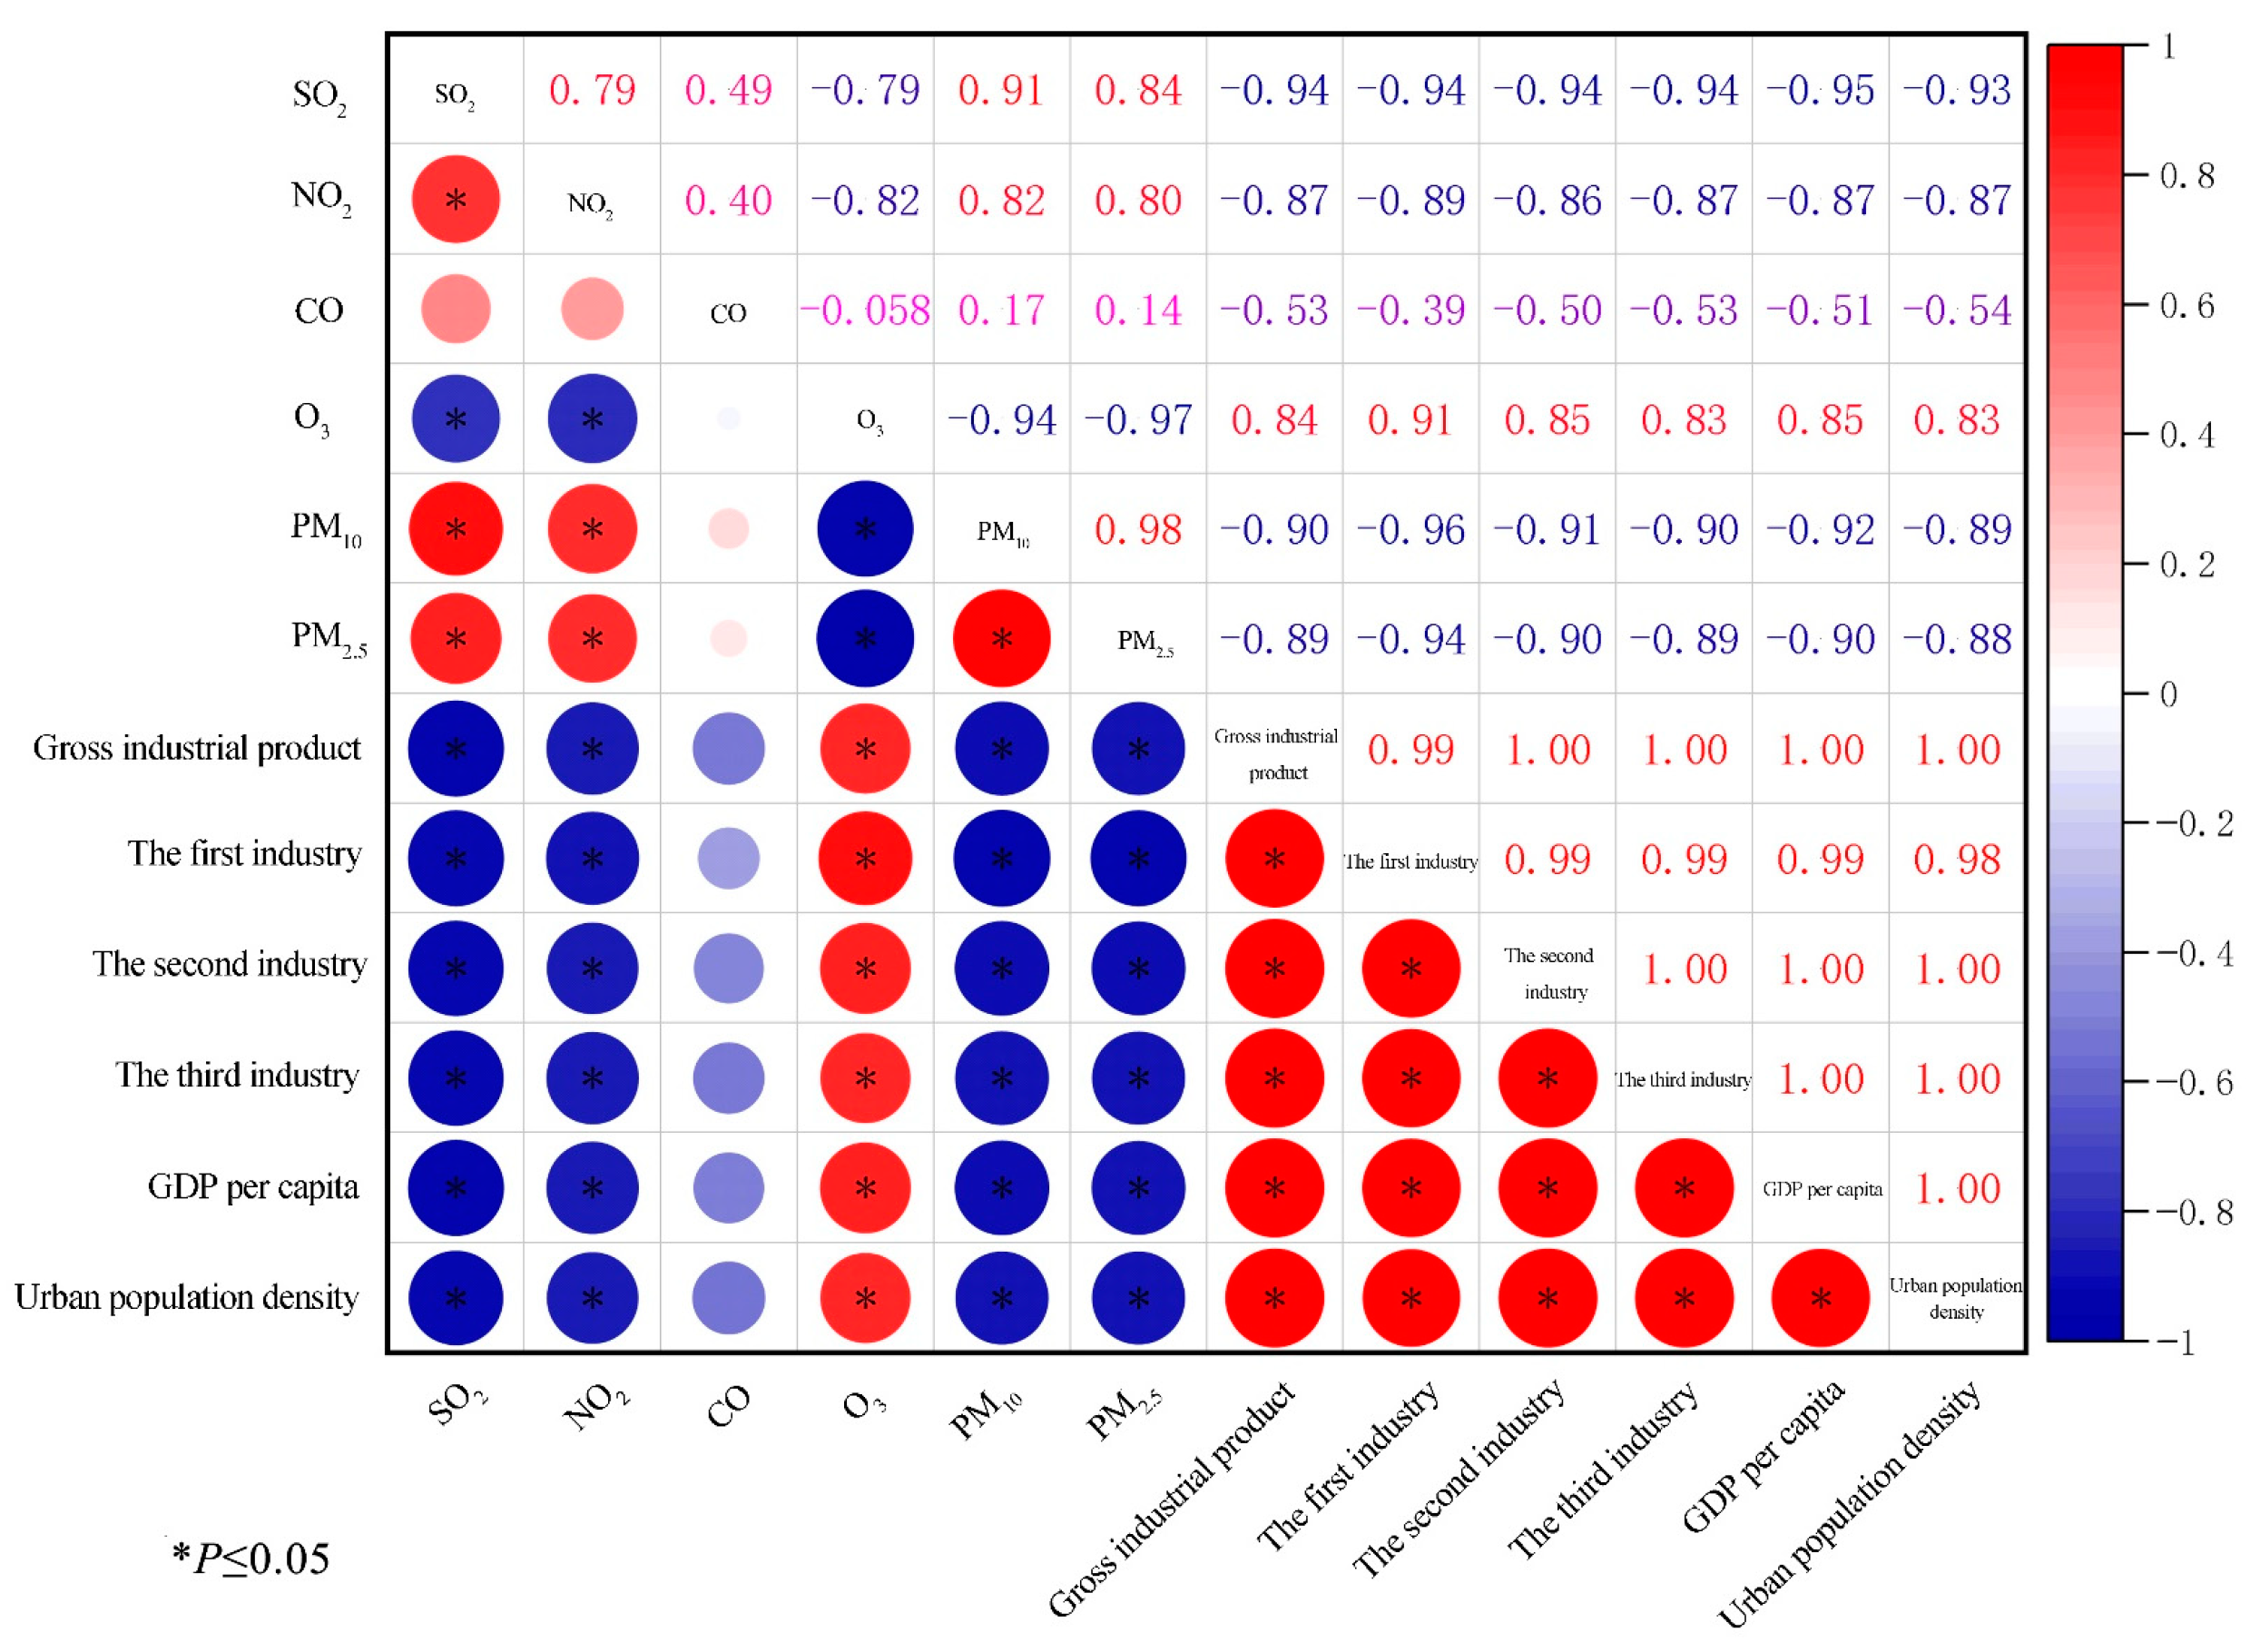
3.5.2. Heatmap Analysis of Correlation between Air Pollutants and Socio-Economic Data

Figure 11 demonstrates a highly significant positive correlation between O3 concentration and socioeconomic indicators. Both R2 values exceed 0.8, with the primary industry value surpassing 0.9. This indicates that O3 concentrations increase alongside rapid economic growth. Conversely, the other five pollutants exhibit negative correlations with economic growth. Correlations between SO2, NO2, PM10, and PM2.5 concentrations and the socioeconomic indicators all exceed 0.8, with some surpassing 0.9. However, the correlation between CO concentrations and socioeconomic indicators is only around 0.5. Overall, aside from O3 concentration, negative correlations were observed between the concentrations of other pollutants and social and economic indicators. Additionally, gross domestic product and population density in Nanjing are positively correlated with O3 concentrations. The release of nitrogen oxides and volatile organic compounds, combined with sunlight, contributes to the production of O3 and its increased atmospheric concentration. This implies that as industrialization levels rise and energy consumption demands increase, emissions of O3 precursor substances from industrial production also increase. However, the concentrations of the other five pollutants have exhibited a decreasing trend over the study period. This trend can be attributed to the implementation of various environmental protection measures in Nanjing, including the “Nanjing Ecological Civilization Construction Plan (2013–2020),” which has positively contributed to the improved environmental quality of the city. In conclusion, the implementation of environmentally preventive and mitigative measures, combined with ongoing economic growth, greatly promotes the harmonious coexistence and development of both the economy and the urban environment.

4. Conclusions

Based on data processing and subsequent discussion of the results, the following conclusions have been drawn. Firstly, the spatial distribution of the six air pollutants in Nanjing showcases a gradual decrease from the city center to peripheral areas. Overall, the main urban area experiences the poorest air quality, while the Pukou and Qixia Districts exhibit the best air quality. Secondly, there has been a moderate decline in air quality in Nanjing from 2013 to 2021, particularly for PM2.5 and PM10. The temporal pattern of the concentrations of SO2, NO2, CO, PM2.5, and PM10 indicates higher levels during winter compared to summer. Notably, increasing O3 concentrations signify its emergence as a potential future contributor to air pollution. Moreover, through correlation analysis of the three vegetation indices and air pollutants, a strong alignment is observed between the spatial distributions of vegetation indices and air pollutants. A favorable linear relationship exists between NDVI and all air pollutants except for CO. As NDVI values increase, the concentrations of the five pollutants decrease, whereas CO concentration remains unaffected by NDVI. Lastly, NDVI demonstrates a weak negative correlation with socioeconomic factors in general. As population density and economic levels continue to rise, vegetation coverage experiences a negative impact. The air pollutants exhibit a robust correlation with socioeconomic factors, primarily influenced by industrial production and human-induced disturbances. In the context of Nanjing’s future urban development, it is imperative to persist in the execution of existing ecological conservation projects, bolster urban green space planning, and promote a gradual augmentation in vegetation coverage. Additionally, harnessing cutting-edge achievements in modern science and technology, optimizing industrial structures, and facilitating the transition and upgrading of traditional industries toward sustainable, environmentally-conscious practices are of paramount importance. These findings hold significant implications for enhancing regional air quality and provide a scientific foundation, along with technical support, for subsequent prevention, control, and management of air pollution in Nanjing.

Author Contributions

Conceptualization, Q.S.; software, H.Z.; formal analysis, Y.J., C.Z. and H.Z.; data curation, Y.J.; writing—original draft, Y.J. and C.Z.; writing—review & editing, Q.S.; supervision, Z.Z.; project administration, Z.Z.; funding acquisition, Q.S. and Z.Z. All authors have read and agreed to the published version of the manuscript.

Funding

This research was funded by the Ministry of Education Humanities and Social Sciences Research “Study on the new mechanism of urban green space ecological benefit Measurement and high-quality collaborative development: A case study of Nanjing Metropolitan Area”: grant number 21YJCZH131; Young elite scientist sponsorship program by cast in China Association for Science and Technology: grant number YESS20220054; Social Science Foundation Project of Jiangsu Province: grant number 21GLC002; National Natural Science Foundation of China: grant number 32101582; Natural Science Foundation of Jiangsu Province of China: grant number BK20210613; The Natural Science Foundation of the Jiangsu Higher Education Institutions of China: grant number 21KJB220008; The National Natural Science Foundation of China: grant number 32071832; “Qing Lan Project” in Jiangsu Province of China: grant number None. And The APC was funded by Zunling Zhu.

Data Availability Statement

Not applicable.

Acknowledgments

We express our sincere gratitude to Weizheng Li from the Advanced Analysis and Testing Center at Nanjing Forestry University and Ruizhen Yang from Nanjing Sky Hunt Data Technology Co., Ltd. for their invaluable assistance in data processing.

Conflicts of Interest

The authors declare no conflict of interest.

References

  1. Maji, K.J.; Li, V.O.K.; Lam, J.C.K. Effects of China’s current Air Pollution Prevention and Control Action Plan on air pollution patterns, health risks and mortalities in Beijing 2014–2018. Chemosphere 2020, 260, 127572. [Google Scholar] [CrossRef] [PubMed]
  2. Liu, H.M.; Fang, C.L.; Huang, J.J.; Zhu, X.D.; Zhou, Y.; Wang, Z.B.; Zhang, Q. The spatial-temporal characteristics and influencing factors of air pollution in the Beijing-Tianjin-Hebei urban agglomeration. J. Geogr. 2018, 73, 177–191. [Google Scholar]
  3. Chen, L.L.; Wang, H.; Wang, Z.W.; Dong, Z.M. Estimating the mortality attributable to indoor exposure to particulate matter of outdoor origin in mainland China. Sci. Total Environ. 2023, 872, 162286. [Google Scholar] [CrossRef] [PubMed]
  4. Du, J.; Song, P.C.; Long, P.; Huang, Q.; Qiao, J.X. Characteristics and correlation analysis of atmospheric pollutant concentration changes in Mianyang. J. Earth Environment 2021, 12, 183–191+201. [Google Scholar]
  5. Zhang, Y.J.; Cai, J.; Wang, S.X.; He, K.B.; Zheng, M. Review of receptor-based source apportionment research of fine particulate matter and its challenges in China. Sci. Total Environ. 2017, 586, 917–929. [Google Scholar] [CrossRef]
  6. Wang, Y.G.; Ying, Q.; Hu, J.L.; Zhang, H.L. Spatial and temporal variations of six criteria air pollutants in 31 provincial capital cities in China during 2013–2014. Environ. Int. 2014, 73, 413–422. [Google Scholar] [CrossRef]
  7. Wan, Q.; Chen, Z.; Wang, Y.; Feng, B. Multi-scale analysis of the spatial and temporal development of PM2.5 in the Yangtze River Economic Belt from 1998 to 2016. Yangtze River Basin Resour. Environ. 2019, 28, 2504–2512. [Google Scholar]
  8. Banerjee, T.; Singh, S.B.; Srivastava, R.K. Development and performance evaluation of statistical models correlating air pollutants and meteorological variables at Pantnagar, India. Atmos. Res. 2011, 99, 505–517. [Google Scholar] [CrossRef]
  9. Wang, J.H.; Zhao, T.B.; Ma, Y.X.; Ma, P.; Yang, S.M.; Wang, S. Characteristics of air pollution in Xi’an and their relationship with meteorological factors. Environ. Chem. 2015, 34, 386–387. [Google Scholar]
  10. Jia, B.; Lu, J.W.; Li, X.; Wang, X. Trends of atmospheric pollutant concentrations and analysis of their influencing factors in Dianjiang, Chongqing. Environ. Impact Assess. 2016, 38, 78–81. [Google Scholar]
  11. Hrishikesh, C.G.; Nagendra, S.M.S. Study of meteorological impact on air quality in a humid tropical urban area. J. Earth Syst. Sci. 2019, 128, 118. [Google Scholar] [CrossRef]
  12. Cui, L.L.; Zhou, L.; Chen, X.D.; Zhang, X.Z.; Wang, Q.Q.; Wu, J.; Ding, Z. Characteristics of spatial and temporal variation in air pollutant concentrations in typical regions of Nanjing in the past 10 years. Mod. Prev. Med. 2013, 40, 3356–3360+3370. [Google Scholar]
  13. Guo, Q.H.; Chen, K. Analysis of ambient air quality characteristics and variation in Nanjing. J. Nanjing Univ. Inf. Eng. Nat. Sci. Ed. 2022, 14, 294–303. [Google Scholar]
  14. Yuan, X.; Huang, Z.J.; Lu, M.H.; Jia, G.L.; Duan, J.H.; Shen, J.; Zhong, Z.M.; Chen, D.H.; Zheng, J.Y. Seasonal evolution and cause analysis of ozone pollution in the Pearl River Delta based on observation and machine learning. Acta Sci. Circumstantiae 2023, 43, 214–225. [Google Scholar]
  15. Ersin, Ö.Ö. The nonlinear relationship of environmental degradation and income for the 1870–2011 period in selected developed countries: The dynamic panel-star approach. Procedia Econ. Financ. 2016, 38, 318–339. [Google Scholar] [CrossRef]
  16. Bildirici, M.; Ersin, Ö.Ö. Nexus between Industry 4.0 and environmental sustainability: A Fourier panel bootstrap cointegration and causality analysis. J. Clean. Prod. 2023, 386, 135786. [Google Scholar] [CrossRef]
  17. Escobedo, S.; de Lasa, H. Photocatalysis for air treatment processes: Current technologies and future applications for the removal of organic pollutants and viruses. Catalysts 2020, 10, 966. [Google Scholar] [CrossRef]
  18. Wang, Q.Y.; Enyoh, C.E.; Chowdhury, T.; Chowdhury, M.A.H. Analytical techniques, occurrence and health effects of micro and nano plastics deposited in street dust. Int. J. Environ. Anal. Chem. 2020, 102, 6435–6453. [Google Scholar] [CrossRef]
  19. Kaya, S.I.; Cetinkaya, A.; Ozkan, S.A. Green analytical chemistry approaches on environmental analysis. Trends Environ. Anal. Chem. 2022, 33, e00157. [Google Scholar] [CrossRef]
  20. Zhang, W.Y.; Zhang, Y.Z.; Gong, J.R.; Yang, B.; Zhang, Z.H.; Wang, B.; Zhu, C.C.; Shi, J.Y.; Yue, K.X. Comparison of the suitability of plant species for greenbelt construction based on particulate matter capture capacity, air pollution tolerance index, and antioxidant system. Environ. Pollut. 2020, 263, 114615. [Google Scholar] [CrossRef]
  21. Freer-Smith, P.H.; Holloway, S.; Goodman, A. The uptake of particulates by an urban woodland:site description and particulate composition. Environ. Pollut. 1997, 95, 27–35. [Google Scholar] [CrossRef] [PubMed]
  22. Prusty, B.A.K.; Mishra, P.C.; Azeez, P.A. Dust accumulation and leaf pigment content in vegetation near the national highway at Sambalpur, Orissa, India. Ecotoxicol. Environ. Saf. 2005, 60, 228–235. [Google Scholar] [CrossRef]
  23. Nowak, D.J.; Crane, D.E.; Stevens, J.C. Air pollution removal by urban trees and shrubs in the United States. Urban For. Urban Green. 2006, 4, 115–123. [Google Scholar]
  24. Jin, H.Y.; Chen, X.H.; Zhong, R.D.; Liu, M.Y. Influence and prediction of PM2.5 through multiple environmental variables in China. Sci. Total Environ. 2022, 849, 157910. [Google Scholar] [CrossRef] [PubMed]
  25. Kinane, S.M.; Montes, C.R.; Zapata, M.; Bullock, B.P.; Cook, R.L.; Mishra, D.R. Influence of environmental variables on leaf area index in loblolly pine plantations. For. Ecol. Manag. 2022, 523, 120445. [Google Scholar] [CrossRef]
  26. Sun, X.Y.; Xu, S.; Hua, W.C.; Tian, J.R.; Xu, Y.N. Feasibility study on the estimation of the living vegetation volume of individual street trees using terrestrial laser scanning. Urban Urban Green 2022, 71, 127553. [Google Scholar] [CrossRef]
  27. Zhang, Y.L.; Li, S.L.; Fu, X.; Dong, R.C. Quantification of urban greenery using hemisphere-view panoramas with a green cover index. Ecosyst. Health Sustain. 2021, 7, 1929502. [Google Scholar] [CrossRef]
  28. Ki, D.; Lee, S. Analyzing the effects of Green View Index of neighborhood streets on walking time using Google Street View and deep learning. Landsc. Urban Plan. 2021, 205, 103920. [Google Scholar] [CrossRef]
  29. Dong, W.; Yang, Z.Y. Variation characteristics analysis of the vegetation coverage in Midu county based on Landsat 8 remote sensing image. In Proceedings of the 2nd International Conference on Intelligent Information Processing-IIP’17, Bangkok, Thailand, 17–18 July 2017. [Google Scholar]
  30. Hui, F.M.; Tian, Q.J.; Jin, Z.Y.; Li, H.T. Research on the relationship between vegetation index and leaf area index and its quantitative analysis. Remote Sens. Inf. 2003, 2, 10–13. [Google Scholar]
  31. Chen, W.B.; Xie, T.; Zheng, J.; Wu, S. The influence of land vegetation on the spatial distribution of PM2.5 concentration. J. Ecol. 2020, 40, 7044–7053. [Google Scholar]
  32. Sun, S.; Li, L.J.; Zhao, W.J.; Qi, M.X.; Tian, X.; Li, S.S. Analysis of variation in air pollution in Beijing, Tianjin and Hebei and its correlation with vegetation index. Environ. Sci. 2019, 40, 1585–1593. [Google Scholar]
  33. Huang, G.J.; Zhong, J.S.; Ao, C.H. Correlation analysis of the spatial and temporal distribution characteristics of PM2.5 and vegetation cover in Liupanshui, Guizhou. Science. Technol. Eng. 2020, 20, 10965–10972. [Google Scholar]
  34. Suárez-Cáceres, G.P.; Fernández-Cañero, R.; Fernández-Espinosa, A.J.; Rossini-Oliva, S.; Franco-Salas, A.; Pérez-Urrestarazu, L. Volatile organic compounds removal by means of a felt-based living wall to improve indoor air quality. Atmos. Pollut. Res. 2021, 12, 224–229. [Google Scholar] [CrossRef]
  35. Srbinovska, M.; Andova, V.; Mateska, A.K.; Krstevska, M.C. The effect of small green walls on reduction of particulate matter concentration in open areas. J. Clean. Prod. 2021, 279, 123306. [Google Scholar] [CrossRef]
  36. Pettit, T.; Torpy, F.R.; Surawski, N.C.; Fleck, R.; Irga, P.J. Effective reduction of roadside air pollution with botanical biofiltration. J. Hazard. Mater. 2021, 414, 125566. [Google Scholar] [CrossRef]
  37. Doronzo, D.M.; Al-Dousari, A.; Folch, A.; Dagsson-Waldhauserova, P. Preface to the Dust Topical Collection. Arab. J. Geosci. 2016, 9, 468. [Google Scholar] [CrossRef]
  38. Subramaniam, N.; Al-Sudairawi, M.; Al-Dousari, A.; Al-Dousari, N. Probability distribution and extreme value analysis of total suspended particulate matter in Kuwait. Arab. J. Geosci. 2015, 8, 11329–11344. [Google Scholar] [CrossRef]
  39. Yan, J.; Ji, H.L.; Zhang, Y. Study on the impact of rainfall and flooding on Nanjing Zijinshan National Forest Park based on DEM and NDVI. J. Anhui Agric. Univ. 2020, 47, 192–199. [Google Scholar]
  40. Wang, Z.B.; Zou, B.; Qiu, Y.H.; Chen, J.W. Geographic characteristics of the spatial and temporal correlation between aerosol optical thickness and PM2.5 in China. Remote Sens. Inf. 2016, 31, 26–35. [Google Scholar]
  41. Nanjing Municipal Bureau Statistics. Nanjing Statistical Yearbook 2020; China Statistics Press: Beijing, China, 2020.
  42. Gao, L.; Tang, L.; Hou, H.R.; Wang, Y.; Mai, Y.Q.; He, W.B.; Wang, W.M.; Su, H.B. Spatial and temporal distribution of air pollution in Shenzhen and its relationship with landscape patterns. J. Ecol. 2021, 41, 8758–8770. [Google Scholar]
  43. Wang, Y.H.; Cui, X.; Chen, W. An empirical study on the relationship between economic development and environmental pollution in Nanjing. Yangtze River Basin Resour. Environ. 2006, 2, 142–146. [Google Scholar]
  44. Yu, Z.H.; Sun, R.L.; Qin, H.X.; Yao, L.P.; Cheng, T.Q. Study on the path of achieving a high quality ecological environment in the Yangtze River Economic Belt with Nanjing as an example. Yangtze River Basin Resour. Environ. 2022, 31, 379–386. [Google Scholar]
  45. Tan, L. Research on the Construction of Urban Green Space Landscape Patterns under the Constraints of PM2.5 and Evaluating the Construction of Index Systems; Southwest University: Chongqing, China, 2020. [Google Scholar]
  46. Liu, Y.P.; Wu, J.G.; Yu, D.Y. Characterizing spatiotemporal patterns of air pollution in China: A multiscale landscape approach. Ecol. Indic. 2017, 76, 344–356. [Google Scholar] [CrossRef]
  47. Lu, D.B.; Mao, W.L.; Yang, D.Y.; Yang, D.Y.; Zhao, J.N.; Xu, J.H. Effects of land use and landscape pattern on PM2.5 in Yangtze River Delta, China. Atmos. Pollut. Res. 2018, 9, 705–713. [Google Scholar] [CrossRef]
  48. Zhao, Y.Y.; Zhang, X.P.; Chen, M.X.; Gao, S.S.; Li, R.K. Regional differences and attribution analysis of urban air quality in China. J. Geogr. 2021, 76, 2814–2829. [Google Scholar]
  49. Li, D.K.; Liu, M.; Li, C.L.; Hu, Y.M.; Wang, C.; Liu, C. Two-and three-dimensional landscape pattern relationships between urban atmospheric environment and surrounding areas in China. J. Appl. Ecol. 2021, 32, 1593–1602. [Google Scholar]
  50. Liu, Y.Q.; Xu, X.Y.; Huang, M.; Liu, Q. Characteristics of atmospheric PM10, NO2 and SO2 concentration changes in Luoyang City. Soil Water Conserv. Res. 2018, 25, 178–182. [Google Scholar]
  51. Tao, S.C.; Deng, S.X.; Hao, Y.Z.; Gao, S.H.; Xiong, X.Z.; Kong, Y.P. Emission characteristics of gaseous pollutants from road mobile sources in the Guanzhong city group. China Environ. Sci. 2019, 39, 542–553. [Google Scholar]
  52. Li, W.H.; Zhou, X.; Zhong, J.L. Spatiotemporal diferentiation characteristics of ecological protectionand high-quality development in Guangxi Zhuang Autonomous Region. Res. Soil Water Conserv. 2023, 30, 165–174. [Google Scholar]
  53. Ji, Y.U.; Sheng, Q.Q.; Zhu, Z.L. Assessment of ecological benefits of urban green spaces in Nanjing city, China, based on the entropy method and the coupling harmonious degree model. Sustainability 2023, 15, 10516. [Google Scholar] [CrossRef]
  54. Xu, P.; Hao, Q.J.; Ji, D.S.; Zhang, J.K.; Liu, Z.R.; Hu, B.; Wang, Y.S.; Jiang, C.S. Characterization of atmospheric PM2.5, NOx, SO2 and O3 concentrations in Beibei, Chongqing. J. Environ. Sci. 2016, 36, 1539–1547. [Google Scholar]
  55. Shao, P.; Wang, L.L.; An, J.L.; Zhou, Y.L.; Wang, Y.S. Atmospheric pollution observations in Zhangjiakou, Hebei. Environ. Sci. 2012, 33, 2538–2550. [Google Scholar]
  56. Lei, Y.K.; Davies, G.M.; Jin, H.; Tian, G.H.; Kim, G. Scale-dependent effects of urban greenspace on particulate matter air pollution. Urban For. Urban Green. 2021, 61, 127089. [Google Scholar] [CrossRef]
  57. Zheng, C.Y.; Liang, J.H.; Wang, J. Spatial and temporal variation of normalized vegetation index (NDVI) in the China-Pakistan Economic Corridor and analysis of its influencing factors. J. Ecol. Rural. Environ. 2022, 9, 1147–1156. [Google Scholar]
  58. Wu, W.; Wang, Y.Q.; Liu, M.; Li, C.L. A Review on the Use of Landscape Indices to Study the Effects of Three-Dimensional Urban Landscape Patterns on Haze Pollution in China. Pol. J. Environ. Stud. 2021, 30, 2957–2967. [Google Scholar] [CrossRef]
  59. Zang, Z.F.; Zhang, F.Y.; Li, Y.H.; Xing, Y. Spatio-temporal distribution and affecting factors of PM2.5 and PM10 in major grain producing areas in China: A case study of Henan province. J. Nat. Resour. 2021, 36, 1163–1175. [Google Scholar] [CrossRef]
  60. Li, J.K.; Wang, W.; Li, M.; Li, Q.; Liu, Z.M.; Chen, W.; Wang, Y.A. Impact of land management scale on the carbon emissions of the planting industry in China. Land 2022, 11, 816. [Google Scholar] [CrossRef]
  61. Xi, X.; Sokolik, I.N. Quantifying the anthropogenic dust emission from agricultural land use and desiccation of the Aral Sea in Central Asia. J. Geophys. Res.-Atmos. 2016, 121, 12270–12281. [Google Scholar] [CrossRef]
  62. Miao, Q.; Wang, Z.S.; Wang, R.; Huang, M.; Sun, J.L. Assessment of the impact of O3 pollution on summer vegetation growth in Northern China based on NDVI data. Remote Sens. Technol. Appl. 2018, 33, 696–702. [Google Scholar]
  63. Li, M.W.; Luan, Q.; Zhang, N.; Chang, Q.; Fan, Z.H.; Yang, Q.; Zhao, Y.Q.; Mi, X.N. Analysis of the spatial and temporal dynamics of NDVI and its influencing factors in Luliang from 2000-2019. Soil Water Conserv. Res. 2022, 29, 248–254. [Google Scholar]
  64. Xu, Y.; Zhao, C.; Dou, S.Q.; Hao, W.Q.; Zheng, Z.W.; Jing, J.L. Spatial and temporal development of NDVI and its correlation with population density in the Bohai Rim from 2000 to 2020. Soil Water Conserv. Bull. 2022, 42, 264–274. [Google Scholar]
  65. Han, G.F.; Xu, J.H. Spatial and temporal correlation between urbanization and vegetation activity in the Yangtze River Delta. Ecol. Sci. 2008, 27, 1–5. [Google Scholar]
Figure 1. The geographical coordinates of the nine air quality monitoring points located in Nanjing, Jiangsu Province, China.
Forests 14 02106 g001
Figure 2. The analysis of elevation, slope, and slope aspects in Nanjing.
Forests 14 02106 g002
Figure 3. The spatiotemporal variations in the concentration of air pollutants in Nanjing (from 2013 to 2021). (A) spatiotemporal variations in SO2 concentration; (B) spatiotemporal variations in NO2 concentration; (C) spatiotemporal variations in CO concentration; (D) spatiotemporal variations in O3 concentration; (E) spatiotemporal variations in PM10 concentration; (F) spatiotemporal variations in PM2.5 concentration.
Forests 14 02106 g003
Figure 4. Trend in the annual average concentration distribution of pollutants in Nanjing in 2013, 2017, and 2021. (A) average annual concentration of SO2 in 2013; (B) average annual concentration of NO2 in 2013; (C) average annual concentration of CO in 2013; (D) average annual concentration of O3 in 2013; (E) average annual concentration of PM10 in 2013; (F) average annual concentration of PM2.5 in 2013; (G) average annual concentration of SO2 in 2017; (H) average annual concentration of NO2 in 2017; (I) average annual concentration of CO in 2017; (J) average annual concentration of O3 in 2017; (K) average annual concentration of PM10 in 2017; (L) average annual concentration of PM2.5 in 2017; (M) average annual concentration of SO2 in 2021; (N) average annual concentration of NO2 in 2021; (O) average annual concentration of CO in 2021; (P) average annual concentration of O3 in 2021; (Q) average annual concentration of PM10 in 2021; (R) average annual concentration of PM2.5 in 2021.
Forests 14 02106 g004
Figure 5. Changes in seasonal average concentrations of various pollutants from 2013 to 2021. (A) changes in seasonal average concentrations of SO2; (B) changes in seasonal average concentrations of NO2; (C) changes in seasonal average concentrations of CO; (D) changes in seasonal average concentrations of O3; (E) changes in seasonal average concentrations of PM10; (F) changes in seasonal average concentrations of PM2.5.
Forests 14 02106 g005
Figure 6. Comparison of seasonal NDVI data between summer and winter from 2013 to 2021. (A) NDVI in August 2013; (B) NDVI in December 2013; (C) NDVI in June 2014; (D) NDVI in November 2014; (E) NDVI in September 2015; (F) NDVI in January 2016; (G) NDVI in September 2016; (H) NDVI in January 2017; (I) NDVI in July 2017; (J) NDVI in December 2017; (K) NDVI in June 2018; (L) NDVI in November 2018; (M) NDVI in August 2019; (N) NDVI in December 2019; (O) NDVI in April 2020; (P) NDVI in December 2020; (Q) NDVI in August 2021.
Forests 14 02106 g006
Figure 7. Comparison of summer and winter RVI data from 2013 to 2021. (A) RVI in August 2013; (B) RVI in December 2013; (C) RVI in June 2014; (D) RVI in November 2014; (E) RVI in September 2015; (F) RVI in January 2016; (G) RVI in June 2016; (H) RVI January 2017; (I) RVI in July 2017; (J) RVI in December 2017; (K) RVI in June 2018; (L) RVI in November 2018; (M) RVI in December 2019; (N) RVI in April 2020; (O) RVI in December 2020; (P) RVI in August 2021.
Forests 14 02106 g007
Figure 8. Comparison of summer and winter GVI data from 2013 to 2021. (A) GVI in August 2013; (B) GVI in December 2013; (C) GVI in June 2014; (D) GVI in November 2014; (E) GVI in September 2015; (F) GVI in January 2016; (G) GVI in September 2016; (H) GVI in January 2017; (I) GVI in July 2017; (J) GVI in December 2017; (K) GVI in June 2018; (L) GVI in November 2018; (M) GVI in August 2019; (N) GVI in December 2019; (O) GVI in April 2020; (P) GVI in December 2020; (Q) GVI in August 2021.
Forests 14 02106 g008
Figure 9. The best-fit linear regression models between the six pollutants and NDVI (2 kmmax values). (A) SO2 concentration and NDVI (2 kmmax values); (B) NO2 concentration and NDVI (2 kmmax values); (C) CO concentration and NDVI (2 kmmax values); (D) O3 concentration and NDVI (2 kmmax values); (E) PM10 concentration and NDVI (2 kmmax values); (F) PM2.5 concentration and NDVI (2 kmmax values).
Forests 14 02106 g009
Figure 10. Heatmap of the correlations between NDVI and socio-economic data.
Forests 14 02106 g010
Figure 11. Heatmap of the correlation between the six pollutants and the socio-economic data.
Forests 14 02106 g011
Table 1. Presents the latitude and longitude coordinates for the nine air quality monitoring sites.
StationDistrictLatitudeLongitude
CaochangmenJiangdong Street, Gulou District32.05528118.754
Shanxi RoadNinghai Road Street, Gulou District32.07014118.7832
MaigaoqiaoMaigaoqiao Street, Qixia District32.1064118.8083
Xianlin University CityXianlin Street, Qixia District32.10135118.9105
PukouJiangpu Street, Pukou District32.0878118.626
Olympic Sports CenterXinglong Street, Jianye District32.00726118.7422
ZhonghuamenZhonghuamen Street, Qinhuai District32.01267118.7817
Xuanwu LakeXuanwu Gate Street, Xuanwu District32.07545118.8
Ruijin RoadRuijin Road Street, Qinhuai District32.03225118.8058
Table 2. Concentration limits for essential items of atmospheric pollutants.
Sequence NumberPollutantAverage TimesConcentration LimitsUnit
Level 1Level 2
1Sulfur dioxide (SO2)Annual average2060μg/m3
24-h average50150
1-h average150500
2Nitrogen dioxide (NO2)Annual average4040μg/m3
24-h average8080
1-h average200200
3Carbon monoxide (CO)24-h average44mg/m3
1-h average1010
4Ozone (O3)Daily maximum 8-h average100160μg/m3
1-h average160200
5Particulate matter (PM10)Annual average4070μg/m3
24-h average50150
6Particulate matter (PM2.5)Annual average1535μg/m3
24-h average3575
Table 3. R2 values of the best-fit linear regression models between NDVI and six air pollutants at various radii.
PollutantNDVI-500 mNDVI-1 kmNDVI-2 km
Minimum ValueAverage ValueMaximum ValueMinimum ValueAverage ValueMaximum ValueMinimum ValueAverage ValueMaximum Value
SO20.0170.07510.6280.00380.11870.74040.00180.1260.8409
NO20.0460.06830.46950.01750.11130.52410.01850.16010.6269
CO0.07870.04620.20080.07750.07130.26520.13060.1360.3514
O33.45 × 10−40.11370.45570.03070.14450.59050.02660.12680.5206
PM109.16 × 10−50.05080.6350.0060.0680.7290.00420.080.8365
PM2.55.55 × 10−60.07610.68810.00670.10360.80860.00160.11190.8627
Disclaimer/Publisher’s Note: The statements, opinions and data contained in all publications are solely those of the individual author(s) and contributor(s) and not of MDPI and/or the editor(s). MDPI and/or the editor(s) disclaim responsibility for any injury to people or property resulting from any ideas, methods, instructions or products referred to in the content.

