Article

Forest Carbon Storage and Carbon Sequestration Potential in Shaanxi Province, China

1
College of Economics & Management, Northwest A & F University, Yangling District, Xianyang 712100, China
2
Power China Northwest Engineering Corporation Limited, Xi’an 710065, China
3
Shaanxi Union Research Center of University and Enterprise for River and Lake Ecosystems Protection and Restoration, Xi’an 710065, China
4
Ecology and Nature Conservation Institute, Chinese Academy of Forestry, Beijing 100091, China
*
Author to whom correspondence should be addressed.
Forests 2023, 14(10), 2021; https://doi.org/10.3390/f14102021
Submission received: 11 September 2023 / Revised: 5 October 2023 / Accepted: 7 October 2023 / Published: 9 October 2023
(This article belongs to the Special Issue Ecosystem Degradation and Restoration: From Assessment to Practice)

Abstract

:
The carbon storage of forest vegetation plays a crucial role in the terrestrial carbon budget. The objective of this study is to elucidate the current biomass carbon storage and sequestration capacity, as well as the future carbon sequestration potential of forest ecosystems in Shaanxi Province of China, thus providing data support and policy references for sustainable forest management and the response of carbon sequestration to climate change. Based on the data obtained from the seventh and ninth forest resource inventories, the regional biomass conversion factors, and carbon measurement parameters, the biomass conversion factor method is employed to estimate the biomass storage and carbon sequestration capacity of forest ecosystems. (1) The total carbon storage of forest lands in Shaanxi Province was 285.20 Tg. The carbon storage of arbor forests, sparse woodlands, scattered forests, four-side trees, shrub woodland, and bamboo forests were 237.09 Tg, 2.93 Tg, 12.30 Tg, 5.98 Tg, 26.35 Tg, and 0.56 Tg, respectively. (2) Over the 10 years from the seventh (2005) to the ninth (2015) forest resource inventories, the carbon storage of forests increased from 207 Tg to 285 Tg, with a total increase of 78.01 Tg (37.65%), demonstrating a significant carbon sink function. (3) From 2015 to 2060, the carbon density of arbor forests will increase from 33.53 Mg/ha to 46.90 Mg/ha, and the carbon storage will increase from 237 Tg to 432 Tg. These results indicate that forests have significant net carbon sequestration capacity and can play an important role in achieving China’s carbon peak and carbon neutrality goals. Aiming for carbon neutrality, improving forest management, along with protecting and utilizing forest resources through technological innovation, will become the driving force for increasing carbon storage in Shaanxi Province in the future.

1. Introduction

As per the Paris Agreement, the imperative to limit global warming to below 1.5 °C entails the urgent and significant reduction of greenhouse gas emissions worldwide [1]. The unparalleled surge in atmospheric carbon dioxide (CO2) has resulted in adverse consequences for ecosystem integrity, including ecosystem productivity, allocation of aboveground and belowground biomass, and microbial populations [2]. Nature-based solutions are widely recognized as a primary means of carbon removal technology, offering significant effectiveness and cost-efficiency in addressing climate change. A crucial aspect of these solutions involves optimizing carbon storage and sequestration, which entails the extraction of CO2 from the atmosphere and its subsequent long-term storage [3].
Aiming to reduce greenhouse gas emissions (especially CO2) and achieve carbon neutrality, forests are regarded as crucial sinks and reservoirs [4]. Forests, which can absorb atmospheric CO2 through photosynthesis and convert it into aboveground biomass carbon storage or sequester it into soil organic carbon pools, play a vital role in forest ecosystem services by reducing atmospheric CO2 concentrations [5,6]. Furthermore, compared to alternative carbon capture technologies and measures aimed at reducing industrial emissions, forest carbon sinks exhibit significant ecological and economic worth, making them an indispensable approach to combatting global climate change. Natural-based solutions for forests include afforestation, reforestation, avoiding deforestation, or protecting forests’ storage and sequestration potential by minimizing impacts [7,8]. Terrestrial ecosystems presently assimilate approximately 30% of anthropogenic carbon emissions on an annual basis, with forests accounting for the vast majority of this absorption. From 2000 to 2007, the total terrestrial carbon absorption was 9.5 Pg CO2e y−1, and the total carbon absorption of forests was 8.8 Pg CO2e y−1 [9,10]. By the year 2030, forest-based strategies have the potential to yield emission reductions equivalent to 7 Pg CO2 equivalent annually [11,12]. Consequently, assessing the current carbon storage and future carbon sequestration potential of forests holds substantial practical implications.
The carbon storage of the forest arbor layer is the foundation of the forest ecosystem carbon pool. Expanding forest area and improving forest unit area accumulation are viable strategies for augmenting forest carbon storage [13,14,15]. A precise evaluation of forest carbon storage and its capacity for sequestration can furnish the necessary technical assistance and scientific groundwork for devising measures to combat climate change and enhance the forest’s carbon sink capabilities. Numerous academic studies have extensively examined the carbon sequestration capacity of forests, specifically emphasizing the present state of forest carbon storage, as well as their potential for future carbon sequestration over global, national, regional, and county scales [16,17], which have demonstrated the importance of forest ecosystems in the global carbon cycle. Recent studies on regional forest carbon storage in China are mostly based on the eighth forest resource inventory data. Moreover, most of the studies on forest carbon stocks at the regional scale have only focused on arbor forests and ignored bamboo and shrubland. Several studies have elaborated on the carbon storage, carbon density, and dynamic changes of carbon storage in forests in several provinces of China (e.g., Hunan, Fujian, Henan and Shannxi) [18,19,20], and these data have helped to improve the accuracy of forest carbon stock assessments at the national level [21,22]. However, there are few studies giving predictions of carbon sink potential from the past to the future.
In this study, data from the seventh and ninth forest resource inventories of Shaanxi Province are used to assess the carbon storage, carbon density, carbon sequestration rate, and carbon sequestration potential of the forest resources, aiming to provide data support and references for carbon emission reduction management and the realization of carbon peaking and carbon neutrality goals of Shaanxi Province. In addition, in light of the dynamic attributes pertaining to forest carbon storage and the potential for carbon sink, this study presents pertinent recommendations for the management of forest carbon and the implementation of strategies to enhance carbon sequestration in Shaanxi Province.

2. Material and Methods
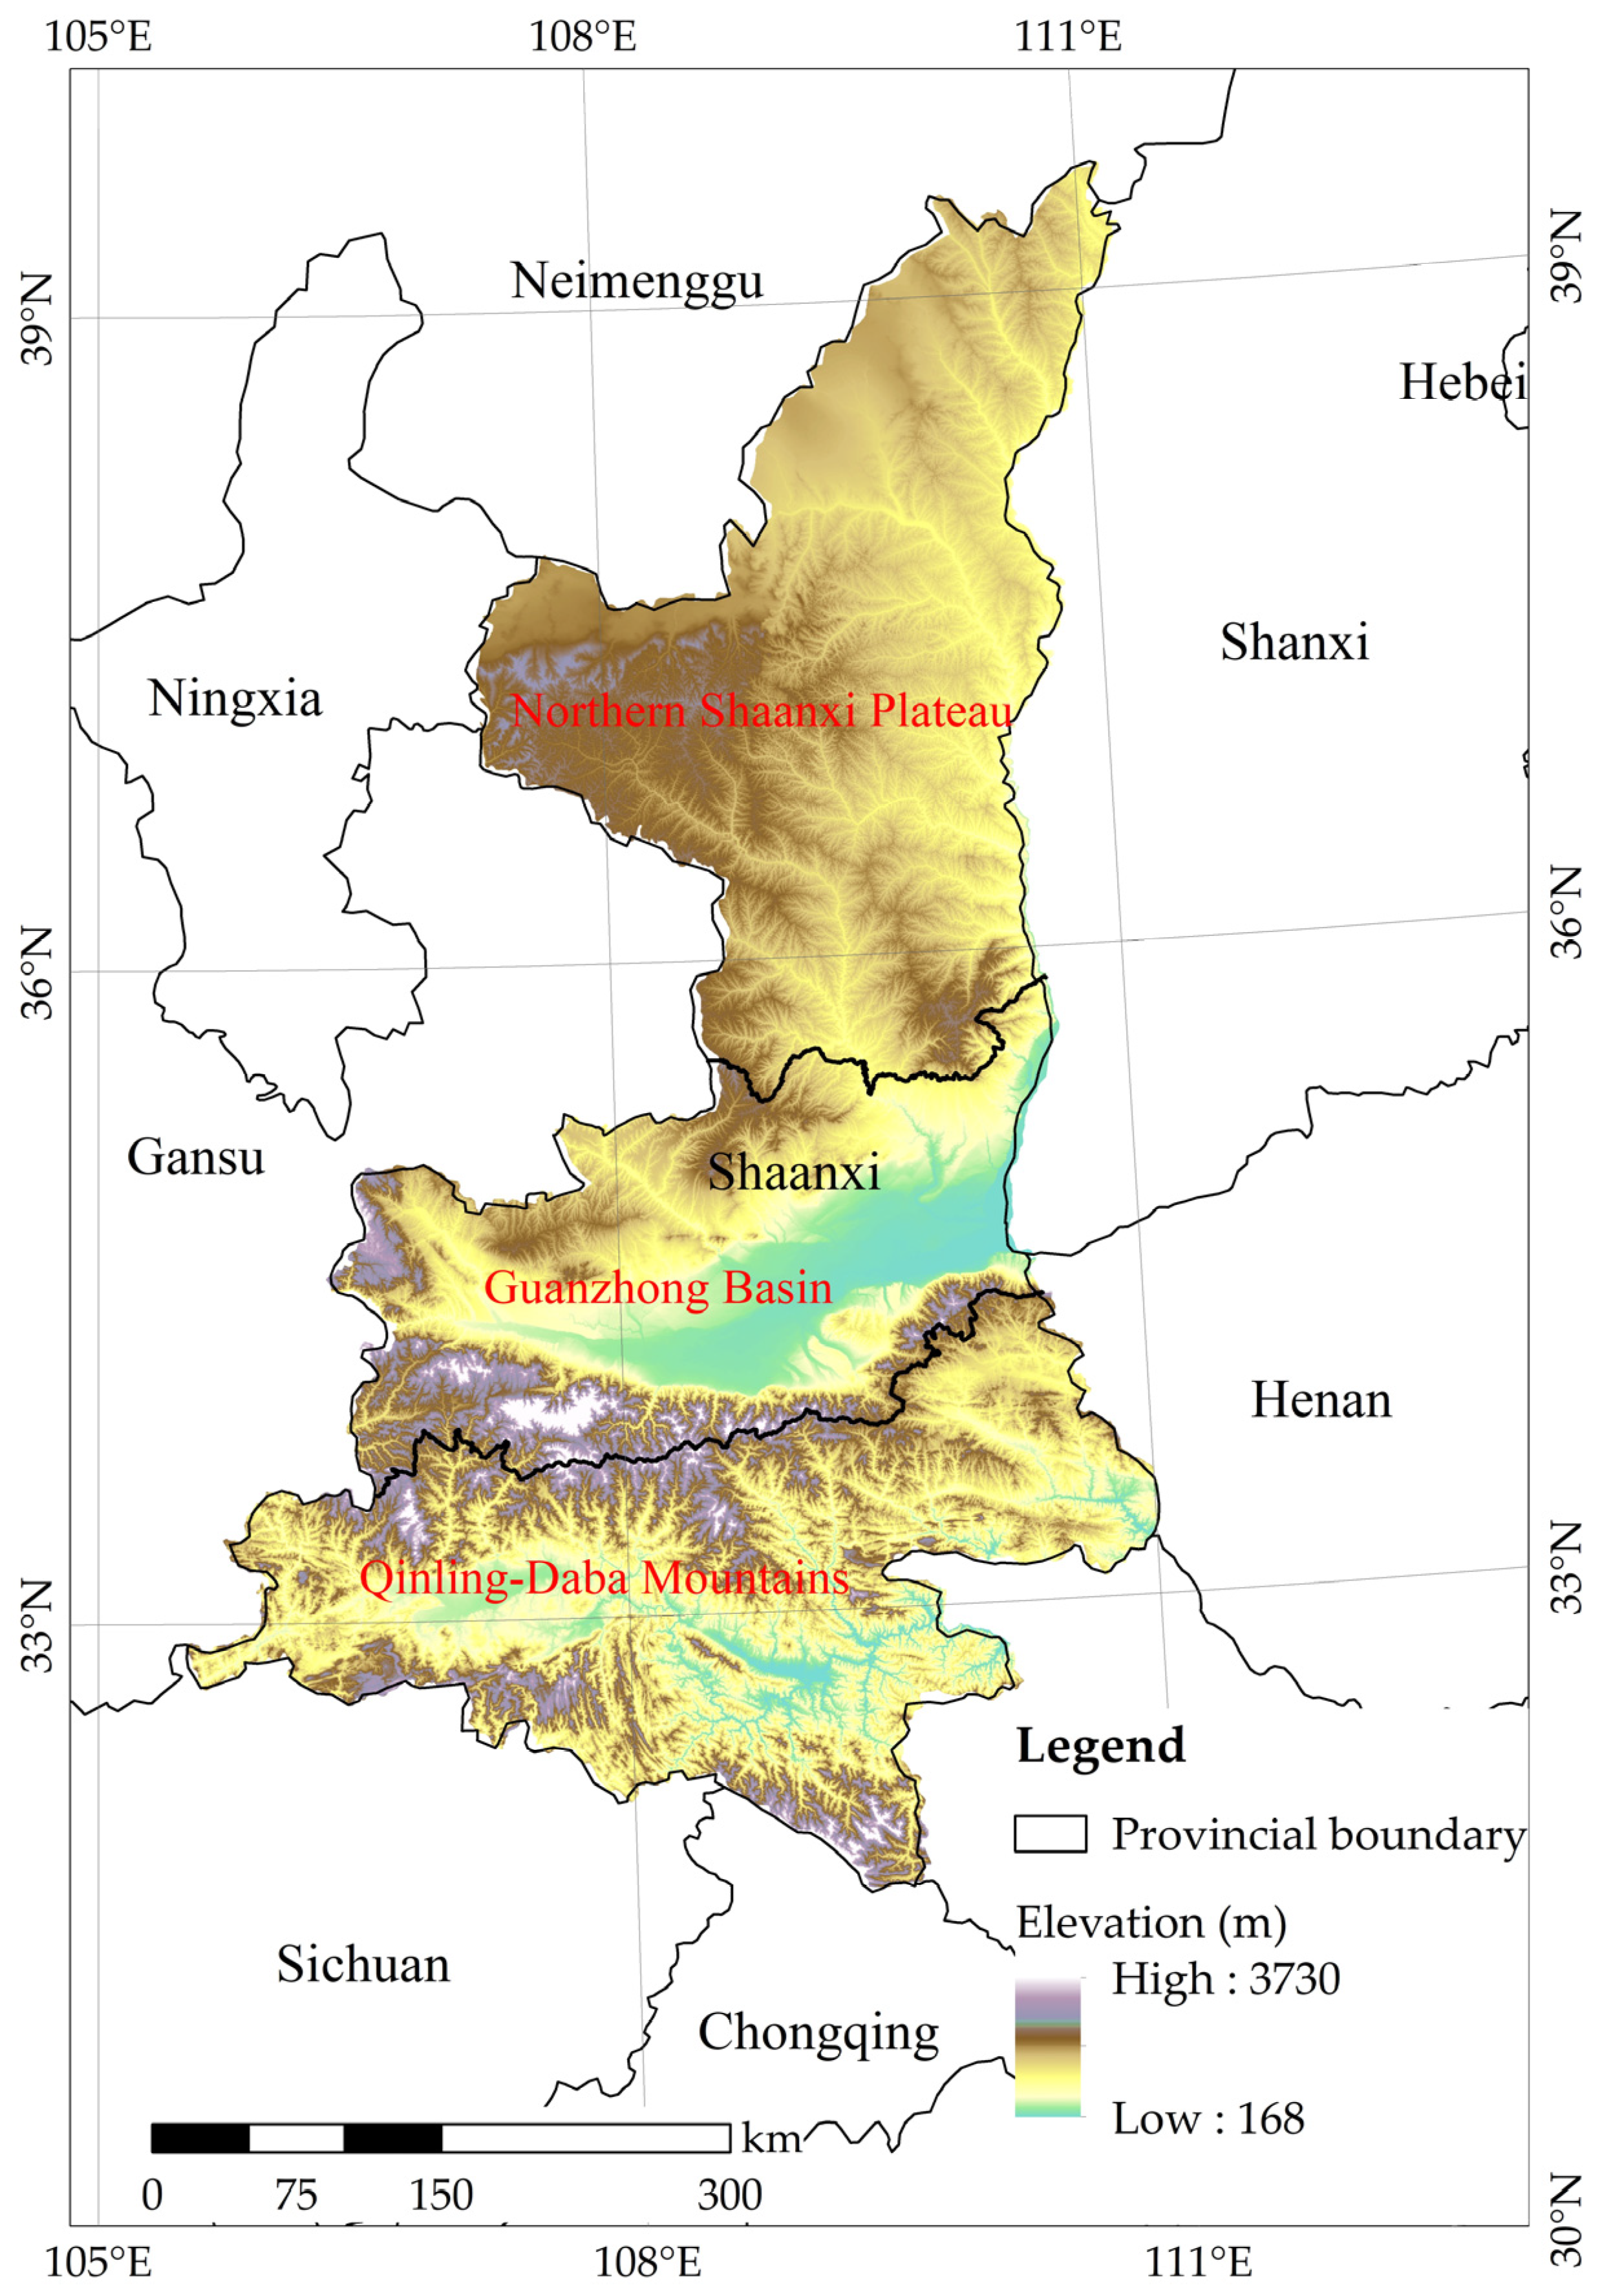
2.1. Study Area

Shaanxi Province (105°29′~111°15′ E, 31°42′~39°35′ N) is located in the hinterland of China, with a total area of 205,600 km2 (Figure 1). Shaanxi is a transitional zone between the north and south of China. The province is long from north to south and narrow from east to west, with many mountains and rivers and complex terrain. Based on topography and geology, the province can be divided into three different geomorphic regions from north to south: the Northern Shaanxi Plateau, the Guanzhong Basin, and the Qinling–Daba Mountains [23]. With the Qinling Mountains as the boundary, it is divided into two major river basins, the Yellow River and the Yangtze River, running east–west, forming three different climate types, namely, the north subtropical humid climate in south section, the warm temperate semi-humid climate in central section, and the mid-temperate climate in north section [24]. The annual average temperature is between 8 and 16 °C, and the annual average precipitation is 632.3 mm. The rainfall gradually decreases from south to north, which is mainly concentrated in July to September. In recent years, with the implementation of ecological projects such as the Grain for Green, the Green Wall of China, and the protection of natural forests, the area of forests and grasslands has increased significantly, making them the main sources of carbon storage and carbon sinks in Shaanxi Province.

2.2. Data Sources

2.2.1. Forest Resource Inventory Database

The forest resource inventory system in Shaanxi Province was established in 1978, with square plots set using a mechanical layout (8 km × 4 km). Up to now, Shaanxi Province has undergone seven sampling surveys (the years of sampling are 1987, 1990, 1994, 1999, 2004, 2009, and 2014). The assessment scope of this study mainly encompasses the carbon sink of forest land, including forest (arbor forest, bamboo forest, and shrub specially stipulated by the state), sparse woodland, non-special shrub woodland, bamboo forest, scattered woodland, and four-side tree. The assessment period for the current status of forest carbon storage and carbon sequestration capacity is from 2005 to 2015, and the future assessment periods are 2020, 2030, 2040, 2050, and 2060. All data on the area and accumulation of different forest types are from the results of the seventh (2005) and ninth (2015) forest resource inventories.
As the main component of forest resources, the area and accumulation of arbor forests of different origins (natural forests, artificial forests), age groups (young forests, middle-aged forests, near-mature forests, mature forests, and over-mature forests), and tree species are counted separately at the provincial scale. The area and accumulation of sparse woodlands are counted by tree species. The accumulation of scattered woodlands and four-side trees (trees planted by the side of roads, rivers, and fields) and the area of bamboo forests and shrublands are calculated separately. According to the division method of tree species (groups) in the “National Continuous Forest Resource Inventory Technical Regulations”, the dominant tree species (groups) with similar physiological and ecological characteristics in the above forest resource inventories were merged, and the area and accumulation data of the main dominant tree species (groups) of natural and artificial forests are divided by age groups [14].

2.2.2. Carbon Measurement Parameters

The biomass carbon measurement parameters of each dominant tree species (group) used in this paper were derived from the collation and analysis of the existing literature and field measurement data, and some carbon measurement parameters were from the “2005 China Greenhouse Gas Inventory Research” and “Forest Management Project Carbon Sink Methodology”. In the estimation, the average parameters of each age group of the tree species were used when individual tree species or age groups lacked parameters.

2.3. Estimation of Carbon Storage

2.3.1. The Carbon Storage of Arbor Forest

First, the IPCC volume–biomass method was used to calculate the biomass carbon density of different dominant tree species (groups) of each age group:
C d i , j = V i , j D i , j B E F i , j 1 + R i , j C F i , j
Then, the area was multiplied by the biomass carbon density to obtain the carbon storage of different age groups of this tree species (group):
C i , j = i = 1 n j = 1 m C d i , j A i , j
In the formula: C d i , j is the biomass carbon density of the age groups j of the dominant tree species (groups) i (Mg C·ha−2), V i , j is the unit area accumulation (m3·ha−2), D i , j is the wood density (Mg·m−3), B E F i , j is the expansion factor that converts trunk biomass into aboveground biomass (dimensionless), R i , j is the ratio of underground biomass to aboveground biomass, C F i , j is the carbon content rate, C i , j is the carbon storage (Mg C), A i , j is the area (ha−2), i is the different dominant tree species (groups), and j is the age group of the dominant tree species (groups).

2.3.2. The Carbon Storage of Sparse Woodland, Scattered Woodland, Economic Tree Species, and Four-Side Trees

In the forest resource inventory data, only the accumulation data of sparse woodlands, scattered woodlands, and four-side trees are provided. The biomass carbon storage of these forest land is the same as that of arbor forests.

2.3.3. Biomass of Bamboo Forest

Bamboo forests only have area factors in the forest resource inventory data, so the biomass density method was used to calculate the bamboo forest biomass. The bamboo forest carbon storage was obtained by biomass multiplying the bamboo carbon coefficient of 0.47 [25]. The average biomass density of bamboo forests in this study is 53.1 Mg·ha−2. The basic formula is:
B b = B m × A b
In the formula, Bb is the total biomass of the bamboo forest, Bm is the average biomass density of the bamboo forest (Mg ha−2), and A b is the area of bamboo forest (ha−2).

2.3.4. Biomass of Shrubland

Shrubs only have area factors in the forest resource inventory data, so the biomass density method was also used to assess the biomass of shrub shrubland.
B s = B n × A s
In the formula, B s is the total biomass of the shrubland (Mg), A s is the area of shrubland (ha−2), Bn is the biomass density (Mg ha−2), and 19.76 was used in this study.

2.4. Estimation of Carbon Sequestration Potential

2.4.1. Scenario Assumptions

Based on data from the seventh (2004–2008) and ninth (2014–2018) forest resource inventories, we fitted the unit area stock–age regression growth equation of dominant species. We assumed that the area and species of the existing arbor forest would remain unchanged in the future and no deforestation activities would occur. The dominant tree species (groups), forest age, and per hectare stock volume from the ninth forest resource inventory (2015) were used as a baseline. The arboreal forest stock volume for 2020, 2025, 2030, 2035, 2040, 2045, 2050, and 2060 were predicted, and the carbon storage was calculated.

2.4.2. Fitting of Unit Area Stock–Age Equation in Arbor Forests

When calculating future carbon storage, the age class of each dominant tree species (group) will shift towards higher age classes over time, and carbon storage and carbon density will further increase. Thus, we need to obtain the area and stock data of different age classes of each dominant tree species in a future year (t). According to the forest resource inventory’s classification standards and regeneration cycle for different dominant tree species (groups), we used the median value of the age class to represent the average forest age. In simulating the stock–age growth equation, the logistic function, which is more widely used and adaptable in describing the growth process of stands, was used to fit the relationship between the unit area stock volume and average forest age of each dominant tree species (group):
V i , j = a / 1 + b × e c × t
In the formula, V i , j is the unit area stock of different age groups of a certain dominant tree species (group), t is the average forest age, and a, b, c are the parameters of the fitting equation.

2.4.3. Prediction of Future Expanded Forest Area

We also made predictions about the carbon sink potential of afforestation in the future. The expanded area of arbor forest encompasses suitable forest land, including unstocked forest land, clear-cutting forestland, and existing suitable forestland. The total area of suitable forest land is approximately 2.15 million hectares in Shaanxi Province. The main afforestation species are determined based on the proportion of different dominant tree species groups observed in the artificial forest during the ninth forest resource inventory of Shaanxi Province. This study also assumed an unchangeable area ratio of dominant tree species groups referring to the ninth forest resource inventory, and all afforestation would be completed before 2040, with a stable afforestation process lasting from 2015 to 2040.

2.4.4. Calculation of Carbon Sequestration Potential

Using the logistic growth equation fitted for each dominant tree species, we calculate the stock data of each age group of each dominant tree species (groups) in the target year and use the IPCC volume-derived method to calculate the forest carbon storage of each dominant tree species (group) in the target year. The stock volume of new afforestation is calculated in the same way. The fitting parameters of the unit area stock–age fitting equation of the main dominant tree species are shown in Appendix A Table A1, and the fitting equations of some species are from the previous research results [14,26].

2.5. Data Statistical Analysis

The calculation and statistical process are completed using Excel Microsoft Office (ver. Excel 2013; Microsoft Corporation, Redmond, WA, USA). The unit area stock–-age equation of each dominant tree specie (groups) is fitted by Origin 21 (Origin Lab Corp., Northampton, MA, USA). All figures and analysis are done by Origin 21 and R software (ver. 4.1.0; R Development Core Team, Vienna, Austria).

3. Results

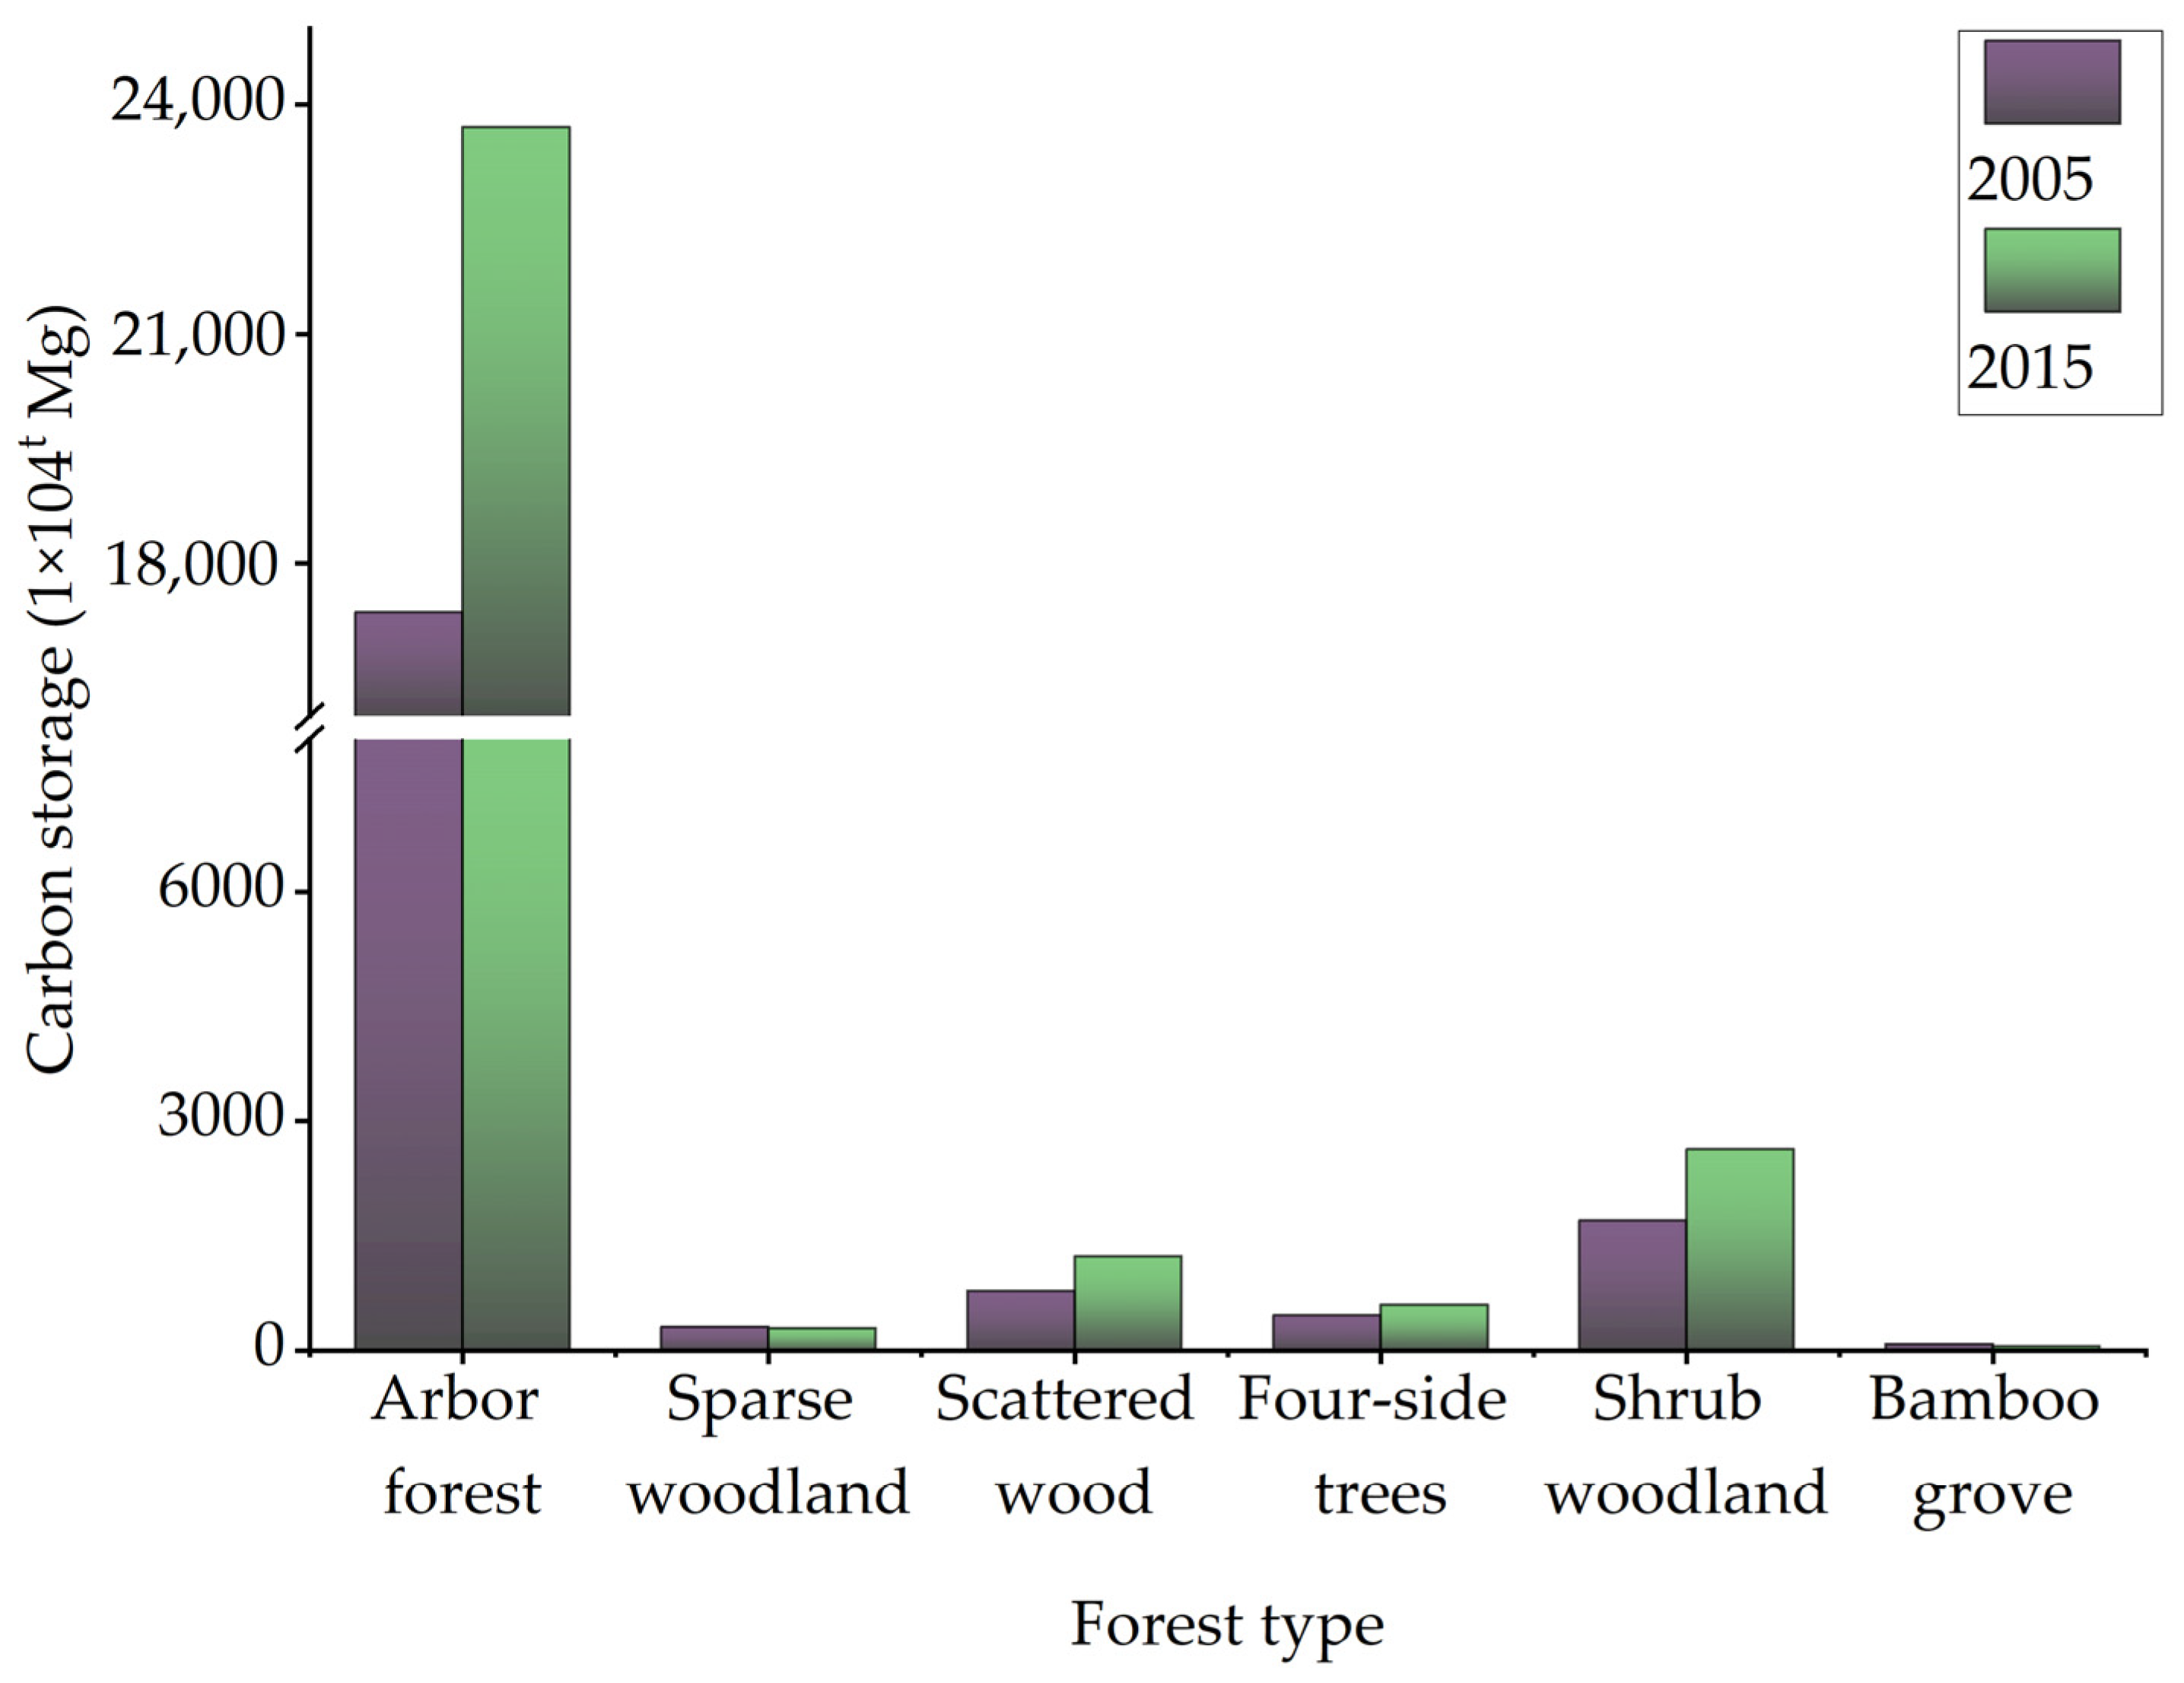
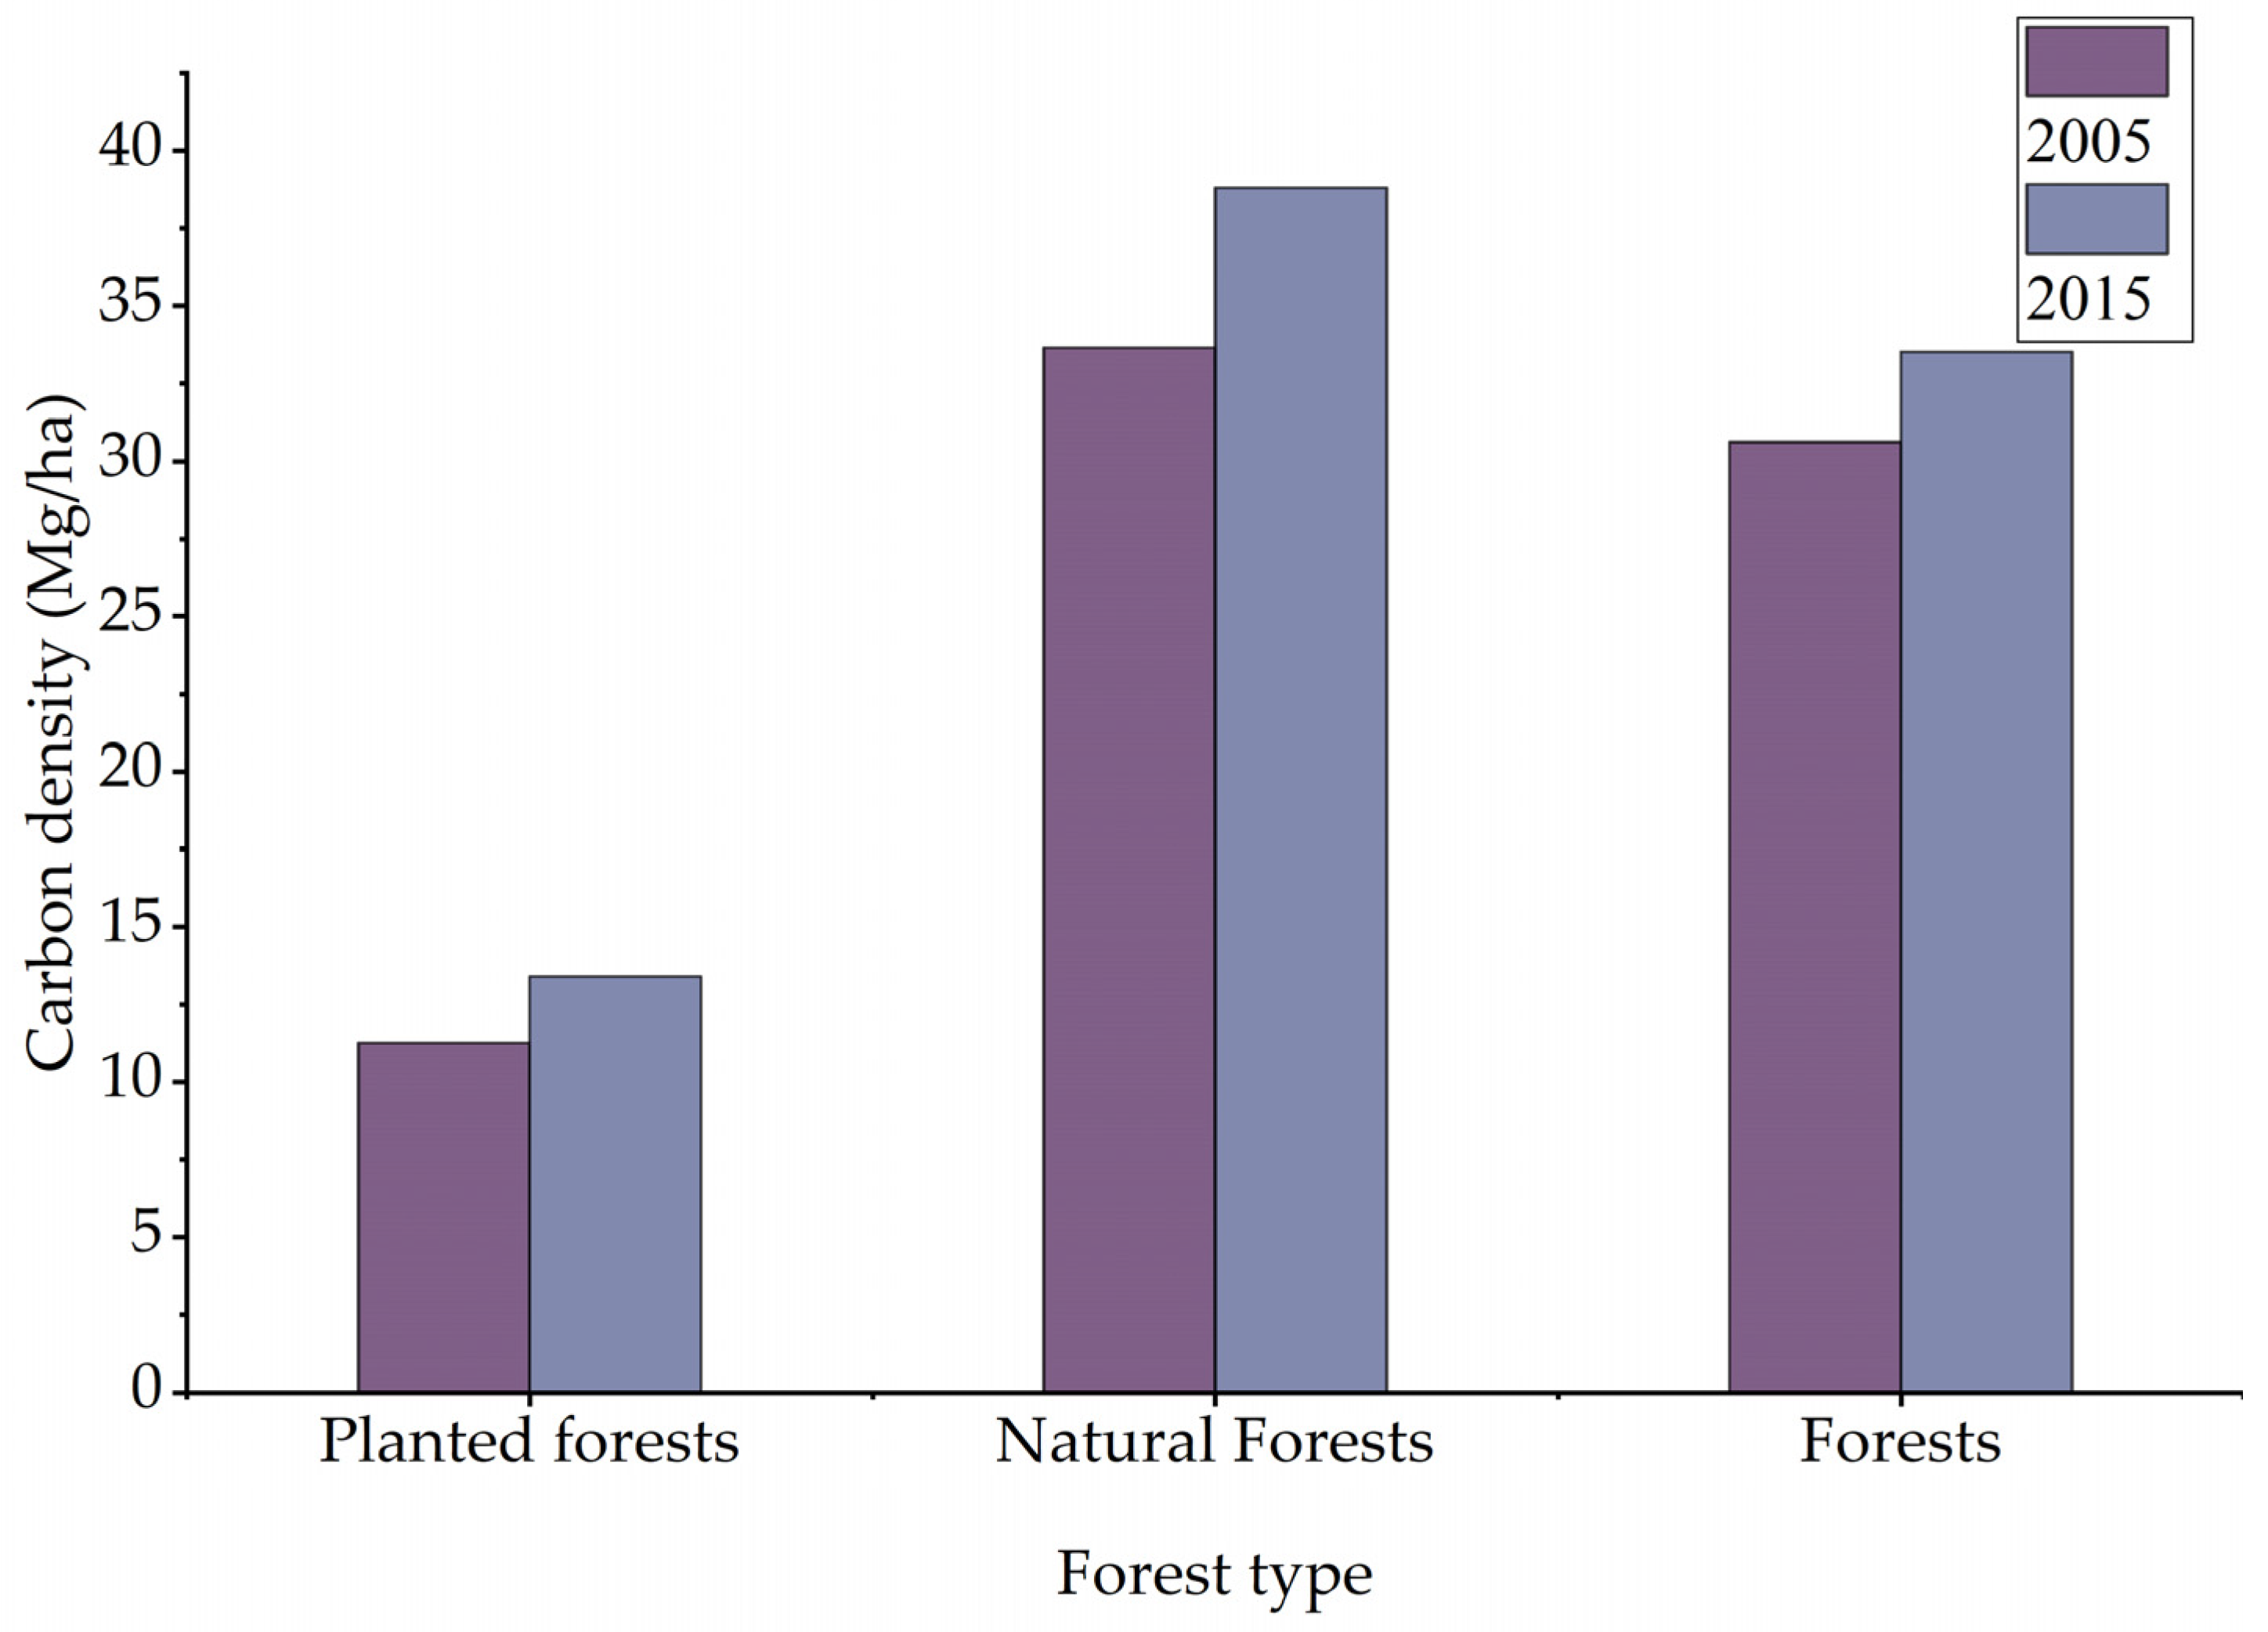
3.1. Forest Carbon Storage and Carbon Sequestration Capacity

In 2005, the total biomass carbon storage of forest vegetation in Shaanxi Province was 207 Tg (Figure 2). Of this, the biomass carbon storage of arbor forests was 174 Tg, accounting for 83.80% of the total biomass carbon storage of forest vegetation, and the biomass carbon density of arbor forests was 30.62 Mg/ha. The biomass carbon storage of sparse woodlands, scattered woodlands, four-side trees, shrublands, and bamboo forests were 3.12, 7.82, 4.66, 17.08, and 0.88 Tg, respectively. In 2015, the total biomass carbon storage of forests was 285 Tg (Figure 2). Among this, the biomass carbon storage of arbor forests was 237 Tg, accounting for 83.13% of the total biomass carbon storage of forest vegetation, and the biomass carbon density of arbor forests was 33.53 Mg/ha. The biomass carbon storage of sparse woodlands, scattered woodlands, four-side trees, shrublands, and bamboo forests were 2.93, 12.30, 5.98, 26.35, and 0.56 Tg, respectively.
During the period between 2005 and 2015, the carbon storage of forest vegetation exhibited a notable increase from 207 Tg to 285 Tg. This resulted in a total increment of 78.01 Tg over the span of 10 years, representing a growth rate of 37.65%. These findings indicate a significant carbon sequestration capacity within the forest vegetation. The primary factors contributing to the notable rise in carbon storage are the expansion of the geographical area and the accumulation of arbor forests. Specifically, over the course of a decade, the arbor forest area witnessed an increase from 5.67 × 10⁶ ha to 7.07 × 10⁶ ha, while the accumulation rose from 338.20 × 10⁶ m3 to 478.66 × 10⁶ m3. Consequently, the carbon storage of arbor forests experienced a growth from 173.61 Tg to 237.08 Tg, representing a growth rate of 36.56%.
The carbon storage of scattered woodlands exhibited the most substantial growth, with an increase from 7.82 Tg to 12.29 Tg, representing a growth rate of 57.17%. In contrast, the carbon storage of sparse woodlands and bamboo forests experienced a decrease, ranging from 3.12 Tg and 0.88 Tg to 2.93 Tg and 0.56 Tg, respectively, with reduction rates of 18.87% and 36.36%. Additionally, the carbon storage of shrublands and four-side trees demonstrated an increase from 17.08 Tg and 4.66 Tg to 26.34 Tg and 5.97 Tg, respectively, with growth rates of 54.24% and 28.12%, indicating distinct carbon sink.
Over the course of a decade, the carbon density of arbor forests experienced an increase from 30.62 Mg/ha in 2005 to 33.53 Mg/ha in 2015, indicating a growth rate of 9.51% and an average annual increase of 0.29 Mg/ha (Figure 3). Specifically, the carbon density of panted forests rose from 11.25 Mg/ha to 13.40 Mg/ha, reflecting a growth rate of 19.13%. In contrast, the carbon density of natural forests increased from 33.66 Mg/ha to 38.80 Mg/ha, demonstrating a growth rate of 15.26%. Notably, the growth rate of carbon density in artificial forests significantly surpassed that of natural forests.
This study demonstrates that the expansion of arbor forests, scattered woodlands, four-side trees, and shrublands has a substantial effect on augmenting the carbon sink capacity of forests. Additionally, the decrease in the extent of sparse woodlands suggests that the implementation of scientific and rational forest management practices has resulted in improved forest closure, thereby further contributing to the enhancement of carbon sink capacity in Shaanxi Province.

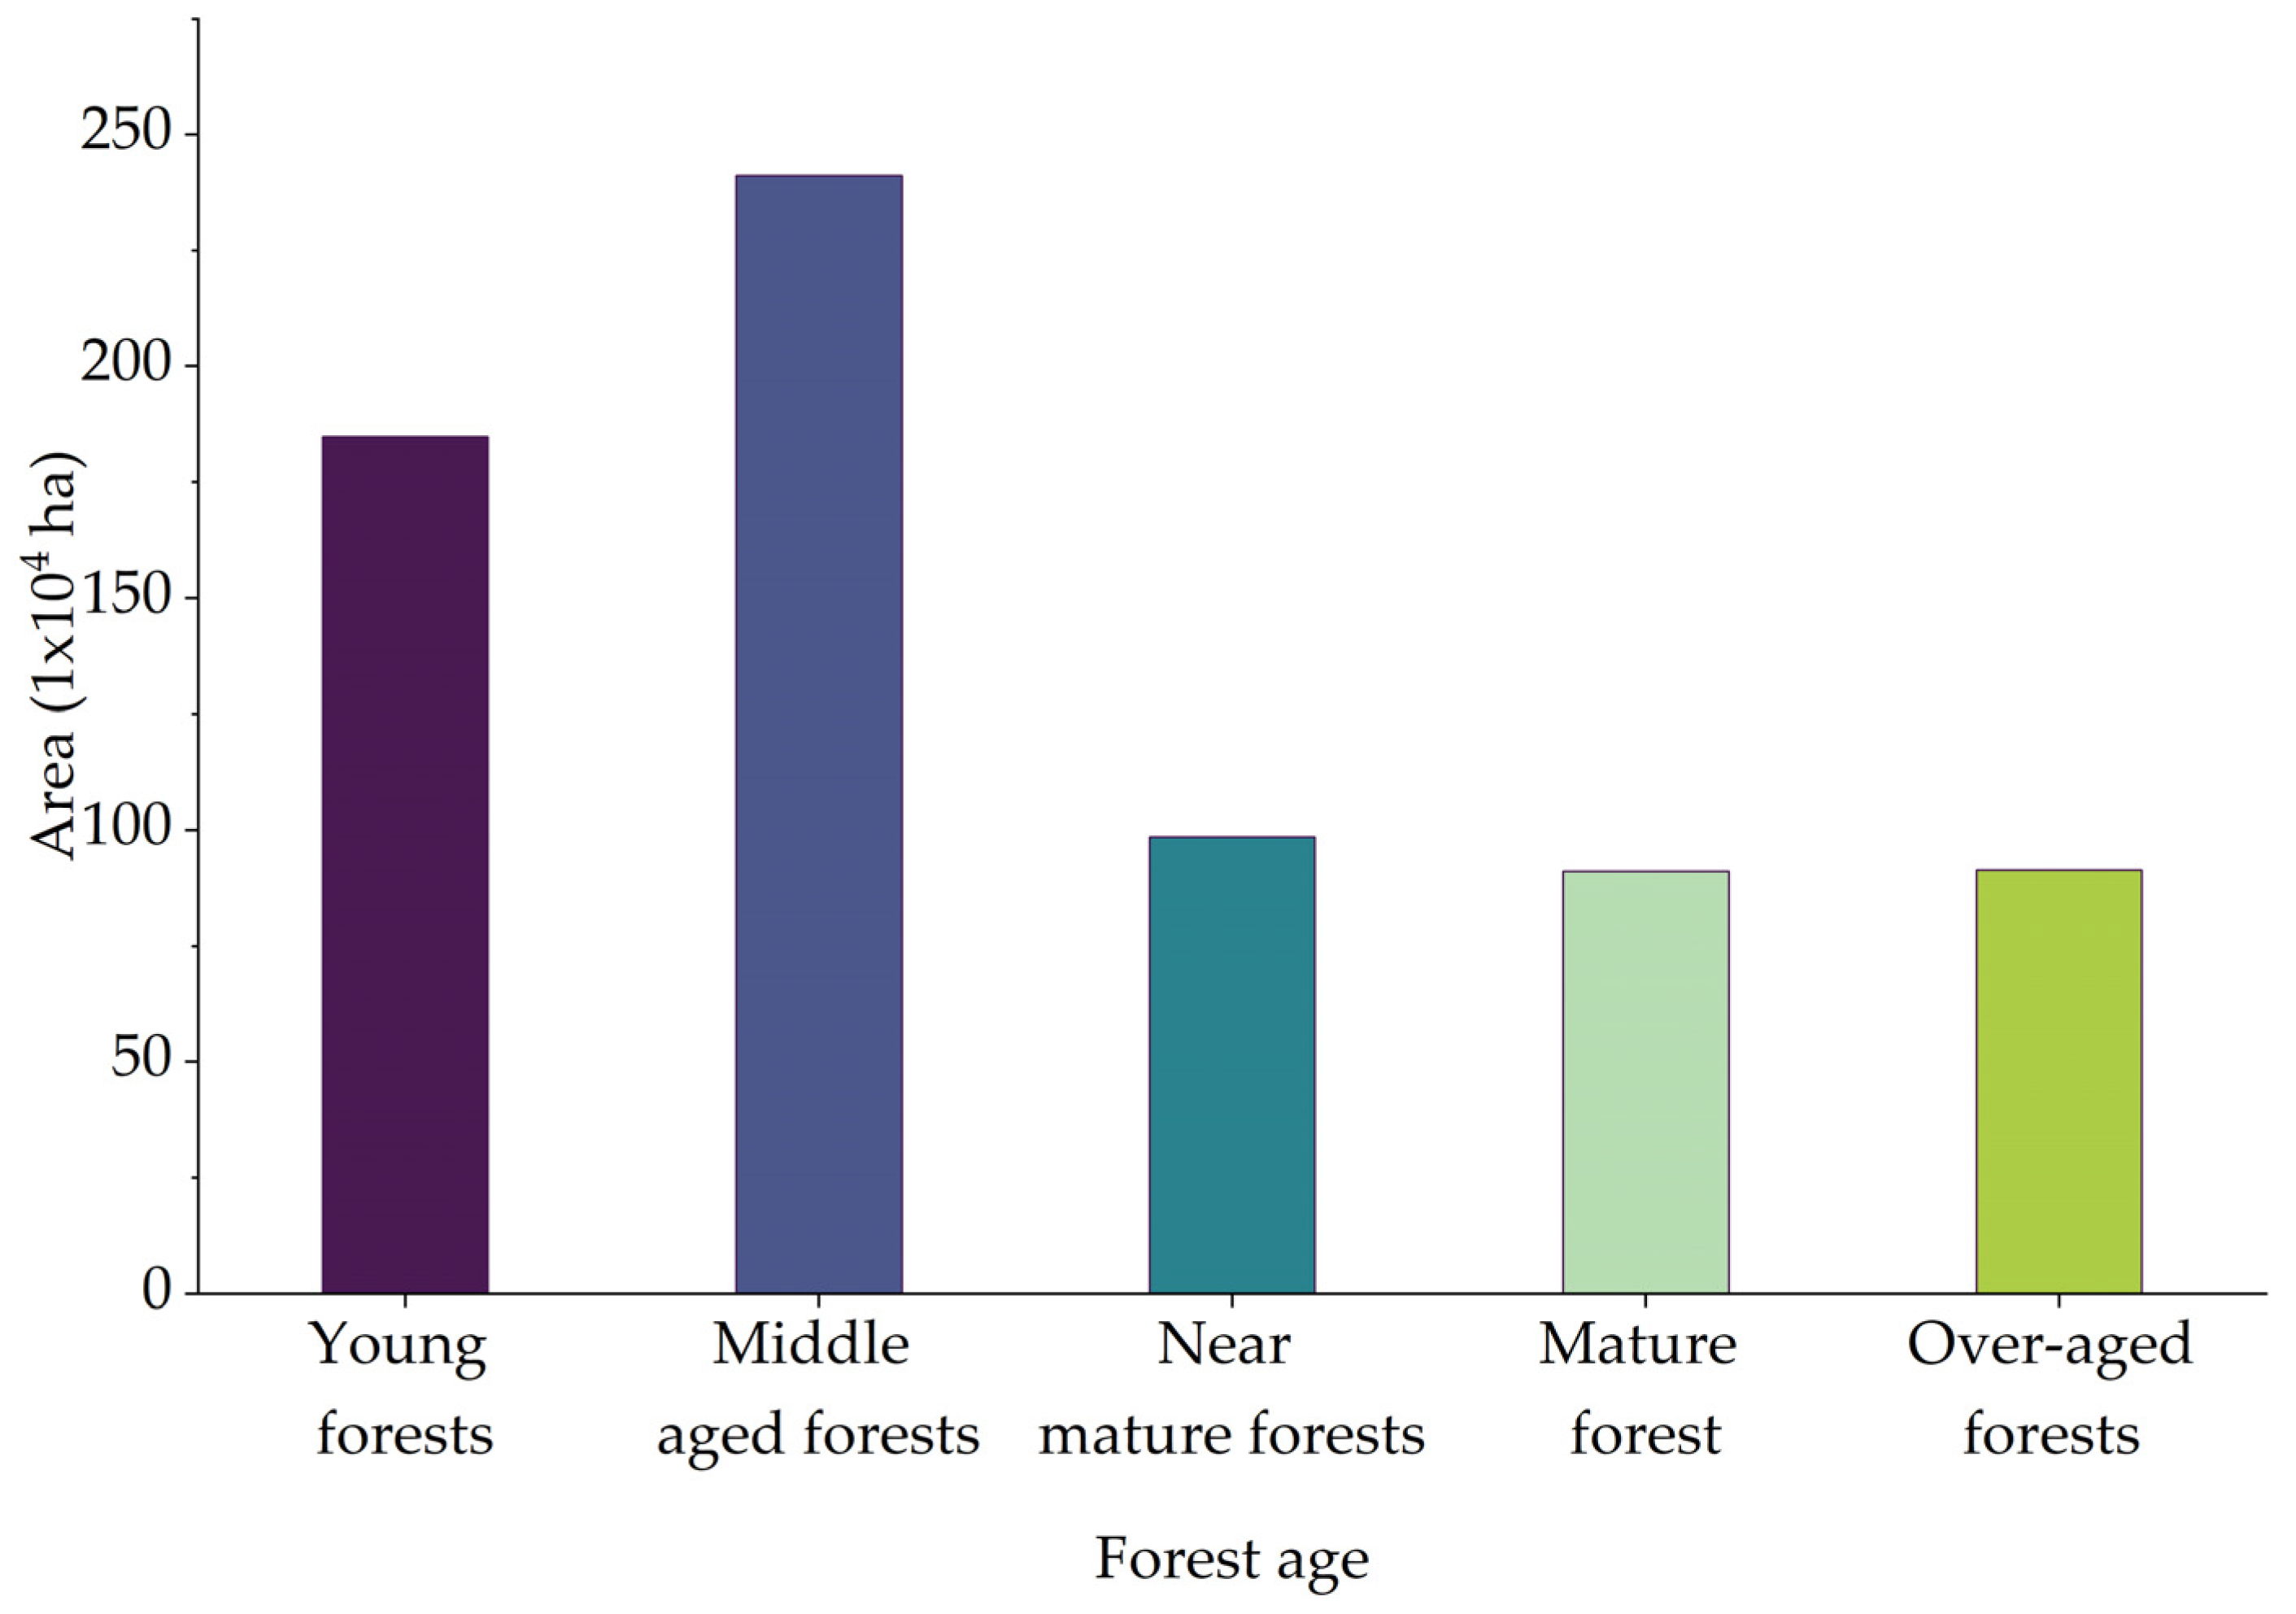
3.2. Carbon Storage and Carbon Density of Different Age Groups in Different Forest Types

The age of the forest exhibits a strong association with the carbon storage and carbon density of the arbor forests. In Shaanxi Province, the predominant composition of arbor forests consists of young and middle-aged stands, comprising 26.14% and 34.09% of the overall arbor forest area, respectively (Figure 4). Among the various age groups of arbor forests, it was observed that middle-aged forests demonstrate the highest carbon storage (66.41 Tg), which represents 28.01% of the overall carbon storage in the arbor forests. Conversely, over-mature forests, which constitute 12.93% of the total arbor forest area, possessed carbon storage that accounts for 22.97% of the total. Regarding the origin of the arbor forests, the natural forests, encompassing 79.24% of the total forest area, served as the primary source of arbor forests, reaching 91.70% of the total in Shaanxi Province (Table 1).
The mean carbon density of arbor forests was recorded as 33.53 Mg/ha. Specifically, natural forests exhibited a higher carbon density of 38.80 Mg/ha, while artificial forests demonstrated a comparatively lower carbon density of 13.40 Mg/ha. When considering various age groups, both natural and artificial arbor forests display an increase in carbon density as the forest ages. Notably, the carbon density of natural forests surpasses that of artificial forests in every age group, particularly in the near-mature and over-mature forest stages.

3.3. Carbon Storage and Carbon Density of Dominant Tree Species (Groups) of Different Origins

In natural forests, Quercus spp. forests have the highest carbon storage (79.93 Tg). Besides, the mixed broad-leaved forests, mixed coniferous and broad-leaved forests, other hard broad-leaved forests, and P. tabulaeformis were the top five dominant tree species that have large carbon storage, which accounted for 90.41% of the carbon storage in natural forests (Table 2). In artificial forests, Robinia pseudoacacia forests have the highest carbon storage of 5.26 Tg. P. tabulaeformis, mixed coniferous and broad-leaved forests, Salicaceae spp., P. massoniana, and mixed broad-leaved forests also had large carbon storage. The total carbon storage of these five dominant tree species (groups) accounted for 80.01% of the carbon storage in artificial forests (Table 3).
There were significant differences in carbon density among the dominant tree species (groups) in both natural and artificial forests. The carbon density of natural arboreal forests ranged from 18.03 to 88.80 Mg/ha. The top five natural tree species in terms of carbon density were Tsuga chinensis, Abies spp., Betula spp., Quercus spp., and P. levis. Tree species with small carbon density included Cunninghamia lanceolata, Ulmus pumila, mixed coniferous forests, Cupressus funebris, and other pine species. The carbon density of artificial arbor forests ranged from 1.23 to 29.07 Mg/ha. The top five artificial tree species in terms of carbon density were P. levis, Abies spp., Larix spp., P. massoniana, and mixed coniferous and broad-leaved forests. Tree species with small carbon density included other soft broad-leaved forests, Quercus spp., P. sylvestris, and C. funebris.

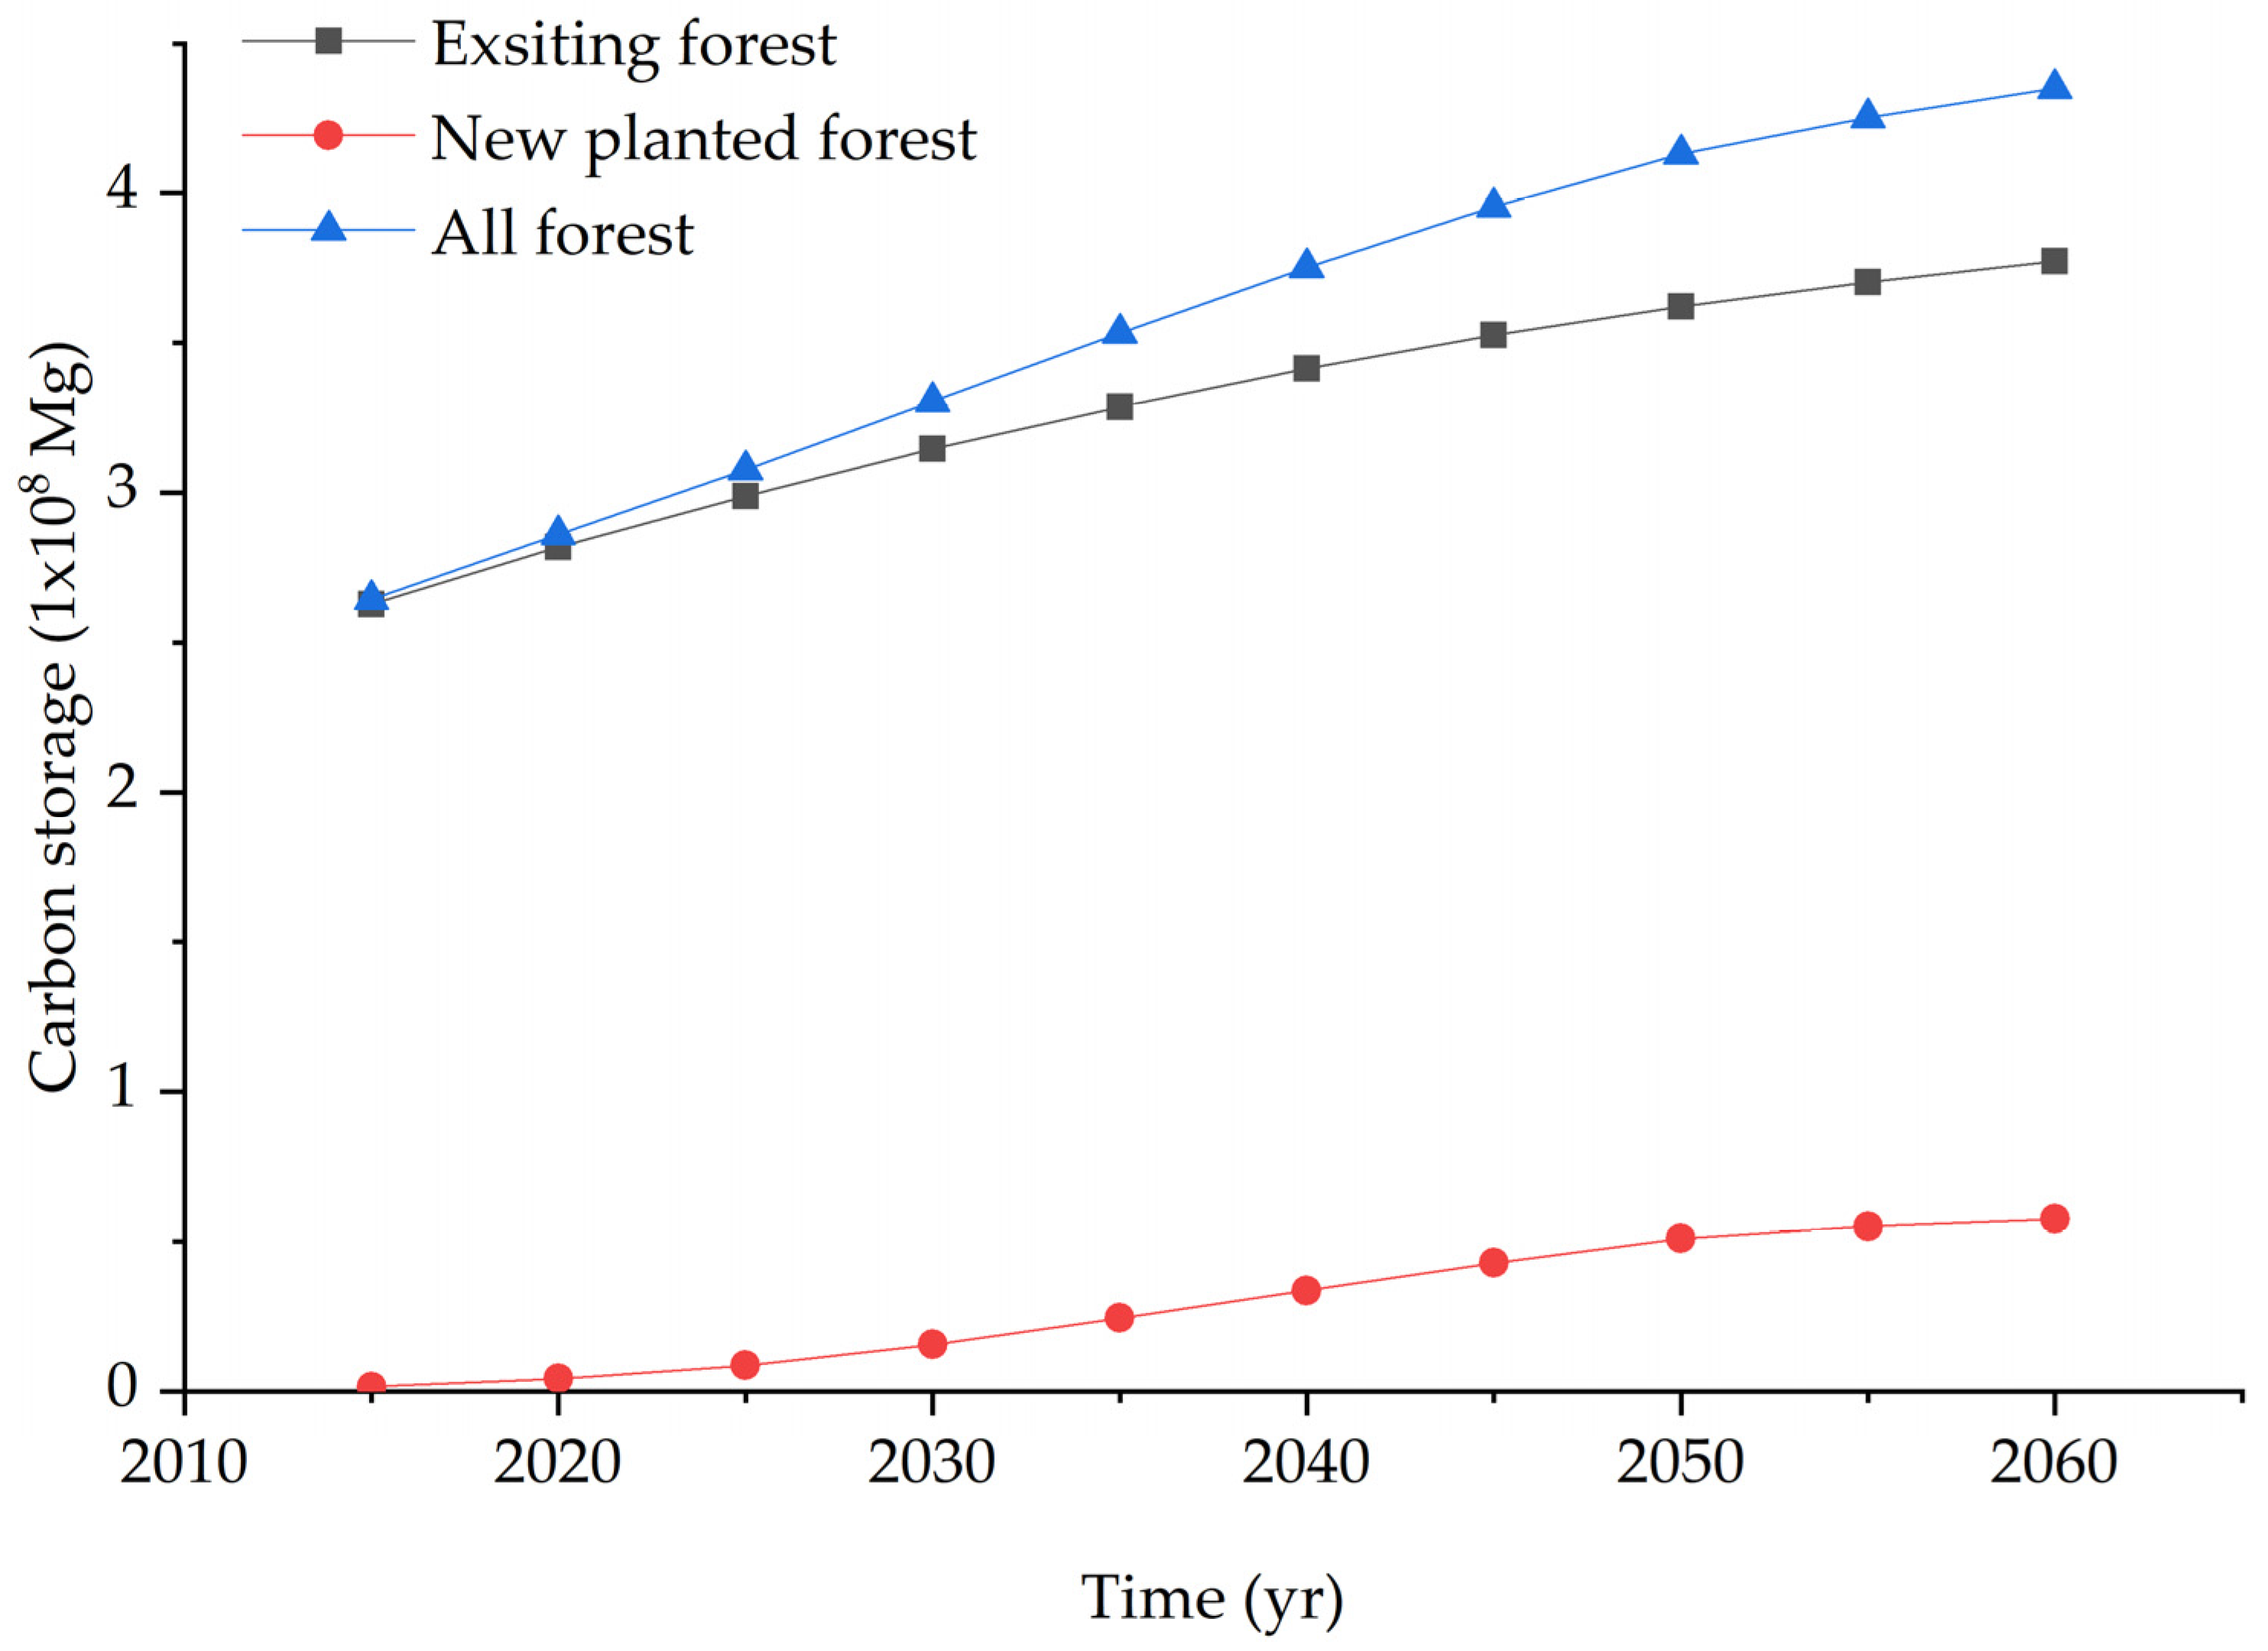
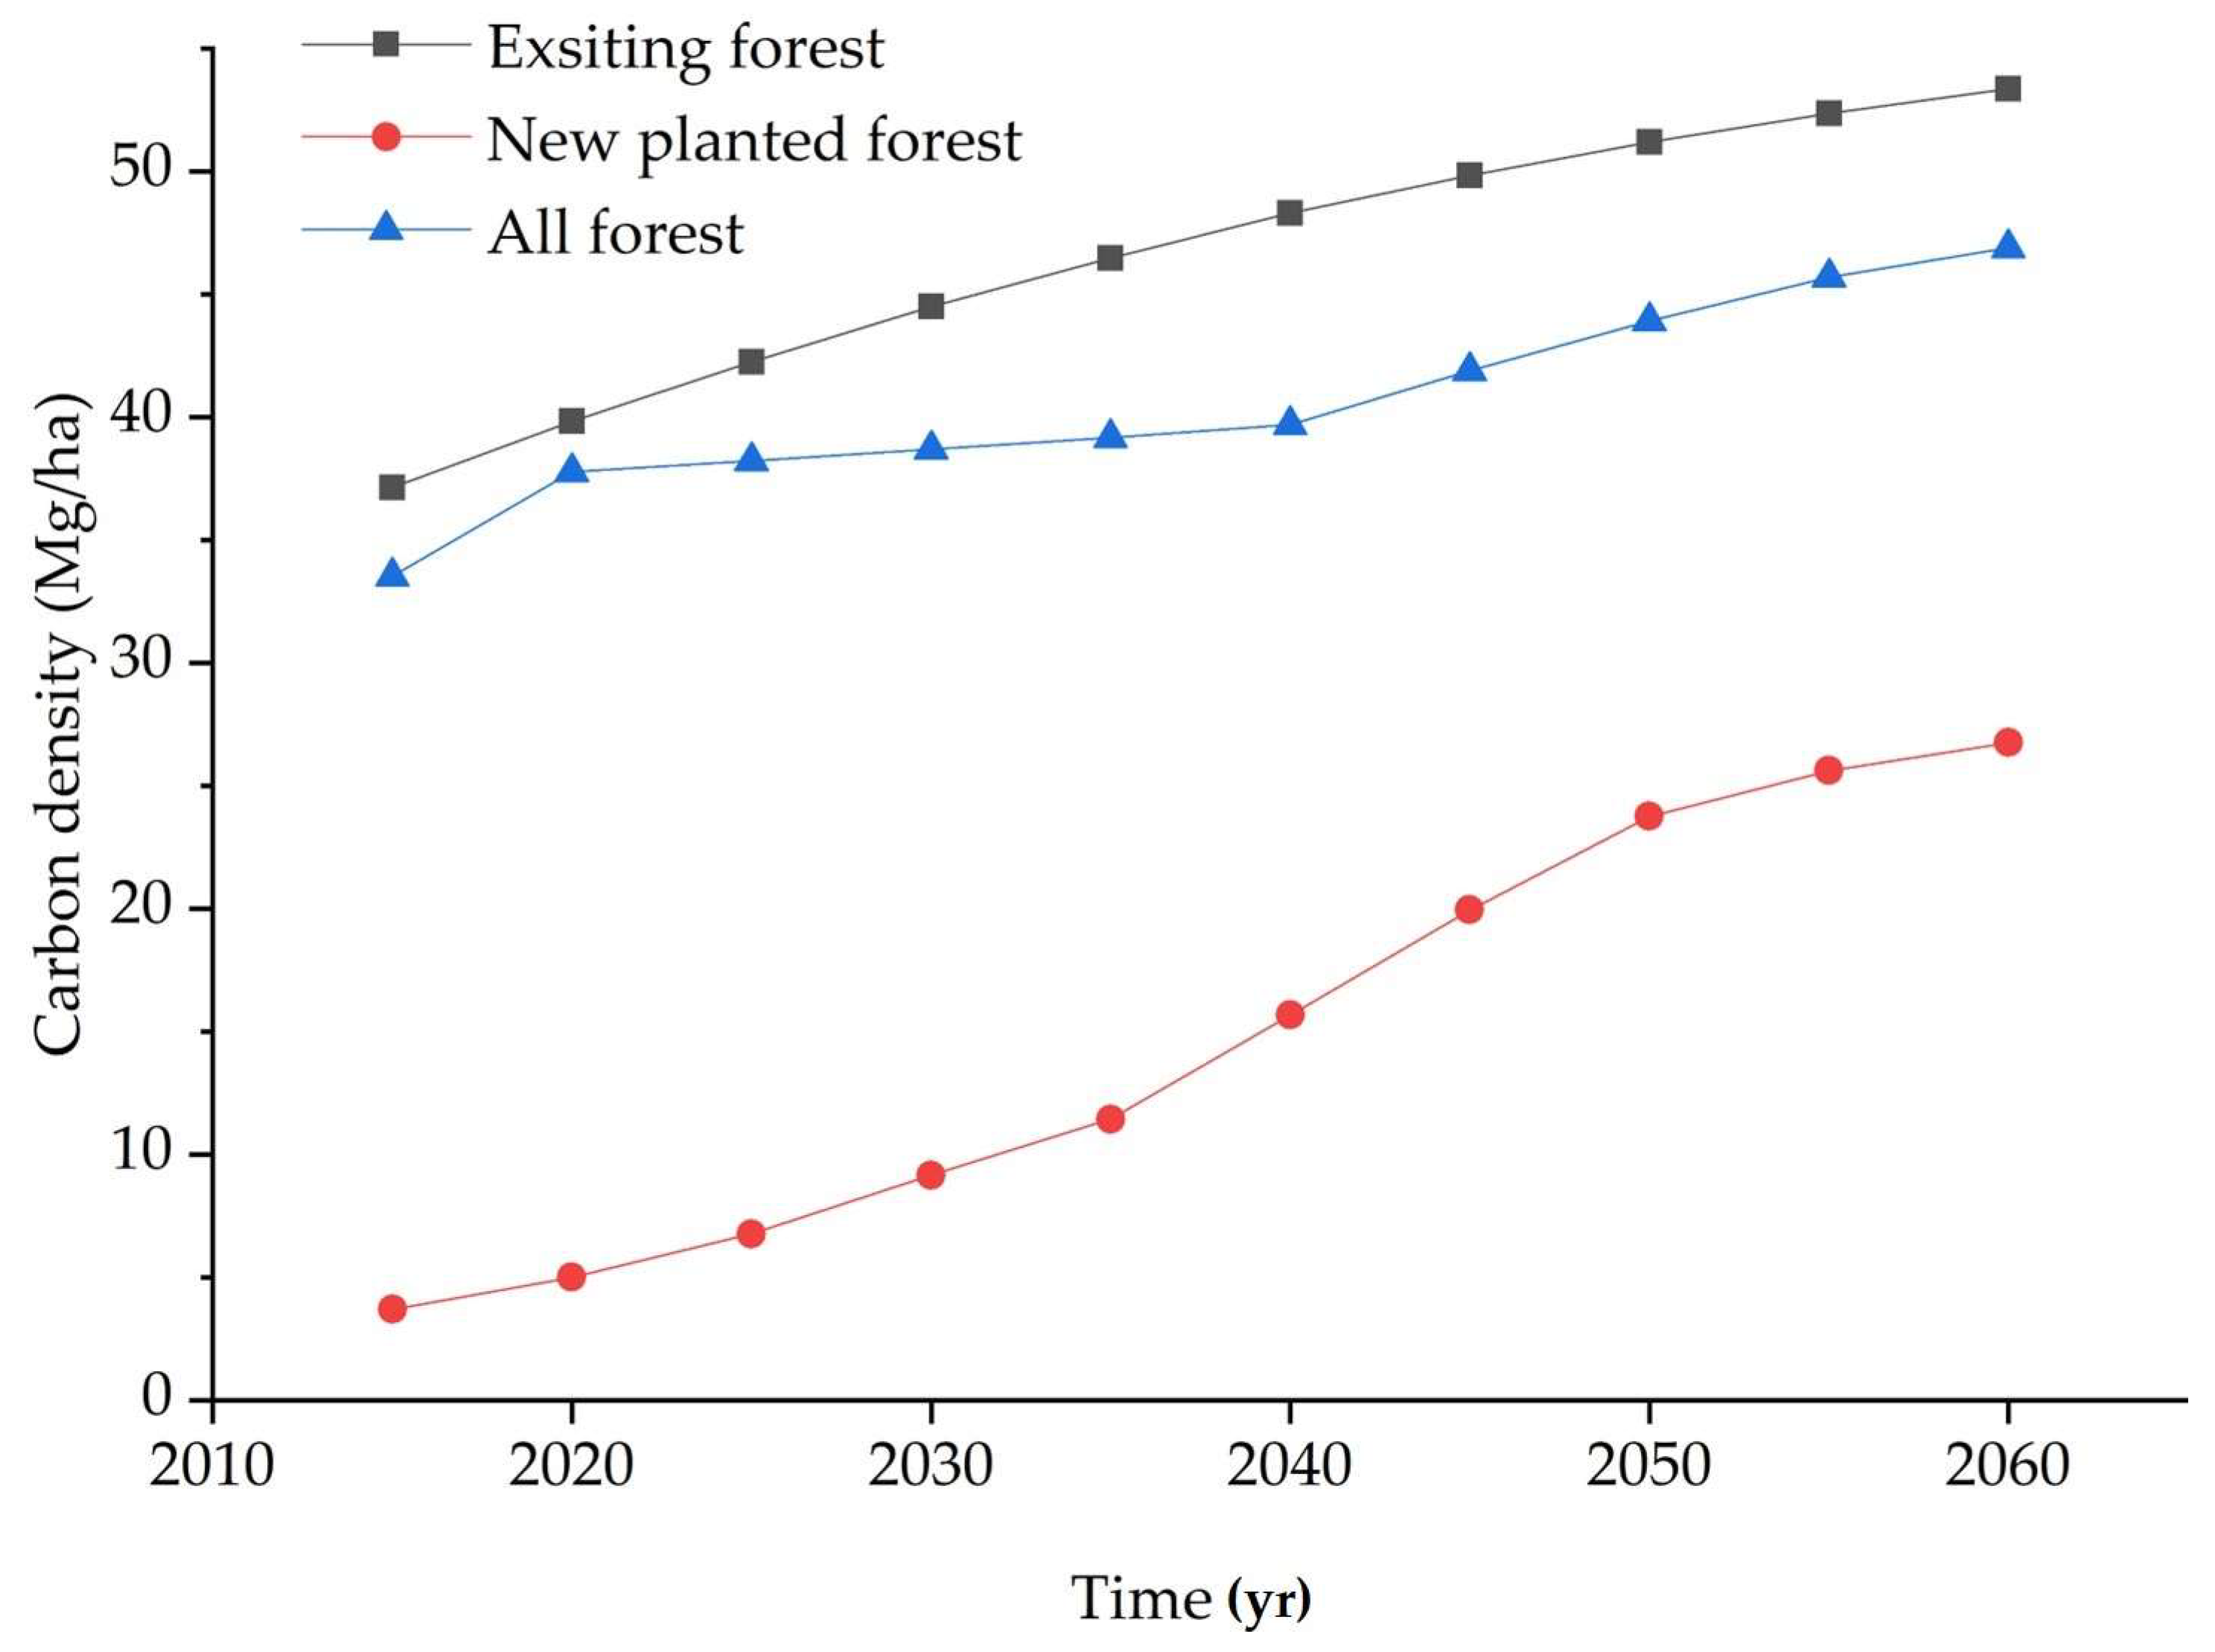
3.4. The Carbon Sequestration Potential of Arbor Forests

From 2015 to 2060, the area of arbor forests will expand from 7.07 × 10⁶ ha to 9.22 × 10⁶ ha. Newly afforested areas were the primary increment for the expansion of arbor forests, contributing a net increase of 2.15 × 10⁶ ha. As the area suitable for afforestation gradually diminishes, the future carbon sequestration potential of arbor forests is progressively shifting from the expansion of afforestation to the enhancement of the quality of existing forests. Figure 5 illustrates the variations in carbon storage of existing and newly afforested arbor forests for the years 2015, 2020, 2025, 2030, 2050, and 2060. Between 2015 and 2030, the carbon storage of arbor forests surged from 237 Tg to 323 Tg, representing a growth rate of 36%. From 2015 to 2060, the carbon storage escalated from 237 Tg to 432 Tg, marking an 82% growth rate.
From 2015 to 2030, the carbon density of arbor forests will rise from 33.53 Mg/ha to 38.69 Mg/ha, with an average annual growth of 0.34 Mg/ha (Figure 6). From 2030 to 2060, the forest carbon density will ascend from 38.69 Mg/ha to 46.90 Mg/ha, with an average annual growth of 0.27 Mg/ha. From 2015 to 2060, the forest carbon density will rapidly increase from 33.53 Mg/ha to 46.90 Mg/ha, showing a growth rate of up to 40%, with an average annual growth of 0.28 Mg/ha. Although the carbon density of arbor forests in Shaanxi Province is growing rapidly, it remains below the average carbon density of China. However, with the large-scale artificial afforestation, the area of mature and over-mature forests is steadily increasing, and the carbon density and quality of arbor forests are gradually increasing and improving. With the strengthening of forest resource management and protection, the carbon storage of arbor forests in Shaanxi Province will continue to grow for a long period, constituting a potentially vast carbon reservoir.

4. Discussion

4.1. The Influence of Forest Type and Age on Forest Vegetation Carbon Density

The carbon storage of forest vegetation in Shaanxi Province was primarily attributed to arbor forests, whose dynamic fluctuations have a substantial impact on the overall carbon storage of the forest ecosystem. The alterations in carbon storage across different forest types exhibit a positive correlation with the corresponding changes in their respective areas. Notably, mixed coniferous and broad-leaved forests, mixed broad-leaved forests, Quercus spp., P. tabulaeformis, and other hard broad-leaved forests emerge as the principal contributors to the carbon storage of arbor forests. The carbon storage per unit area of forest is closely related to the dominant tree species. The natural forest species with higher carbon density included T. chinensis, Abies spp., Betula spp., and Quercus. spp., while the artificial forest species with higher carbon density mainly included P. levis, Abies spp., Larix spp., and P. massoniana. Hence, in order to optimize the carbon sequestration benefits of forests, it is imperative for the forestry department to prioritize their focus on the structure and composition of forests in the future. When afforesting and transforming forest stands, it is recommended to cultivate more T. chinensis, Abies spp., Betula spp., Quercus. spp., P. levis, Abies spp., Larix spp., and P. massoniana, as these species have relatively high biomass and carbon density per unit area.
During the seventh forest resource inventory, the carbon densities of young, middle-aged, near-mature, mature, and over-mature forests were 8.03, 26.84, 39.68, 48.13, and 53.13 Mg/ha, respectively. By the ninth forest resource inventory, the carbon densities had increased to 11.56, 27.55, 47.56, 53.10, and 59.08 Mg/ha, respectively. The biomass carbon density of arbor forests exhibited a progressive inclination with the advancement of forest age throughout the two inventories, and all age cohorts contributed to the process of carbon sequestration. Over a decade, the carbon sequestration effects of young, middle-aged, and over-mature forests in Shaanxi Province were significant. The contribution of young forests increased from 6.97% to 9.01%, the contribution of middle-aged forests increased from 24.23% to 28.01%, and the contribution of over-matured forests increased from 21.23% to 22.79%. In contrast, the contributions of near-mature and mature forests to the carbon sink decreased.
The biomass of young forests in Shaanxi Province was small, and both the rate of carbon accumulation and carbon storage were low. Mature and over-mature forests have large carbon accumulation and high carbon storage, but the rate of carbon absorption gradually decreases. Middle-aged and near-mature forests have a larger carbon absorption rate, and their carbon storage is in a rapid growth stage, which indicates a great carbon sequestration potential. In Shaanxi Province, young and middle-aged forests occupy a large proportion of the area and carbon storage, which inevitably leads to a lower forest carbon density. However, with the improvement of forest age structure and the continuous increase in the proportion of near-mature and mature forests, the forests of Shaanxi Province will become a potential massive carbon reservoir.

4.2. Strategies and Suggestions to Increase Carbon Storage in Forests

Forestry has a unique position in addressing climate change; thus, increasing forest carbon sequestration becomes a necessary strategic choice. The total forest area in Shaanxi Province is 12.37 × 10⁶ ha. For future afforestation, the area of available afforestation land (unforested afforestation land, degraded land, and suitable afforestation land) is estimated at 2.15 × 10⁶ ha, and more land, which can be recovered from farming or grazing, can also be used to expand forest areas. Therefore, given the limited availability of forestry resources, the increase in carbon sequestration potential for forests in Shaanxi Province largely depends on forest management practices. We suggest that it is possible to increase the carbon storage capacity of forests in Shaanxi Province in the future by improving the management of forests and implementing precise measures to enhance forest quality.
Presently, the forests of Shaanxi Province are experiencing a simultaneous rise in both area and stock volume growth rates. However, it is anticipated that these rates may decline in the coming decades. To address this concern, it is recommended to implement a combination of strategies that allocate sufficient forested areas for carbon sequestration purposes, alongside the implementation of sustainable management techniques that hold the production of high-quality timber. The main ways include: (1) afforestation and reforestation to increase forest area and restoration of previously lost or degraded stands due to intensive logging; (2) promoting gradual increases of forest accumulation, using longer rotation periods in older/healthier forests with lower pest risks or building artificial forests that are more conducive to carbon storage over time; (3) reducing losses caused by disturbances such as logging, fires, and insect infestations; (4) strengthening natural forests conservation management measures like secondary growth restoration and repair work, while avoiding further exploitation of these natural resources towards reducing carbon emissions and increasing forest sinks; (5) utilizing the carbon substitution function of forests and replacing energy-intensive materials such as cement, steel, and plastics with durable wood forest products, thereby increasing terrestrial carbon storage and reducing greenhouse gas emissions caused by the burning of fossil fuels in the production of these materials. Based on the actual situation where the majority of natural forests in Shaanxi Province are young-middle-aged stands with high sequestration potentials, there is a need for research about restoring ecological functionality within these ecosystems while simultaneously improving overall quality standards. This will help to reveal how different forestry management approaches affect balancing mechanisms between multiple functions, such as increased carbon sequestration ability and species conservation needs—ultimately leading to increased capabilities for forest ecosystems in Shaanxi Province to store carbons.

4.3. Uncertainties

There are a few uncertainties in the results of this study. Although coarse woody debris (including snags, dead logs, and dead woody branches), understory litter layer, shrub layer, and herb layer are important components of forest ecosystem biomass carbon pool and have a significant impact on forest carbon dynamics, their contribution to the total carbon pool is relatively small. However, as forests are growing and ageing, the proportion of coarse woody debris in the forest ecosystem carbon pool will continue to increase [27,28]. Due to a lack of sufficient data from representative plots, this study did not include them in its estimation of carbon stocks and sink potential.
To estimate future carbon sink potential for dominant tree species at different ages per unit area, logistic growth equations based on stand area and stock volume data from forest resource inventories in Shaanxi Province were used. However, fitted curves for some species had some uncertainties that may affect estimate accuracy because we use the same parameter regardless of origins, but in fact, natural forests differ significantly from artificial stands regarding structure function as well as physiological ecology characteristics [29]. Additionally, some tree species lacked parameters or had incomplete parameter sets across different age classes; thus, similar but not identical parameters were used for estimating their respective carbon stocks.
Estimating the afforestation potential also presents subjective challenges, such as assumptions about land availability for afforestation in Shaanxi Province, along with subjectivity when selecting species and distributing areas appropriately. This study assumed that afforestation would take place according to the dominant artificial tree species proportion ratio of the ninth forest resource inventory. However, actual changes in forestry policy could lead to increased afforestation rates, meaning potentially large variations between estimated versus actual values. Further research is needed to address these issues comprehensively by collecting more data that involves all critical components while considering any changes that might occur over time, including regional policies or other relevant factors.

5. Conclusions

The total carbon stock of forest vegetation in Shaanxi Province was 285 Tg. Among these, the carbon stock of arbor forests accounted for 83.13% (237 Tg). From 2015 to 2030, the carbon stock of arbor forests (existing and newly planted) will increase from 237 Tg to 323 Tg, with a net increase of 86 Tg. Similarly, from 2030 to 2060, it will further rise from 323 Tg to 432 Tg, with a net gain of 110 Tg. The primary contributors towards the forest carbon sink potential of Shaanxi Province depend on its current forest vegetation development along with increasing afforestation areas. As young and middle-aged trees occupy a relatively high proportion, the forests are expected to continuously play an essential role in sequestering atmospheric CO2. In order to optimize the carbon storage capacity of forest vegetation and bolster its ecosystem’s capacity to sequester and stabilize atmospheric carbon, it is advisable to further enhance forest management and protection measures. Adjusting tree species structures can help improve the stocking quality per unit area of forests, ultimately leading towards stronger carbon sequestration capacities. We also suggest exploring innovative approaches for managing forest vegetation to promote carbon sequestration capabilities while simultaneously creating new opportunities for ecological forestry products derived from our forests. This will not only contribute towards achieving sustainable development goals but also aid in harmonizing ecological conservation efforts with social-economic development priorities.

Author Contributions

Conceptualization, Q.L., X.X., J.Z. and W.X.; Methodology, F.W. and J.Z.; Software, Q.L. and L.N.; Formal analysis, Q.L., X.K. and F.W.; Investigation, Q.L. and L.N.; Resources, X.X., X.K. and J.Z.; Data curation, L.N.; Writing—original draft, Q.L., X.K., F.W., J.Z. and W.X.; Writing—review & editing, X.X. and L.N.; Visualization, X.K.; Funding acquisition, X.X., X.K. and J.Z. All authors have read and agreed to the published version of the manuscript.

Funding

This research was funded by the National Social Science Fund of China (21BJY187), the Natural Science Basic Research Program of Shannxi Province (2021JLM-56), and the National Key Research and Development Program of China (2017YFC050530201).

Data Availability Statement

Data are available upon reasonable request to the corresponding author.

Acknowledgments

We appreciate the critical and constructive comments from two anonymous reviewers and thank all editors that participated in the revision process.

Conflicts of Interest

The authors declare no conflict of interest.

Appendix A

Table A1. Fitting parameters for volume–age of main tree species (groups) in Shaanxi Province.
Planted ForestsabcR2Natural ForestsabcR2
Other hard broad leaf50.98828.6260.1710.88Mixed coniferous and broad leaf123.7446.9940.0390.967
Pinus tabulaeformis271.49853.5570.0960.99Mixed broad leaf102.5562.6750.0650.888
Other soft broad leaf71.53638.3820.2120.994Quercus spp.98.18515.7970.0790.995
Pinus massoniana116.29113.8310.1370.993Other hard broad leaf110.30511.1640.0580.992
Poplar and Willow218.0824.3340.0710.988Pinus tabulaeformis165.04226.1760.0640.986
Pinus levis484.39515.5030.0260.955Other soft broad leaf106.50420.2680.2010.994
Cunninghamia lanceolata130.9412.0360.1930.988Betula spp.141.638.0030.0440.946
Larix spp.11239.9720.1720.998Pinus massoniana185.0566.9560.0460.998
Cupressus funebris51.87624.9610.0770.971Poplar and Willow84.75417.4160.1860.966
Quercus spp.236.3319.5690.0370.996Cupressus funebris146.1364.0950.0110.965
Mixed broad leaf120.3231.9470.040.675Pinus levis100.822.1950.1050.899
Robinia pseudoacacia133.5161.3170.0160.702Abies spp.292.7627.1530.0360.974
Mixed coniferous and broad leaf146.2211.9470.040.675Mixed coniferous152.00914.3060.0780.99
Castanea mollissima133.5161.3170.0160.702Cunninghamia lanceolata124.71911.40.1950.968
Mixed coniferous105.3191.8880.0350.488Ulmus pumila73.75319.5870.0860.831
Picea spp.331.6771.3950.010.621Tilia tuan126.0841.4520.0380.913
Ulmus pumila133.5161.3170.0160.702Tsuga chinensis292.7627.1530.0360.974
Abies spp.452.85112.1920.040.997Other pine species185.0566.9560.0460.998
Pinus sylvestris var. mongholica176.91816.7830.0990.992

References

  1. IPCC. Climate Change 2022: Impacts, Adaptation, and Vulnerability[M/OL]; Cambridge University Press: Cambridge, UK, 2022; pp. 3–31. [Google Scholar]
  2. Forzieri, G.; Dakos, V.; McDowell, N.G.; Ramdane, A.; Cescatti, A. Emerging signals of declining forest resilience under climate change. Nature 2022, 608, 534–539. [Google Scholar] [CrossRef] [PubMed]
  3. Ke, S.; Zhang, Z.; Wang, Y. China’s forest carbon sinks and mitigation potential from carbon sequestration trading perspective. Ecol. Indic. 2023, 148, 110054. [Google Scholar] [CrossRef]
  4. Yu, M.; Song, Y.I.; Ku, H.; Hong, M.; Lee, W.K. National-scale temporal estimation of South Korean Forest carbon stocks using a machine learning-based meta model. Environ. Impact Assess. Rev. 2023, 98, 106924. [Google Scholar] [CrossRef]
  5. Matuszkiewicz, J.M.; Affek, A.N.; Kowalska, A. Current and potential carbon stock in the forest communities of the Białowieża Biosphere Reserve. For. Ecol. Manag. 2021, 502, 119702. [Google Scholar] [CrossRef]
  6. Fu, Y.J.; Tian, D.; Hou, Z.Y.; Wang, M.G.; Zhang, N.L. Review on evaluating global forest carbon sink. J. Beijing For. Univ. 2022, 44, 1–10. [Google Scholar] [CrossRef]
  7. Case, M.J.; Johnson, B.G.; Bartowitz, K.J.; Hudiburg, T.W. Forests of the future: Climate change impacts and implications for carbon storage in the Pacific Northwest, USA. For. Ecol. Manag. 2021, 482, 118886. [Google Scholar] [CrossRef]
  8. Sha, Z.; Bai, Y.; Li, R.; Lan, H.; Zhang, X.; Li, J.; Xie, Y. The global carbon sink potential of terrestrial vegetation can be increased substantially by optimal land management. Commun. Earth Environ. 2022, 3, 8. [Google Scholar] [CrossRef]
  9. Pan, Y.; Birdsey, R.A.; Fang, J.; Houghton, R.; Kauppi, P.E.; Kurz, W.A.; Hayes, D. A large and persistent carbon sink in the world’s forests. Science 2011, 333, 988–993. [Google Scholar] [CrossRef]
  10. Pugh, T.A.; Lindeskog, M.; Smith, B.; Poulter, B.; Arneth, A.; Haverd, V.; Calle, L. Role of forest regrowth in global carbon sink dynamics. Proc. Natl. Acad. Sci. USA 2019, 116, 4382–4387. [Google Scholar] [CrossRef]
  11. Griscom, B.W.; Adams, J.; Ellis, P.W.; Fargion, J. Natural climate solutions. Proc. Natl. Acad. Sci. USA 2017, 114, 11645–11650. [Google Scholar] [CrossRef]
  12. Brienen, R.J.; Caldwell, L.; Duchesne, L.; Voelker, S.; Barichivich, J.; Baliva, M.; Gloor, E. Forest carbon sink neutralized by pervasive growth-lifespan trade-offs. Nat. Commun. 2020, 11, 4241. [Google Scholar] [CrossRef] [PubMed]
  13. Fang, J.; Chen, A.; Peng, C.; Zhao, S.; Ci, L. Changes in forest biomass carbon storage in China between 1949 and 1998. Science 2001, 292, 2320–2322. [Google Scholar] [CrossRef] [PubMed]
  14. Li, Q.; Zhu, J.H.; Feng, Y.; Xiao, W.F. Carbon storage and carbon sequestration potential of the forest in China. Clim. Chang. Res. 2018, 14, 287–294. [Google Scholar] [CrossRef]
  15. Ameray, A.; Bergeron, Y.; Valeria, O. Forest carbon management: A review of silvicultural practices and management strategies across boreal, temperate and tropical forests. Curr. For. Rep. 2021, 7, 245–266. [Google Scholar] [CrossRef]
  16. Cai, W.; He, N.; Li, M.; Xu, L.; Wang, L.; Zhu, J.; Sun, O.J. Carbon sequestration of Chinese forests from 2010 to 2060: Spatiotemporal dynamics and its regulatory strategies. Sci. Bull. 2022, 67, 836–843. [Google Scholar] [CrossRef]
  17. Chen, S.; Lu, N.; Fu, B.; Wang, S.; Deng, L.; Wang, L. Current and future carbon stocks of natural forests in China. For. Ecol. Manag. 2022, 511, 120137. [Google Scholar] [CrossRef]
  18. Chen, L.C.; Guan, X.; Li, H.M.; Wang, Q.K.; Zhang, W.D.; Yang, Q.P.; Wang, S.L. Spatiotemporal patterns of carbon storage in forest ecosystems in Hunan Province, China. For. Ecol. Manag. 2019, 432, 656–666. [Google Scholar] [CrossRef]
  19. Ren, Y.; Wei, X.; Zhang, L.; Cui, S.; Chen, F.; Xiong, Y.; Xie, P. Potential for forest vegetation carbon storage in Fujian Province, China, determined from forest inventories. Plant Soil 2011, 345, 125–140. [Google Scholar] [CrossRef]
  20. Wang, Y.; Liu, L.; Shangguan, Z. Dynamics of forest biomass carbon stocks from 1949 to 2008 in Henan Province, east-central China. J. For. Res. 2018, 29, 439–448. [Google Scholar] [CrossRef]
  21. Ma, Q.; Liu, K.; Zhang, H. Carbon Storage by Forest Vegetation and Its Spatial Distribution in Shaanxi. Resour. Sci. 2012, 34, 1781–1789. (In Chinese) [Google Scholar]
  22. Cao, Y.; Chen, Y.M.; Jin, B.; Qu, M. Carbon storage and density of forest vegetation and its spatial distribution pattern in Shaanxi Province. J. Arid Land Resour. Environ. 2014, 28, 69–73. [Google Scholar] [CrossRef]
  23. Zhang, R.; Li, P.; Xu, L. Evaluation and analysis of ecological security based on the improved three-dimensional ecological footprint in Shaanxi Province, China. Ecol. Indic. 2022, 144, 109483. [Google Scholar] [CrossRef]
  24. Hao, L.; Xu, J.J.; Zhai, Y.; Li, Y. Forest carbon storage and its dynamic change in Shaanxi province in recent 30 years. Arid. Zone Res. 2017, 34, 1056–1062. [Google Scholar] [CrossRef]
  25. Du, M.Y.; Fan, S.H.; Liu, G.L.; Feng, H.Y.; Guo, B.H.; Tang, X.L. Stoichiometric characteristics of carbon, nitrogen and phosphorus in Phyllostachys edulis forests of China. Chin. J. Plant Ecol. 2016, 40, 760–774. [Google Scholar] [CrossRef]
  26. Fu, X.; Zhang, Y.X.; Wang, X.J. Prediction of Forest Biomass Carbon Pool and Carbon Sink Potential in China before 2060. Sci. Silvae Sin. 2022, 58, 32–41. [Google Scholar] [CrossRef]
  27. Wu, P.X.; Wang, X.Z.; Wu, J.Z. Estimation of Carbon Stock and Carbon Sequestration Potential for China’s Grain for Green Project. J. Soil Water Conserv. 2022, 36, 342–349. [Google Scholar] [CrossRef]
  28. Zhu, J.H.; Tian, Y.; Li, Q.; Liu, H.Y.; Guo, X.Y.; Tian, H.L.; Liu, C.F.; Xiao, W.F. The current and potential carbon sink in forest ecosystem in China. Acta Ecol. Sin. 2023, 43, 3442–3457. [Google Scholar] [CrossRef]
  29. Guo, Q.; Ren, H. Productivity as related to diversity and age in planted versus natural forests. Glob. Ecol. Biogeogr. 2014, 23, 1461–1471. [Google Scholar] [CrossRef]
Figure 1. Location of the study area.
Forests 14 02021 g001
Figure 2. Forest carbon storage in Shaanxi Province in 2005 and 2015.
Forests 14 02021 g002
Figure 3. Forest carbon density in Shaanxi Province in 2005 and 2015.
Forests 14 02021 g003
Figure 4. Area of Different Forest Age Groups of Arbor Forests in Shaanxi Province in 2015.
Forests 14 02021 g004
Figure 5. Carbon storage changes of forests in Shaanxi Province in the future. Note: Existing forests include both natural and planted forest, while newly planted forest refers to the annual increase in afforestation area in the future. All forests include both existing and newly planted forests.
Forests 14 02021 g005
Figure 6. Carbon density changes of forests in Shaanxi Province in the future.
Forests 14 02021 g006
Table 1. Carbon storage and carbon density of forests at different forest ages.
Age GroupsForestsPlantationsNatural Forests
Carbon Stocks
(1 × 10⁴ Mg)
Carbon Density
(Mg/ha)
Carbon Stocks
(1 × 10⁴ Mg)
Carbon Density
(Mg/ha)
Carbon Stocks
(1 × 10⁴ Mg)
Carbon Density
(Mg/ha)
Total23,708.7533.531967.3313.4021,741.4238.80
Young forest2136.9311.56405.586.931731.3513.71
Middle-aged forest6640.6627.551121.6916.555518.9831.84
Near-mature forest4685.8447.56177.2624.084508.5849.45
Mature forest4841.7953.1098.1318.044743.6655.33
Over-aged forest5403.5359.08164.6721.445238.8562.53
Table 2. Carbon Storage and Carbon Density of Dominant Tree Species (Groups) at Different Forest Ages in Natural Forests (1 × 10⁴ Mg, Mg/ha).
Species (Group)TotalYoung ForestMiddle-Aged ForestNear-Mature ForestMature ForestOver-Aged Forest
Carbon StocksCarbon DensityCarbon StocksCarbon DensityCarbon StocksCarbon DensityCarbon StocksCarbon DensityCarbon StocksCarbon DensityCarbon StocksCarbon Density
Total21,741.4238.801731.3513.715518.9831.844508.5849.454743.6655.335238.8562.53
Quercus spp.7992.8848.24687.1014.511376.2340.191547.1767.181598.4665.732783.9275.71
Mixed broad leaf7895.5835.27594.8712.662445.3731.731915.7543.401913.2153.881026.3750.91
Mixed coniferous and broad leaf1612.7334.80127.9214.29563.7728.47428.1351.46323.0153.21169.9153.10
Other hard broad leaf1442.8037.32132.3316.56411.8933.08106.1130.14393.1864.67399.2946.32
Pinus tabulaeformis712.9630.5528.047.97218.0820.08120.1241.71180.9747.13165.7574.00
Betula spp.471.9252.676.3719.9044.2334.5667.1169.9166.1229.52288.0969.25
Other soft broad leaf342.5026.7635.5210.0959.8326.71106.6730.3038.0329.71102.4645.74
Poplar and Willow274.5034.3619.8712.4216.3016.9875.6847.3048.4150.43114.2339.80
Pinus massoniana205.6023.8042.1121.93163.4924.33
Abies spp.200.3456.92 76.3239.75124.0277.51
Pinus levis184.2541.138.5926.8486.8638.7829.3830.6159.4261.89
Cupressus funebris137.0918.6329.7315.4841.1818.3822.4123.3534.7018.079.0728.36
Tsuga chinensis85.2588.80 68.90107.65 16.3551.10
Tilia tuan51.3340.10 30.5947.7915.8149.404.9415.43
Cunninghamia lanceolata43.7022.7610.9311.397.6023.74 25.1739.33
Mixed coniferous41.8218.674.757.4330.1823.57 6.8921.54
Ulmus pumila34.6221.643.2210.0623.3824.35 8.0225.06
Other pine species11.5418.03 5.3316.67 6.2119.40
Table 3. Carbon Storage and Carbon Density of Dominant Tree Species (Groups) at Different Forest Ages in Planted Forests (1 × 10⁴ Mg, Mg/ha).
Species (Group)TotalYoung ForestMiddle-Aged ForestNear-Mature ForestMature ForestOver-Aged Forest
Carbon StocksCarbon DensityCarbon StocksCarbon DensityCarbon StocksCarbon DensityCarbon StocksCarbon DensityCarbon StocksCarbon DensityCarbon StocksCarbon Density
Total1967.3313.4405.586.931121.6916.55177.2624.0898.1318.04164.6721.44
Robinia pseudoacacia525.8511.11138.58.49193.569.0458.222.7470.6316.9864.9622.56
Pinus tabulaeformis377.3217.8731.254.65294.9622.4851.1239.94
Mixed coniferous and broad leaf252.7621.3774.8314.64171.5826.816.3519.86
Poplar and Willow173.7615.548.533.8346.0316.0413.1113.6611.2517.5894.8421.17
Pinus massoniana127.8525.0227.3142.688522.1915.5324.27
Mixed broad leaf116.449.3434.824.1956.917.7824.7225.75
Mixed coniferous91.0819.020.64290.4420.23
Pinus levis74.4229.074.4914.0469.9231.22
Cunninghamia lanceolata68.4916.4627.5114.3336.118.8 4.8715.23
Other hard broad leaf46.425.810.242.2918.566.455.5817.4312.0437.62
Castanea mollissima41.556.1831.226.9710.334.61
Larix spp.16.64261.64.9915.0447.01
Quercus spp.12.14.29.054.723.053.17
Ulmus pumila11.1717.46 6.9621.75 4.2213.17
Cupressus funebris9.421.964.361.052.427.582.648.24
Picea spp.8.6513.51 8.6527.02
Abies spp.8.626.89 8.626.89
Other soft broad leaf4.063.170.480.763.585.59
Pinus sylvestris0.742.310.742.31
Disclaimer/Publisher’s Note: The statements, opinions and data contained in all publications are solely those of the individual author(s) and contributor(s) and not of MDPI and/or the editor(s). MDPI and/or the editor(s) disclaim responsibility for any injury to people or property resulting from any ideas, methods, instructions or products referred to in the content.

