Article

The Sink–Source Relationship Regulated Camellia oleifera Flower Bud Differentiation by Influencing Endogenous Hormones and Photosynthetic Characteristics

1
State Key Laboratory of Efficient Production of Forest Resources, Ministry of Education, Beijing Forestry University, Beijing 100083, China
2
College of Horticulture, Xinjiang Agricultural University, Urumqi 830052, China
3
Department of Plant Science, University of California, Davis, CA 95616, USA
4
Research Institute of Oil Tea Camellia, Hunan Academy of Forestry, Changsha 410004, China
*
Author to whom correspondence should be addressed.
Forests 2023, 14(10), 1965; https://doi.org/10.3390/f14101965
Submission received: 17 August 2023 / Revised: 22 September 2023 / Accepted: 26 September 2023 / Published: 28 September 2023
(This article belongs to the Section Forest Ecophysiology and Biology)

Abstract

:
To explore the reasons for the differences in flower bud differentiation in Camellia oleifera under different sink–source relationships, different types of new shoots (T1 and T2) were selected to represent different sink–source relationships (new shoots with one fruit borne alongside at the bottom of the new shoots-T1; new shoots without one fruit borne alongside at the bottom of the new shoots-T2), and the flower bud differentiation rate, endogenous hormones and photosynthetic characteristics were determined. With the increase in the sink, the flower differentiation rate decreased significantly and the IAA and GA3 content in the leaves and ABA content in the buds increased significantly, while the GA3 and ZT content in the buds decreased significantly, which were significantly and positively correlated with the flower differentiation rate, with correlation coefficients of 0.777 and 0.817, respectively. Furthermore, an increase in the number of sinks contributed significantly to the increase in soluble sugar and starch content in leaves, while the soluble sugar and starch content in flower buds decreased significantly with the increase in sinks, with maximum differences of 3.45 mg·g−1 (soluble sugar in leaves), 4.09 mg·g−1 (soluble sugar in flower buds), 7.08 mg·g−1 (starch in leaves) and 4.87 mg·g−1 (starch in flower buds), and the high soluble sugar and starch content in flower buds at preflower bud differentiation with correlation coefficients of 0.854 and 0.837, respectively. The chlorophyll content and net photosynthetic rate increased with increasing sinks. In the presence of fruit at the base of the new shoot, more 13C assimilates were allocated to fruit and less to flower buds, resulting in a decrease in the rate of flower bud differentiation. The 13C assimilate allocated to the flower buds of T1 (6.71 mg·g−1) was significantly lower than the 13C assimilate allocated to the flower buds of T2 (10.26 mg·g−1) during late bud differentiation, and the difference between T1 and T2 was greatest during this period. Our work demonstrated that the sink–source relationship regulated Camellia oleifera flower bud differentiation by influencing endogenous hormones and photosynthetic characteristics. To achieve stable production of Camellia oleifera in successive years in the future, the ratio of the number of new shoots of the two types in relation to the different sink–source relationships should be reasonable.

1. Introduction

Leaves are the main organs for photosynthesis and the synthesis of photosynthetic products, which are the main assimilates [1]. Assimilates are synthesized from the source (mainly mature leaves) and are continuously transported to the sink (e.g., roots, seeds, shoots, and fruits), but the sink and source are not simply in a receiving and exporting relationship; they are both interdependent and interactive. Generally, a higher chlorophyll concentration and photosynthetic rate of leaves always contribute to a strong ability to synthesize assimilates, resulting in an increase in soluble sugar and starch in the source leaf [2,3]. In addition, assimilate allocation between sink organs is regulated mainly by the sink itself, and there is a great difference in the competition ability for assimilates between different sink organs. Sink strength determines assimilate allocation, and the stronger a sink is, the greater its ability to compete for assimilates [4,5,6]. Fruit is usually the strongest reproductive sink. A strong sink promotes photosynthesis in the source leaves, which means that the size of the sink and the strength of its physiological activity also affect the activity of the source [7].
The sink–source relationship can be changed by girdling, priming, blossoming and fruit thinning accompanied by a decrease in chlorophyll content and photosynthetic rate and an increase in starch in the source leaf [8,9]. In addition, sink–source relationships may be coordinated by some long-distance signaling, such as carbohydrates and phytohormones. Carbohydrates play an important role in regulating the relationship between the sink and source, with sugars acting as important transduction signals, and in the absence of carbohydrates, glycotransport proteins cannot function properly, which subsequently leads to an increase in the sugar content of the source leaf and ultimately to abnormalities in the source leaves [10]. Plant endogenous hormones, as important signals that coordinate the sink–source relationship, can influence source activity in many ways. The mechanism of action of indole-3-acetic acid (IAA) on source leaves is complex, and most scholars believe that IAA can retard the senescence of source leaves by reducing the synthesis of reactive oxygen species (ROS). However, IAA promotes phloem loading and photosynthetic product export from source leaves [10]. In contrast to IAA, abscisic acid (ABA) affects the development of source leaves by inhibiting the unloading of phloem and increasing the photosynthetic rate [11]. There are currently two theories on the effect of gibberellic acid (GA) on the source leaf: (1) GA3 significantly inhibits source leaf senescence through antagonism with ABA and promotes the activity of starch and enzymes such as fructose-1,6-diphosphatase (FBPase) and sucrose phosphate synthase (SPS) in chloroplasts, thereby regulating the configuration of photosynthetic products; (2) GA3-related signaling proteins promote source leaf senescence by interacting with other signaling proteins [12].
Camellia oleifera is an evergreen shrub or small tree of the Camelliaceae family. It is a tree with edible oil seeds and an important source of economic income in many areas of southern China. The flower buds and fruits of Camellia oleifera are very important for its yield. Its fruit development begins in late March and ends in late October, flower bud differentiation begins in early May and ends in late September, and flowering occurs from mid-October to December [13]. Strong competition for assimilates can be seen in flower and fruit development, resulting in an obvious alternate bearing. At present, most of the research on the sink–source relationship of Camellia oleifera has focused on regulating the sink–source relationship by changing the leaf-to-fruit ratio and exploring the effects of different sink–source relationships on source characteristics (leaf photosynthetic properties, carbohydrate content and enzyme activity) and on the distribution of photosynthetic assimilates and fruit quality [14,15,16]. However, less has been reported on the competitive relationship between fruits and flower buds simultaneously as sinks for the source. In addition, there are two main types of new shoots of Camellia oleifera under natural conditions: those with fruit (mostly only one fruit) at the base of the new shoot and those without fruit growing at the base of the new shoot, which are the two most common types of sink–source relationships. As the basic unit of fruiting, suitable fruiting branches can ensure successive production. Clarifying the competition between fruit and flower buds is also an important basis for developing suitable fruit-bearing branches for Camellia oleifera.
Endogenous hormones regulate flower bud differentiation by influencing plant intrinsic physiological and biochemical processes [17,18,19,20]. The IAA content in leaves and buds increased during late flower bud differentiation in Lycium [21]. Cytokinin (CTK) can increase the number of flower buds by promoting the expression level of flowering genes, such as FT and SOC1 [22,23]. High concentrations of ABA and zeatin riboside (ZR) promote floral bud differentiation, while gibberellin plays the opposite role in mango [24]. Furthermore, the photosynthetic characteristics of leaves can influence the allocation of assimilates to different organs and thus indirectly affect flower bud differentiation. Carbohydrates (starch, sucrose, etc.) in plants are important substances in the process of flower bud differentiation and are produced mainly by photosynthesis [25,26], and high carbohydrate levels in flowers are conducive to flower bud differentiation [27]. Our preliminary investigation found that the two types of Camellia oleifera new shoots mentioned above differed greatly in their flower bud differentiation under different sink–source relationships. Therefore, in this study, endogenous hormones and photosynthetic characteristics were determined under different sink–source relationships during flower bud differentiation. The objectives of this study were to examine the following: (1) the changing patterns of endogenous hormones in buds under different sink–source relationships; (2) how the photosynthetic characteristics of leaves change under different sink–source relationships; and (3) whether sink–source relationships regulate flower bud differentiation by affecting endogenous hormones and photosynthetic characteristics. Our work may provide a theoretical basis for the cultivation and renewal of fruit-bearing branches in the production of Camellia oleifera.

2. Materials and Methods

2.1. Experimental Site Description and Plant Materials

The experiment was conducted at the Camellia oleifera planting base in Yintian town, Changning city, Hunan Province (26°20′, 112°37′), with an average altitude of 72 m, subtropical monsoonal humid climate, average annual temperature of approximately 18 °C, annual rainfall of more than 1400 mm and frost-free period of approximately 290 days. The main soil was red and yellow loam, which is the main planting area of Camellia oleifera.
Six-year-old ‘Xianglin 210’ Camellia oleifera were selected for the experiment, with a height of 2.3 m, crown width of 2 m × 2 m and plant spacing of 2 m × 2 m. The trees grew well, with a stable shape, and all of them entered the stable fruiting period without diseases and pests. The flower bud differentiation period can be roughly divided into three periods, namely, the preflower bud differentiation stage, the flower bud differentiation period and late flowering bud differentiation. Our previous investigation found that the new shoots of Camellia oleifera can be roughly divided into two categories: the first type was new shoots with fruits born alongside at the bottom of the new shoots, most of which had only one fruit (T1); the second type (T2) was new shoots without fruits born alongside at the bottom of the new shoots (Figure 1). This experiment selected the above two types of new shoots. Camellia oleifera trees with uniform growth vigour were selected, and each type of new shoot had four leaves and was 8–10 cm in length, which belonged to the moderate shoots and were the main bearing shoots. The length, diameter and growth angle of the two types of selected new shoots were consistent as much as possible.

2.2. Investigation of Flower Bud Differentiation Rate

Forty-two trees were randomly selected, and each tree was divided into four directions as follows: east, west, north and south. Two new shoots of T1 and T2 were selected at random in each direction, and eight new shoots were selected for each tree. A total of 168 new shoots of each type were selected. The number of flower buds and leaf buds on each new shoot was investigated, and the flower bud differentiation rate was calculated in the late flower bud differentiation (late June). Flower bud differentiation rate = number of flower buds/(number of flower buds + number of leaf buds) × 100%.

2.3. Determination of Endogenous Hormones

At the preflower bud differentiation stage (mid-April), six new shoots of each type were randomly selected, and all buds (including flower buds and leaf buds) on the same new shoots were picked. There was a total of 12 new shoots. All of the leaves or buds on the same new shoot were utilized as replicates, which was conducted six times in total. Samples were wrapped in aluminium foil and immediately placed in dry ice and then taken back to the laboratory. All of the samples were stored in a refrigerator at an ultralow temperature of −80 °C for the determination of endogenous hormones. The endogenous hormones were IAA, GA3, ABA and trans-zeatin (ZT), and each sample was repeated three times.
The contents of endogenous hormones were determined using the high-performance liquid chromatography (HPLC) method with some modifications [28]. A 0.5 ± 0.025 g sample of leaves or buds was ground to powder in liquid nitrogen; then, 10 mL 80% (Volume:Volume) pre-cooled methanol was added, and they were extracted overnight at 4 °C. After centrifugation at 8000 r·min−1 at 4 °C for 10 min, the supernatant was retained. An amount of 8 mL 80% pre-cooled methanol was added to the precipitate and centrifuge at 8000 r·min−1 at 4 °C for 10 min, retaining the supernatant again. The supernatant of the two times was combined and concentrated to 1/3 of the original volume under reduced pressure at 40 °C. Then, 30 mL of petroleum ether was added to extract and decolorize three times, and the aqueous phase was retained. The aqueous phase was extracted three times with 20 mL of ethyl acetate, and the lipid phase was combined and then evaporated under reduced pressure at 40 °C. An amount of 2 mL of acetic acid solution at pH 3.5, purified by Sep-Pak C18 (Water Company, Phoenix, AZ, USA) column, eluted with methanol, collected and concentrated under reduced pressure to dry at 40 °C, was added. The solution was dissolved with a mobile phase and diluted to 2 mL. After filtration with 0.45 μm microporous membrane, the solution was analyzed by HPLC.
The chromatographic conditions were as follows: the chromatographic column was Eclipse XDB-C18 (250 mm × 4.6 mm, 5 μm, Agilent company, Santa Clara, CA, USA); the column temperature was 25 ± 1 °C; the detection wavelength was 254 nm; the mobile phase was methanol-water-acetic acid (Volume ratio, 45:54:1) mixture; the flow rate was 1 mL/min; the injection volume was 10 mL; and we used the quantitative external standard method.

2.4. Determination of Carbohydrates

The carbohydrates in this experiment included mainly soluble sugar and starch. Samples were collected at the preflower bud differentiation stage, the flower bud differentiation period and late flowering bud differentiation. There was a total of 12 new shoots. Six new shoots of each type were collected randomly in each period, taken back to the laboratory immediately and placed in an oven at 105 °C for 15 min, followed by drying in an oven at 60 °C until constant weight. Each type of new shoot was divided into flower buds, leaves and fruits. The soluble sugar and starch contents were measured using anthrone colorimetry and the enzymatic hydrolysis method [29], respectively.

2.5. Determination of Photosynthetic Characteristics

The net photosynthetic rate and chlorophyll content were the most common parameters reflecting leaf photosynthetic characteristics. The net photosynthetic rate and chlorophyll content of leaves on the new shoots were measured in the same period as 2.4. For each type, six new shoots were chosen as test materials. In each period, the experiment was conducted using the third or fourth intact mature leaves of the shoots. It is important to note that the leaves were not obtained through in vitro methods. The net photosynthetic rate was measured with a portable photosynthesizer LI-6400 (LI-Cor, Inc., Lincoln, NE, USA) from 9:00 a.m. to 11:00 a.m. The red and blue light was set to 1500 μmol m−2·s−1. The leaf temperature was set to 25 °C, and the relative humidity was 60%–70%. The carbon dioxide concentration in the reference room was stable at about 380 μmol mol−1. The data were measured according to the automatic measurement system of the photosynthetic instrument. Before each determination, all the leaves of the marked shoots were covered with tin foil paper to provide dark treatment. The leaves were kept in the dark for 30 min. Following the dark treatment, the tin foil paper was removed and activated for 30 min, and the determination was started. A 1:1 mixture of acetone and ethanol was used to extract chlorophyll from the leaves, and the chlorophyll content was measured with an enzymatic standard [29].

2.6. 13C Labeling and Determination Analysis

13C isotope labeling was conducted at the preflower bud differentiation stage with clear weather and sufficient sunlight, and the labeling time was from 8:00 a.m. to 12:00 p.m. Twenty-four new shoots of each type of new shoot were selected, for a total of forty-eight. The new shoots were covered and marked with light-permeable polythene plastic bags [14].
The first samples were taken 4 h after labeling, and the sampling periods of other samples were the same as 2.4, and 6 shoots of each type were collected in each period. The new shoots were divided into fruit, leaves, flower buds and shoots. All samples were deactivated at 105 °C for 15 min and then dried at 60 °C to constant weight. The samples were crushed with a ball mill. Shoots were ground twice at 30 r/min for 30 s; leaves and flower buds were ground at 20 r/min for 30 s; fruits were first cracked and then ground at 20 r/min for 30 s and then passed through a 200-mesh sieve. All the samples were sent to the Institute of Agricultural Environment and Sustainable Development, Chinese Academy of Sciences, for 13C isotope determination, including the δ value of 13C and the percentage of total carbon. The abundance of 13C was determined using a mass spectrometer (IsoPrime 100, IsoPrime Ltd., Manchester, UK). The natural abundance of 13C in unlabeled samples is represented by δ 13C. The abundance of artificial 13C labeled samples is represented by atom%. The amount of carbon in each organ of the plant is represented by Ci. The amount of 13C in each organ of the plant is represented by 13Ci. The analysis of 13CO2 was performed using the method described by Wen [16].
δ 13C (‰) = (Rs/R − 1)
Rs = 13C/12C unlabeled samples; R is the standard ratio of carbon isotope, R = 0.1112372.
Atom%13C = (δ 13C + 1000) × R/[(δ 13C + 1000) × R + 1000] × 100.
Ci (g) = Dry matter weight (g) × C%.
13Ci (mg) = Ci × [(Atom%13C) labeled abundance − (Atom%13C) unlabeled abundance] × 1000.

2.7. Statistical Analysis

All data were analyzed by t-test using SPSS 18.0 (SPSS Inc., Chicago, IL, USA). Differences at p ≤ 0.05 were considered significant. A correlation analysis was examined using Pearson’s (parametric) procedures. The correlation between the flower bud differentiation rate of twelve new shoots (each type contains six new shoots) randomly selected and the endogenous hormones content of leaves or buds of twelve new shoots (each type contains six new shoots) was analyzed. The correlation between the flower bud differentiation rate of twelve new shoots (each type contains six new shoots) randomly selected and the soluble sugar (or starch) of leaves or flower buds of twelve new shoots (each type containing six new shoots) was analyzed. SigmaPlot 12.0 (Systat Software Inc., San Jose, CA, USA) was used for drawing.

3. Results

3.1. Flower Bud Differentiation Rate of New Shoots in Different Sink–Source Relationships at Late Flower Bud Differentiation

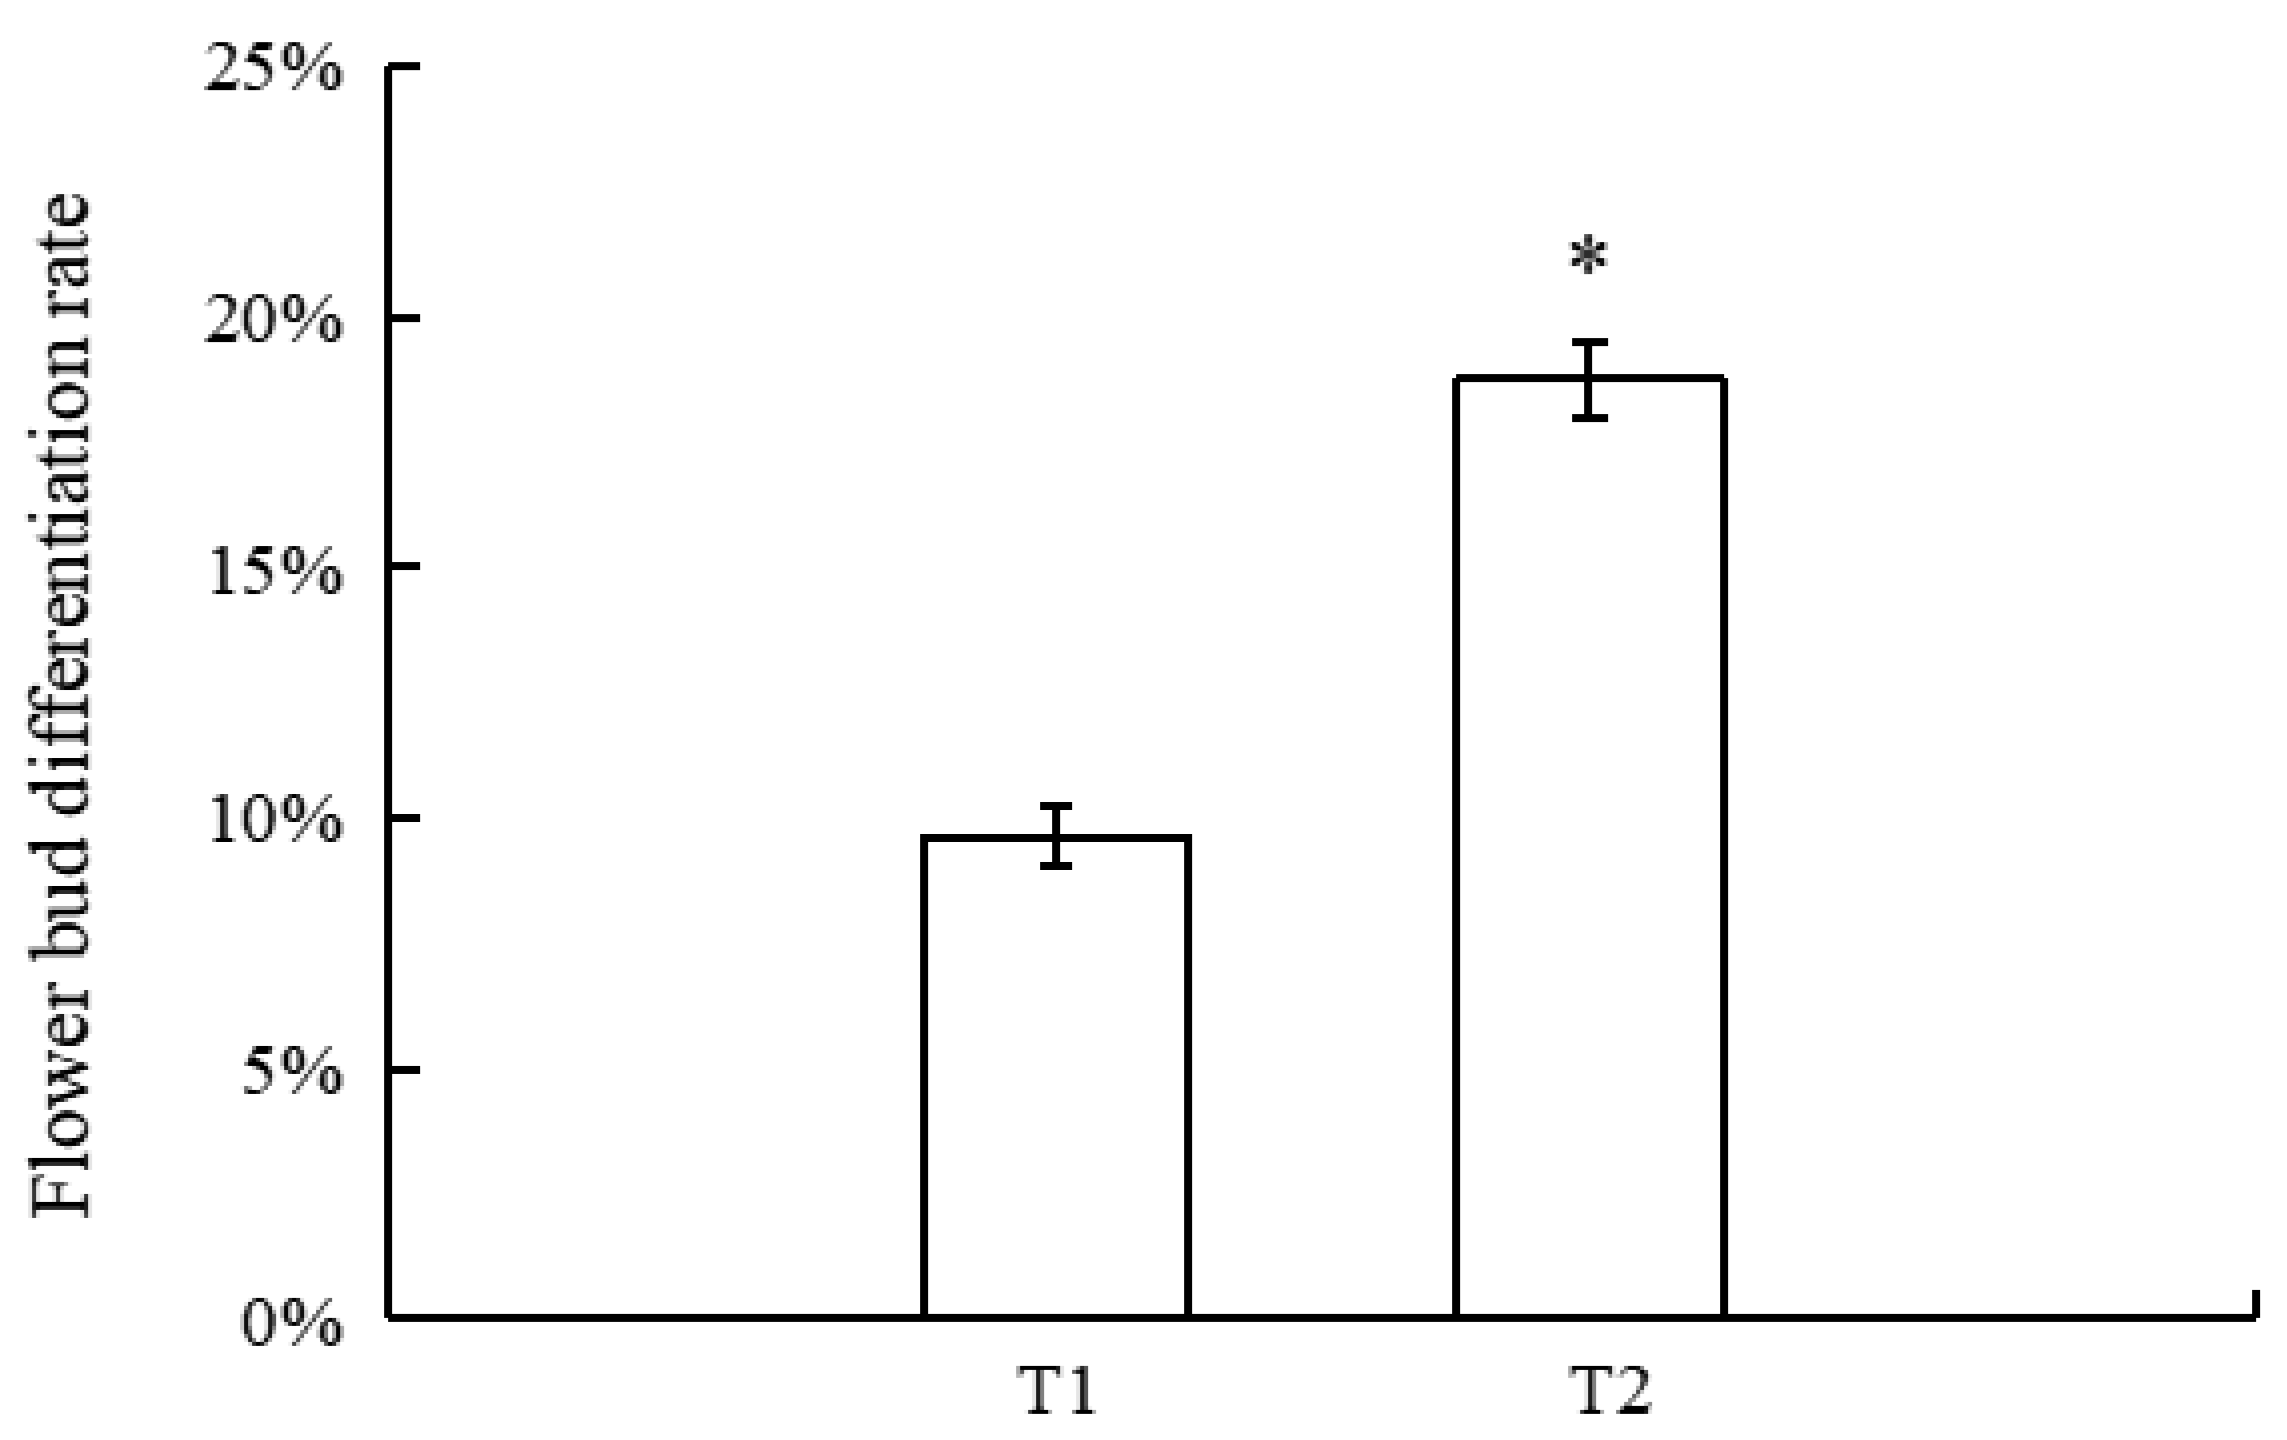
The flower bud differentiation rates were 9.63% for T1 and 18.75% for T2, which were 94.70% higher than the flower bud differentiation rates of T1, indicating that the flower bud differentiation rate of new shoots decreased with increasing sink (Figure 2).

3.2. Endogenous Hormones of New Shoots in Different Sink–Source Relationships at the Preflower Bud Differentiation Stage

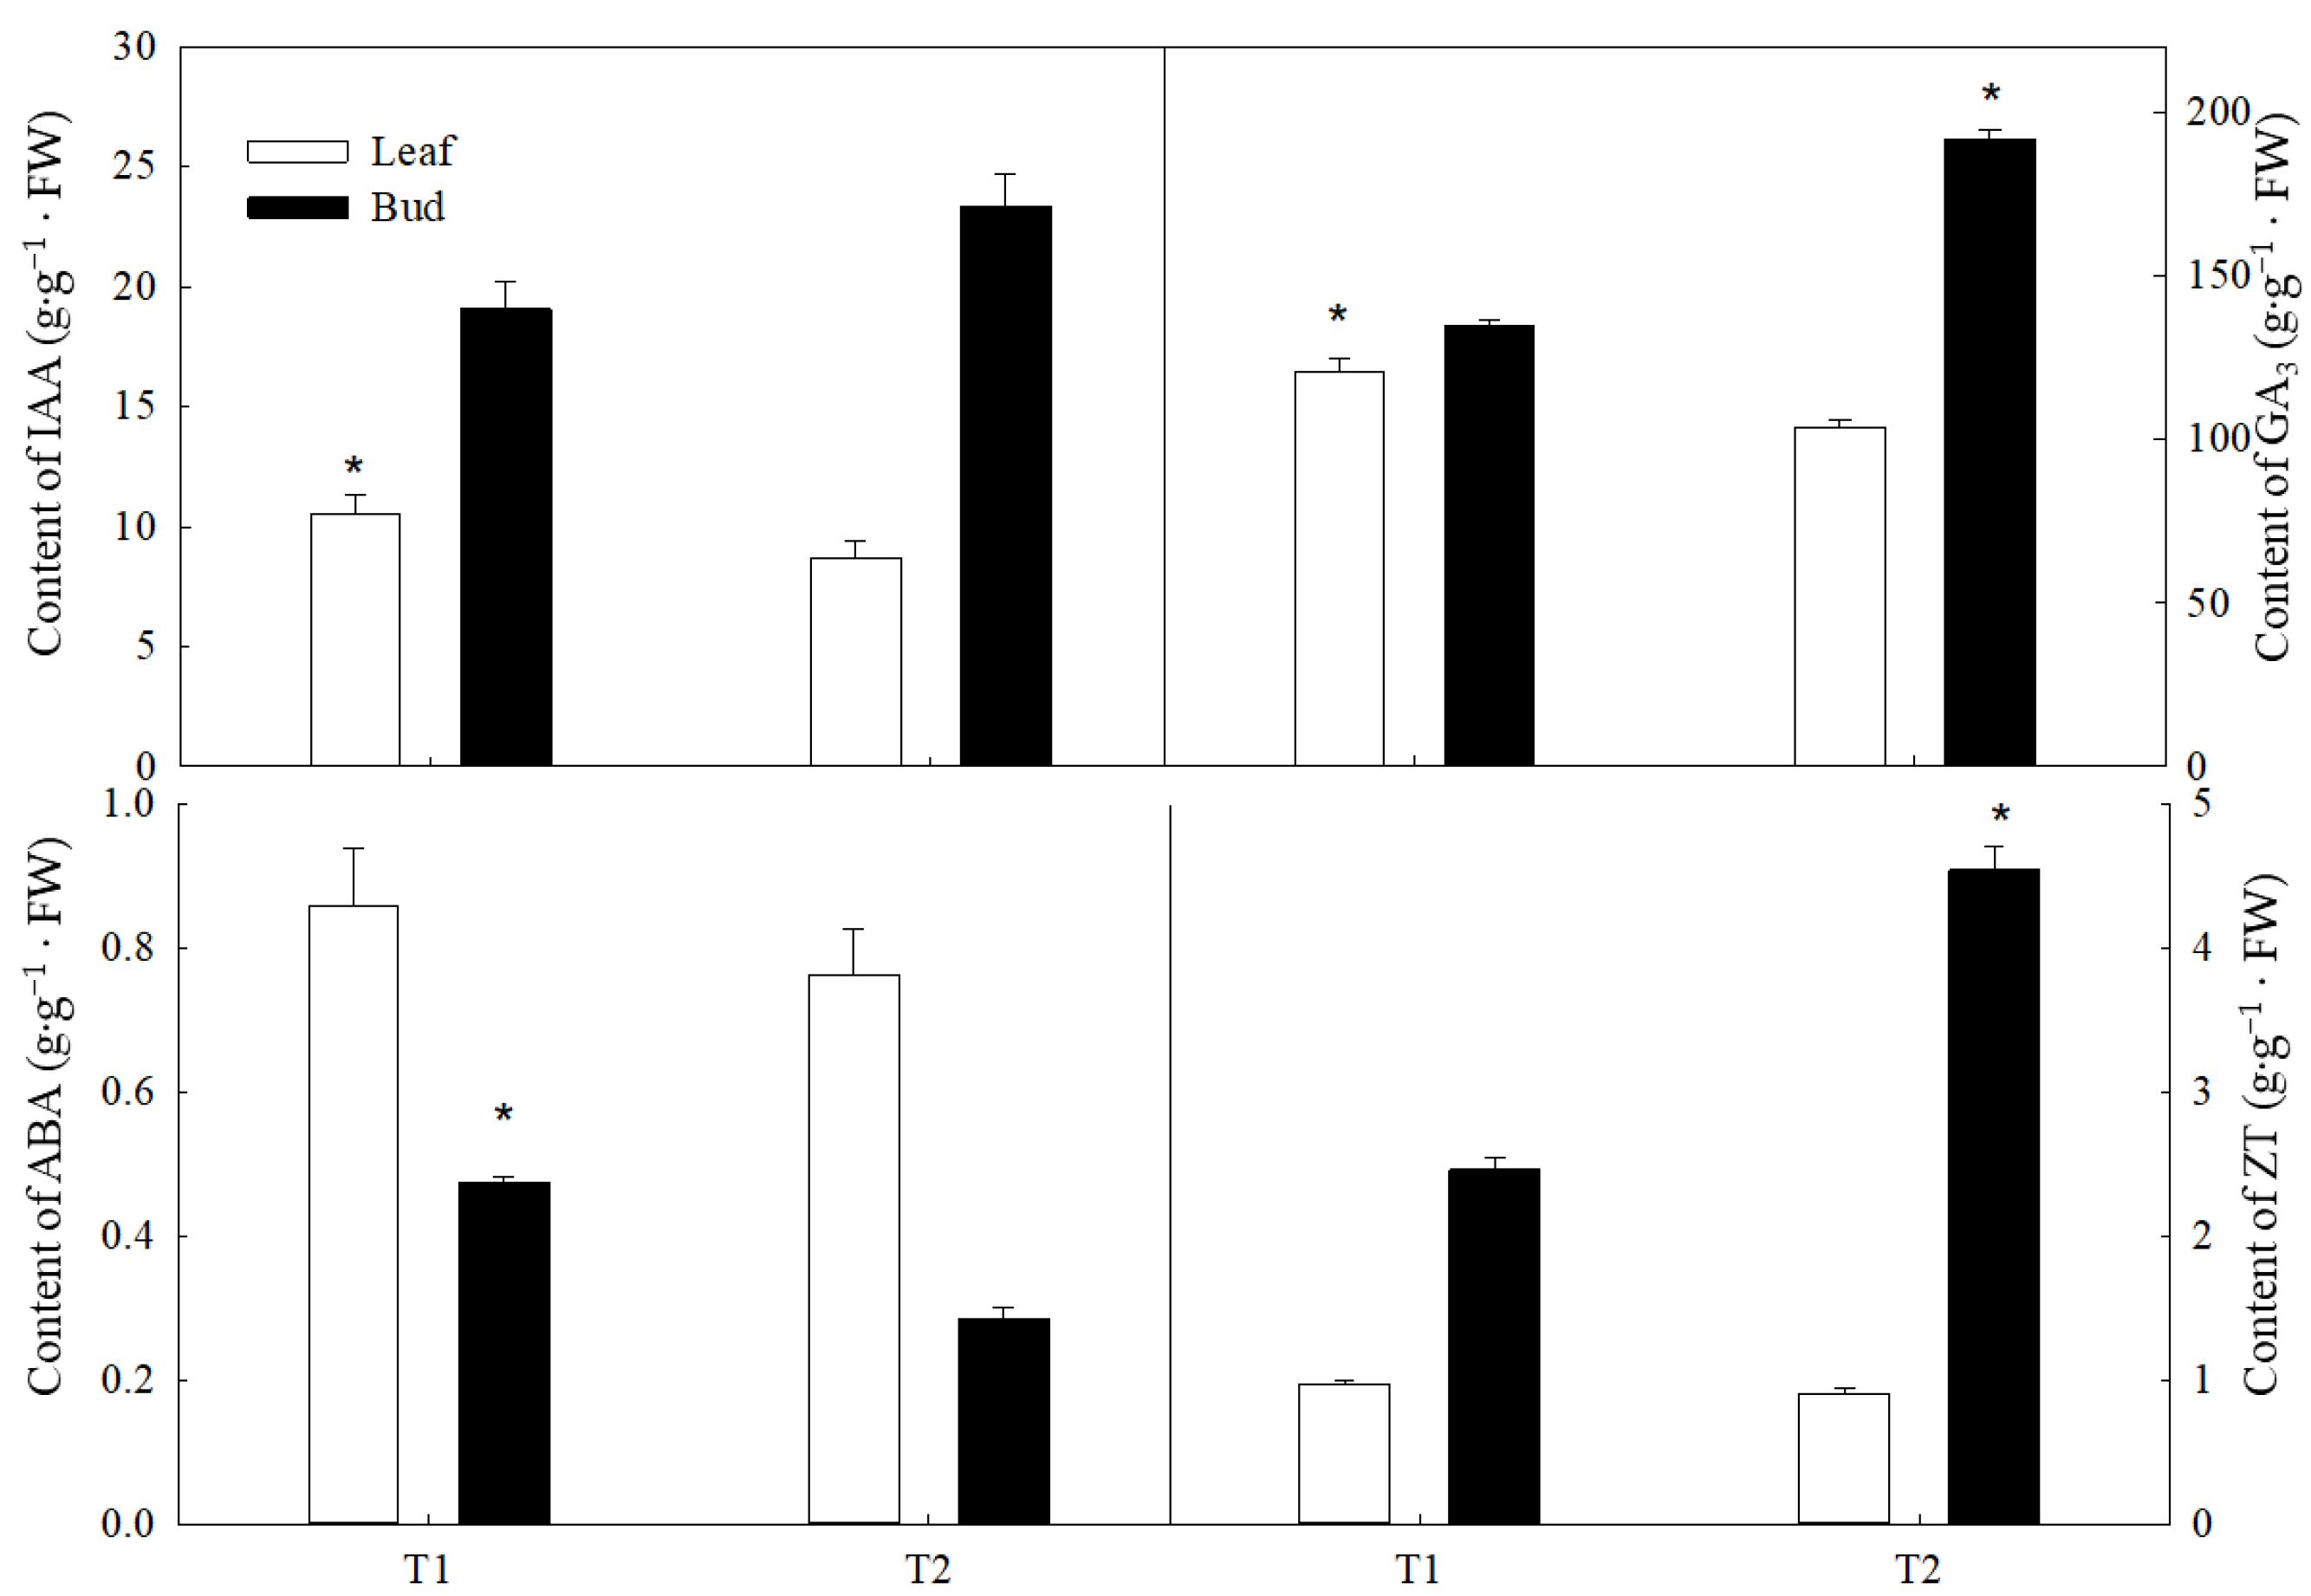
The content of GA3, ABA and ZT in T1 and T2 buds was significantly different, but there was no significant difference in IAA content. Specifically, the GA3 and ZT content of T1 was significantly lower than the GA3 and ZT content of T2, which was 1.43 and 1.85 times the GA3 and ZT content of T1, respectively, while the ABA content of T1 was 1.66 times higher than the ABA content of T2. The IAA and GA3 contents in the leaves increased significantly with the increase in sink, and the IAA and GA3 content in T1 was 121.42% and 116.21% of the IAA and GA3 content in T2, respectively. However, there were no significant differences in ABA and ZT content in leaves (Figure 3).
There were no obvious relationships between flower bud differentiation rate and IAA and ABA in buds, but the compounds had significantly positive correlations with GA3 (0.777) and ZT (0.817) (p ≤ 0.05) (Table 1). In addition, the endogenous hormones in the leaves did not present significant correlations with the flower bud differentiation rate.

3.3. Soluble Sugar and Starch Content of New Shoots in Different Sink–Source Relationships at Different Stages

The soluble sugar level in the leaves of T1 was significantly higher than the soluble sugar level of T2 at the preflower bud differentiation stage and flower bud differentiation period, and the maximum difference was 3.45 mg·g−1, which appeared in the flower bud differentiation period, while flower buds showed the opposite. There was no significant difference in the soluble starch content between the two types of new shoots at late flowering bud differentiation. The same occurred for the starch content (Table 2).
The correlation analysis showed that the flower bud differentiation rate was only significantly positively correlated with soluble sugar (0.854) and starch (0.837) in flower buds (Table 3).

3.4. Chlorophyll Content and Net Photosynthetic Rate of New Shoots in Different Sink–Source Relationships at Different Stages

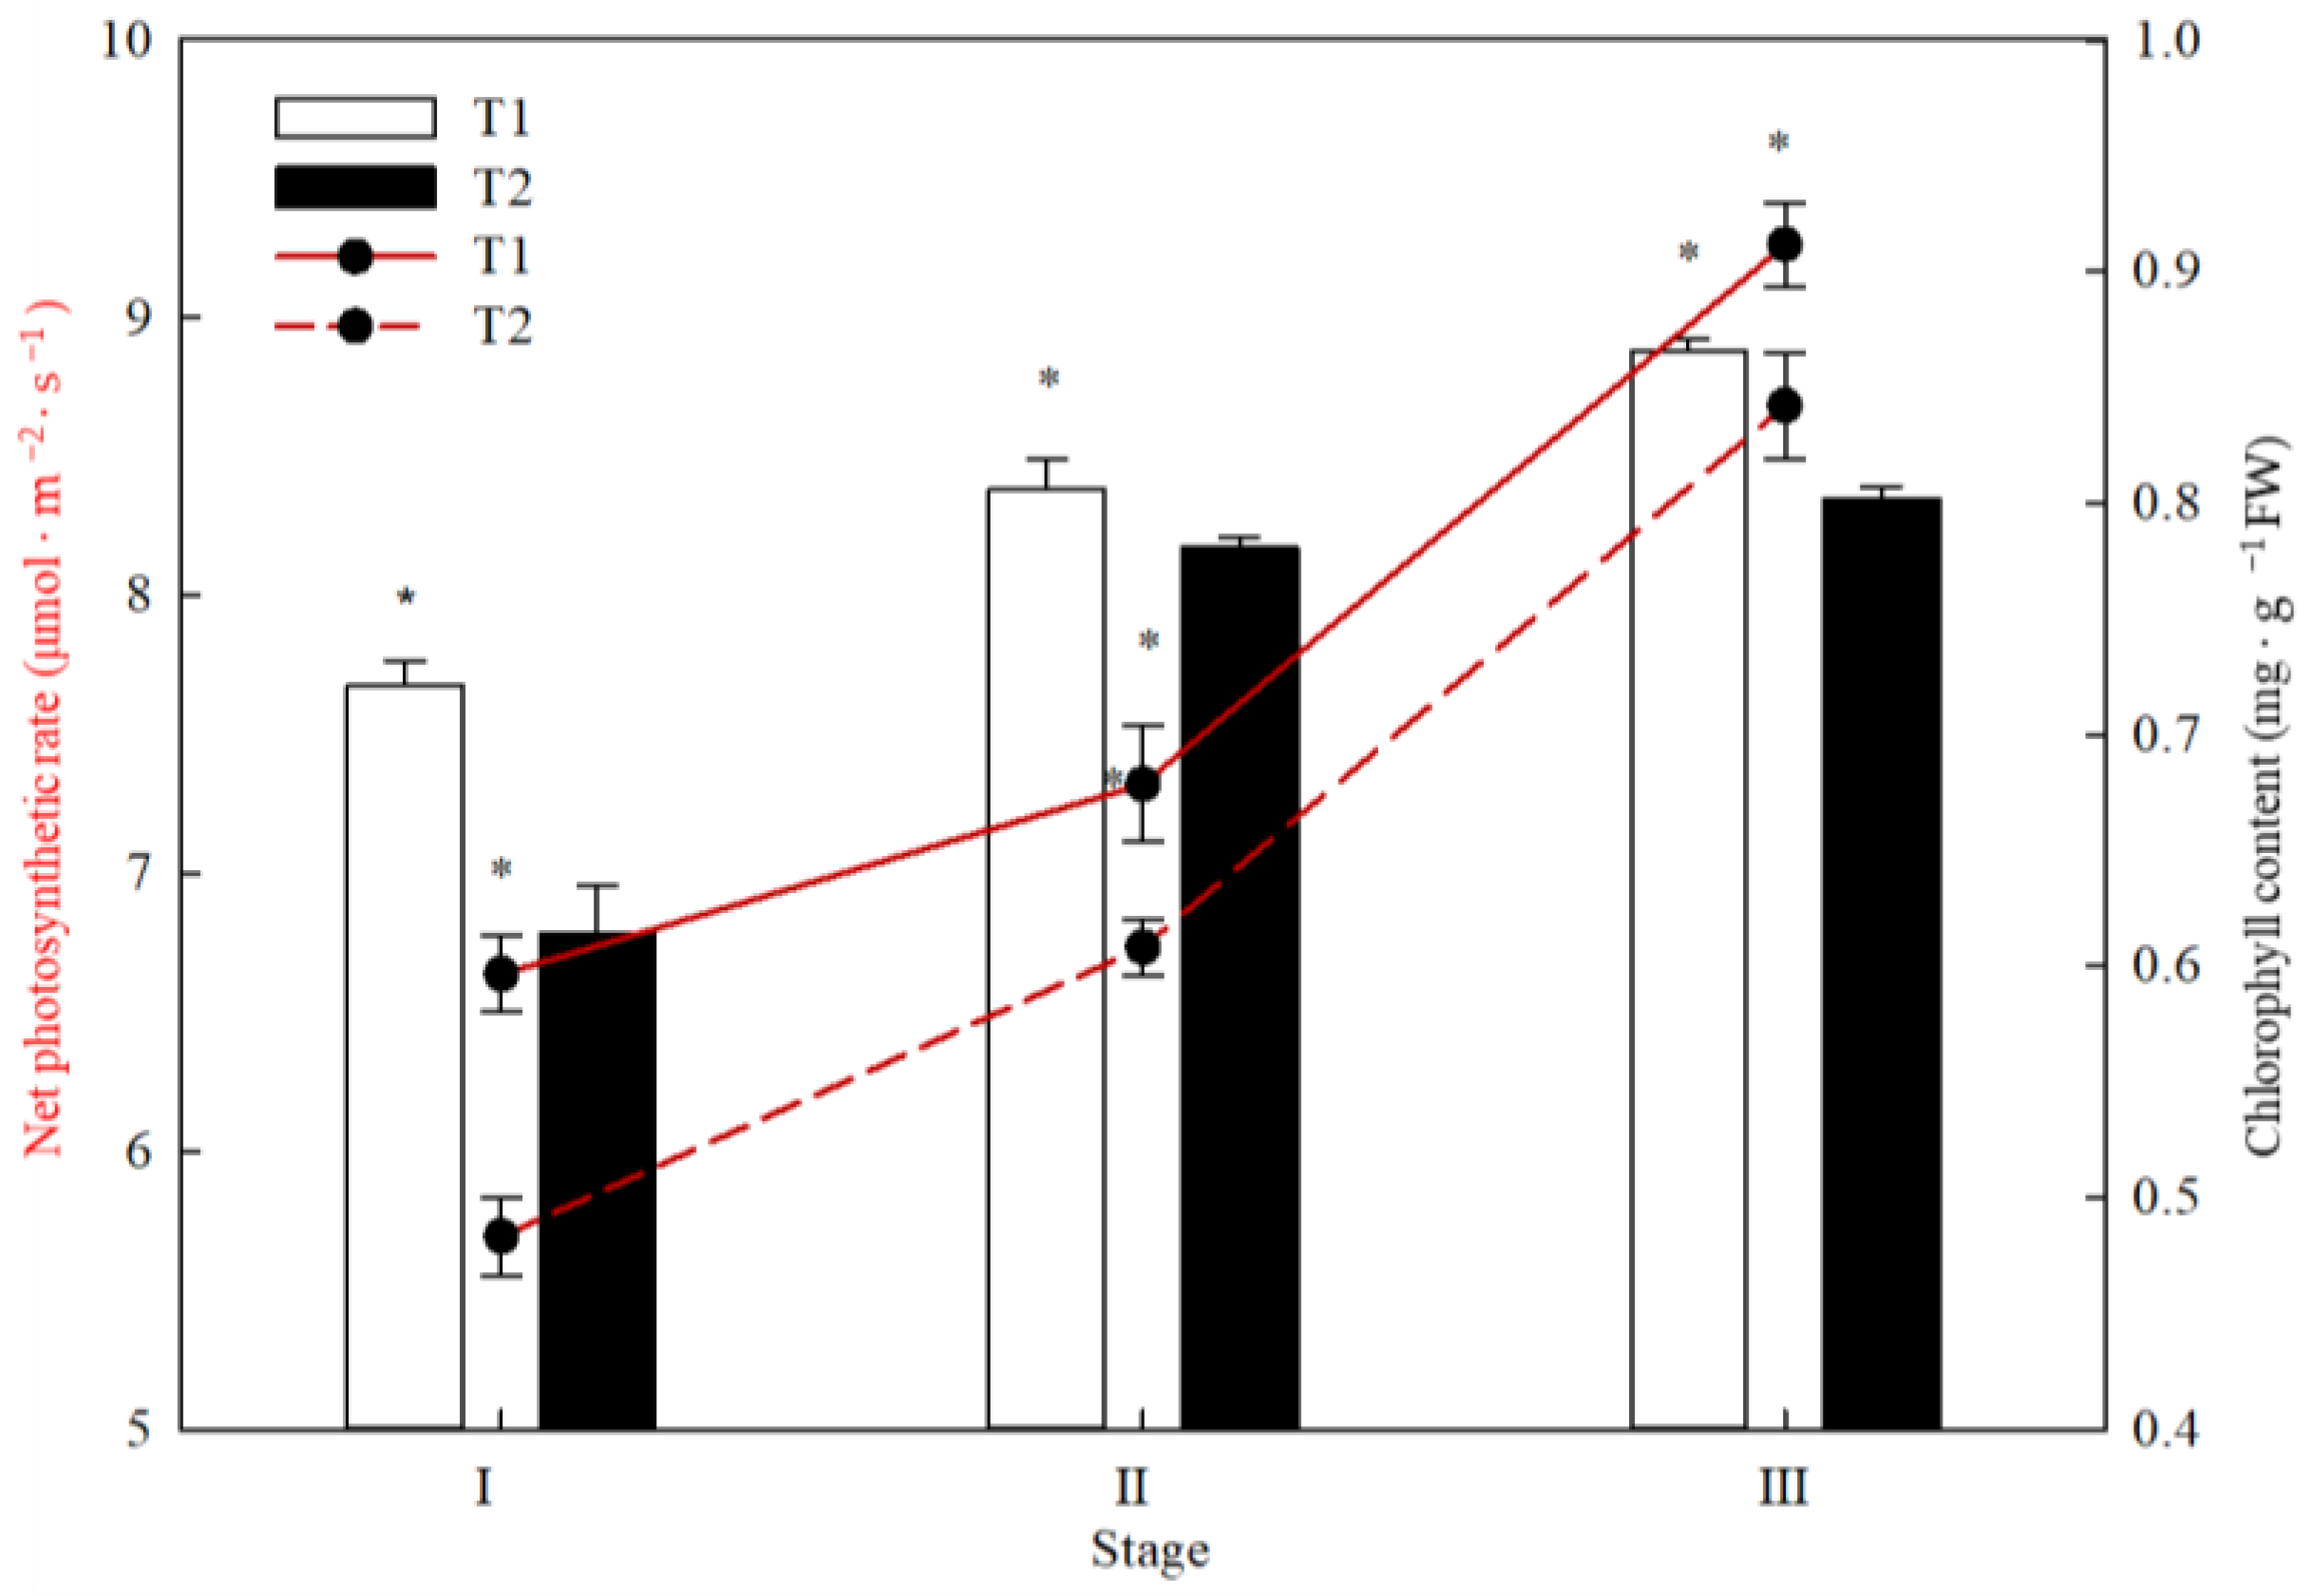
There were significant differences in net photosynthetic rates and chlorophyll content among leaves in different sink–source relationships at different stages (p ≤ 0.05) (Figure 4). Specifically, the chlorophyll content and net photosynthetic rate of T1 were significantly higher than the chlorophyll content and net photosynthetic rate of T2, and the greatest difference appeared at the preflower bud differentiation stage. Furthermore, the chlorophyll content and net photosynthetic rate values of T1 at the preflower bud differentiation stage were 1.17- and 1.16-fold the recorded chlorophyll content and net photosynthetic rate values for T2. In addition, the chlorophyll content and net photosynthetic rate of the two types of new shoots increased over time as follows: late flowering bud differentiation > flower bud differentiation period > preflower bud differentiation stage.

3.5. 13C Assimilate Accumulation and Allocation of New Shoots in Different Sink–Source Relationships at Different Stages

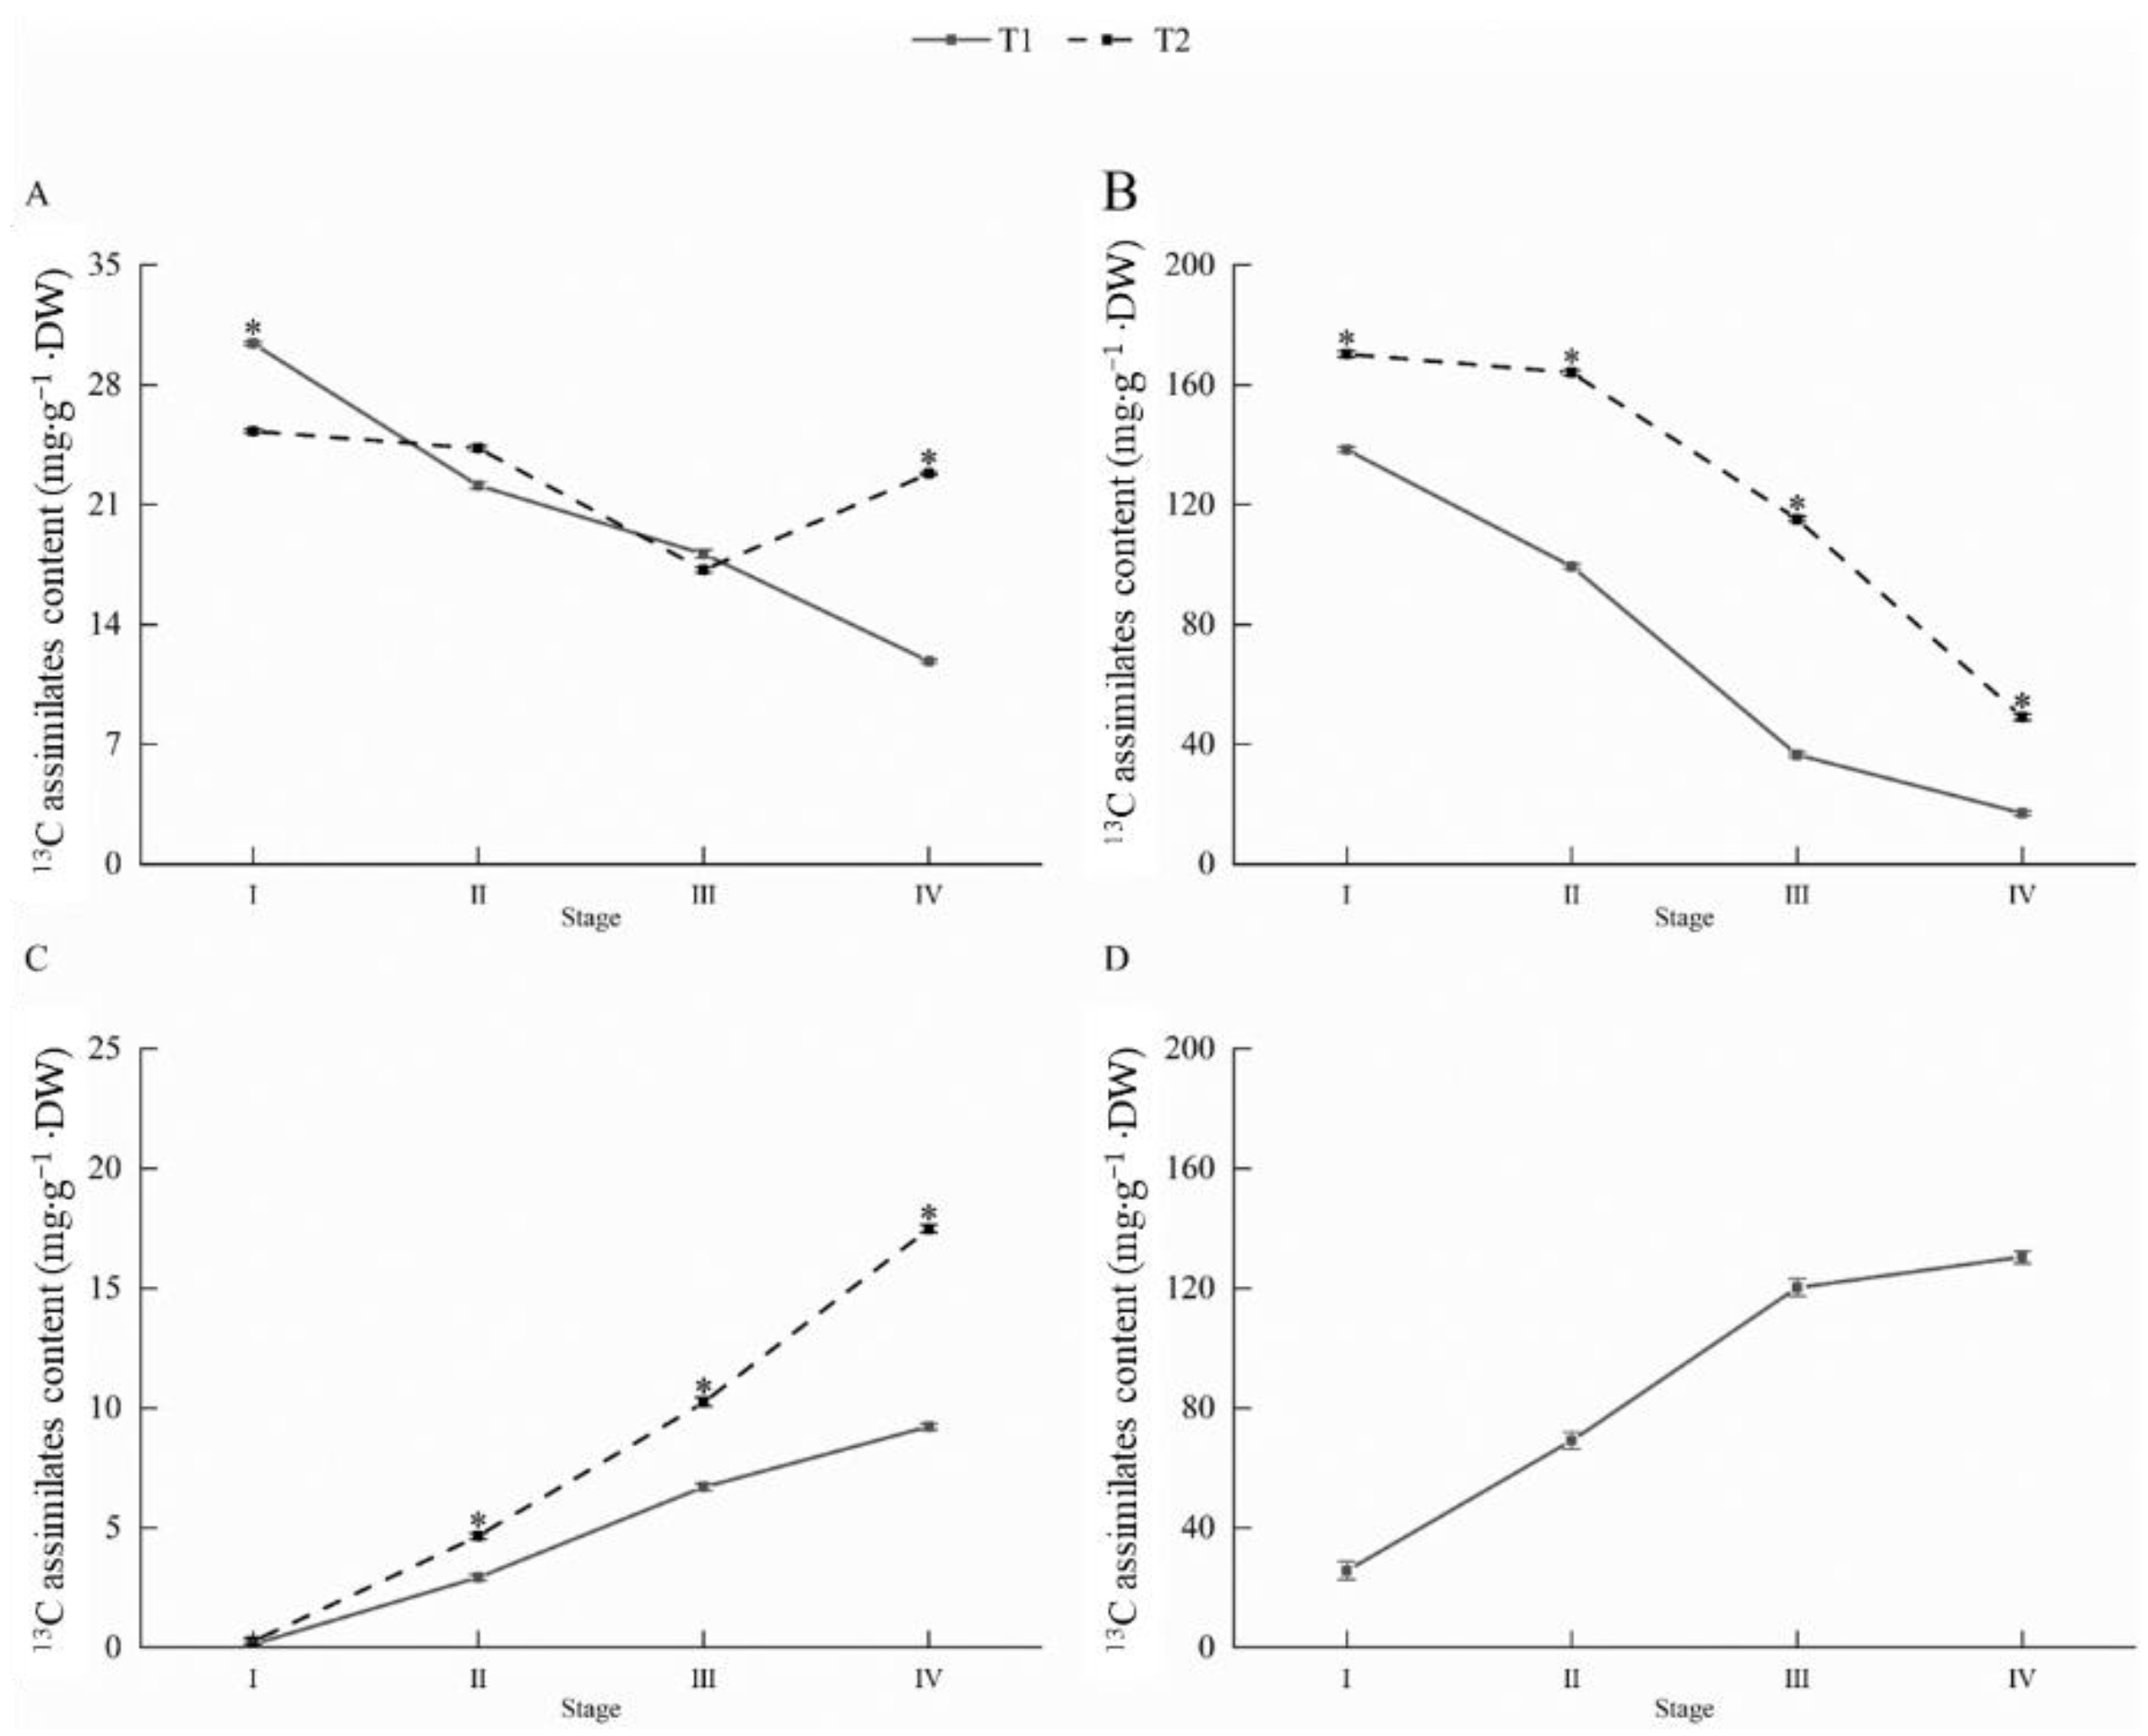
Assimilate accumulation and allocation were significantly different in different sink–source relationships (Figure 5). The 13C assimilate content in T1 shoots showed a downwards trend all the time, while that in T2 showed an upwards trend at first and then a downwards trend (Figure 5A). Moreover, 13C assimilates in T1 shoots were significantly higher than the 13C assimilates in T2 shoots labeled after 4 h, while 13C assimilates in T2 shoots were significantly higher in late flowering bud differentiation.
The 13C assimilates accumulated in both T1 and T2 leaves at different stages showed a sharp decrease (Figure 5B). Moreover, the 13C assimilates of leaves in T2 were always significantly higher than the 13C assimilates in T1 leaves, and the differences between T1 and T2 were in the following order: flower bud differentiation period (78.67 mg·g−1) > preflower bud differentiation stage (64.68 mg·g−1) > late flowering bud differentiation (32.12 mg·g−1).
The 13C assimilates accumulated in T1 and T2 flower buds at different stages and showed a gradually increasing trend (Figure 5C). The 13C assimilate content in T2 flower buds was significantly higher than the 13C assimilate content in T1 flower buds at the same stage, and the greatest difference appeared at the late flowering bud differentiation of 3.55 mg·g−1. In addition, the 13C assimilates allocated in T1 fruit also increased gradually, with values of 25.74 mg·g−1 (preflower bud differentiation stage) > 69.12 mg·g−1 (flower bud differentiation period) > 120.21 mg·g−1 (late flowering bud differentiation) (Figure 5D).
In general, the distribution of 13C assimilates in leaves, buds, shoots and fruit was different in different types of new shoots in different sink–source relationships. The allocation of 13C is quick in leaves, shoots and fruits, 4 h after 13C labeling, but not in buds. Leaves show the highest values (Figure 5B), and the 13C amount in leaves or buds is always higher at T2 than at T1. In fruit, there appears to be a linear 13C accumulation from stage I to IV. In addition, it had a greater distribution of the 13C assimilates in the fruit, which was advantageous for fruit development. The difference in shoots (stage IV) can also probably be a result of 12C dilution, high metabolism and allocation via the vascular system at sampling.

4. Discussion

4.1. Effect of Sink–Source Relationship on Endogenous Hormones and Its Relationship with Flower Bud Differentiation

Plant flower bud differentiation is closely related to endogenous hormones and is regulated in various ways, for example, by influencing nucleic acid, protein or enzyme activity. In our study, GA3 and IAA levels in buds of T1 shoots were significantly lower than in T2. However, ABA in buds and IAA and GA3 levels in leaves showed opposite trends, indicating that with the increase in sink. GA3 and ZT levels in buds decreased, while ABA in buds and IAA and GA3 in leaves increased, and the flower bud differentiation rate of T1 was lower than the flower bud differentiation rate of T2. Furthermore, the correlation results further confirmed that high levels of GA3 and ZT in buds promoted flower bud differentiation of Camellia oleifera. GA3-promoted flower bud differentiation may be related to the activation of FT genes for flowering [30,31]. In addition, ZT is one of the cytokinins that coordinate flower bud differentiation with genes such as 7FL1 and AP1 and usually acts to promote bud differentiation [32,33,34]. In our study, ZT in buds was significantly lower than the ZT in buds of T2, which was opposite to the trend with ABA, and ZT and ABA in leaves of T1 and T2 had no significant difference, indicating that high ZT and low ABA levels in buds were conducive to flower bud differentiation, while ZT and ABA in leaves had little effect.

4.2. Effect of the Sink–Source Relationship on Photosynthetic Characteristics and Its Relationship with Flower Bud Differentiation

Leaves act as a source of energy and material for the growth and development of the sink [7,35], and the demand for photosynthates in the sink also has a great influence on the photosynthesis of the source leaves. Soluble sugar and starch are among the products of photosynthesis and are also the main energy sources for plant growth and development and physiological metabolic activities [36]. With the decrease in the sink, the photosynthetic rate of the source leaves decreased, and the starch content increased [9]. We found that the chlorophyll content and net photosynthetic rate in the leaves of T1 shoots were higher than the chlorophyll content and net photosynthetic rate of T2 shoots. This hypothesis can be supported by the lower 13C content in T1 leaves, which was always markedly lower (Figure 5B) than the 13C content in T2 leaves. The reason is the stronger dilution by unlabeled 12C, through higher net photosynthesis and chlorophyll content, shown in Figure 4. However, we assume that the endogenous hormones in leaves may be affected by different sink–source relationships. Studies have shown that high levels of GA3 and IAA in leaves can effectively promote the net photosynthetic rate of leaves [37], which is consistent with the results of this experiment. In addition, under the influence of the strong sink (fruit), assimilates produced by the higher net photosynthetic rate of the leaves were rapidly distributed to the fruits, while fewer were allocated to the buds. We found that T1 shoot 13C assimilates were distributed in both fruits and flower buds, and more assimilates were distributed to the fruit, which was conducive to the growth and development of fruits, which was beneficial to increasing the yield of the current year. However, 13C accumulation in the buds of T2 shoots was higher, which was conducive to flower bud differentiation in the current year and the improvement of fruit yield in the following year. Therefore, to ensure the continuous fruit-setting rate of Camellia oleifera, in the cultivation process of fruit-bearing branches, T1 shoots should be reserved to ensure the yield of the current year, and T2 shoots should be reserved as the bearing branches of the next year to ensure the yield of the next year. In addition, combined with the flower differentiation rate and correlation analysis, a high level of soluble sugar and starch in flower buds could be seen to be conducive to flower bud differentiation. The content of soluble sugar and starch in the leaves of T1 was significantly higher than the content of soluble sugar and starch in the leaves of T2, while the content of soluble sugar and starch in the leaves of T1 was significantly lower than the content of soluble sugar and starch in the leaves of T1, which may also be related to hormones. Endogenous GA3 is believed to stimulate the formation of new RNA and protein molecules and induce the formation of α-amylase [38,39], so high levels of endogenous GA3 would accelerate the hydrolysis of starch and promote the increase in soluble sugar content [40].
In orchards, it is a very effective method to regulate flower bud differentiation by the sink–source relationship. The use of growth regulators or chemicals is common, but it should not be avoided that it can also regulate flower bud differentiation rate [41]. This method is easy to operate and is widely used in production, such as peach trees [42], pear trees [43], etc. Therefore, according to different situations, different ways can be used to regulate flower bud differentiation to achieve a stable yield of orchards.

5. Conclusions

In conclusion, when it was on-year with the increase in the sink (more T1 shoots, fewer T2 shoots), the IAA increased in leaves, while GA3 and ZT decreased in buds, contributing to a higher photosynthetic rate. The fruit acted as a stronger sink, resulting in a greater allocation of assimilates (soluble sugars and starch) to the fruit, thus leading to a lower rate of bud differentiation in T1 shoots that could not ensure a successive fruit set, so the following year would be an off-year. However, when it was off-year with the decrease in the sink (fewer T1 shoots, more T2 shoots), GA3 and ZT increased in the buds, and more assimilates were allocated to the buds, which was conducive to flower bud differentiation, so the next year would be an on-year. Specifically, to ensure the yield in the current year, T1 shoots need to be retained; to ensure the yield in the second year, T2 shoots need to be retained. However, the exact proportion of T1 and T2 shoots to be retained needs to be further studied to mitigate alternate bearing and to achieve stable production in successive years of Camellia oleifera.

Author Contributions

Conceptualization, S.S.; writing—review and editing, Y.S.; formal analysis, Y.W.; data curation, H.Y. and T.J.; funding acquisition, S.S.; methodology, X.W.; writing—original draft, Z.H. All authors have read and agreed to the published version of the manuscript.

Funding

This work was supported by the Fundamental Research Funds for the Central Universities (BFUKF202108) and Jiangxi Forestry of science and technology innovation project ‘Study on Drought-resistant Cultivation Techniques of Camellia oleifera in Jiangxi’ (Innovation project 2022, No. 37).

Data Availability Statement

No new data were created or analyzed in this study. Data sharing is not applicable to this article. The data presented in this study are available on request from the corresponding author.

Acknowledgments

We would like to thank the students who participated in the field observation. We sincerely thank the editor and three anonymous reviewers for their constructive comments and suggestions.

Conflicts of Interest

The authors declare that they have no conflict of interest.

References

  1. Heidari, H. Source-sink relationship in wheat as affected by defoliation and spikelet removal. Acta Fytotech. Zootech. 2022, 25, 40–45. [Google Scholar] [CrossRef]
  2. Moing, A.; Gutierrez, A.E.; Gaudillere, J.P. Modeling carbon export out of mature peach leaves. Plant Physiol. 1994, 106, 591–600. [Google Scholar] [CrossRef] [PubMed]
  3. Syvertsen, J.P.; Goñi, C.; Otero, A. Fruit load and canopy shading affect leaf characteristics and net gas exchange of ‘Spring’ navel orange trees. Tree Physiol. 2003, 23, 899–906. [Google Scholar] [CrossRef] [PubMed]
  4. Lacointe, A.; Isebrands, J.G.; Host, G.E. A new way to account for the effect of source-sink spatial relationships in whole plant carbon allocation models. Can. J. For. Res. 2002, 32, 1838–1848. [Google Scholar] [CrossRef]
  5. Chang, T.G.; Zhu, X.G. Source–sink interaction: A century old concept under the light of modern molecular systems biology. J. Exp. Bot. 2017, 68, 4417–4431. [Google Scholar] [CrossRef] [PubMed]
  6. Goyal, R.K.; Bishnoi, C. Assimilate partitioning and distribution in fruit crops: A review. J. Pharmacogn. Phytochem. 2017, 6, 479–484. [Google Scholar]
  7. Pawar, R.; Rana, V.S. Manipulation of Source-Sink Relationship in Pertinence to Better Fruit Quality and Yield in Fruit Crops: A Review. Agric. Rev. 2019, 40, 1–8. [Google Scholar] [CrossRef]
  8. Nii, N. Changes of starch and sorbitol in leaves before and after removal of fruits from peach trees. Ann. Bot. 1997, 79, 139–144. [Google Scholar] [CrossRef]
  9. Domingo, J.I.; Ignacio, L.; Francisco, R.T.; Manuel, T. Regulation of photosynthesis through source: Sink imbalance in citrus is mediated by carbohydrate content in leaves. Physiol. Plant. 2002, 116, 563–572. [Google Scholar]
  10. Lv, X.; Zhang, Y.; Zhang, Y.; Fan, S.; Kong, L. Source-sink modifications affect leaf senescence and grain mass in wheat as revealed by proteomic analysis. BMC Plant Biol. 2020, 20, 1–17. [Google Scholar] [CrossRef]
  11. Kiseleva, I.S.; Kaminskaya, O.A. Hormonal regulation of assimilate utilization in barley leaves in relation to the development of their source function. Russ. J. Plant Physiol. 2002, 49, 534–540. [Google Scholar] [CrossRef]
  12. Guo, Y.F.; Ren, G.D.; Zhang, K.W.; Li, Z.H.; Miao, Y.; Guo, H.W. Leaf senescence: Progression regulation and application. Mol. Hortic. 2021, 1, 1–25. [Google Scholar] [CrossRef]
  13. Yang, S.Y. Study on Pruning Techniques of Camellia Oleifera Based on the Analysis of Canopy Microclimate. Dissertation’s Thesis, Beijing Forestry University, Beijing, China, 2015. [Google Scholar]
  14. Yuan, J.; Shi, B.; Wu, Z.L.; Tan, X.F. Response of fruit quality and leaf photosynthesis to different sink-source relationships in Camellia oleifera. Plant Physiol. J. 2015, 51, 1287–1292. [Google Scholar]
  15. Wen, Y.; Su, S.C.; Jia, T.T.; Wang, X.N. Allocation of photoassimilates in bud and fruit from different leaf nodes of Camellia oleifera. HortScience 2021, 56, 469–477. [Google Scholar] [CrossRef]
  16. Peng, Y.; Chen, Y.; Xu, Y.; Wang, R.; Chen, L.; Ma, L.; Peng, S. Effects of sink-source manipulation on carbohydrate content and enzyme activity of Camellia oleifera leaves. J. Southwest For. Univ. 2018, 38, 41–45. [Google Scholar]
  17. Seung, D.; Risopatron, J.P.M.; Jones, B.J.; Marc, J. Circadian clock-dependent gating in ABA signalling networks. Protoplasma 2012, 249, 445–457. [Google Scholar] [CrossRef]
  18. Tsai, A.Y.L.; Gazzarrini, S. Trehalose-6-phosphate and SnRK1 kinases in plant development and signaling: The emerging picture. Front. Plant Sci. 2014, 5, 119. [Google Scholar] [CrossRef]
  19. Villar, L.; Lienqueo, I.; Llanes, A.; Rojas, P.; Perez, J.; Correa, F.; Almada, R. Comparative transcriptomic analysis reveals novel roles of transcription factors and hormones during the flowering induction and floral bud differentiation in sweet cherry trees (Prunus avium L. cv. Bing). PLoS ONE 2020, 15, e0230110. [Google Scholar] [CrossRef]
  20. Wei, J.; Yang, Q.; Ni, J.; Gao, Y.; Tang, Y.; Bai, S.; Teng, Y. Early defoliation induces auxin redistribution, promoting paradormancy release in pear buds. Plant Physiol. 2022, 190, 2739–2756. [Google Scholar] [CrossRef]
  21. You, Y.G.; Li, Z.A.; Hong, Y.Y.; Miao, M.Y. Endogenous Hormones and Biochemical Changes during Flower Development and Florescence in the Buds and Leaves of Lycium ruthenicum Murr. Forests 2022, 13, 763. [Google Scholar]
  22. Lee, J.; Lee, I. Regulation and function of SOC1, a flowering pathway integrator. J. Exp. Bot. 2010, 61, 2247–2254. [Google Scholar] [CrossRef] [PubMed]
  23. Adibi, M.; Yoshida, S.; Weijers, D.; Fleck, C. Correction: Centering the organizing center in the arabidopsis thaliana shoot apical meristem by a combination of cytokinin signaling and self-organization. PLoS ONE 2017, 12, e0174751. [Google Scholar] [CrossRef] [PubMed]
  24. Upreti, K.K.; Reddy, Y.T.N.; Prasad, S.S.; Bindu, G.V.; Jayaram, H.L.; Rajan, S. Hormonal changes in response to paclobutrazol induced early flowering in mango cv. Totapuri. Sci. Hortic. 2013, 150, 414–418. [Google Scholar] [CrossRef]
  25. Truernit, E. Plant physiology: The importance of sucrose transporters. Curr. Biol. 2001, 11, R169–R171. [Google Scholar] [CrossRef] [PubMed]
  26. Sawicki, M.; Jacquens, L.; Baillieul, F.; Clément, C.; Vaillant-Gaveau, N.; Jacquard, C. Distinct regulation in inflorescence carbohydrate metabolism according to grapevine cultivars during floral development. Physiol. Plant. 2015, 154, 447–467. [Google Scholar] [CrossRef] [PubMed]
  27. Vaillant-Gaveau, N.; Maillard, P.; Wojnarowiez, G.; Gross, P.; Clément, C.; Fontaine, F. Inflorescence of grapevine (Vitis vinifera L.): A high ability to distribute its own assimilates. J. Exp. Bot. 2011, 62, 4183–4190. [Google Scholar] [CrossRef]
  28. Zhong, Y.; Gao, C.; Dong, Z.; Chen, N.; Wang, M. Determination of five endogenous hormones in wheat by high performance liquid chromatography. Chin. J. Chromatogr. 2013, 31, 800–803. [Google Scholar] [CrossRef]
  29. Li, H. Principles and Techniques of Plant Physiological and Biochemical Experiments; Higher Education Press: Beijing, China, 2000. [Google Scholar]
  30. Eriksson, M.E.; Israelsson, M.; Olsson, O.; Moritz, T. Increased gibberellin biosynthesis in transgenic trees promotes growth, biomass production and xylem fiber length. Nat. Biotechnol. 2000, 18, 784–788. [Google Scholar] [CrossRef]
  31. Yamaguchi, N.; Winter, C.M.; Wu, M.F.; Kanno, Y.; Yamaguchi, A.; Seo, M.; Wagner, D. Gibberellin acts positively then negatively to control onset of flower formation in Arabidopsis. Science 2014, 344, 638–641. [Google Scholar] [CrossRef]
  32. Chi, Z.H.; Wang, Y.Q.; Deng, Q.X.; Zhang, H.; Pan, C.P.; Yang, Z.W. Endogenous phytohormones and the expression of flowering genes synergistically induce flowering in loquat. J. Integr. Agric. 2020, 19, 2247–2256. [Google Scholar] [CrossRef]
  33. Li, Y.; Zhang, D.; Xing, L.; Zhang, S.; Zhao, C.; Han, M. Effect of exogenous 6-benzylaminopurine (6-BA) on branch type, floral induction and initiation, and related gene expression in ‘Fuji’apple (Malus domestica Borkh). Plant Growth Regul. 2016, 79, 65–70. [Google Scholar] [CrossRef]
  34. Yan, B.; Hou, J.; Cui, J.; He, C.; Li, W.; Chen, X.; Li, M.; Wang, W. The effects of endogenous hormones on the flowering and fruiting of Glycyrrhiza uralensis. Plants 2019, 8, 519. [Google Scholar] [CrossRef]
  35. Baïram, E.; Lemorvan, C.; Delaire, M.; Buck-Sorlin, G. Fruit and leaf response to different source–sink ratios in apple, at the scale of the fruit-bearing branch. Front. Plant Sci. 2019, 10, 1039. [Google Scholar] [CrossRef]
  36. Yang, J.; Jeong, B.R. Side lighting enhances morphophysiology by inducing more branching and flowering in chrysanthemum grown in controlled environment. Int. J. Mol. Sci. 2021, 22, 12019. [Google Scholar] [CrossRef] [PubMed]
  37. Wen, Y.; Su, S.C.; Ma, L.Y.; Yang, S.Y.; Wang, Y.W.; Wang, X.N. Effects of gibberellic acid on photosynthesis and endogenous hormones of Camellia oleifera Abel. in 1st and 6th leaves. J. For. Res. 2018, 23, 309–317. [Google Scholar] [CrossRef]
  38. Rossetto, M.R.M.; Purgatto, E.; Nascimento, J.R.O.D.; Lajolo, F.M.; Cordenunsi, B.R. Effects of gibberellic acid on sucrose accumulation and sucrose biosynthesizing enzymes activity during banana ripening. Plant Growth Regul. 2003, 41, 207–214. [Google Scholar] [CrossRef]
  39. Kępczyńska, E.; Zielińska, S. Regulation of Medicago sativa L. somatic embryos regeneration by gibberellin A3 and abscisic acid in relation to starch content and α-amylase activity. Plant Growth Regul. 2006, 49, 209–217. [Google Scholar] [CrossRef]
  40. Liang, D.; Huang, X.; Shen, Y.; Shen, T.; Zhang, H.; Lin, L.; Xia, H. Hydrogen cyanamide induces grape bud endodormancy release through carbohydrate metabolism and plant hormone signaling. BMC Genom. 2019, 20, 1–14. [Google Scholar] [CrossRef]
  41. Qin, L.; Zhang, X.; Yan, J.; Fan, L.; Rong, C.; Mo, C.; Zhang, M. Effect of exogenous spermidine on floral induction, endogenous polyamine and hormone production, and expression of related genes in ‘Fuji’ apple (Malus domestica Borkh.). Sci. Rep. 2019, 9, 12777. [Google Scholar] [CrossRef]
  42. Lijun, A.; Liang, J.; Chunqin, Y.; Tianhong, L. Effect and Functional Mechanism of Exogenous Gibberellin on Flowering of Peach. Sci. Agric. Sin. 2009, 42, 605–611. [Google Scholar]
  43. Shuliang, Z.; Yarui, W.; Hongguang, P.; Yinan, D.; Jianfeng, X.; Yingli, L.; Haixia, Z.; Jianguang, Z.; Yuxing, Z. Effect of exogenous hormone and leaves removing on pear flower bud differentiation. China Fruits 2020, 3, 61–64. [Google Scholar]
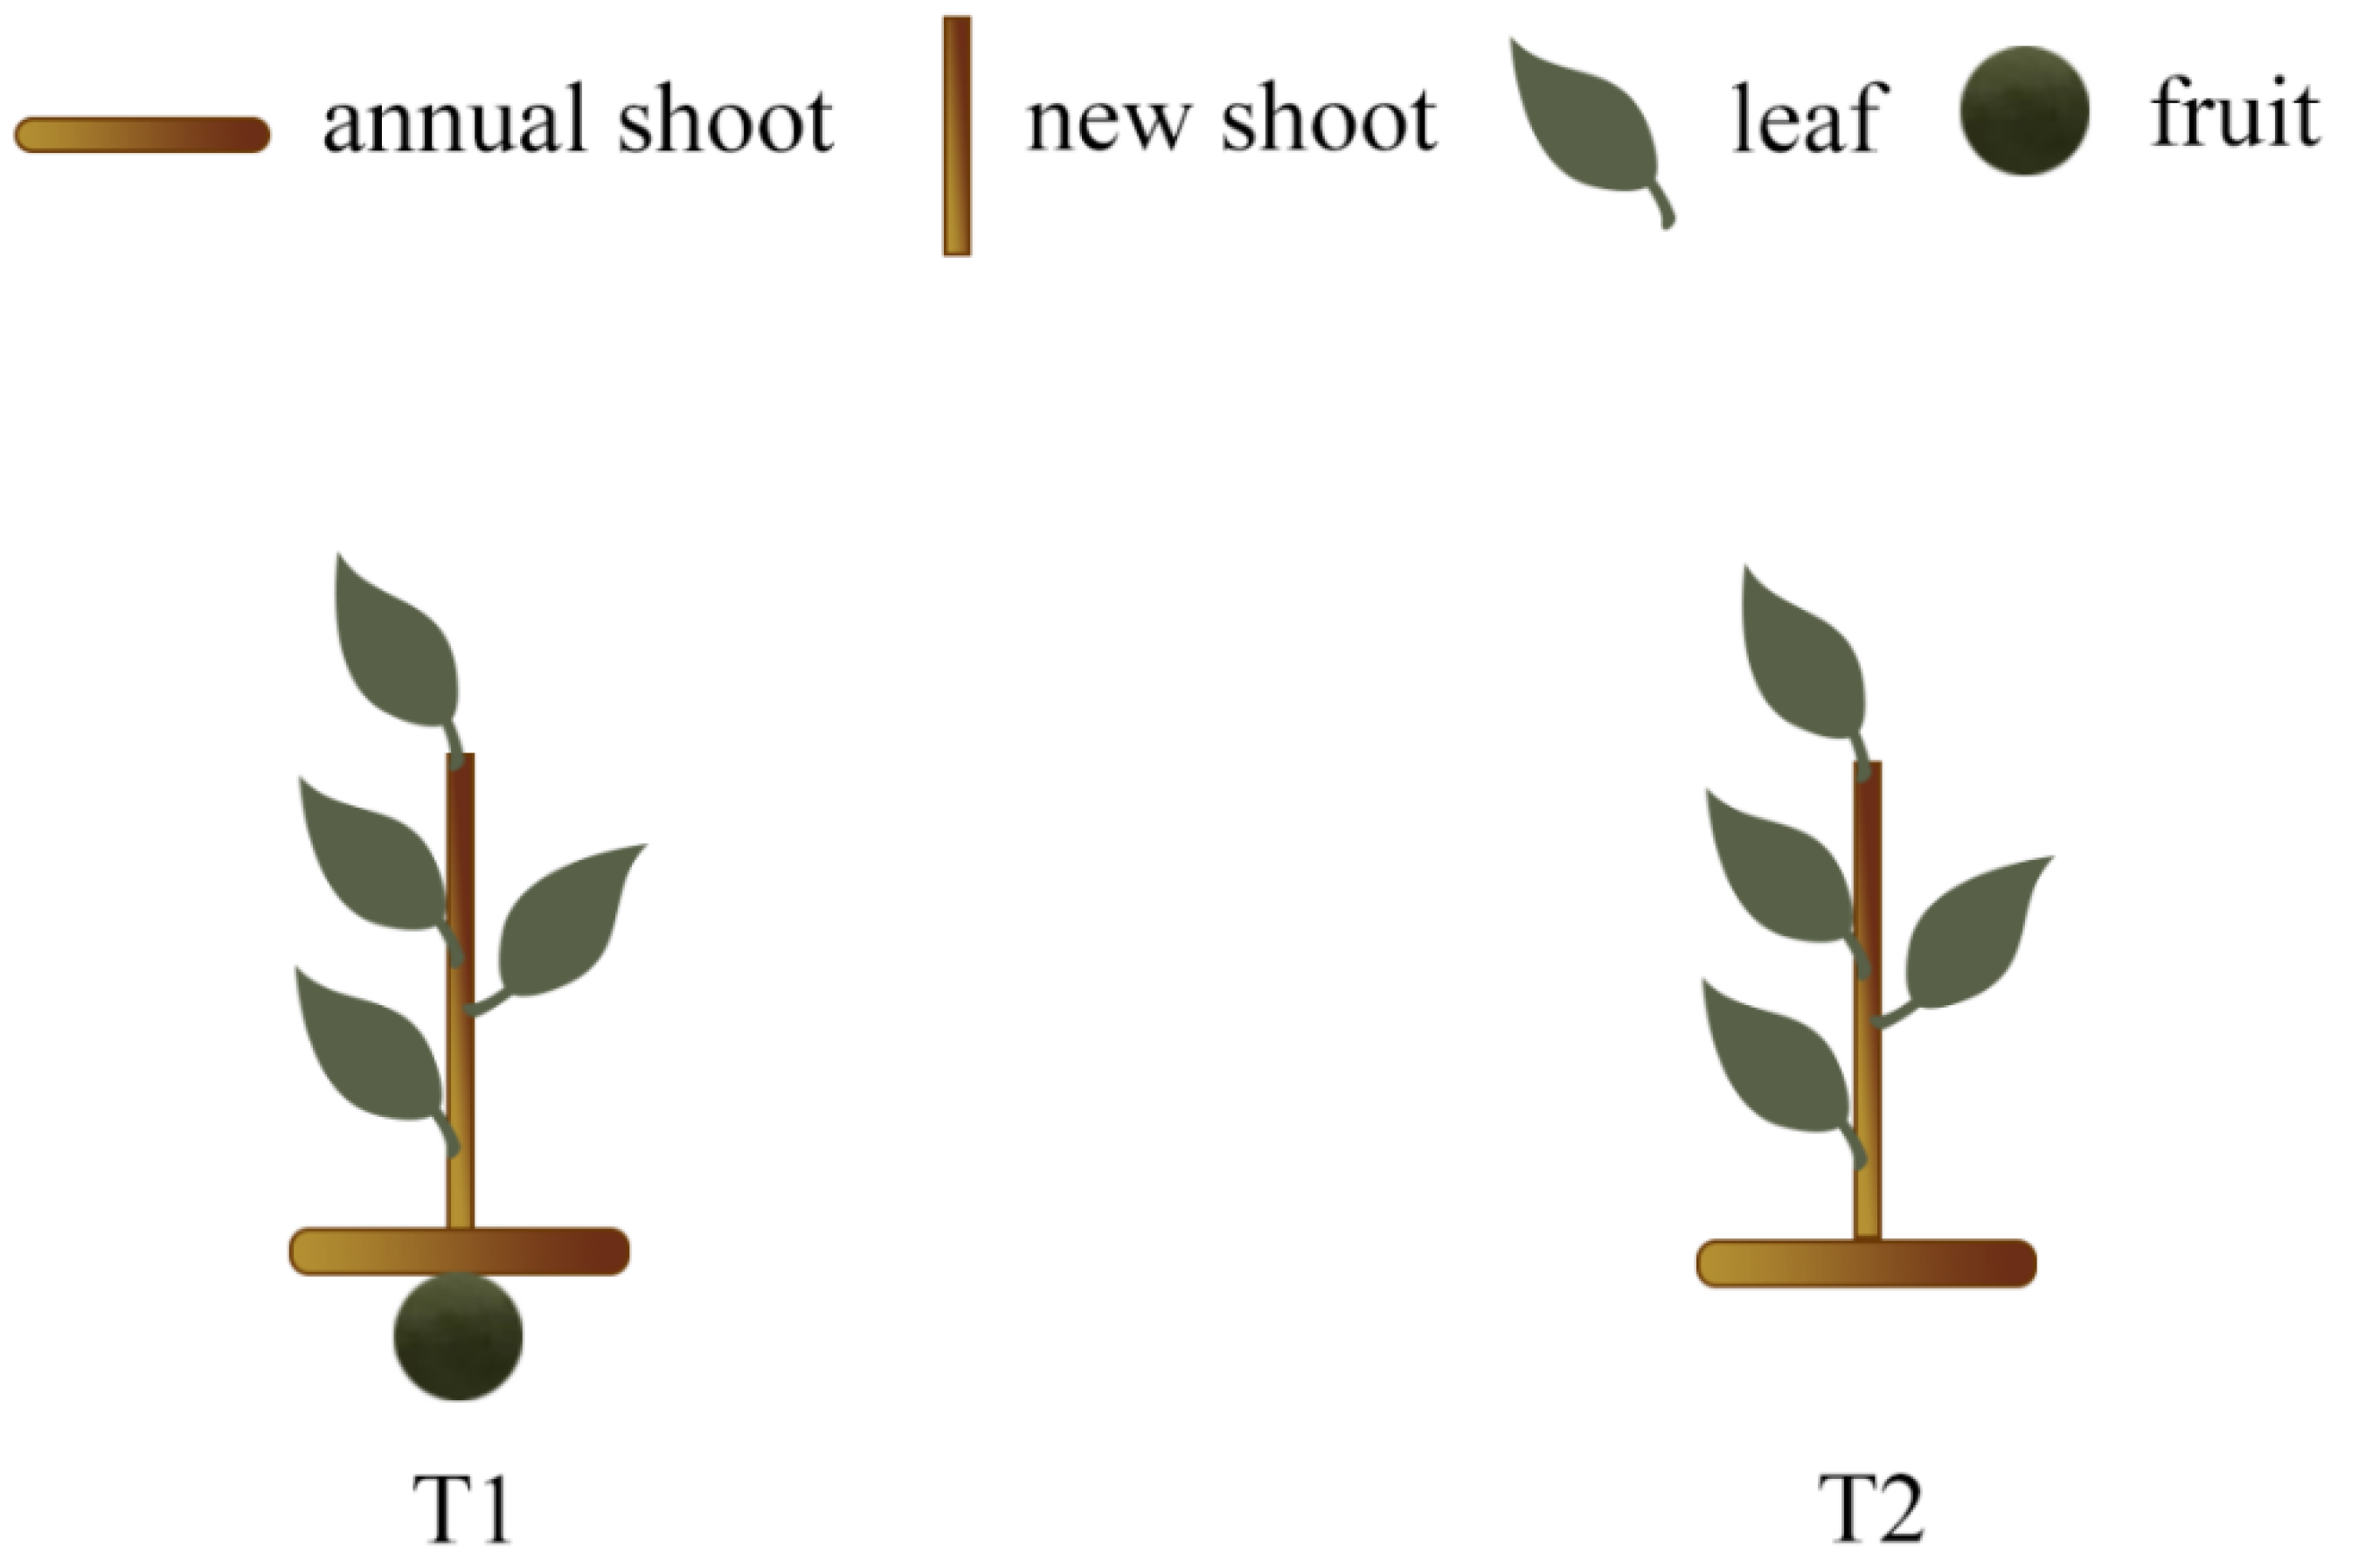
Figure 1. Two types of new Camelia oleifera shoots. T1, the new shoot with one fruit contains four compartments: annual shoot, new shoot, leaves and fruit; T2, the new shoot without fruit contains three compartments: annual shoot, new shoot and leaves.
Forests 14 01965 g001
Figure 2. Flower bud differentiation rate of different types of new shoots in different sink–source relationships after the completion of flower bud morphological differentiation. Bars represent the mean value of three replicates ± standard error (SE). “*” indicates a significant difference (p ≤ 0.05; t-test) between different types of new shoots.
Forests 14 01965 g002
Figure 3. Endogenous hormone content of different types of new shoots in different sink–source relationships at the preflower bud differentiation stage. Bars represent the mean value of three replicates ± SE. “*” indicates a significant difference (p ≤ 0.05; t-test) between different types of new shoots in bud or leaves.
Forests 14 01965 g003
Figure 4. Chlorophyll content and net photosynthetic rate of different types of new shoots in different sink–source relationships at different stages. I, preflower bud differentiation stage; II, flower bud differentiation period; III, late flowering bud differentiation. Bars represent the mean values ± SE. “*” indicates a significant difference (p ≤ 0.05; t-test) between different types of new shoots.
Forests 14 01965 g004
Figure 5. Accumulation and allocation of 13C assimilates (mg·g−1) of different types of new shoots in different sink–source relationships at different stages. (A) Shoot; (B) leaf; (C) bud or flower bud; (D) fruit. Stage I, 4 h after labeling; Stage II, preflower bud differentiation stage; Stage III, flower bud differentiation period; Stage IV, late flowering bud differentiation stage. “*” indicates a significant difference (p ≤ 0.05; t-test) between different types of new shoots.
Forests 14 01965 g005
Table 1. Correlation between flower bud differentiation rate in the late flower bud differentiation and endogenous hormones at preflower bud differentiation stage.
LeafBud
IAAGA3ABAZTIAAGA3ABAZT
Flower bud differentiation rate0.60.5670.6660.6410.5670.777 *0.5660.817 *
“*” indicates a significant difference (p ≤ 0.05; t-test) between flower bud differentiation rate and endogenous hormones.
Table 2. Soluble sugar and starch content in different types of new shoots in different sink–source relationships at different stages.
StageType of New ShootStarch Content (mg·g−1 DW)Soluble Sugar Content (mg·g−1 DW)
LeafFlower BudFruitLeafFlower BudFruit
Preflower bud differentiation stageT122.73 ± 0.13 *12.99 ± 0.0417.12 ± 0.1744.35 ± 0.26 *27.08 ± 0.6314.51 ± 0.18
T215.65 ± 0.0915.92 ± 0.09 *41.64 ± 0.2129.88 ± 0.27 *
Flower bud differentiation periodT116.00 ± 0.19 *14.23 ± 0.1629.61 ± 0.0847.56 ± 0.20 *34.47 ± 0.1325.64 ± 0.19
T211.15 ± 0.0719.10 ± 0.08 *44.11 ± 0.1538.56 ± 0.28 *
Late flowering bud differentiationT110.19 ± 0.106.86 ± 0.1334.95 ± 0.0839.85 ± 0.2822.05 ± 0.3335.76 ± 0.25
T210.23 ± 0.366.71 ± 0.1439.58 ± 0.1922.66 ± 0.14
Data are represented by the mean values ± SE. “*” indicates a significant difference (p ≤ 0.05; t-test) between different types of new shoots at the same stage.
Table 3. Correlation between flower bud differentiation rate and soluble sugar and starch.
StageLeafFlower Bud
Soluble SugarStarchSoluble SugarStarch
Preflower bud differentiation stage0.6620.5800.854 *0.837 *
Flower bud differentiation period0.6670.5690.6910.588
Late flowering bud differentiation0.6280.6080.6400.629
“*” indicates a significant difference (p ≤ 0.05; t-test) between flower bud differentiation rate and soluble sugar and starch.
Disclaimer/Publisher’s Note: The statements, opinions and data contained in all publications are solely those of the individual author(s) and contributor(s) and not of MDPI and/or the editor(s). MDPI and/or the editor(s) disclaim responsibility for any injury to people or property resulting from any ideas, methods, instructions or products referred to in the content.