Importance Values of Mycorrhizal Fungal Types and Species Diversity Driving Variations in Fungi- and Bacteria-Derived Residues in Planted Forests in Northeast China

 ,
,  and
and 
Abstract
:1. Introduction
2. Methods
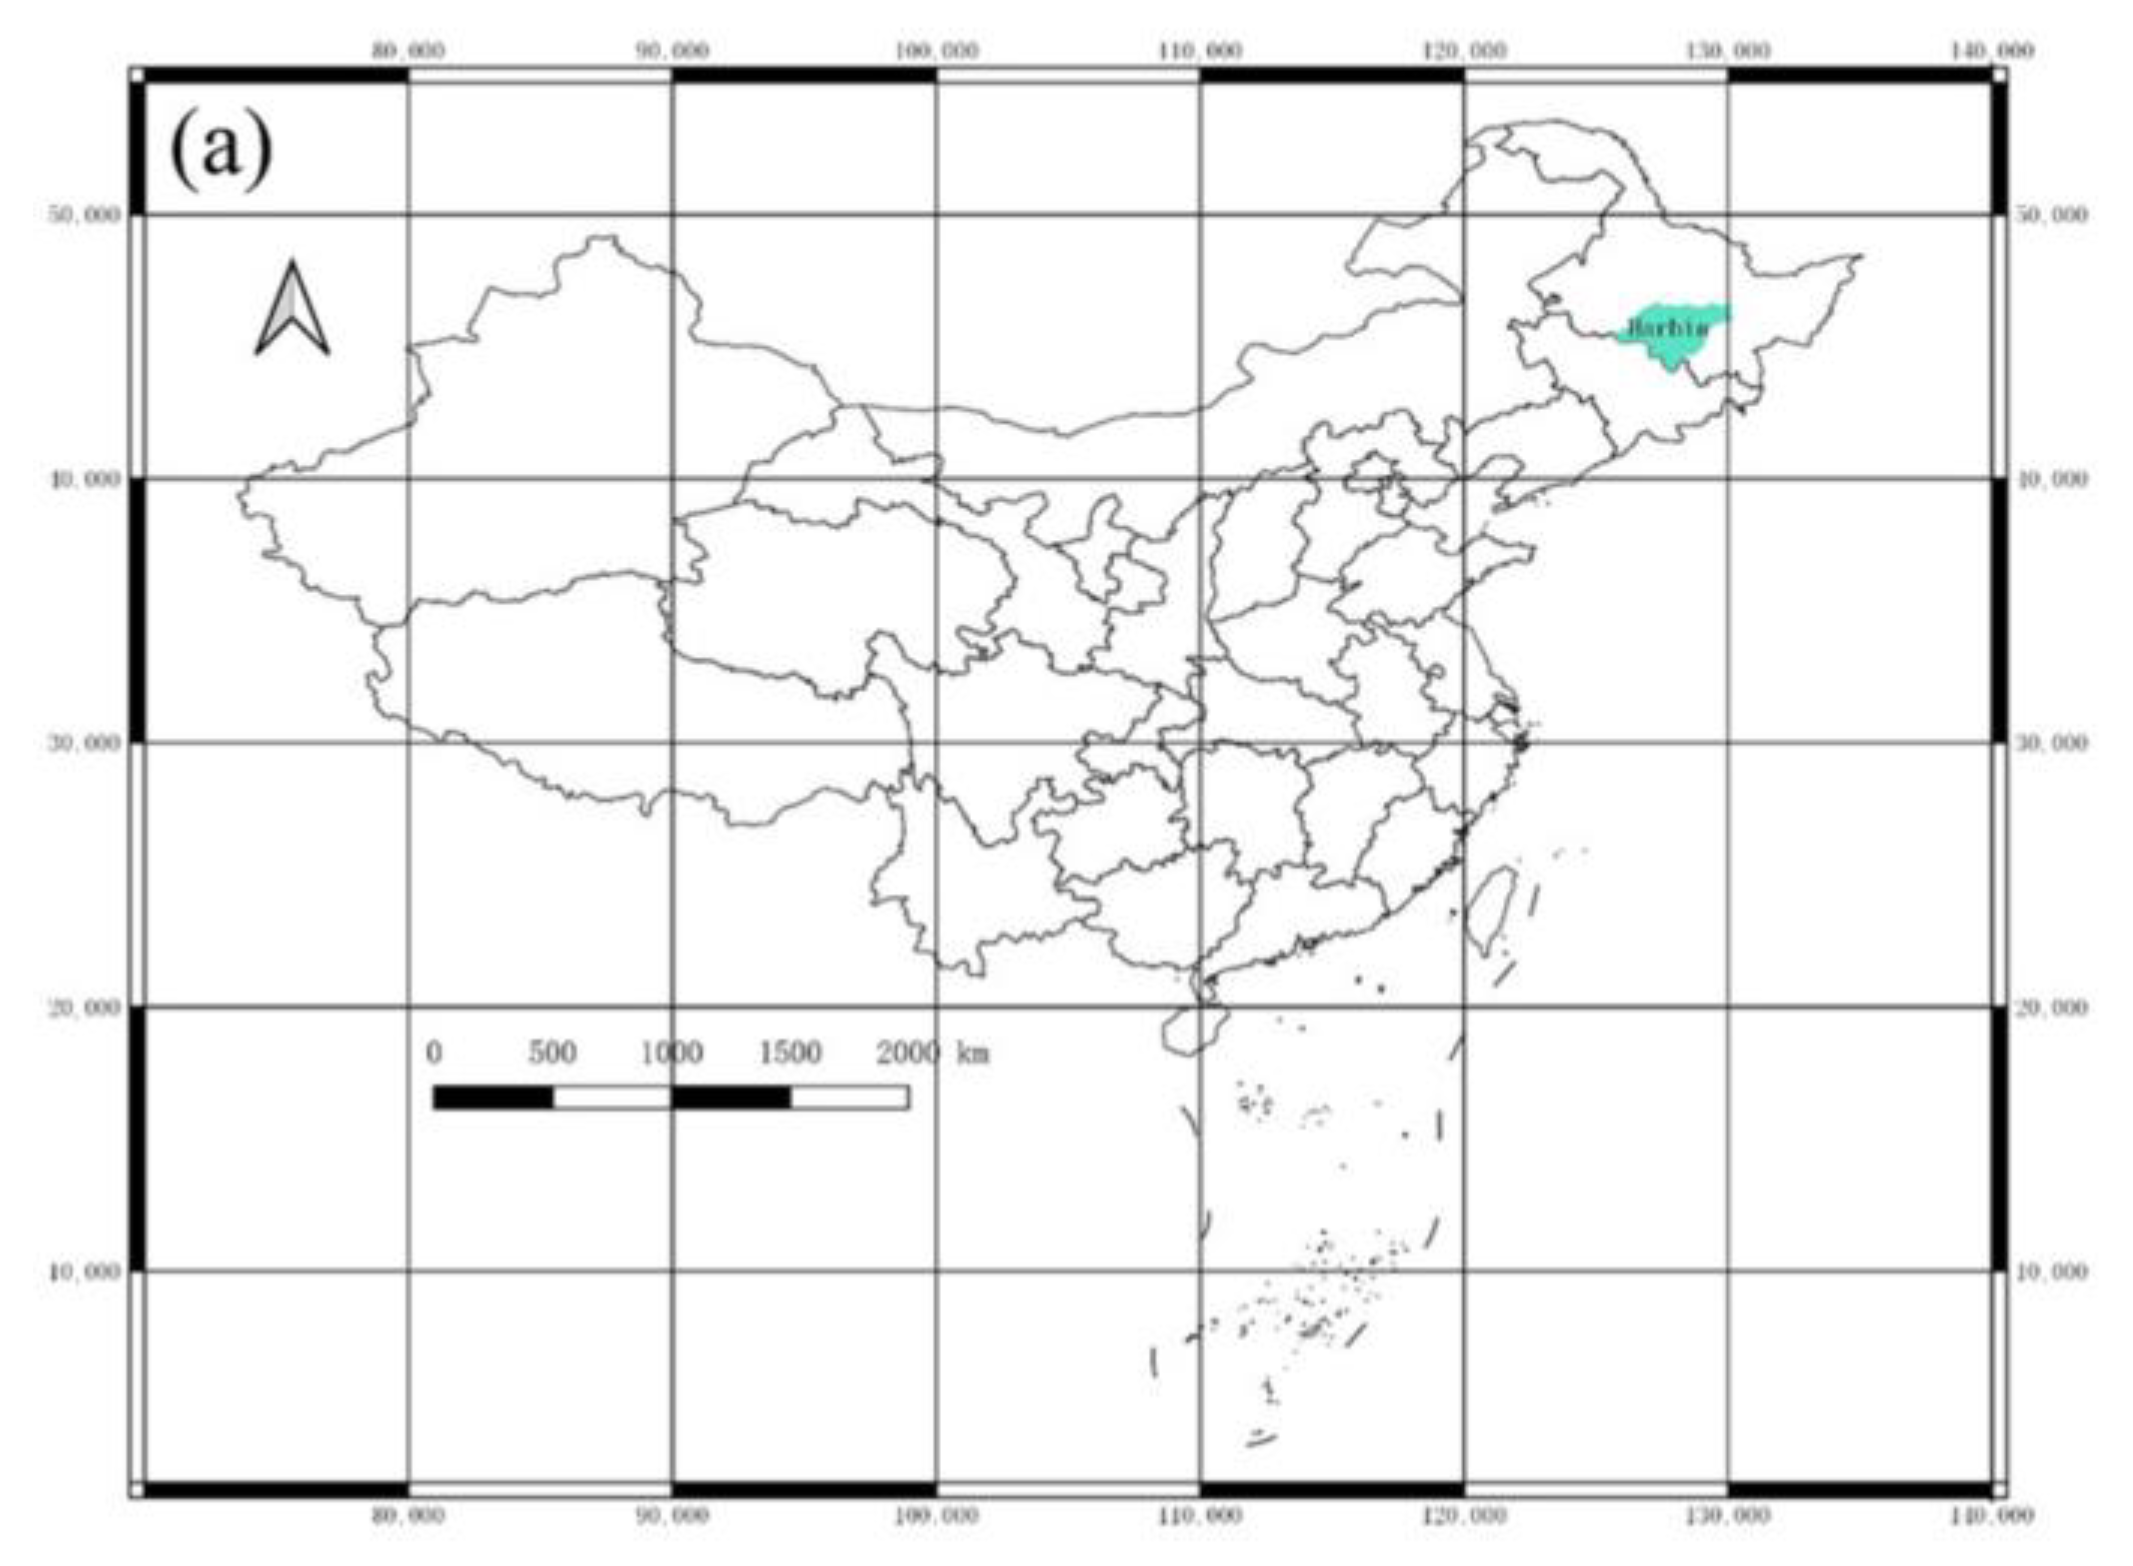
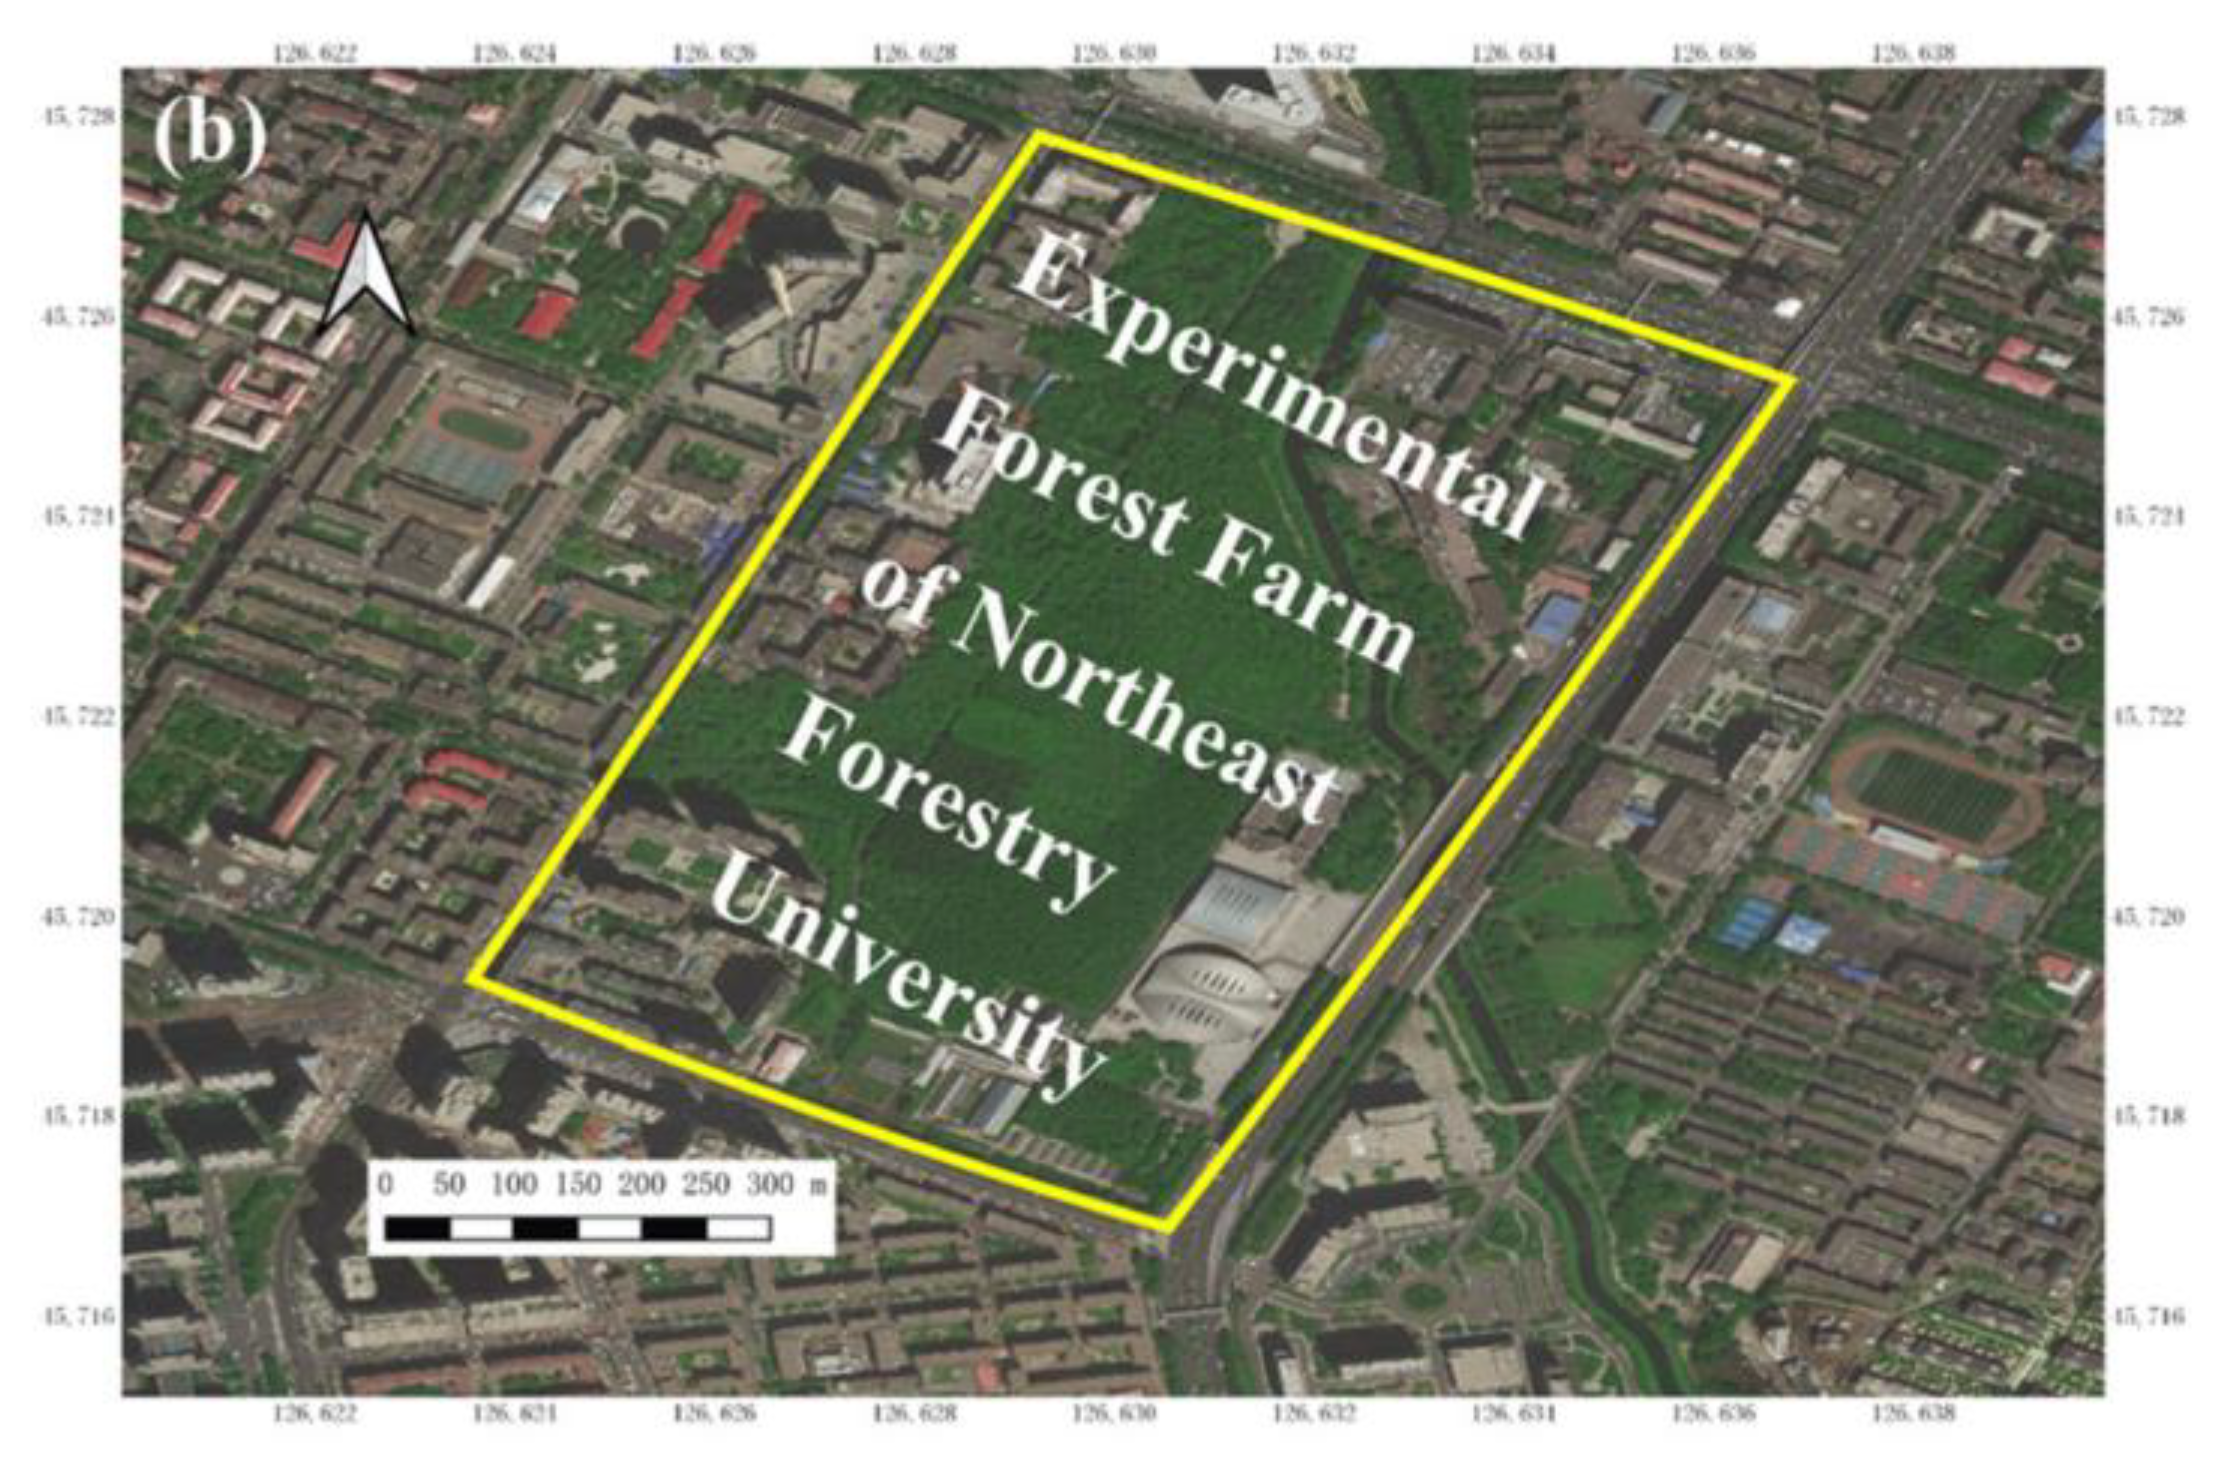
2.1. Study Site
2.2. Experimental Design and Field Survey
2.3. Soil Properties and Amino Sugar Determination
2.4. Calculation of Tree Diversity and Species Importance Value
2.5. Data Statistics and Analysis
3. Results
3.1. Relationships of Fungi- and Bacteria-Derived Residues and Environmental Factors
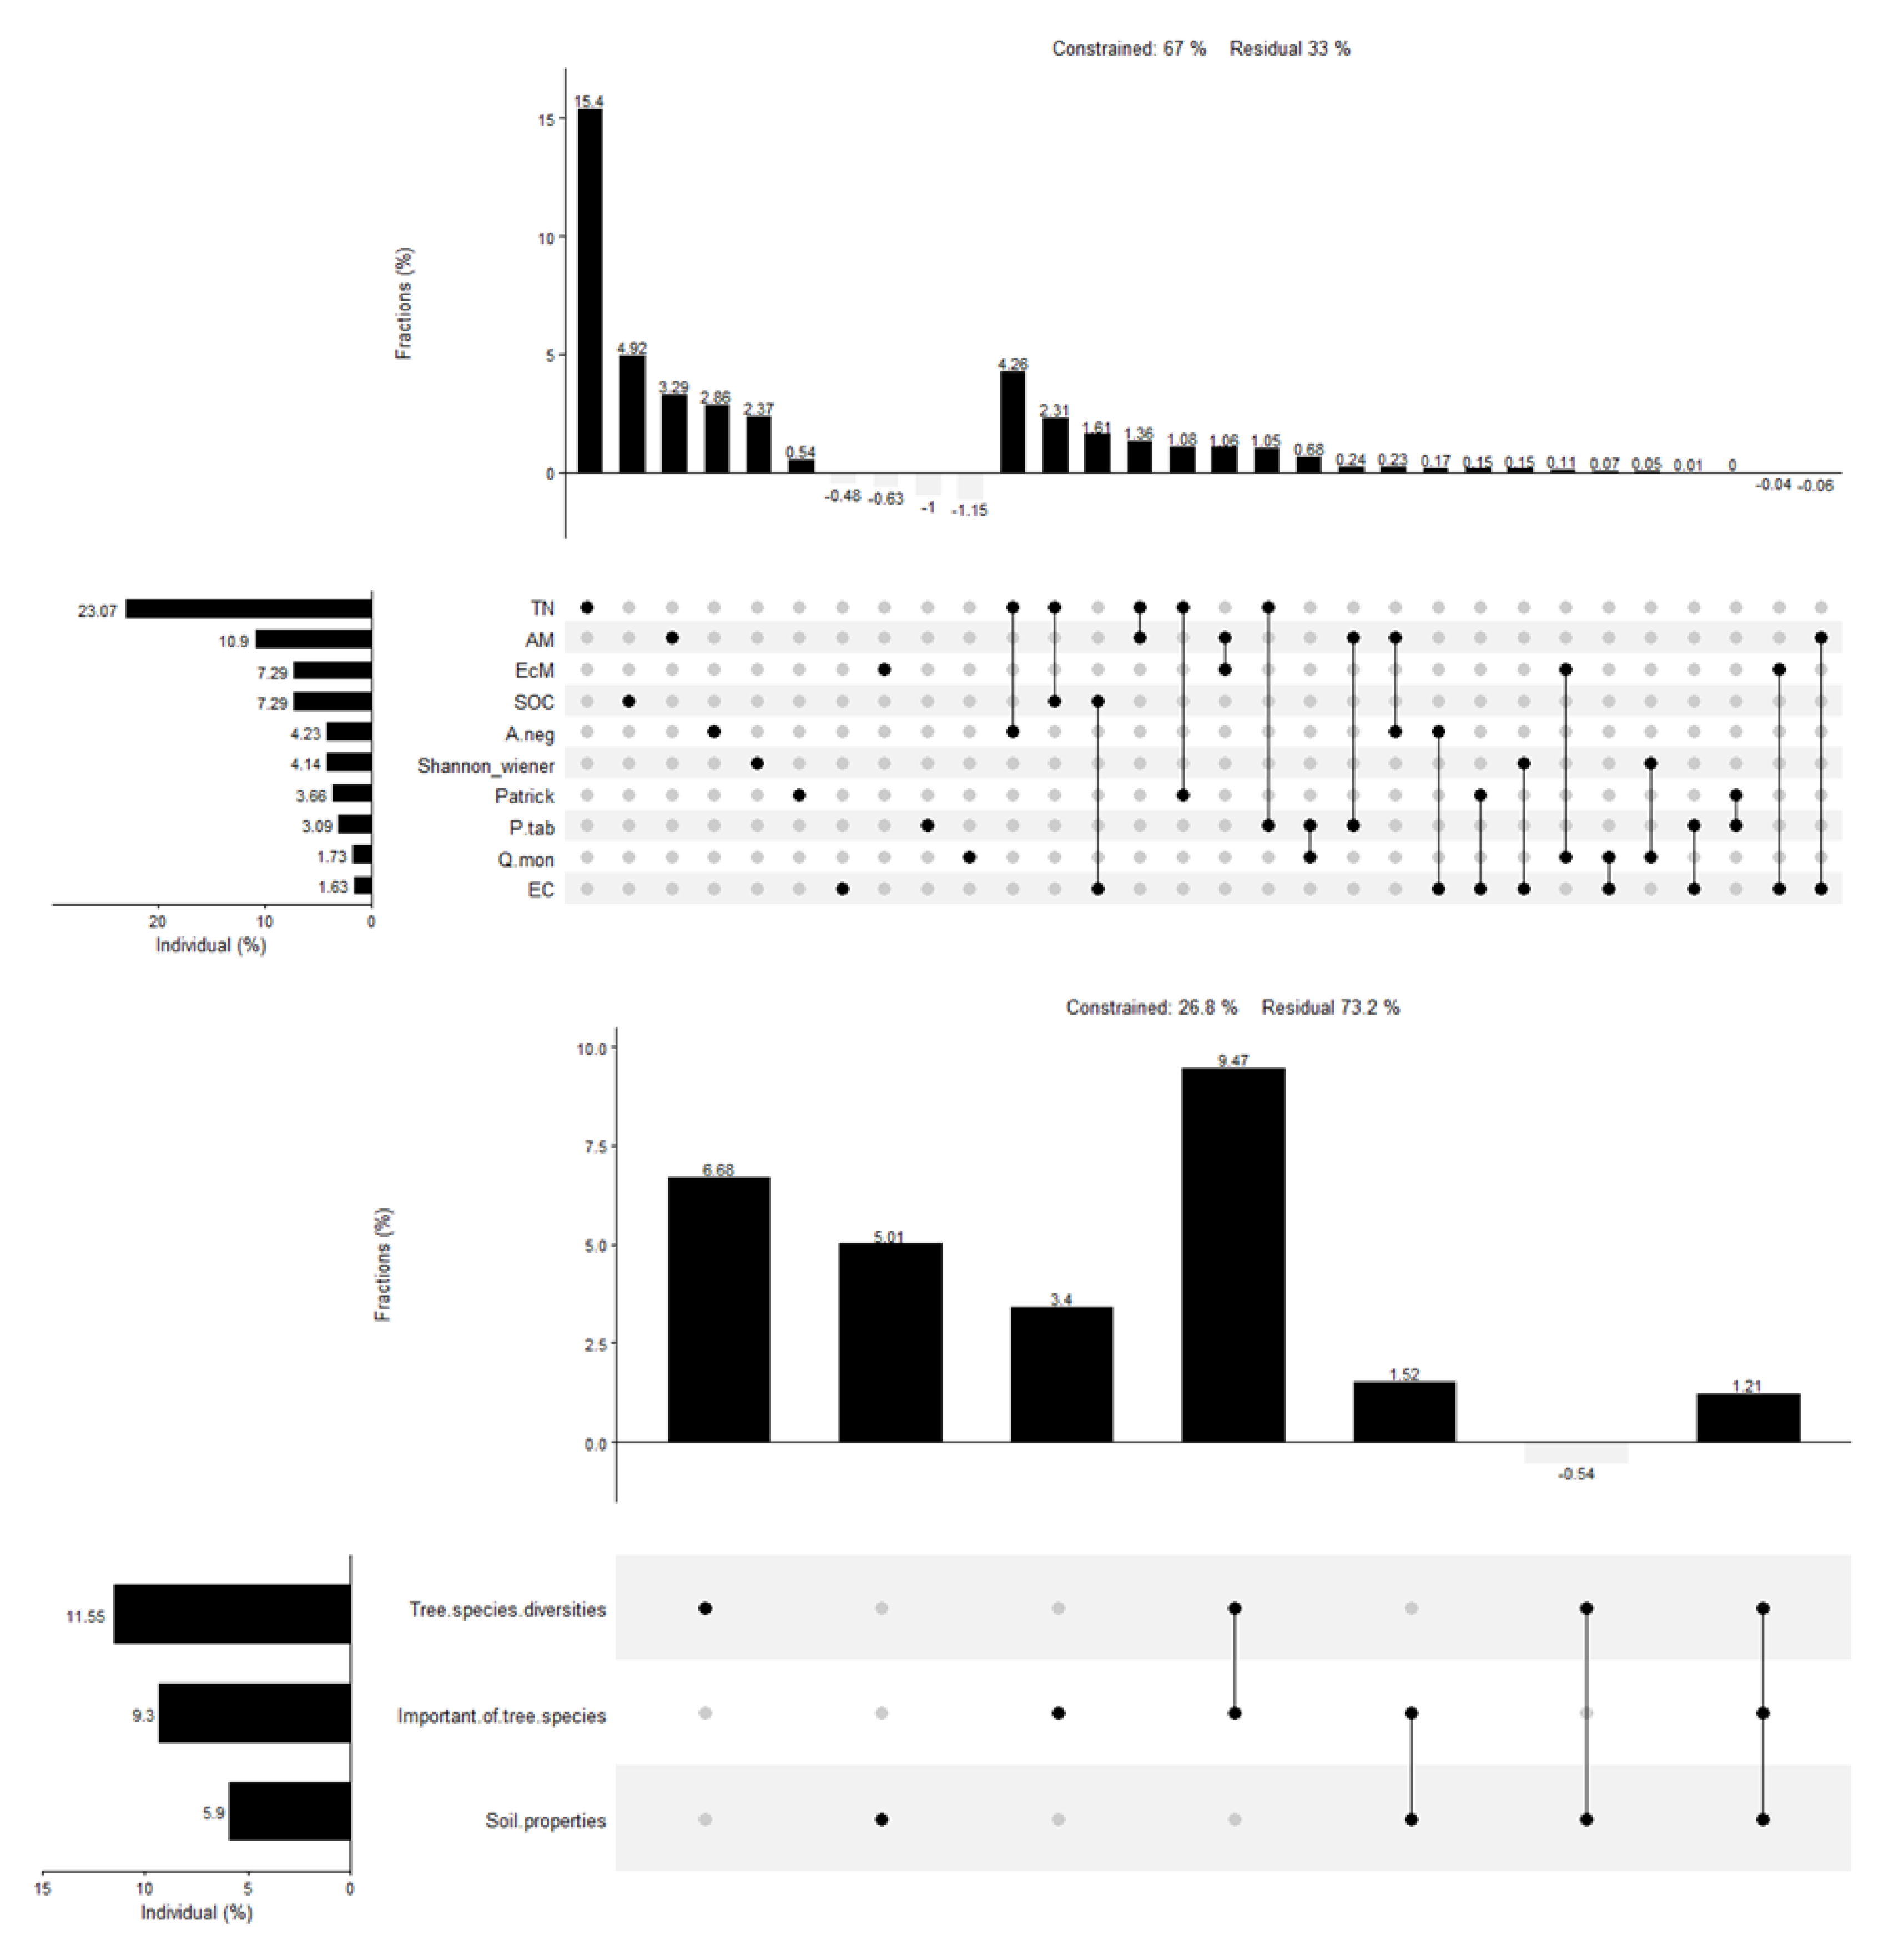
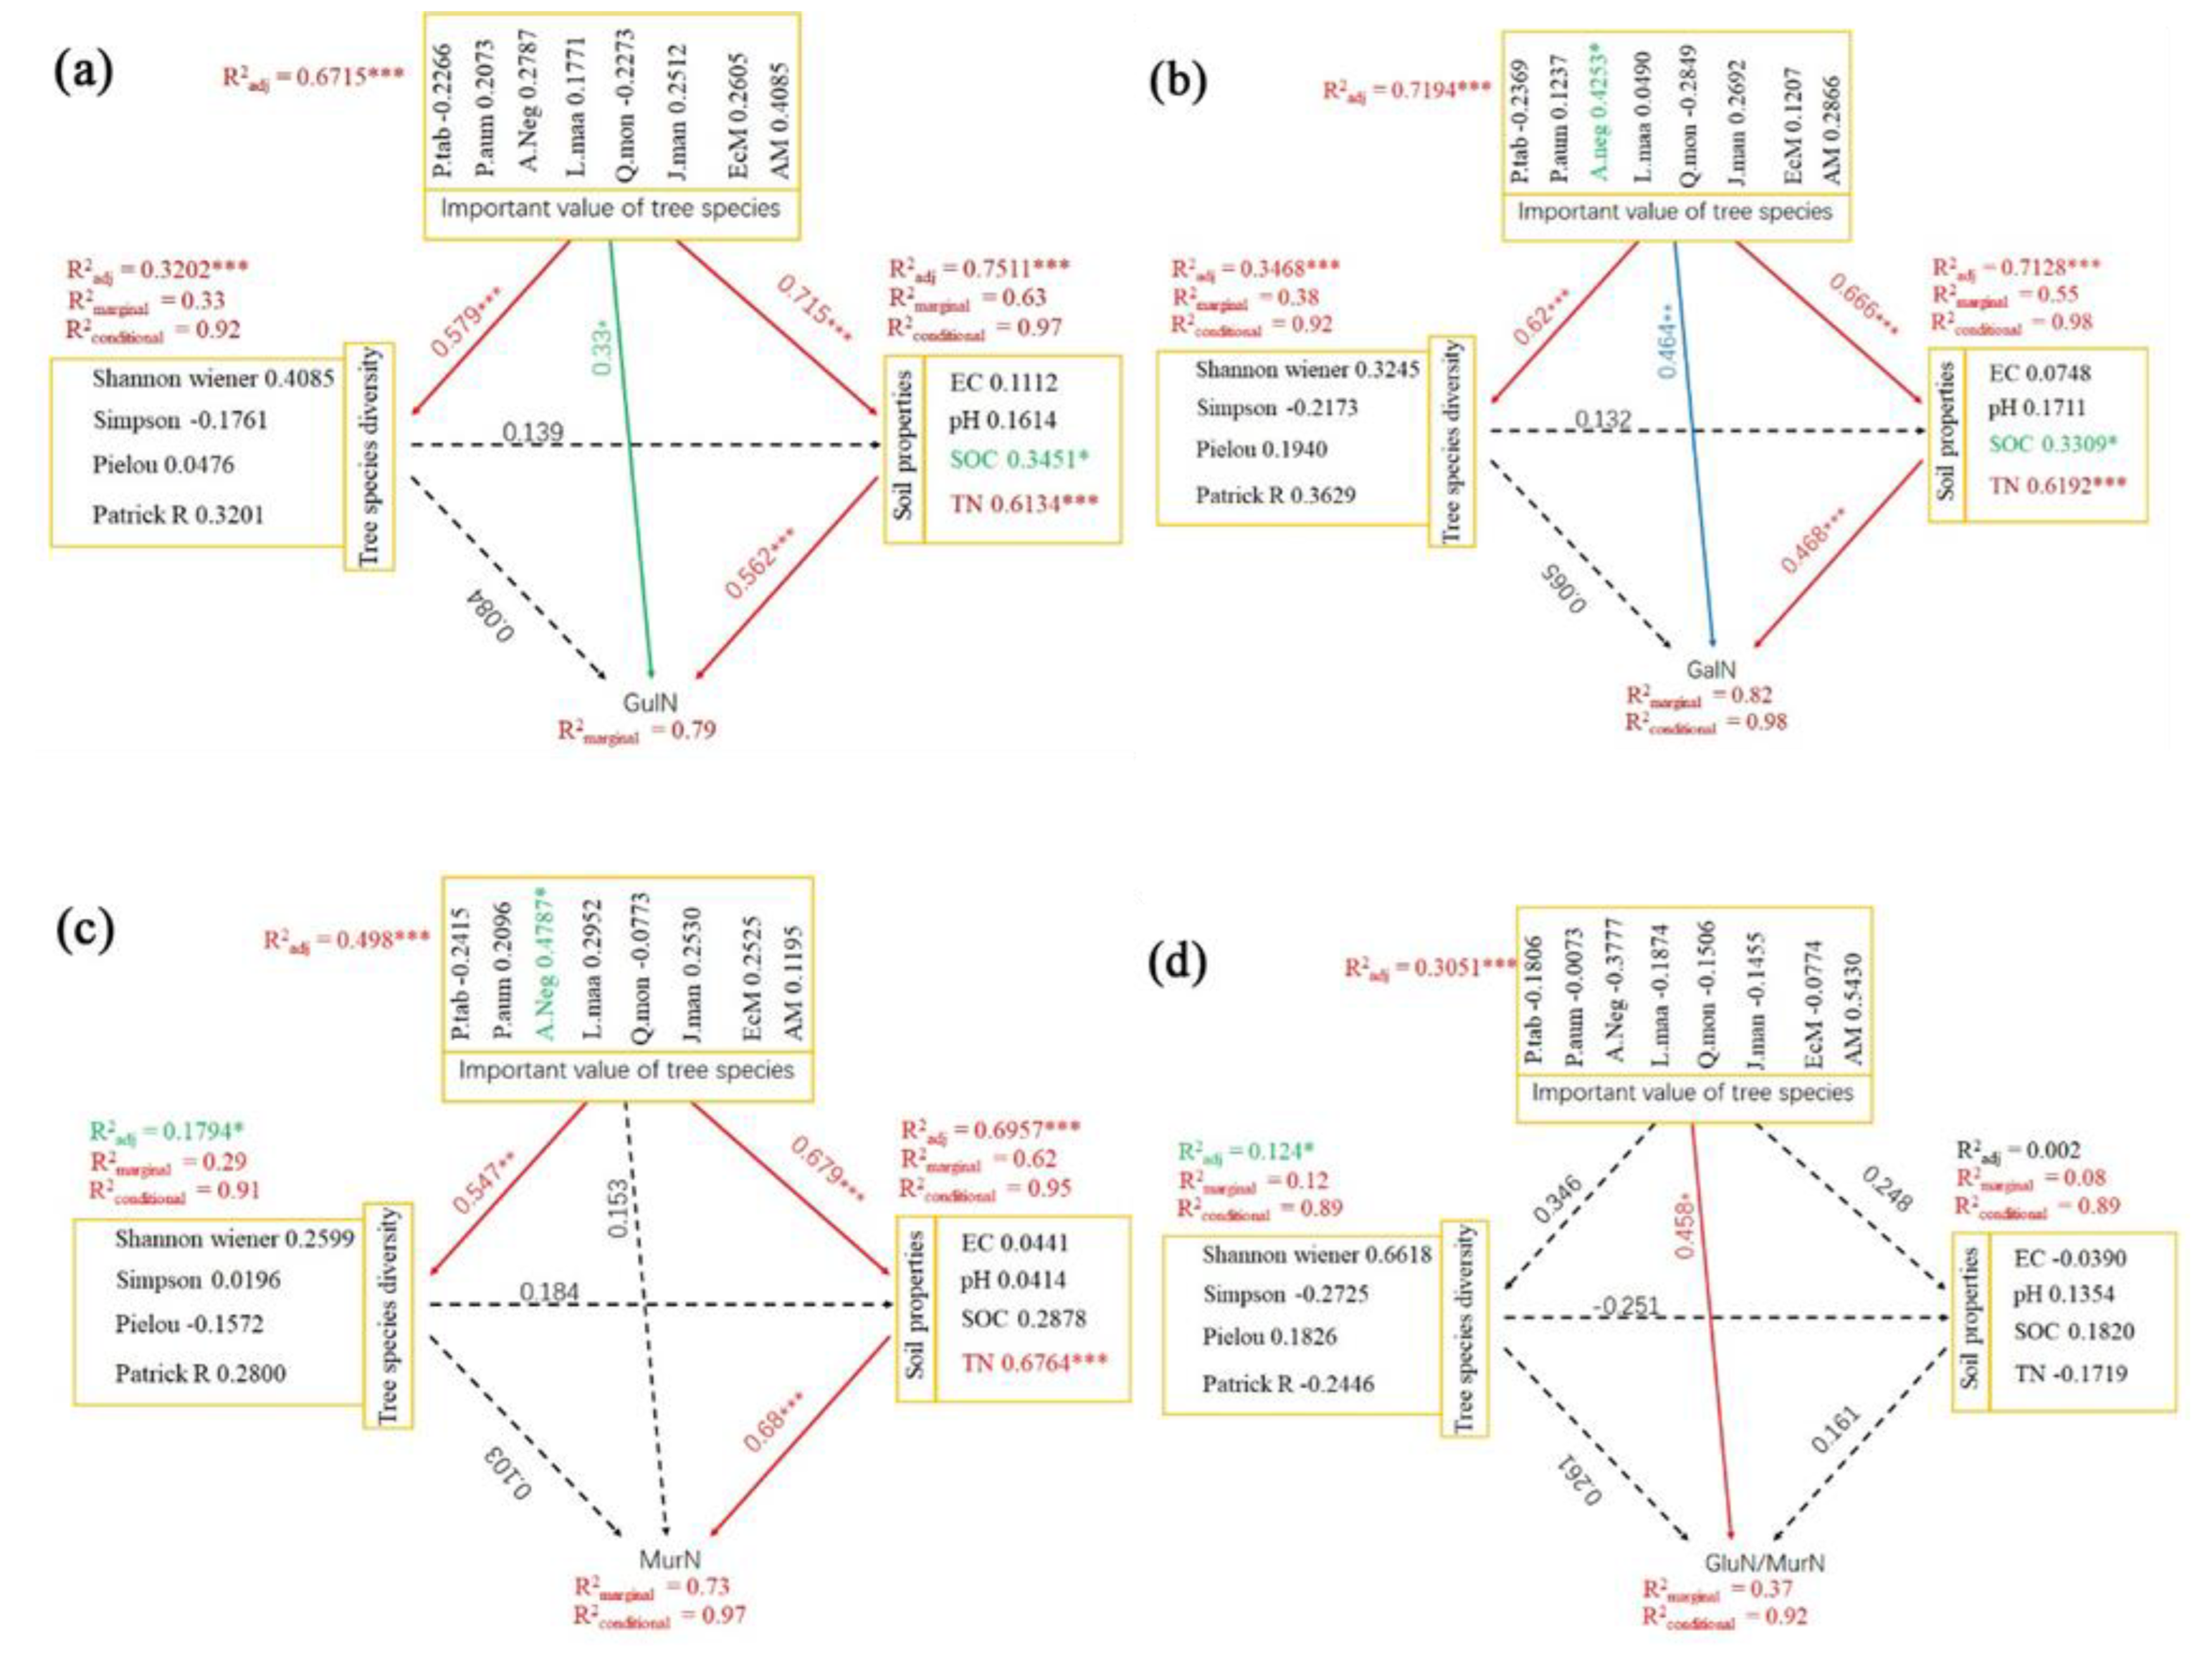
3.2. Separate Effects of Environmental Factors on Fungi- and Bacteria-Derived Residues
4. Discussion
5. Conclusions
Author Contributions
Funding
Data Availability Statement
Acknowledgments
Conflicts of Interest
Appendix A

| Tree Species | Abbreviations | Mycorrhizal Type |
|---|---|---|
| Pinus sylvestris var. mongolica Litv. | P. syl | Ectomycorrhiza |
| Fraxinus mandshurica Rupr. | F. man | Arbuscular mycorrhiza |
| Phellodendron amurense Rupr. | P. amu | Arbuscular mycorrhiza |
| Quercus mongolica Fisch. ex Ledeb. | Q. mon | Ectomycorrhiza |
| Juglans mandshurica Maxim. | J. man | Arbuscular mycorrhiza |
| Ulmus pumila L. | U. pum | Arbuscular mycorrhiza |
| Lonicera maackii (Rupr.) Maxim. | L. maa | Arbuscular mycorrhiza |
| Pinus tabuliformis var. mukdensis (Uyeki ex Nakai) Uyeki | P. tab | Ectomycorrhiza |
| Acer negundo L. | A. neg | Arbuscular mycorrhiza |
| Analyzed amino sugars | ||
| Glucosamine | GluN | |
| Galactosamine | GalN | |
| Muramic acid | MurN | |
| Glucosamine:Muramic acid | GluN:MurN | |
| Soil properties | ||
| Soil organic carbon | SOC | |
| Total nitrogen | TN | |
| Electrical conductivity | EC |
| Influence Factors | Explains (%) | F | p | Adj.r.Squared |
|---|---|---|---|---|
| TN | 16.6259 | 51.5933 | 0.001 *** | 0.4995107 |
| AM | 4.1134 | 12.7648 | 0.002 ** | 0.6183001 |
| SOC | 1.3267 | 4.1169 | 0.034 * | 0.6575433 |
| Shannon_wiener | 1.0081 | 3.1284 | 0.082 | |
| pH | 0.7106 | 2.205 | 0.134 | |
| F. man | 0.5762 | 1.7881 | 0.204 | |
| Patrick | 0.5676 | 1.7613 | 0.181 | |
| L. maa | 0.5103 | 1.5836 | 0.191 | |
| EC | 0.4501 | 1.3969 | 0.252 | |
| J. man | 0.4428 | 1.3741 | 0.269 | |
| P. aum | 0.36 | 1.1171 | 0.347 | |
| P. tab | 0.2378 | 0.738 | 0.46 | |
| EcM | 0.1656 | 0.5138 | 0.559 | |
| P. syl | 0.1437 | 0.446 | 0.594 | |
| Residual | 0.045115 |
| RDA1 | RDA2 | r2 | p | |
|---|---|---|---|---|
| TN | 0.99822 | 0.05958 | 0.6579 | 0.001 *** |
| AM | 0.90208 | −0.43156 | 0.6903 | 0.001 *** |
| Patrick | 0.94653 | −0.32263 | 0.3688 | 0.001 *** |
| SOC | 0.99199 | −0.12633 | 0.3261 | 0.006 ** |
| EC | 0.98522 | −0.17132 | 0.2199 | 0.034 * |
| EcM | −0.9321 | 0.3622 | 0.6202 | 0.001 *** |
| Shannon_wiener | 0.88652 | −0.4627 | 0.4353 | 0.001 *** |
| J. man | 0.80795 | −0.58925 | 0.1974 | 0.065 |
| L. maa | 0.99929 | 0.03775 | 0.1886 | 0.062 |
| P. tab | −0.99915 | 0.04113 | 0.2628 | 0.027 * |
| P. aum | 0.96793 | −0.25121 | 0.1601 | 0.088 |
| A. neg | 0.92844 | 0.37148 | 0.2069 | 0.041 * |
| pH | 0.90331 | −0.42899 | 0.0407 | 0.55 |
| P. syl | −0.9557 | 0.29436 | 0.0227 | 0.75 |
| Q. mon | −0.788 | 0.61567 | 0.3287 | 0.01 ** |
| F. man | 0.66875 | −0.74349 | 0.0878 | 0.288 |
| U. pum | 0.13074 | −0.99142 | 0.0805 | 0.32 |
References
- Bäckstrand, K.; Lövbrand, E. Planting Trees to Mitigate Climate Change: Contested Discourses of Ecological Modernization, Green Governmentality and Civic Environmentalism. Glob. Environ. Politic 2006, 6, 50–75. [Google Scholar] [CrossRef]
- Zhu, H.; Cai, Y.; Lin, H.; Tian, Y. Impacts of Cross-Sectoral Climate Policy on Forest Carbon Sinks and Their Spatial Spillover: Evidence from Chinese Provincial Panel Data. Int. J. Environ. Res. Public Health 2022, 9, 14334. [Google Scholar] [CrossRef]
- Tian, Y. Conservation of forest resources and the role of forest tree breeding. Breed Res. 2009, 11, 112–115. [Google Scholar]
- Gogoi, A.; Ahirwal, J.; Sahoo, U.K. Plant biodiversity and carbon sequestration potential of the planted forest in Brahmaputra flood plains. J. Environ. Manag. 2021, 280, 111671. [Google Scholar] [CrossRef] [PubMed]
- Huang, C.D.; Zhang, G.Q. Impact Factors of Carbon Sequestration in Artificial Forest Carbon Stock and Its Impact Factors. World For. Res. 2009, 22, 34–38. [Google Scholar] [CrossRef]
- Shi, X.; Wang, T.; Lu, S.; Chen, K.; He, D.; Xu, Z. Evaluation of China’s forest carbon sink service value. Environ. Sci. Pollut. Res. 2022, 29, 44668–44677. [Google Scholar] [CrossRef]
- Peichl, M.; Arain, M.A. Above-and belowground ecosystem biomass and carbon pools in an age-sequence of temperate pine plantation forests. Agric. For. Meteorol. 2006, 140, 51–63. [Google Scholar] [CrossRef]
- Taylor, A.R.; Wang, J.R.; Chen, H.Y. Carbon storage in a chronosequence of red spruce (Picea rubens) forests in central Nova Scotia, Canada. Can. J. Forest Res. 2007, 37, 2260–2269. [Google Scholar] [CrossRef]
- State Forestry Administration of China. Results of the Eighth Forest Resource Inventory. For. Resour. Manag. 2014, 1–2. [Google Scholar]
- Qian, Y.; Sun, H.; Dong, R.; Jiang, J. Research Progress of Carbohydrates Allocation in Conifers. Sci. Silvae Sin. 2018, 54, 141–153. [Google Scholar] [CrossRef]
- Clemmensen, K.E.; Durling, M.B.; Michelsen, A.; Hallin, S.; Finlay, R.D.; Lindahl, B.D. A tipping point in carbon storage when forest expands into tundra is related to mycorrhizal recycling of nitrogen. Ecol. Lett. 2021, 24, 1193–1204. [Google Scholar] [CrossRef]
- Phillips, R.P.; Brzostek, E.; Midgley, M.G. The mycorrhizal-associated nutrient economy: A new framework for predicting carbon-nutrient couplings in temperate forests. New Phytol. 2013, 199, 41–51. [Google Scholar] [CrossRef]
- Steidinger, B.S.; Crowther, T.W.; Liang, J.; Van Nuland, M.E.; Werner, G.D.; Reich, P.B.; Nabuurs, G.J.; de-Miguel, S.; Zhou, M.; Zhou, N.; et al. Climatic controls of decomposition drive the global biogeography of forest-tree symbioses. Nature 2019, 569, 404–408. [Google Scholar] [CrossRef]
- Clemmensen, K.E.; Bahr, A.; Ovaskainen, O.; Dahlberg, A.; Ekblad, A.; Wallander, H.; Stenlid, J.; Finlay, R.D.; Wardle, D.A.; Lindahl, B.D. Roots and associated fungidrive long-term carbon sequestration in boreal forest. Science 2013, 339, 1615–1618. [Google Scholar] [CrossRef]
- Clemmensen, K.E.; Finlay, R.D.; Dahlberg, A.; Stenlid, J.; Wardle, D.A.; Lindahl, B.D. Carbon sequestration is related to mycorrhizal fungal community shifts during long-term succession in boreal forests. New Phytol. 2015, 205, 1525–1536. [Google Scholar] [CrossRef]
- Fransson, P. Elevated CO2 impacts ectomycorrhiza-mediated forest soil carbon flow: Fungal biomass production, respiration and exudation. Fungal Ecol. 2012, 5, 85–98. [Google Scholar] [CrossRef]
- Frey, S.D. Mycorrhizal fungi as mediators of soil organic matter dynamics. Annu. Rev. Ecol. Evol. Syst. 2019, 50, 237–259. [Google Scholar] [CrossRef]
- Hodge, A. Chapter 8—Accessibility of Inorganic and Organic Nutrients for Mycorrhizas. In Mycorrhizal Mediation of Soil; Elsevier: Amsterdam, The Netherlands, 2017; pp. 129–148. [Google Scholar] [CrossRef]
- Li, T.; Zou, Y.; Liu, Y.; Luo, P.; Xiong, Q.; Lu, H.; Lai, C.; Axmacher, J.C. Mountain forest biomass dynamics and its drivers in southwestern China between 1979 and 2017. Ecol. Indic. 2022, 142, 109289. [Google Scholar] [CrossRef]
- Kirby, K.R.; Potvin, C. Variation in carbon storage among tree species: Implications for the management of a small-scale carbon sink project. For. Ecol. Manag. 2007, 246, 208–221. [Google Scholar] [CrossRef]
- Banik, B.; Deb, D.; Deb, S.; Datta, B.K. Assessment of Biomass and Carbon Stock in Sal (Shorea robusta Gaertn.) Forests under Two Management Regimes in Tripura, Northeast India. J. For. Environ. Sci. 2018, 34, 209–223. [Google Scholar] [CrossRef]
- Simpson, A.J.; Simpson, M.J.; Smith, E.; Kelleher, B.P. Microbially derived inputs to soil organic matter: Are current estimates too low? Environ. Sci. Technol. 2007, 41, 8070–8076. [Google Scholar] [CrossRef]
- Huang, Y.; Liang, C.; Duan, X.; Chen, H.; Li, D. Variation of microbial residue contribution to soil organic carbon sequestration following land use change in a subtropical karst region. Geoderma 2019, 353, 340–346. [Google Scholar] [CrossRef]
- Kallenbach, C.M.; Frey, S.D.; Grandy, A.S. Direct evidence for microbial-derived soil organic matter formation and its ecophysiological controls. Nat. Commun. 2016, 7, 13630. [Google Scholar] [CrossRef] [PubMed]
- Shao, S.; Zhao, Y.; Zhang, W.; Hu, G.; Xie, H.; Yan, J.; Han, S.; He, H.; Zhang, X. Linkage of microbial residue dynamics with soil organic carbon accumulation during subtropical forest succession. Soil Biol. Biochem. 2017, 114, 114–120. [Google Scholar] [CrossRef]
- Craig, M.E.; Turner, B.L.; Liang, C.; Clay, K.; Johnson, D.J.; Phillips, R.P. Tree mycorrhizal type predicts within-site variability in the storage and distribution of soil organic matter. Glob. Change Biol. 2018, 4, 3317–3330. [Google Scholar] [CrossRef]
- Chen, Q.; Ding, X.; Zhang, B. The Effects of N Addition on Soil Microbial Residues in Croplands and Forests: A Meta-analysis. J. Soil Sci. Plant Nutr. 2023, 23, 1449–1458. [Google Scholar] [CrossRef]
- Wang, X.; Zhou, L.; Zhou, G.; Zhou, H.; Lu, C.; Gu, Z.; Liu, R.; He, Y.; Du, Z.; Liang, X.; et al. Tradeoffs of fungal and bacterial residues mediate soil carbon dynamics under persistent drought in subtropical evergreen forests. Appl. Soil Ecol. 2022, 178, 104588. [Google Scholar] [CrossRef]
- Chen, S.; Zhang, X.; She, D.; Zhang, Z.; Zhou, Z.; Wang, H.; Wang, W. Effects of plant species diversity, dominant species importance, and soil properties on glomalin-related soil protein. Biodivers. Sci. 2022, 30, 21115. [Google Scholar] [CrossRef]
- Wang, W.; Lu, J.; Du, H.; Wei, C.; Wang, H.; Fu, Y.; He, X. Ranking thirteen tree species based on their impact on soil physiochemical properties, soil fertility, and carbon sequestration in Northeastern China. For. Ecol. Manag. 2017, 404, 214–229. [Google Scholar] [CrossRef]
- Shi, G.; Liu, F.; Chen, D.; Deng, Y.; Lin, L. Species composition and community classification of the 20-ha tropical seasonal rainforest dynamics monitoring plot in the Naban River, Yunnan. Biodivers. Sci. 2021, 29, 10–20. [Google Scholar] [CrossRef]
- Bao, S.D. Soil Agrochemical Analysis; China Agriculture Press: Beijing, China, 2000. [Google Scholar]
- Zhang, X.D.; Amelung, W. Gas chromatographic determination of muramic acid, glucosamine, mannosamine, and galactosamine in soils. Soil Biol. Biochem. 1996, 28, 1201–1206. [Google Scholar] [CrossRef]
- Jia, Y.; Zhai, G.; Zhu, S.; Liu, X.; Schmid, B.; Wang, Z.; Ma, K.; Feng, X. Plant and microbial pathways driving plant diversity effects on soil carbon accumulation in subtropical forest. Soil Biol. Biochem. 2021, 161, 108375. [Google Scholar] [CrossRef]
- Guggenberger, G.; Frey, S.D.; Six, J.; Paustian, K.; Elliott, E.T. Bacterial and Fungal Cell-Wall Residues in Conventional and No-Tillage Agroecosystems. Soil Sci. Soc. Am. J. 1999, 63, 1188–1198. [Google Scholar] [CrossRef]
- Liang, C.; Kao-Kniffin, J.; Sanford, G.R.; Wickings, K.; Balser, T.C.; Jackson, R.D. Microorganisms and their residues under restored perennial grassland communities of varying diversity. Soil Biol. Biochem. 2016, 103, 192–200. [Google Scholar] [CrossRef]
- Ma, K.P.; Huang, J.H.; Yu, S.L.; Chen, L. Plant community diversity in Dongling Mountain, Beijing, China. II. Species richness, evenness and species diversities. Acta Ecol. Sin. 1995, 15, 268–277. [Google Scholar]
- Zhang, X.; Dai, G.; Ma, T.; Liu, N.; Hu, H.; Ma, W.; Zhang, J.-B.; Wang, Z.; Peterse, F.; Feng, X. Links between microbial biomass and necromass components in the top- and subsoils of temperate grasslands along an aridity gradient. Geoderma 2020, 379, 114623. [Google Scholar] [CrossRef]
- Kong, W.; Yao, Y.; Hou, L.; Bao, K.; Zhang, L.; Wei, X. Effects of vegetation presence on soil net N mineralization are independent of landscape position and vegetation type in an eroding watershed. Agric. Ecosyst. Environ. 2022, 325, 107743. [Google Scholar] [CrossRef]
- Lai, J.; Zou, Y.; Zhang, J.; Peres-Neto, P.R. Generalizing hierarchical and variation partitioning in multiple regression and canonical analyses using the rdacca.hp R package. Methods Ecol. Evol. 2022, 13, 782–788. [Google Scholar] [CrossRef]
- Pecuchet, L.; Jørgensen, L.L.; Dolgov, A.V.; Eriksen, E.; Husson, B.; Skern-Mauritzen, M.; Primicerio, R. Spatio-temporal turnover and drivers of bentho-demersal community and food web structure in a high-latitude marine ecosystem. Divers. Distrib. 2022, 28, 2503–2520. [Google Scholar] [CrossRef]
- Bates, D.; Mächler, M.; Bolker, B.M.; Walker, S. lme4: Linear mixed-efects models using Eigen and S4. J. Stat. Softw. 2015, 67, 1–48. [Google Scholar] [CrossRef]
- Lefcheck, J.S. piecewiseSEM: Piecewise structural equation modelling in R for ecology, evolution, and systematics. Methods Ecol. Evol. 2015, 7, 573–579. [Google Scholar] [CrossRef]
- Chen, W.; Xie, X.; Wang, J.; Pradhan, B.; Hong, H.; Bui, D.T.; Duan, Z.; Ma, J. A comparative study of logistic model tree, random forest, and classification and regression tree models for spatial prediction of landslide susceptibility. Catena 2017, 151, 147–160. [Google Scholar] [CrossRef]
- Augusto, L.; Boča, A. Tree functional traits, forest biomass, and tree species diversity interact with site properties to drive forest soil carbon. Nat. Commun. 2022, 13, 1097. [Google Scholar] [CrossRef]
- Wang, H.; Ding, Y.; Zhang, Y.; Wang, J.; Freedman, Z.B.; Liu, P.; Cong, W.; Wang, J.; Zang, R.; Liu, S. Evenness of soil organic carbon chemical components changes with tree species richness, composition and functional diversity across forests in China. Glob. Change Biol. 2023, 29, 2852–2864. [Google Scholar] [CrossRef] [PubMed]
- Steinauer, K.; Chatzinotas, A.; Eisenhauer, N. Root exudate cocktails: The link between plant diversity and soil microorganisms? Ecol. Evol. 2016, 6, 7387–7396. [Google Scholar] [CrossRef] [PubMed]
- Mao, R.; Zhang, X.; Song, C.; Wang, X.; Finnegan, P.M. Plant functional group controls litter decomposition rate and its temperature sensitivity: An incubation experiment on litters from a boreal peatland in northeast China. Sci. Total Environ. 2018, 626, 678–683. [Google Scholar] [CrossRef] [PubMed]
- Wan, S.; Lin, G.; Liu, B.; Ding, Y.; Li, S.; Mao, R. Contrasting responses of soil phosphorus pool and bioavailability to alder expansion in a boreal peatland, Northeast China. Catena 2022, 212, 106128. [Google Scholar] [CrossRef]
- Chen, G.J.; Shi, F.X.; Ying, Q.; Mao, R. Alder expansion increases soil microbial necromass carbon in a permafrost peatland of Northeast China. Ecol. Indic. 2022, 144, 109488. [Google Scholar] [CrossRef]
- Ramm, E.; Liu, C.; Mueller, C.W.; Gschwendtner, S.; Yue, H.; Wang, X.; Bachmann, J.; Bohnhoff, J.A.; Ostler, U.; Schloter, M.; et al. Alder-induced stimulation of soil gross nitrogen turnover in a permafrost-affected peatland of Northeast China. Soil Biol. Biochem. 2022, 172, 108757. [Google Scholar] [CrossRef]
- Cotrufo, M.F.; Wallenstein, M.D.; Boot, C.M.; Denef, K.; Paul, E. The Microbial Efficiency-Matrix Stabilization (MEMS) framework integrates plant litter decomposition with soil organic matter stabilization: Do labile plant inputs form stable soil organic matter? Glob. Change Biol. 2013, 19, 988–995. [Google Scholar] [CrossRef]
- Lin, G.; Mccormack, M.L.; Ma, C.; Guo, D. Similar below-ground carbon cycling dynamics but contrasting modes of nitrogen cycling between arbuscular mycorrhizal and ectomycorrhizal forests. New Phytol. 2016, 213, 1440–1451. [Google Scholar] [CrossRef] [PubMed]
- Midgley, M.G.; Brzostek, E.; Phillips, R.P. Decay rates of leaf litters from arbuscular mycorrhizal trees are more sensitive to soil effects than litters from ectomycorrhizal trees. J. Ecol. 2015, 103, 1454–1463. [Google Scholar] [CrossRef]
- Jacobs, L.M.; Sulman, B.N.; Brzostek, E.R.; Feighery, J.J.; Phillips, R.P. Interactions among decaying leaf litter, root litter and soil organic matter vary with mycorrhizal type. J. Ecol. 2018, 106, 502–513. [Google Scholar] [CrossRef]
- Rasse, D.P.; Rumpel, C.; Dignac, M. Is soil carbon mostly root carbon? Mechanisms for a specific stabilisation. Plant Soil 2005, 269, 341–356. [Google Scholar] [CrossRef]


| Glucosamine | Galactosamine | Muramic Acid | Glucosamine:Muramic Acid | |
|---|---|---|---|---|
| Soil properties | ||||
| EC | 0.52 ** | 0.45 * | 0.42 * | 0.14 |
| pH | 0.32 | 0.34 | 0.2 | 0.13 |
| SOC | 0.62 *** | 0.51 ** | 0.53 ** | 0.09 |
| TN | 0.72 *** | 0.76 *** | 0.81 *** | −0.01 |
| Tree diversity | ||||
| Shannon_Wiener | 0.57 *** | 0.57 *** | 0.43 * | 0.23 |
| Simpson | 0.45 * | 0.45 * | 0.37 * | 0.1 |
| Pielou | 0.18 | 0.25 | 0.11 | 0.22 |
| Patrick-R | 0.54 ** | 0.52 ** | 0.45 * | 0.15 |
| Importance values | ||||
| P. syl | −0.28 | −0.32 | −0.21 | −0.05 |
| P. tab | −0.51 ** | −0.45 * | −0.51 ** | 0.09 |
| F. man | 0.08 | 0.21 | −0.01 | 0.32 |
| P. aum | 0.40 * | 0.25 | 0.3 | 0 |
| A. neg | 0.35 | 0.54 ** | 0.53 ** | −0.26 |
| L. maa | 0.53 ** | 0.43 * | 0.56 ** | −0.09 |
| Q. mon | −0.14 | −0.26 | −0.03 | −0.41 * |
| U. pum | 0.1 | −0.01 | −0.02 | 0.25 |
| J. man | 0.54 ** | 0.48 ** | 0.3 | 0.44 * |
| Importance value of mycorrhiza types | ||||
| ECM | −0.57 *** | −0.64 *** | −0.43 * | −0.32 |
| AM | 0.64 *** | 0.62 *** | 0.44 * | 0.40 * |
Disclaimer/Publisher’s Note: The statements, opinions and data contained in all publications are solely those of the individual author(s) and contributor(s) and not of MDPI and/or the editor(s). MDPI and/or the editor(s) disclaim responsibility for any injury to people or property resulting from any ideas, methods, instructions or products referred to in the content. |
© 2023 by the authors. Licensee MDPI, Basel, Switzerland. This article is an open access article distributed under the terms and conditions of the Creative Commons Attribution (CC BY) license (https://creativecommons.org/licenses/by/4.0/).
Share and Cite
Huang, H.; Song, X.; Jin, L.; Shi, Y.; He, H.; Zhang, Z.; Tang, Z.; Wang, W. Importance Values of Mycorrhizal Fungal Types and Species Diversity Driving Variations in Fungi- and Bacteria-Derived Residues in Planted Forests in Northeast China. Forests 2023, 14, 1937. https://doi.org/10.3390/f14101937
Huang H, Song X, Jin L, Shi Y, He H, Zhang Z, Tang Z, Wang W. Importance Values of Mycorrhizal Fungal Types and Species Diversity Driving Variations in Fungi- and Bacteria-Derived Residues in Planted Forests in Northeast China. Forests. 2023; 14(10):1937. https://doi.org/10.3390/f14101937
Chicago/Turabian StyleHuang, Haiyan, Xiaoqian Song, Lu Jin, Yu Shi, Haisheng He, Zhonghua Zhang, Zhonghua Tang, and Wenjie Wang. 2023. "Importance Values of Mycorrhizal Fungal Types and Species Diversity Driving Variations in Fungi- and Bacteria-Derived Residues in Planted Forests in Northeast China" Forests 14, no. 10: 1937. https://doi.org/10.3390/f14101937
APA StyleHuang, H., Song, X., Jin, L., Shi, Y., He, H., Zhang, Z., Tang, Z., & Wang, W. (2023). Importance Values of Mycorrhizal Fungal Types and Species Diversity Driving Variations in Fungi- and Bacteria-Derived Residues in Planted Forests in Northeast China. Forests, 14(10), 1937. https://doi.org/10.3390/f14101937