Article

Variables Affecting the Pine Processionary Moth Flight: A Survey in the North-Western Italian Alps

1
Department of Agricultural, Forest and Food Sciences (DISAFA), University of Torino, Largo Paolo Braccini 2, 10095 Grugliasco, Italy
2
Department of Agricultural, Food and Environmental Sciences, University of Perugia, Borgo XX Giugno, 06121 Perugia, Italy
3
Assessorat de l’Environnement, des Ressources Naturelles et du Corps Forestier, Département des Ressources Naturelles et du Corps Forestier, Corps Forestier de la Vallée d’Aoste, Loc. La Grande Charrière, 14, 11020 Saint-Christophe, Italy
*
Author to whom correspondence should be addressed.
Forests 2023, 14(1), 31; https://doi.org/10.3390/f14010031
Submission received: 21 October 2022 / Revised: 19 December 2022 / Accepted: 20 December 2022 / Published: 23 December 2022
(This article belongs to the Section Forest Health)

Abstract

:
The pine processionary moth (PPM), Thaumetopoea pityocampa (Denis and Schiffermüller), is one of the most economically important forest defoliators in southern Europe. This pest is a univoltine oligophagous insect species, and the genus Pinus represents its main host. Investigations were carried out in the five-year period 2016–2020 in NW Italy. PPM males were monitored using commercial funnel traps baited with sex pheromone. The infestation index was recorded by counting the number of nests per tree. Temperature and rainfall were automatically recorded by 94 georeferenced meteorological stations. Adult presence was evaluated as the maximum number of captured individuals in a day, total captures during the season, the Julian day at max captures, or at first or last captures. Environmental variables (altitude, cumulative rain, and cumulative degree-days) and biological parameters were summarized using principal component analysis. Our study showed that the analyzed variables contribute to driving and affecting the PPM population dynamics, which also exhibited a year-to-year decrease. Due to the environmental and sanitary importance, all the data collected about the PPM will be useful to develop predictive risk models, as to deploy countermeasures in a timely and cost-effective manner.

1. Introduction

Changes in disturbance patterns mediated by climate warming are predicted to be the greatest impacts on forests in the coming decades. Afforestation and a correct forest management account as a key aspect to help mitigate climate change [1]. Population dynamics of ectothermic organisms are strongly influenced by environmental parameters [2], and outbreaks of forest insect pests are major agents of mortality and ecosystem change in forests worldwide. Climate has been attributed to be an important driver of changes to disturbance regimes mediated by forest insects [3], and beyond the seasonal effects of weather, ongoing changes in climatic conditions will directly lead to modifications in dispersal, reproduction, development, and mortality of insect species [4].
Range expansions have been reported for several organisms in recent history, and appear to be, at least in part, driven by global climate change [5,6,7,8,9]. The timing of life-cycle events is considered an excellent bioindicator due to its sensitivity and dependence on several climate variables. Specifically, higher mean temperatures and increased frequency of climatic extremes are expected to increase synchronization mismatches occurring between tightly interacting species, such as hosts and parasitoids or preys and predators. Many phenological events (e.g., timing of insect emergence, phenological mismatch) have been advanced in response to recent climate change [10,11,12]. In particular, interest in species range margins has been heightened in recent years as a result of species declines and because of the potential for range shifts mostly due in response to global climate change [5]. Research has been carried out on several lepidopteran species for conservation interest [13,14], but the effects of climate change on forest insect pests are demonstrated as well. In general, poleward, and upward shifts of pests and pathogens have been documented, and predictions of insect outbreaks suggest changes in spatiotemporal patterns of defoliators and bark beetles (e.g., Dendroctonus rufipennis Kirby, Choristoneura fumiferana Clements, Zeiraphera griseana Guenée) [3].
The impact of climate warming on the range expansion of the winter pine processionary moth (PPM), Thaumetopoea pityocampa (Denis and Schiffermüller) (Lepidoptera, Notodontidae) was also deeply explored by researchers [8,15]. In the last decades, an expansion of the PPM outbreak area occurred, both latitudinally and altitudinally in south-central Portugal, in southern Spain, in north-central France, and in the mountainous regions of northern Italy, as fully documented [5,6,15,16]. Specifically, the front has shifted by 27.1 km decade-1 between 1972 and 2004 and has accelerated during the last 10 years (55.6 km decade-1) [5]. More recently, field records of stand defoliation by PPM and tree-ring reconstructions of outbreaks did not support an upward shift but allowed detecting a positive link between PPM defoliations and the winter North Atlantic Oscillation in eastern Spain [17].
Insect species that are active during winter are particularly suitable for studying the effects of increased temperature [18], and PPM provides a classic example of an insect that is active in the winter at the larval stage. This pest is a univoltine oligophagous insect pest on coniferous trees, and the genus Pinus represents its main host. The life cycle of this defoliator is dependent on temperature [19], and water stress [19]. Huchon and Démolin [20] stated that the distribution of the PPM is limited by a combination of two climatic variables: the mean minimum temperature in January and the cumulative hours of annual sunshine. Additionally, Battisti et al. [5] found that microclimatic conditions (daily temperature inside the nest and night air temperature) could also impair the distribution of the PPM by governing the feeding activity of the larvae during the cold period. Moreover, Buffo et al. [7] determined a feeding threshold that explains the survival of colonies depending on the number of feeding hours during the cold period.
The consequences of higher frequency of extreme events are still poorly documented. For example, the summer heat waves in 2003 led to a record annual expansion of the PPM in the Italian Alps but also resulted in a collapse of the front edge population in France [3], as indicated also by Robinet et al. [21] and Toïgo et al. [22]. In any case the consequences of climate change may be drastic, as the potentially enhanced performance and range expansion of the PPM will have environmental and economic impact but also further constrain the recreational value of forests due to the urticating larval hairs causing contact dermatitis and other allergic reactions in humans and other mammals [4].
In the current study, surveys were carried out in the five-year period 2016–2020 in Aosta Valley (NW Italy). Data about the presence of nests and the environmental parameters (altitude, cumulative rain, and cumulative degree-days) were recorded and their role in affecting the PPM flight was investigated.

2. Materials and Methods
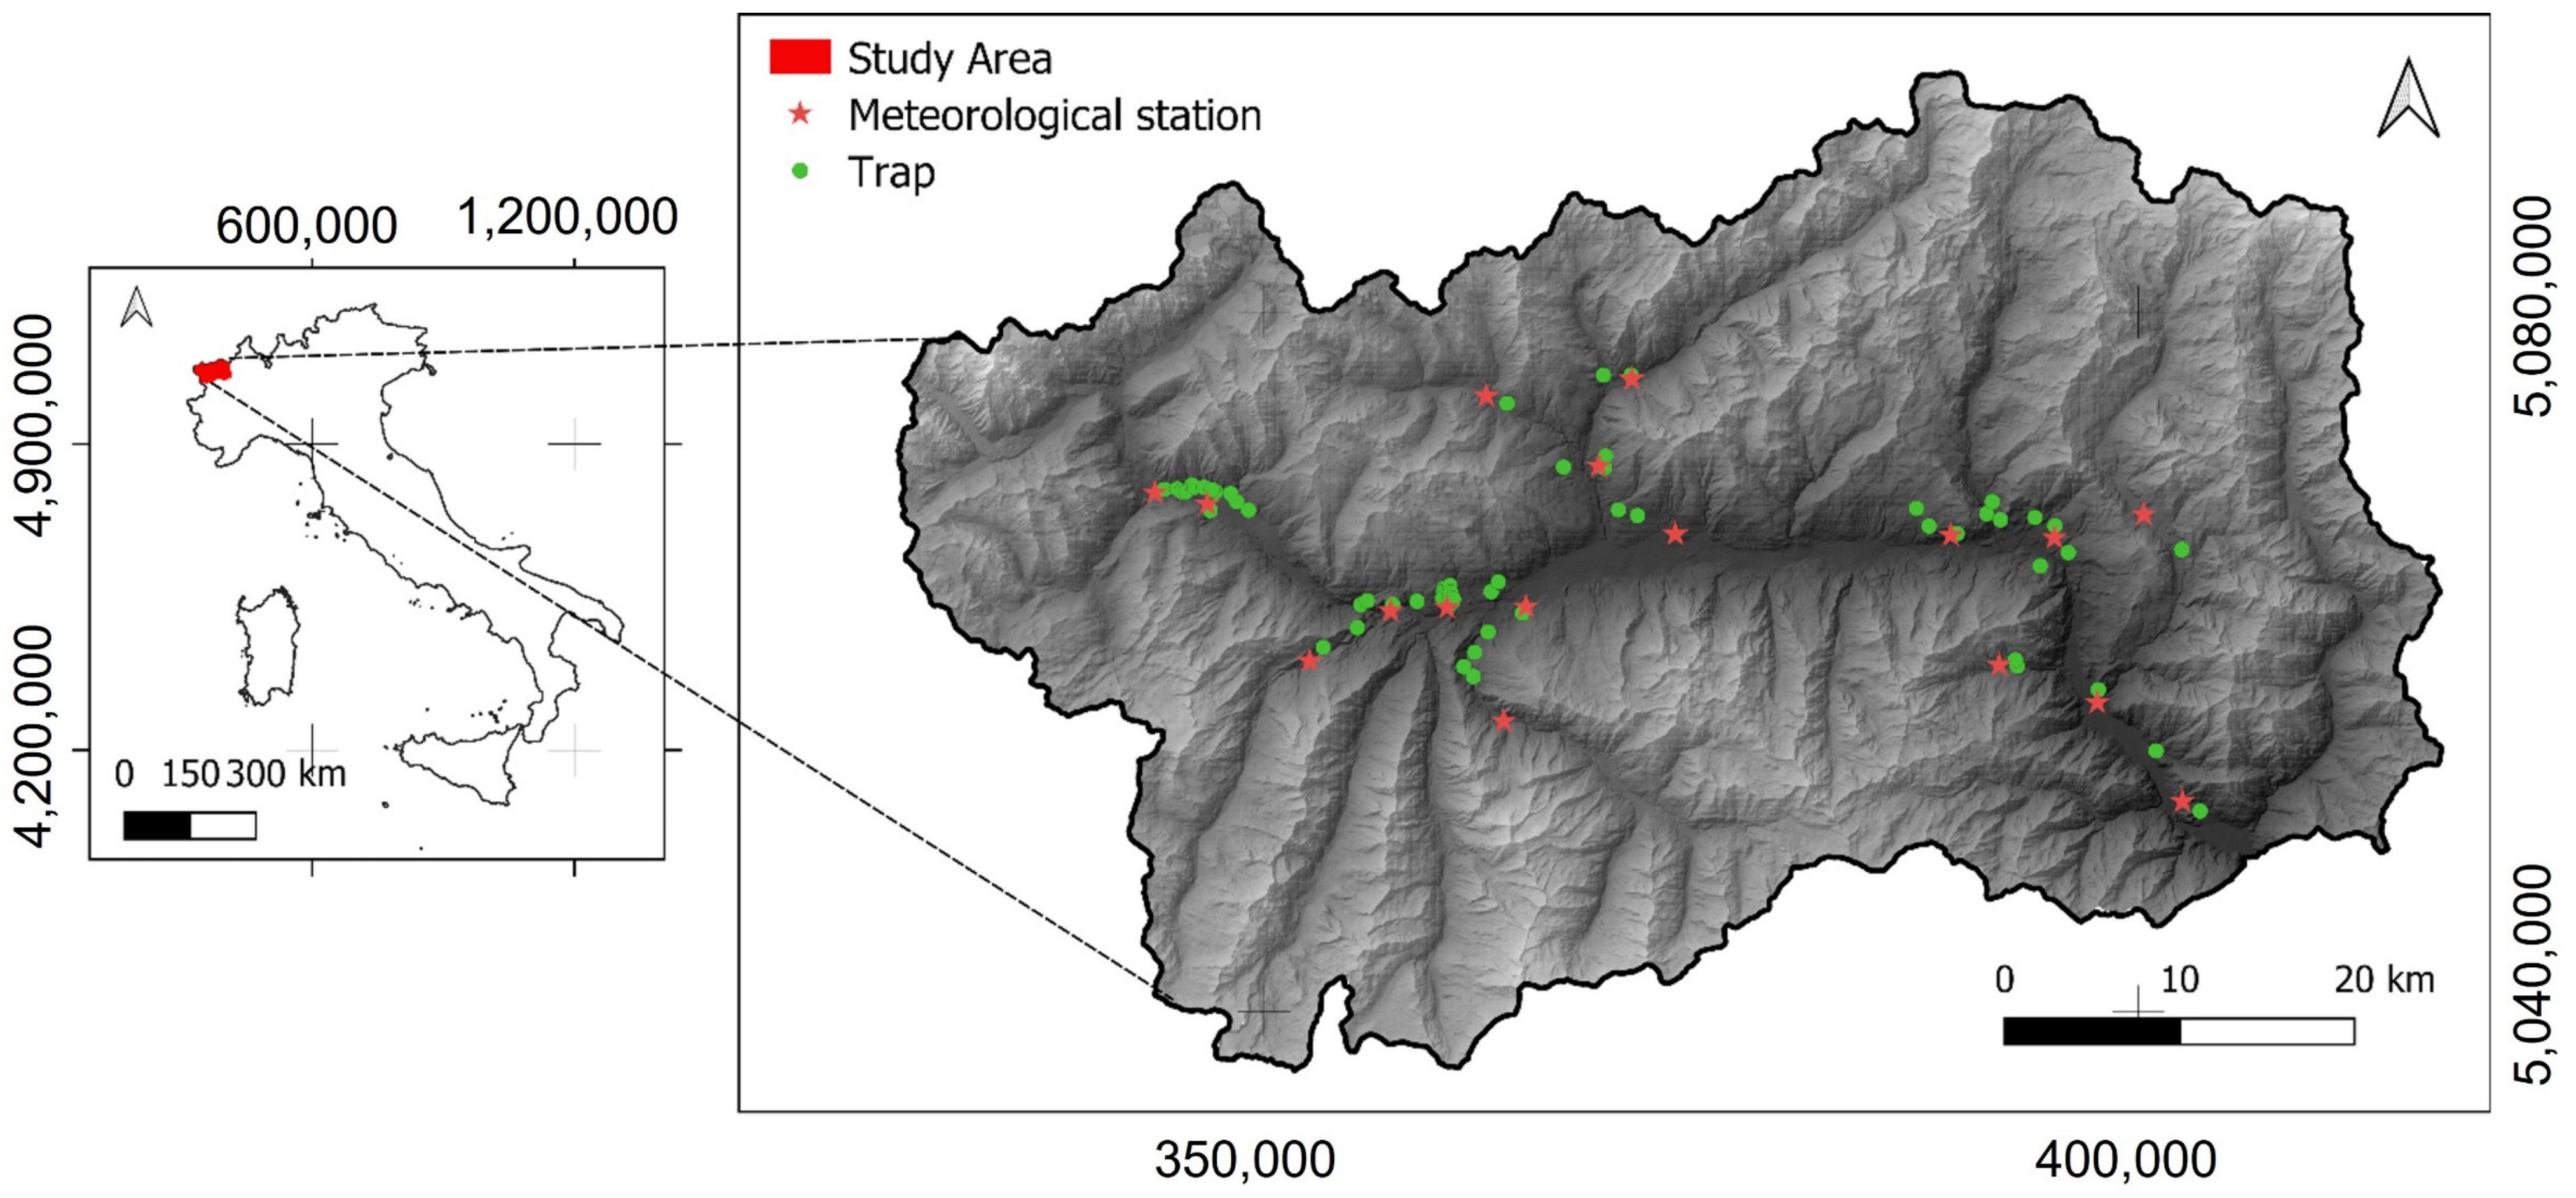
2.1. Study Area

Aosta Valley is the smallest Italian region located in the north-western part of Italy and the total surface area extends to around 3262 km2. The prevalence of territory is mountainous, and the average altitude is 2100 m; only 20 % of the surface is below 1500 m; in fact, the region is characterized by abrupt environmental gradients.
The main valley axis is predominantly west-east oriented, characterized by an Alpine environment and a semi-continental climate. Almost a quarter of the total surface is covered by forests and the tree vegetation consists of Larix decidua Miller, Picea abies L. Karst, mixed stands of Scots pine (Pinus sylvestris), Austrian black pine (Pinus nigra) and Mountain pine (Pinus uncinata Ram.), and Quercus pubescens Will., with the sporadic presence of Populus tremula L. and Betula pendula Roth.

2.2. Seasonal Flight Activity of the Pine Processionary Moth

Overall, the sites under investigation were located in 42 municipalities. One ha plot was selected in each municipality, positioning six traps in each plot.
PPM males were monitored from 2016 to 2020 using commercial funnel traps baited with sex pheromone component (Z)-13-hexadecen-11-ynyl acetate (loading rate: 1 mg per dispenser) (Super Green, Serbios s.r.l., Badia Polesine, RO, Italy). All trap devices were placed randomly on the trunks of P. sylvestris stands at a height of 2 m. All traps were georeferenced. To detect the flight period, traps were inspected weekly from early June until mid-September, and the number of collected adults was recorded. After each inspection, trapped insects were removed from the traps by forestry technicians from the “Corpo Forestale della Valle d’Aosta” (CFVdA). The pheromone lure was replaced every six weeks and the devices were weekly rotated clockwise to minimize the influence of the individual trapping location, according to Ferracini et al. [23]. For data analysis, only field sites located close to meteorological stations (see Section 2.4 “Meteorological data” ) were considered. For each year, we only considered traps that captured 10 or more adults during the entire season. The distance between traps and meteorological stations was measured in a QGIS environment having both GPS coordinates.

2.3. Infestation Index

The infestation index was recorded over a five-year period (2016–2020) during the winter season (January-February). A 1 ha plot was selected in each municipality and all plots were characterized by the presence of homogeneous P. sylvestris stands with an average tree age of about 60 years and a density of approximately 300 trees/ha. Each tree was visually inspected by eye or with binoculars when necessary. The infestation index was recorded by counting the number of nests per tree. Six classes were defined: 0, no nest; 1, very low ≤ 0.1 nests per plant; 2, low = scattered nests, 0.2–0.5 nests per plant; 3, medium = 0.6–2 nests per plant; 4, high = 3–5 nests per plant; 5, very high ≥ 5 nests per plant in accordance with Ferracini et al. [23].

2.4. Meteorological Data

The meteorological data, temperature, and rain were automatically collected from the CFVdA meteorological stations over a five-year period (2016–2020). The total number of meteorological stations are 94, homogeneously distributed in the regional area. Each station is georeferenced and quoted (meters above the sea level). Mean daily temperature (average of measures recorded every 10 min) and cumulated daily rainfall are the main climatic parameters that we used. Only meteorological stations having a complete set of annual data were considered.

2.5. Data Collection and Statistical Analysis

Of the total 277 traps placed for monitoring, only 63 (in 2016) and 75 (for each year from 2017 to 2020) were selected, for a total of 363 traps in the five-year period (2016–2020). We only analyzed traps for which data from meteorological stations were available within a maximum distance of 3.5 km and a maximum difference in altitude of about ± 250 m (Figure 1).
More than 50% of traps have been repeated over the years. Adult presence was evaluated as the maximum number of captured individuals in a day, total captures during the season, the Julian day at max captures, or at first or last captures. Biological parameters include the presence of nests from the previous year (Intensity). Environmental parameters include the altitude (meter above the sea level) of the traps, the cumulative rain (mm), and the cumulative degree days (baseline threshold 9 °C) from the 1st of January of a given year until the peak of captures or until the end of May. All variables were log + 1 transformed before analysis. Spearman correlations were originally calculated between presence of pine processionary moth adults and biological and environmental data (results not shown). Because of correlation between some environmental and biological parameters, we have summarized them using principal component analysis (PCA) [24]. Principal components of the PCA can then be used as explanatory variables in regression models [24]. Among the different components, we have focused on the first two dimensions, PC1 and PC2 which collectively explained the higher variability of the data [25]. Values for PC1 and PC2 were extracted for all sampling sites. Data inspection revealed a possible nonlinear relationship of the sampling year with captures of T. pityocampa, making the use of linear model unsuitable [26]. Hence, the effects of sampling year, PC1 and PC2 were evaluated within Generalized Additive Mixed Models (GAMM) and adopting Gaussian distribution, similarly to Zhang et al. [27]. A smooth term was included for the sampling years and was adjusted using cubic regression splines, estimated via restricted maximum likelihood estimator [26]. The amount of smoothing was automatically adjusted during model fitting. The identity of each meteorological station was included as a random term in the model. Its inclusion was always justified according to the Likelihood Ratio Test (LRT) [28]. Possible multicollinearity of variables was assessed using the variance inflation factor and revealed low (Supplementary Table S1) [29]. Residual plot was evaluated for each of the best fitted models. Data were analyzed using “caret,” “nlme” [28], “performance,” and “mgcv” in R (version 4.2.2 of 31 October 2022) [29,30,31,32,33].

3. Results

PCA results allowed the summarization of two principal components, which represented a cumulative 72.23% of the total variance (Table 1). Temperatures were highly and positively related to both PC1 and PC2. Altitude was negatively correlated to PC1 and PC2. The intensity of attacks was negatively related to PC1. Rains were high and related negatively to PC1 but positively to PC2.
The GAMM model for maximum daily capture showed no effect of PC1 but a positive effect of PC2 (Table 2). Additionally, captures significantly varied across the years with a decreasing pattern (Figure 2A). The model for total capture showed no effect of PC1 or PC2 (albeit at p = 0.099) and a decreasing pattern across the year (Figure 2B). Both PC1 and PC2 had a positive effect on delaying the day at maximum captures. These were also very variable across years (Figure 2C) with peaks in 2016 and 2019, where maximum captures were presumably detected later in the year. A similar pattern was noticed for day at first captures (Figure 2D). Concerning day at last captures, earliest captures were detected in 2018 and 2019 (Figure 2E). No effect of PC1 was observed on the day at first captures and day at last captures. There was a positive effect of PC2 on day at last capture.

4. Discussion

During the last decades, climate change has been demonstrated to have important consequences for forest pest outbreaks, population dynamics of several species, and even for beneficial and pollinator insects [3,34,35]. This is the case for the PPM, which has been documented to cause increasing defoliation and decline of P. sylvestris and P. nigra stands, especially in Mediterranean coniferous and mixed forests [7,16,36].
Abiotic variables (e.g., temperature, precipitation, wind, CO2, O3, fire, drought, etc.) may affect the range expansion of pests. Generally, warmer temperatures have a positive direct effect on populations of herbivorous insects (by increasing the survival and the number of generations) [37]. Specifically, for the PPM, both positive and negative effects of climate on expansion and population dynamics were reported. The summer heat waves that were recorded in 2003 led in fact to the collapse of the PPM population in France but, at the same time, triggered a record annual expansion in the Italian Alps [6,9].
The summer air temperature is known to influence positively the flight activity of the insect and indeed is a limiting factor that promotes male dispersal [6,38,39]. For example, in NE Italy, warm summer temperatures positively affected PPM population growth rate [40]. Our analysis revealed that some variables contribute to affecting the PPM population dynamics. Knowing the correlation of biological and environmental variables on each of PC1 and PC2 and the corresponding regression coefficients, the interpretation of the contribution of each original variable can be drawn. Increased temperatures seemed also to delay the occurrence of the maximum captures and the last captures. This could possibly be related to an adult strategy aiming at avoiding that offspring would develop under a non-optimal high temperature [20]. In this respect, our results agree with the fact that higher temperatures may be correlated to the late emergence of adults, as reported in France [20]. Moreover, hot days may influence the egg survival and development time [41]. The collapse of egg masses and PPM colonies has been reported as relevant with temperature higher than 32 °C [20]. Other authors suggest instead that the collapse temperature should be around 40 °C [9], and even 42 °C [41].
Similarly, low winter air temperature may cause significant mortality of PPM populations and could determine the range expansion at the margin of species distribution (latitude and altitude) [5,7,20]. Currently, the rise in average winter temperatures, with a reduced number of days with frost, is determining shorter starvation periods, thus improving larval performance and enhancing survival in areas with previously prohibitive climatic conditions [5]. This is a key factor determining the outbreak capacity of PPM, even if the evidence in the literature is diverse and a bit controversial. While over the few years temperature warming has been associated with expansion in both latitude and elevation [5], more recently a negative influence on the PPM population growth rate was related to mild winter and high autumnal rainfall, as well [40]. Furthermore, no clear effect of low temperature on the PPM population dynamics was also observed at the regional scale [40]. This was also confirmed by Pimentel et al. [16], which explain how lower night temperatures (in a core of tolerance of the PPM range) give a positive effect on larval growth. This is because the low temperature was associated with a clear sky during the daytime and radiation is a very important factor for food digestion [5,42].
Concerning altitude, we noticed that its increase led to lower peak of captures. Additionally, higher altitudes accelerated the occurrence of the peak of captures (i.e., the higher the altitude, the earlier the peak) and delayed the last captures. This aspect was also reported in previous investigations conducted in France where higher altitudes and northern latitudes were related to an earlier emergence of the population [20]. Similar behavior was also recorded in the Aspromonte National Park in southern Italy [38].
The impact of rain has a variable effect. Similarly to temperatures, our results suggest that rainfalls have a positive effect on the peak of captures. Notwithstanding, high rains delay the peak of captures. Indeed, spring rainfall has been demonstrated to positively affect PPM population in NE Italy [40], and rainfall during this period probably has an indirect effect in limiting larval-pupal parasitoids [43], while elevated humidity in summer may reduce flight activity of moths [19]. Furthermore, Bonsignore and Manti [38], reported that summer precipitation brings a negative effect on flight captures and this effect is particularly pronounced for traps located at high altitudes. At the same time, winter and spring rainfall may increase the soil moisture, thus promoting a delay in the emergence of moths [44] and favoring the pathogens’ development inside the winter nest [5]. Abundant autumnal rainfall seems to have a negative effect on population growth [40], probably because rain hinders larval movement [16] or because high humidity may promote pathogenic infections [45].
Considering the intensity of the attack, measured as the presence of winter nests, our data highlighted a small but positive effect on the peak of captures. This is in agreement with a previous study by Jactel et al. [8] which found positive correlations between the number of winter nests and the number of males caught in pheromone traps in pine stands located in Portugal, Italy, and France. The relationship between captures and the intensity of the attack was not always evident in previous investigations [46,47,48], possibly due to a low efficacy of the sex pheromone lure that was commonly used in traps [8].
Our study showed that the analyzed variables contribute to driving and affecting the PPM population dynamics. However, a year-to-year variation in PPM populations was also evident and followed a non-linear pattern. Total captures and peak of captures were higher in 2016–2017 and then decreased until 2020. It is indeed possible that a part of the immature population undergoes extended diapause, hence fewer adults emerged in that specific year. Natural enemies (e.g., predators, parasitoids, insectivorous birds), can also contribute to reduce adult moth population and would deserve further investigations [49]. The day at maximum captures and day at first captures exhibited small, albeit significant, variations from year to year. The day at last captures were slightly delayed in 2016 and anticipated in 2018 and 2019. The length of the emergence period may permit characterization of the stage of the PPM life cycle (i.e., increasing or decreasing population stage) [50]. However, the small variations in first and last captures across years and the decreasing pattern in number of seasonal captures suggest that the 5-year period under investigation is covering the declining population of PPM in Aosta Valley. Analysis of a longer time frame would surely help defining positive vs. negative gradation phases of PPM populations. For instance, a recent analysis of 42 years in France revealed three mean peaks of PPM activity [51].
Monitoring programs are a basic step to record the seasonal flight activity and to manage forest defoliators. In addition to conventional time-consuming field surveys, satellite-based images may be a useful tool for detecting defoliations in forest systems. In recent years, there have been several studies using unmanned aerial vehicles (UAV)-acquired images, proving to be effective for forestry applications [52,53]. In the case of PPM infestations, this technology may be a useful tool to estimate the infestation severity, even if the number of nests captured by UAV images may be potentially underestimated if some nests on lower branches or in dense stands are not counted.
In particular, reliable population density estimates are highly required for effective control programs. In the survey area, the effectiveness of control strategies (mating disruption, and microbial treatments with Bacillus thuringiensis aerial applications) have been previously evaluated [23]. Moreover, other techniques such as destruction of winter nests made by specially trained employees, trunk injections, trunk barrier and adhesive barrier trap devices, and new formulations of mating disruption using biodegradable shootable balls are still under investigation (CF, unpublished data). Protection of stands requires regular application of pest control measures. In addition to health issues, intense defoliation negatively affects height and radial tree growth, increasing the mortality rate of samplings and reducing the reproduction capacity of trees. At the same time, PPM can trigger a decrease in tree resistance and resilience against other disturbances such as forest fires, drought, and/or other pests [54]. In the northwestern Alps a severe resurgence of bark beetles, namely the European spruce bark beetle, Ips typographus L., and the great spruce bark beetle, Dendroctonus micans (Kugelann), has been recently observed (CF, personal observation).

5. Conclusions

Overall, the current study provides evidence for a better understanding of the climatic factors affecting PPM population dynamics in Aosta Valley region. In particular, we highlighted how the abiotic variables such as temperature, rain, altitude, and population density may act, separately or synergically, influencing positively or negatively the insect biology.
Because of the future climatic scenario, it is increasingly important to control this insect and its populations. Further investigations are needed in relation to the cyclicity in PPM population dynamics, as well. Li et al. [55] reported that in most French regions, outbreaks occur on a regular temporal pattern with peak defoliations every 7–11 years on average. In our survey area, even if PPM has been monitored since the 1930s, the fluctuations have never been regularly assessed. Due to the environmental and sanitary importance of the PPM, all the data collected will be useful to develop predictive risk models to monitor the potential expansion of this pest, and to deploy countermeasures in a timely, efficient, and effective manner.

Supplementary Materials

The following supporting information can be downloaded at: https://www.mdpi.com/article/10.3390/f14010031/s1, Table S1: Variance inflation factor for the different covariates retained in generalized additive mixed-effect models for maximum capture, total capture, day at maximum capture, day at first capture, and day at last capture models (Table 2).

Author Contributions

Conceptualization, C.F. and V.S.; methodology, C.F., G.R., I.R. and V.S.; formal analysis, G.R. and V.S.; data curation, G.R. and V.S.; writing-original draft preparation, C.F. and V.S.; writing—review and editing, C.F., G.R., I.R. and V.S.; project administration, C.F. and I.R. All authors contributed to the writing of the manuscript and approved the final version. All authors have read and agreed to the published version of the manuscript.

Funding

This paper was funded by the “MONGEFITOFOR” Project Interreg Cooperation Program Va ITA-CH 2014/2020.

Institutional Review Board Statement

All the insect rearings and experiments were conducted in accordance with the legislation and guidelines of the European Union for the protection of animals used for scientific purposes (http://ec.europa.eu/environment/chemicals/lab_animals/legislation_en.htm (accessed on 30 November 2022). All experimental protocols using insects were approved by the ad hoc Committee of DISAFA of the University of Torino.

Informed Consent Statement

Not applicable.

Data Availability Statement

The data presented in this study are available on request from the corresponding author.

Acknowledgments

The authors would like to thank all the forestry technicians of “Corpo Forestale della Valle d’Aosta” (CFVdA), the phytosanitary service of Aosta Valley for performing the field activity, Filippo Sarvia for the support given in the creation of the map in the GIS environment, and Monica Vercelli for technical support.

Conflicts of Interest

The authors declare no conflict of interest.

References

  1. United Nations Kyoto Protocol—Targets for the First Commitment Period. Available online: http://unfccc.int/kyoto_protocol/items/2830.php (accessed on 15 November 2022).
  2. Malamel, J. Seasonal dynamics on spider population in Pathiramanal island, Kerala, India: A case study. In Arthropods: Are They Beneficial for Mankind? Ranz, R.E.R., Ed.; IntechOpen: London, UK, 2021; p. 55. [Google Scholar]
  3. Pureswaran, D.S.; Roques, A.; Battisti, A. Forest insects and climate change. Curr. For. Rep. 2018, 4, 35–50. [Google Scholar] [CrossRef] [Green Version]
  4. Netherer, S.; Schopf, A. Potential effects of climate change on insect herbivores in European forests—General aspects and the pine processionary moth as specific example. For. Ecol. Manag. 2010, 259, 831–838. [Google Scholar] [CrossRef]
  5. Battisti, A.; Stastny, M.; Netherer, S.; Robinet, C.; Schopf, A.; Roques, A.; Larsson, S. Expansion of geographic range in the pine processionary moth caused by increased winter temperatures. Ecol. Appl. 2005, 15, 2084–2096. [Google Scholar] [CrossRef]
  6. Battisti, A.; Stastny, M.; Buffo, E.; Larsson, S. A rapid altitudinal range expansion in the pine processionary moth produced by the 2003 climatic anomaly. Glob. Chang. Biol. 2006, 12, 662–671. [Google Scholar] [CrossRef]
  7. Buffo, E.; Battisti, A.; Stastny, M.; Larsson, S. Temperature as a predictor of survival of the pine processionary moth in the Italian Alps. Agric. For. Entomol. 2007, 9, 65–72. [Google Scholar] [CrossRef]
  8. Jactel, H.; Menassieu, P.; Vétillard, F.; Barthélémy, B.; Piou, D.; Frérot, B.; Rousselet, J.; Goussard, F.; Branco, M.; Battisti, A. Population monitoring of the pine processionary moth (Lepidoptera: Thaumetopoeidae) with pheromone-baited traps. For. Ecol. Manag. 2006, 235, 96–106. [Google Scholar] [CrossRef]
  9. Robinet, C.; Rousselet, J.; Roques, A. Potential spread of the pine processionary moth in France: Preliminary results from a simulation model and future challenges. Ann. For. Sci. 2014, 71, 149–160. [Google Scholar] [CrossRef] [Green Version]
  10. Ferracini, C.; Pogolotti, C.; Alma, A. A mismatch in the emergence of Torymus sinensis may affect the effectiveness of this biocontrol agent? Biol. Control 2022, 174, 105029. [Google Scholar] [CrossRef]
  11. Forrest, J. Complex responses of insect phenology to climate change. Curr. Opin. Insect Sci. 2016, 17, 49–54. [Google Scholar] [CrossRef]
  12. Gordo, O.; Sanz, J.J. Phenology and climate change: A long-term study in a Mediterranean locality. Oecologia 2005, 146, 484–495. [Google Scholar] [CrossRef]
  13. Bryant, S.R.; Thomas, C.D.; Bale, J.S. Thermal ecology of gregarious and solitary nettle-feeding nymphalid butterfly larvae. Oecologia 2000, 122, 1–10. [Google Scholar] [CrossRef]
  14. Roy, D.B.; Sparks, T.H. Phenology of British butterflies and climate change. Glob. Chang. Biol. 2000, 6, 407–416. [Google Scholar] [CrossRef]
  15. Robinet, C.; Baier, P.; Pennerstorfer, J.; Schopf, A.; Roques, A. Modelling the effects of climate change on the potential feeding activity of Thaumetopoea pityocampa (Den. & Schiff.) (Lep., Notodontidae) in France. Glob. Ecol. Biogeogr. 2007, 16, 460–471. [Google Scholar] [CrossRef]
  16. Pimentel, C.; Calvão, T.; Ayres, M. Impact of climatic variation on populations of pine processionary moth Thaumetopoea pityocampa in a core area of its distribution. Agric. For. Entomol. 2011, 13, 273–281. [Google Scholar] [CrossRef]
  17. Camarero, J.; Tardif, J.; Gazol, A.; Conciatori, F. Pine processionary moth outbreaks cause longer growth legacies than drought and are linked to the North Atlantic Oscillation. Sci. Total Environ. 2022, 819, 153041. [Google Scholar] [CrossRef]
  18. Leather, S.; Walters, K.; Bale, J. The Ecology of Insect Overwintering; Cambridge University Press: Cambridge, UK, 1995. [Google Scholar]
  19. Arnaldo, P.; Oliveira, I.; Santos, J.; Leite, S. Climate change and forest plagues: The case of the pine. For. Syst. 2011, 20, 508–515. [Google Scholar] [CrossRef] [Green Version]
  20. Huchon, H.; Démolin, G. La bioécologie de la Processionnaire du pin: Dispersion potentielle, dispersion actuelle. Rev. For. Française 1970, 22, 220–234. [Google Scholar] [CrossRef] [Green Version]
  21. Robinet, C.; Rousselet, J.; Pineau, P.; Miard, F.; Roques, A. Are heat waves susceptible to mitigate the expansion of a species progressing with global warming? Ecol. Evol. 2013, 3, 2947–2957. [Google Scholar] [CrossRef]
  22. Toïgo, M.; Barraquand, F.; Barnagaud, J.; Piou, D.; Jactel, H. Geographical variation in climatic drivers of the pine processionary moth population dynamics. For. Ecol. Manag. 2017, 404, 141–155. [Google Scholar] [CrossRef]
  23. Ferracini, C.; Saitta, V.; Pogolotti, C.; Rollet, I.; Vertui, F.; Dovigo, L. Monitoring and management of the pine processionary moth in the north-western Italian Alps. Forests 2020, 11, 1253. [Google Scholar] [CrossRef]
  24. Zuur, A.F.; Ieno, E.N.; Smith, G.M. Analysing Ecological Data; Statistics for Biology and Health; Springer: New York, NY, USA, 2007; Volume 680, ISBN 9780387459677. [Google Scholar]
  25. Haelewaters, D.; Hiller, T.; Ceryngier, P.; Eschen, R.; Gorczak, M.; Houston, M.L.; Kisło, K.; Knapp, M.; Landeka, N.; Pfliegler, W.P.; et al. Do biotic and abiotic factors influence the prevalence of a common parasite of the invasive alien ladybird Harmonia axyridis? Front. Ecol. Evol. 2022, 10, 773423. [Google Scholar] [CrossRef]
  26. Zuur, A.F.; Ieno, E.N.; Walker, N.; Saveliev, A.A.; Smith, G.M. Mixed Effects Models and Extensions in Ecology with R; Statistics for Biology and Health; Springer: New York, NY, USA, 2009; Volume 574, ISBN 9780387874579. [Google Scholar]
  27. Zhang, Y.; Xue, Y.; Xu, B.; Chongliang, Z.; Zhang, C.; Zan, X. Evaluating the effect of input variables on quantifying the spatial distribution of croaker Johnius belangerii in Haizhou Bay, China. J. Oceanol. Limnol. 2021, 39, 1570–1583. [Google Scholar] [CrossRef]
  28. Pinheiro, J.C.; Bates, D.M. Mixed-Effects Models in S and S-PLUS; Springer Science & Business Media: Berlin/Heidelberg, Germany; Springer: New York, NY, USA, 2006; ISBN 9780387989570. [Google Scholar]
  29. James, G.; Witten, D.; Hastie, T.; Tibshirani, R. An Introduction to Statistical Learning: With Applications in R; Springer: New York, NY, USA, 2013; p. 426. [Google Scholar] [CrossRef]
  30. Kuhn, M. Caret: Classification and Regression Training. R Package Version 6.0-93. 2022. Available online: https://CRAN.R-project.org/package=caret (accessed on 15 November 2022).
  31. Lüdecke, D.; Ben-Shachar, M.S.; Patil, I.; Waggoner, P.; Makowski, D. Performance: An R Package for Assessment, Comparison and Testing of Statistical Models. J. Open Source Softw. 2021, 6, 3139. [Google Scholar] [CrossRef]
  32. R Core Team. R: A Language and Environment for Statistical Computing. R Foundation for Statistical Computing. 2022. Available online: https://www.r-project.org/ (accessed on 15 November 2022).
  33. Wood, S.N. Generalized Additive Models: An Introduction with R, 2nd ed.; Chapman and Hall: London, UK; CRC Press: Boca Raton, FL, USA, 2017. [Google Scholar]
  34. Dale, V.H.; Joyce, L.A.; McNulty, S.; Neilson, R.P.; Ayres, M.P.; Flannigan, M.D.; Hanson, P.J.; Irland, L.C.; Lugo, A.E.; Peterson, C.J.; et al. Climate Change and Forest Disturbances: Climate Change Can Affect Forests by Altering the Frequency, Intensity, Duration, and Timing of Fire, Drought, Introduced Species, Insect and Pathogen Outbreaks, Hurricanes, Windstorms, Ice Storms, or Landslides. BioScience 2001, 51, 723–734. [Google Scholar] [CrossRef] [Green Version]
  35. Vercelli, M.; Novelli, S.; Ferrazzi, P.; Lentini, G.; Ferracini, C. A qualitative analysis of beekeepers’ perceptions and farm management adaptations to the impact of climate change on honey bees. Insects 2021, 12, 228. [Google Scholar] [CrossRef]
  36. Mirchev, P.; Georgiev, G.; Tsankov, G. Long-term studies on egg parasitoids of pine processionary moth (Thaumetopoea pityocampa) in a new locality in Bulgaria. J. Entomol. Res. Soc. 2017, 19, 15–25. [Google Scholar]
  37. Sinclair, B.; Addo-Bediako, A.; Chown, S. Climatic variability and the evolution of insect freeze tolerance. Biol. Rev. 2003, 78, 181–195. [Google Scholar] [CrossRef]
  38. Bonsignore, C.P.; Manti, F. Influence of habitat and climate on the capture of male pine processionary moths. Bull. Insectol. 2013, 66, 27–34. [Google Scholar]
  39. Ishiguri, Y.; Shirai, Y. Flight activity of the peach fruit moth, Carposina sasakii (Lepidoptera: Carposinidae), measured by a flight mill. Appl. Entomol. Zool. 2004, 39, 127–131. [Google Scholar] [CrossRef] [Green Version]
  40. Tamburini, G.; Marini, L.; Hellrigl, K.; Salvadori, C.; Battisti, A. Effects of climate and density-dependent factors on population dynamics of the pine processionary moth in the Southern Alps. Clim. Chang. 2013, 121, 701–712. [Google Scholar] [CrossRef]
  41. Rocha, S.; Kerdelhué, C.; Jamaa, M.B.; Dhahri, S.; Burban, C.; Branco, M. Effect of heat waves on embryo mortality in the pine processionary moth. Bull. Entomol. Res. 2017, 107, 583–591. [Google Scholar] [CrossRef]
  42. Démolin, G. Comportement des adultes de Thaumetopoea pityocampa Schiff. Dispersion spatiale, importance écologique. Ann. Sci. For. 1969, 26, 81–102. [Google Scholar] [CrossRef] [Green Version]
  43. Battisti, A.; Bernardi, M.; Ghiraldo, C. Predation by the hoopoe (Upupa epops) on pupae of Thaumetopoea pityocampa and the likely influence on other natural enemies. BioControl 2000, 45, 311–323. [Google Scholar] [CrossRef]
  44. Torres-Muros, L.; Hódar, J.; Zamora, R. Effect of habitat type and soil moisture on pupal stage of a Mediterranean forest pest (Thaumetopoea pityocampa). Agric. For. Entomol. 2017, 19, 130–138. [Google Scholar] [CrossRef]
  45. Weseloh, R.; Andreadis, T.; Onstad, D. Modeling the influence of rainfall and temperature on the phenology of infection of gypsy moth, Lymantria dispar, larvae by the fungus Entomophaga maimaiga. Biol. Control 1993, 3, 311–318. [Google Scholar] [CrossRef]
  46. Baronio, P.; Rocchetta, G.; Baldassarri, N. Una stima delle popolazioni di Thaumetopoea pityocampa (Den. & Schiff.) (Lepidoptera: Thaumetopoeidae) in alcune vallate dell’Appennino forlivese. Boll. Ist. Entomol. Guid. Grandi Univ. Bologna 1994, 48, 11–17. [Google Scholar]
  47. Devkota, B.; Breuer, M.; Schmidt, G.H. Observations on the flight activity of the pine processionary moth Thaumetopoea pityocampa (Den. and Schiff.) in Greece, using synthetic sex-pheromone and light traps (Insecta: Lepidoptera: Thaumetopoeidae). Boll. Zool. Agrar. Bachic. 1992, 24, 147–157. [Google Scholar]
  48. Roversi, P. Observations on the use of traps with the sex pheromone of Thaumetopoea pityocampa (Den. & Schiff.) on the Gargano promontory (Lepidoptera, Thaumetopoeidae). Redia 1985, 68, 1–17. [Google Scholar]
  49. Auger-Rozenberg, M.A.; Barbaro, L.; Battisti, A.; Blache, S.; Charbonnier, Y.; Denux, O.; Garcia, J.; Goussard, F.; Imbert, C.E.; Kerdelhué, C.; et al. Ecological responses of parasitoids, predators and associated insect communities to the climate–driven expansion of the pine processionary moth. In Processionary Moths and Climate Change: An Update; Roques, A., Ed.; Springer: Dordrecht, The Netherlands, 2015; pp. 311–357. ISBN 9789401793407. [Google Scholar]
  50. Masutti, L.; Battisti, A. Thaumetopoea pityocampa (Den. & Schiff.) in Italy Bionomics and perspectives of integrated control. J. Appl. Entomol. 1990, 110, 229–234. [Google Scholar] [CrossRef]
  51. Gazol, A.; Hernández-Alonso, R.; Camarero, J.J. Patterns and drivers of pine processionary moth defoliation in Mediterranean mountain forests. Front. Ecol. Evol. 2019, 7, 458. [Google Scholar] [CrossRef] [Green Version]
  52. Leidemer, T.; Gonroudobou, O.B.H.; Nguyen, H.T.; Ferracini, C.; Burkhard, B.; Diez, Y.; Lopez Caceres, M.L. Classifying the Degree of Bark Beetle-Induced Damage on Fir (Abies mariesii) Forests, from UAV-Acquired RGB Images. Computation 2022, 10, 63. [Google Scholar] [CrossRef]
  53. Otsu, K.; Pla, M.; Vayreda, J.; Brotons, L. Calibrating the severity of forest defoliation by pine processionary moth with Landsat and UAV imagery. Sensors 2018, 18, 3278. [Google Scholar] [CrossRef] [PubMed] [Green Version]
  54. Cardil, A.; Otsu, K.; Pla, M.; Silva, C.A.; Brotons, L. Quantifying pine processionary moth defoliation in a pine-oak mixed forest using unmanned aerial systems and multispectral imagery. PLoS ONE 2019, 14, e0213027. [Google Scholar] [CrossRef] [PubMed] [Green Version]
  55. Li, S.; Daudin, J.J.; Piou, D.; Robinet, C.; Jactel, H. Periodicity and synchrony of pine processionary moth outbreaks in France. For. Ecol. Manag. 2015, 354, 309–317. [Google Scholar] [CrossRef]
Figure 1. Distribution of traps (green) and meteorological stations (red) in Aosta Valley region. The maximum distance of traps from meteorological stations is 3.5 km in length and ± 250 m in elevation. Reference system is WGS84/UTM 32N, EPSG: 32632.
Forests 14 00031 g001
Figure 2. Estimated smoothing curve (solid line) and 95% confidence bands (dashed lines) for year effect in the different models in Table 2 for maximum capture (A), total capture (B), day at max capture (C), day at first capture (D), and day at last capture (E).
Forests 14 00031 g002
Table 1. Correlation between the original variable and the principal component PC1 and PC2 and their relative contribution (%).
Original VariablesCorrelationContribution
PC 1PC 2PC 1PC 2
Altitude−0.48−0.2720.212.1
Intensity of attack−0.270.1311.45.9
Rain at DTmax−0.300.6112.627.9
Rain at May−0.320. 6113.627.8
Temp at DTmax0.500.3021.013.7
Temp at May0.500.2821.112.6
(Percentage of variance explained)40.47%31.76%
Table 2. Results of generalized additive mixed-effect models for maximum capture, total capture, day at maximum capture, day at first capture, and day at last capture.
Maximum captureParametric CoefficientsEstimateSEt-Valuep-Value
(Intercept)6.320.15640.47<0.0001
PC1−0.050.067−0.730.46
PC20.120.0592.120.035
Smooth termEstimated d.f.Reference d.f.F-valuep-value
s(year)2.0246.69<0.0001
AIC = 906.34, ΔAIC (vs. model with no random eff.) = 17.26, LRT = 19.26, p < 0.0001
Total captureParametric coefficientsEstimateSEt-valuep-value
(Intercept)8.080.15352.71<0.0001
PC1−0.050.069−0.760.45
PC20.100.0621.660.099
Smooth termEstimated d.f.Reference d.f.F-valuep-value
s(year)1.7749.16<0.0001
AIC = 955.92, ΔAIC (vs. model with no random eff.) = 8.69, LRT = 10.69, p = 0.0011
Day at maximum captureParametric coefficientsEstimateSEt-valuep-value
(Intercept)7.660.046166.43<0.0001
PC10.090.00713.75<0.0001
PC20.070.00513.20<0.0001
Smooth termEstimated d.f.Reference d.f.F-valuep-value
s(year)3.89473.96<0.0001
AIC = −741.62, ΔAIC (vs. model with no random eff.) = 92.53, LRT = 94.53, p < 0.0001
Day at first captureParametric coefficientsEstimateSEt-valuep-value
(Intercept)7.480.008959.95<0.0001
PC10.0030.0040.780.43
PC20.0010.0050.430.67
Smooth termEstimated d.f.Reference d.f.F-valuep-value
s(year)3.86424.04<0.0001
AIC = −779.21, ΔAIC (vs. model with no random eff.) = 16.27, LRT = 18.27, p < 0.0001
Day at last captureParametric coefficientsEstimateSEt-valuep-value
(Intercept)7.890.0071154.34<0.0001
PC1−0.0030.003−0.980.33
PC20.010.0032.010.046
Smooth termEstimated d.f.Reference d.f.F-valuep-value
s(year)2.88428.44<0.0001
AIC = −875.93, ΔAIC (vs. model with no random eff.) = 22.81, LRT = 24.81, p < 0.0001
Disclaimer/Publisher’s Note: The statements, opinions and data contained in all publications are solely those of the individual author(s) and contributor(s) and not of MDPI and/or the editor(s). MDPI and/or the editor(s) disclaim responsibility for any injury to people or property resulting from any ideas, methods, instructions or products referred to in the content.

