Article

Variation of Cones Production in a Silver Fir (Abies alba Mill.) Clonal Seed Orchard

1
Department of Forest Genetics and Tree Breeding, “Marin Drăcea” National Research-Development Institute in Forestry, 725100 Campulung Moldovenesc, Romania
2
Department of Silviculture, Transilvania University of Brasov, 500123 Brasov, Romania
3
Department of Forest Genetics and Tree Breeding, “Marin Drăcea” “Marin Drăcea” National Research-Development Institute in Forestry, 077190 Bucharest, Romania
*
Author to whom correspondence should be addressed.
Forests 2023, 14(1), 17; https://doi.org/10.3390/f14010017
Submission received: 10 November 2022 / Revised: 19 December 2022 / Accepted: 21 December 2022 / Published: 22 December 2022
(This article belongs to the Section Forest Ecology and Management)

Abstract

:
The current study is the first to describe fertility dynamics in a Silver fir (Abies alba Mill.) seed orchard and among the few reporting related information from a mature seed orchard. The research aim was to evaluate the female cone production in order to provide support to future management measures. Observations were conducted in a clonal seed orchard from the Eastern Carpathians over six years; all the ramets of 44 clones and the zero-inflated data were analyzed with generalized lineal mixed effects models in a Bayesian framework. The results indicated a higher influence of the year and probably of the sensitivity to climate, and less variability between clones, in both the Poisson and zero-inflated components of cones production. The repeatability of mean annual clone production suggests moderate continuity of cone crops in the production rank of individual clones, while the estimates of heritability were under a moderate genetic control. The values of heritability were influenced by the reporting scale (latent vs. original data scale); therefore, caution in the analysis of non-Gaussian data and in comparisons of heritability between seed orchards is required. The variation of the female cone production was higher than expected for a seed orchard, but with marked variation across years, similar to other related indicators, patterns specific to mature, and productive commercial seed orchards. Several management options to be applied in the future were also discussed.

1. Introduction

Seed orchards represent the close link between breeding activity and forestry practice, genetically improved seeds being used to produce seedlings for artificial forest regeneration, and perhaps, are the most widely used production populations [1]. They maintain almost as much genetic diversity as natural populations and represent a qualitative and quantitative improvement in comparison with the seed stands [2]. The main goal of obtaining genetically improved seeds, which is pursued when establishing clonal seed orchards, can be achieved if several essential conditions are met: the isolation of seed orchard from sources of foreign, genetically inferior pollen, equally and simultaneous blooming of clones, and a very low level occurrence of self-pollination [3]. The degree to which the clones pass on their superiority and genetic diversity to the seeds determines how genetically efficient a seed orchard is. Practical experience and many studies since the 1970s indicated that the transfer is limited [4].
Fertility represents the reproductive potential of a clone, quantitatively estimated in plant species by flowers, pollen, fruits, and seeds [5]. Fertility variation plays an important role in breeding and conservation [2] and its understanding is crucial for the management of seed orchards, as well as for predicting gene diversity, particularly in terms of seed production yield [6,7]. Cones and seeds are the primary sources of income; the fertility of female parents might be prioritized over that of male parents, as the latter is more challenging to quantify than that of seeds [2].
Different factors influence the individual fertility variation: age, size, individual genotype, stand condition, and environment [8]. In a seed orchard, the genetic composition of the produced seeds is also shaped by pollen contamination and flowering time synchronization, counts and weights of clones and ramets in spatial pattern, environment, and climate [7]. Climate (temperature and precipitation) plays a complex role and significant year-to-year variation was reported [9,10]. Higher variation of fertility was found in natural and managed stands compared to the clonal averages from seed orchards, in seed orchards of low age and in years of low production, respectively [8]. Many studies highlighted the small number of clones, which account for a large proportion of the seed orchard crop [11,12,13,14,15]. This was dubbed as the 20:80 rule [16], according to which 20% of the parents produce 80% of the seed-cone crop. However, when coupled with observed fertility variations due to the orchard’s developmental stage, with environmental conditions or management practices, a more realistic view would assume that the genetic composition of any orchard’s crop is unique. In estimating the gene diversity of seed orchard crops, the use of multiple fertility-related tools (i.e., variance partitioning of contributing factors and repeatability, assessment of parental balance, and indicators of fertility variation) is advised [17].
In clonal seed orchards, multiple sources of variability contribute to overestimations of fertility: the presence of scale effects, avoidance of variability between ramets within clones and reporting clone values only, and the influence of the annual characteristics (e.g., climate) [7]. The skewed distribution of phenotypes generates differences among the predicted and observed traits, and in genetic parameters (overestimation of heritability) [18]. Tree fertility, as a skewed trait [7], sometimes following a zero-inflated distribution, and requires adequate data treatment [19,20,21]. In tree genetics, the common approach in fertility analysis is data transformation [15,22], but this could lead to known potential issues [23,24]. In other organisms, genetic measures associated to zero-inflated traits were reported (heritability and evolvability) in a Bayesian framework [25,26], which offer some advantages in comparison to the frequentist approaches, such as flexibility, incorporation of uncertainty [27], accurate estimates of variance and genetic parameters, or providing highest posterior density intervals (HPD) for the genetic measures [28].
The Silver fir (Abies alba Mill.) is an important component of the European forests, the most significant in terms of both economic importance and ecological relevance among the various fir species naturally occurring in Europe, and a fundamental species to maintain biodiversity in forest ecosystems [29,30,31]. Due to climate change, it is estimated that the Silver fir geographic spread would decline [32], with the peripheral populations from the eastern limit of its distribution having a great potential to reduce the adverse consequences of climate warming [33,34,35]. In Romania, Silver fir is one of the most important conifer species and occupies 4.3% of forest area [36], secondly ranked after the Norway spruce. The Silver fir range is discontinuous and the maximum area is located in the Romanian Eastern and South-Eastern Carpathians, in pure or mixed stands with spruce and beech. The interest in the culture of Silver fir has increased in recent years, hence the need to supply the Romanian and foreign requests with increasing amounts of seeds. The seed orchards are convenient options to ensure this requirement, but also for the ex situ conservation of valuable gene pools. In Romania, the setting up of the seed orchards dates back to 1958, the first being established in 1961–1962 for Grayish oak (Quercus pedunculiflora K. Koch.). From 375 ha in 1975, the rate of seed orchards establishment increased in 1990 to 1004.2 ha. In Silver fir, the breeding program started in 1972, by identifying valuable regional natural populations and the phenotypic selection of more than 600 plus trees, installed in 11 seed orchards, with a total area of 92.1 ha [37]. Currently, ten Silver fir seed orchard with a total area of 84.9 ha are included in the National Catalog of Basic Materials, from which seven are classified as “provenance seed orchard” (Pc.P) and three as seed orchards with the origin of clones in the same “region of provenances” (PC.R).
Despite the importance of the species, with the exception of some general reports [38], data about the Silver fir seed orchard fertility is lacking. We present in this study an analysis of the female cone production of 44 clones over six years. The objectives of this study were: (i) to estimate the variability of clones cone production in a zero-inflated modeling framework, (ii) to determine the female fertility variations based on multi-and single year observed cones, and (iii) to discuss the practical implications for seeds production and seed orchard management.

2. Materials and Methods

2.1. Silver Fir Clonal Seed Orchard

The studied Silver fir clonal seed orchard is located in the north-eastern part of Romania (47°03′29″ latitude north and 26°26′06″ longitude east, close to Bodeşti, Neamţ county), at an altitude between 479–512 m and is administrated by Gârcina Forest District, Neamț National Forest Administration (RNP-Romsilva). The clonal seed orchard PS-BR-NT81 was installed in 1981, by multiplying via grafting 44 plus trees, selected from natural Silver fir forest stands from four provenance regions (Eastern Carpathians-A2, South-Eastern Carpathians, the external wedge-B2, north of Southern Carpathians-C1 and Banat Mountains, Ţarcu-Poiana Ruscă-D2) (Table 1). The orchard has an area of 5 ha, with a completely random design and a planting scheme of 6 × 6 m. The number of ramets per clone varies from 1 to 32, with an average of 14. Among the methods used to estimate the clonal contribution in seed orchards, Woods [39] mention different approaches to estimate the parental contribution, the simplest being the visual estimation of the number of cones on each ramet before harvest, while the most complex is the estimation of seed viability for each clone. To evaluate the maternal contribution, the visual assessment of cone production was used [39] with the aid of Nikon binoculars. For six years (2013, 2015, 2018, and 2020–2022), the female cone production of all the ramets (100% sampling) in the seed orchard was counted during July–August.

2.2. Data Analysis

2.2.1. Genetic Variation

The genetic variation was estimated by fitting zero-inflated Poisson generalized linear mixed effects models (ZIP GLMM) to both multi- and single-year data. All the models contained the clone identity (n = 44) as random effects, while the multi-year models additionally included the year (n = 6) and the interaction between clone and year. The data included a large number of zeros, and we tested it for the presence of dispersion and excess of zeros [40,41,42,43,44]; the results confirmed the presence of zero-inflation (Supplementary Material S2).
The count of cones Y of the ramet k in the clone j in the year i was modeled using the Poisson distribution:
Yijk ∼ ZIP(λikj, πijk)
The two separates, a linear predictor for the conditional mean and another for the excess of zeros were:
log λ i j k = β 0 + O i + C j + O c j
logit π i j k = log π i j k 1 π i j k = β 0 π + O i π + C j π + O C i j π
In the equations, β0 is the overall fitted mean, Oi is the random effect in the ith observation year (i = 1...6 ∼ NID (0, σ o 2 ), Cj is the random effect in the jth clone (j = 1…44 ∼ NID (0, σ c 2 )), and OCij is the random effect of the interaction between year and clone (NID (0, σ o c 2 )). The single-year models are similar, with the exception of the presences related to the observation year (i.e., Oi and OCij). The models were fitted within a Bayesian framework (package MCMCglmm, version 2.32) [45]. In the Bayesian analysis, the prior influences model results [46] and, for zero-inflated models, there are different reports on the prior influence on the heritability estimates [47,48,49]; our prior analysis is presented in Supplementary Material S3.
Each model was run for 7,505,000 iterations, with the first 5000 iterations discarded (burning) and every 2500 iterations stored (thinning), resulting in size of effective samples larger than 1000 (close to 3000) and autocorrelations <0.1. The overall settings were chosen to ensure the models passing of the Heidelberger and Welch’s convergence diagnostic and the stationarity tests (functions heidel.diag and autocorr.diag of coda package) [50] (Supplementary Material S3).
The results of MCMCglmm are in unobserved latent scale and, for interpretation, the latent scale posterior distributions of the parameters were back-transformed to observed data scale with the package QGglmm (version 0.7.4) [51].
Repeatability of mean clone cones production (i.e., the broad-sense heritability) was analyzed with correlation-based and GLMM-based methods [24]. In multi-year data, we calculated the Pearson product moment and Spearman’s rank correlation coefficients to test stability and relative order across years, respectively [52]. The model based of multi-year repeatability was calculated as:
H 2 = σ c 2 σ c 2 + σ o c 2 o c + σ e 2 o r
In single year analysis, it was:
H 2 = σ c 2 σ c 2 + σ e 2 r
In both the formulas, σ c 2 is the variance between clones, σ o c 2 is the variance of the interaction between clone and year and σ e 2 is the error variance; o, c, r are the numbers of clones, years, and the mean number of ramets per clone, respectively. As the heritability can have values only between 0 and 1 and some of the lower bounds of its 95% credible intervals presented values close to 0, we considered that if the posterior values follow a normal distribution (e.g., mean close to median), then the heritability is not zero.

2.2.2. Female Fertility Variation

The parental balance was assessed by constructing cone yield curves [11], which plot the percentage of clones participating to cone production. The premise of calculating cumulative yield curves or effective population numbers based on cone counts starts from the correspondence between reproductive success (e.g., seed cones count) and reproductive energy (counts of filled seeds per cone) [2]. First, we calculated the cumulative percentage of cone production per clone, then sorted these from high to low, and plotting the cumulative contribution against the proportion of clones [53]. The female fertility was described by the ‘sibling coefficient Ψ′ [17,54]:
Ψ f = N i = 1 N p i 2 = C V f 2 + 1
where N is the number of clones, pi is the proportional contribution of clone i, and CVf is the coefficient of variation of the clonal proportion of cones production. Female fertility variation—along with male fertility variation Ψm and the component of the clone fertility variation Ψ—is an adimensional measure that relates parents to their progeny and expresses the probability that successful gametes, commonly known as “sibs,” would come from the same parent. Its values cannot be below 1; values Ψ = 1 means that the individuals have the same fertility, while Ψ = 2 means a twice chance that two individuals would share a parent, compared to the above equal parental fertility. For seed orchards, Kang et al. [9] suggested that Ψ = 2.
In an idealized population, of which individuals produce the same number of offspring as the real population, the sibling coefficient can be used to calculate the effective number of female parents (Np(f)) [8]:
N p f = N Ψ f = N C V f 2 + 1
The relative effective number of female parents permits comparisons among the census and status number in a seed orchard [8,52]:
N r % = N p f N 100
The genetic diversity [55,56] can be calculated as:
G D = 1 0.5 N p f
All the statistical analyses were conducted in R (version 4.2.1, Vienna, Austria) [57].

3. Results

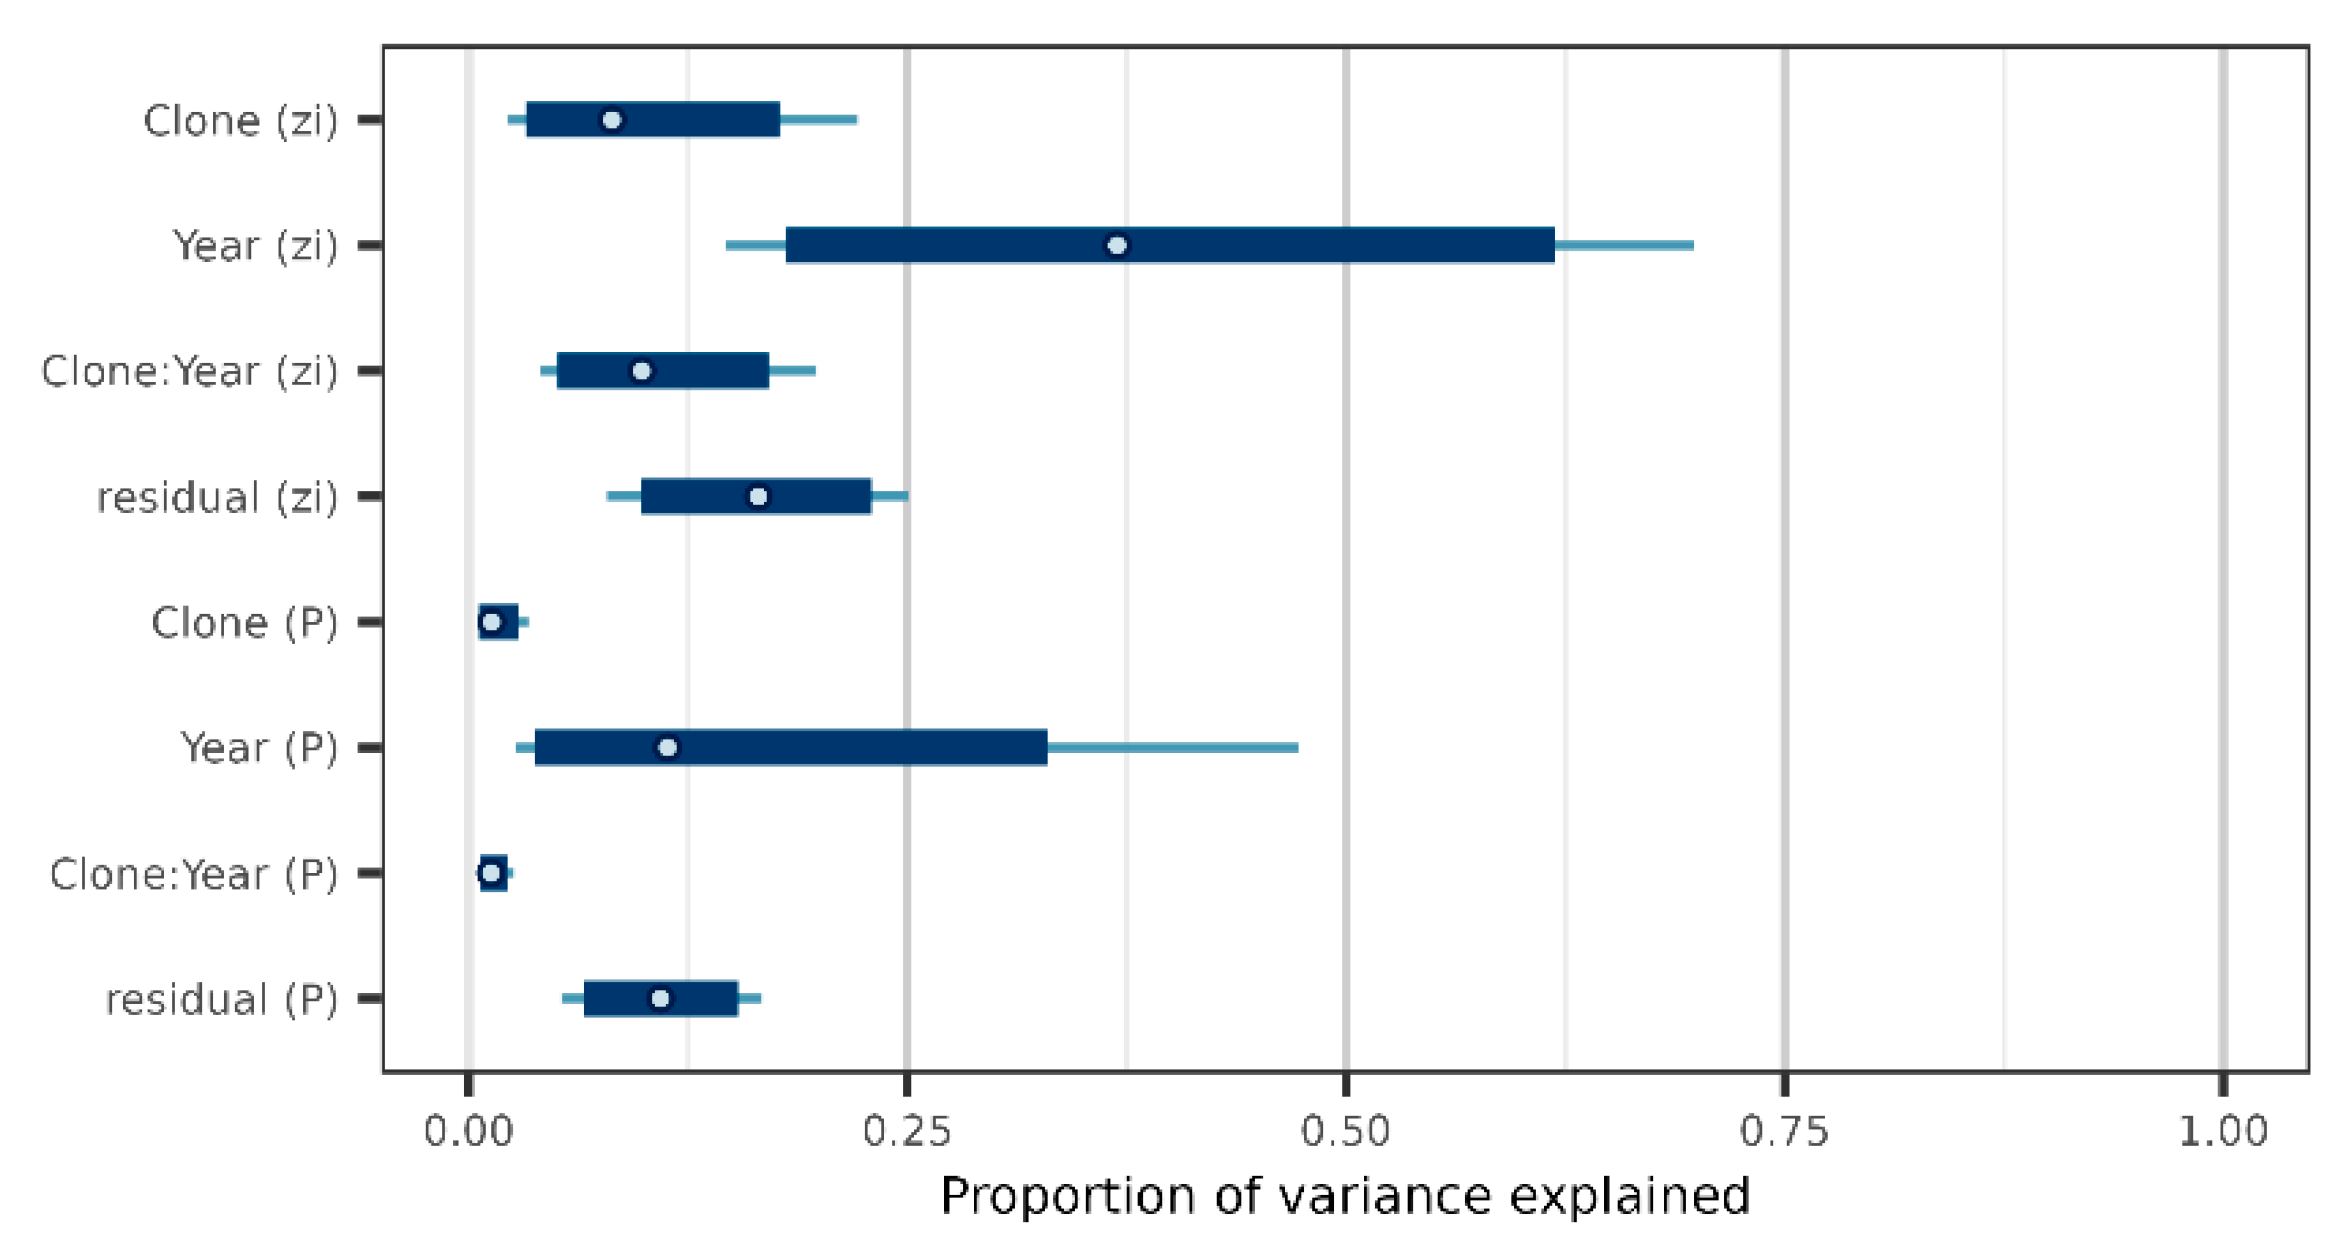
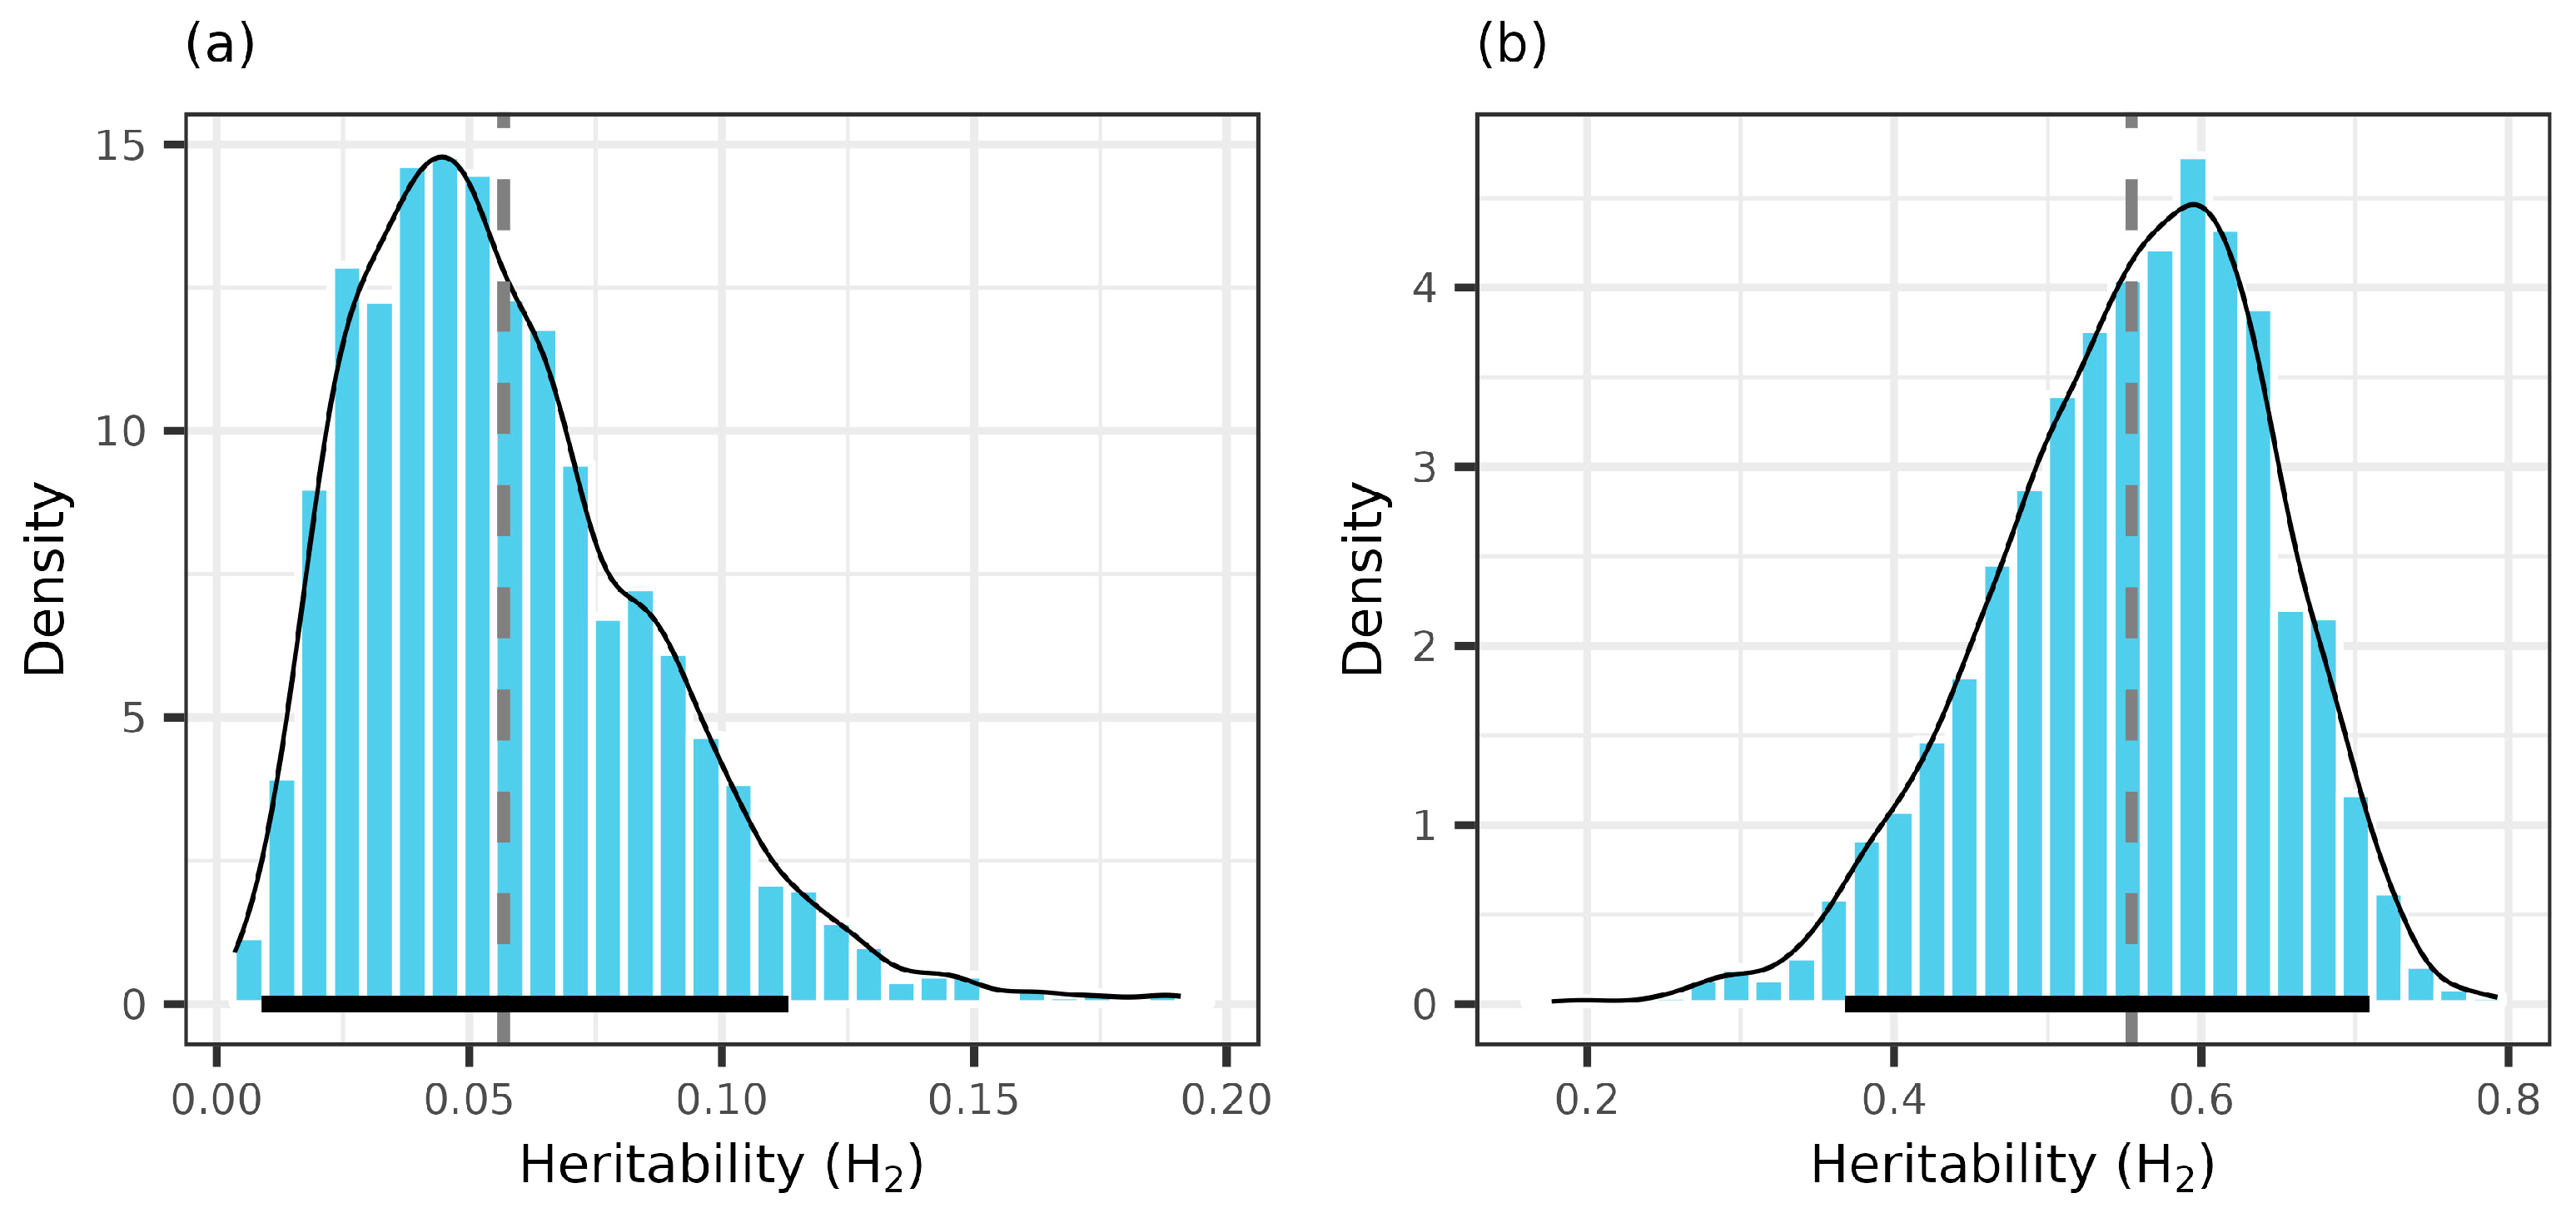
3.1. Genetic Variation

Among the 3811 counted ramets in the observational years between 2013 and 2022, the cone production varied between 0 and 350 (Table 2). Although the number of the ramets remained almost constant, a total of 848 (22.25%) have no cones (i.e., zero fertility, Supplementary Material S2, Figure S2.1). The raw average yearly cone production was 41.10 ± 46.44 SD, with extremes in 2021 (7.12 ± 15.10 SD) and 2018 (79.58 ± 61.41 SD) (Table 2). In pooled clone data, the top values were between 58.00 and 64.64 (clones 182, 176, 173), while the lowermost were between 4.70 and 17.75 (clones 3.18, 168, 3.17) (Supplementary Material S1, Table S1.1).
In the multi-year model of cones production, most of the variance is explained by year, both in the Poisson (13.2%, credible interval -CI hereafter- 3.7–33) and zero-inflated component—(37.9%, CI 18.1–61.9). The clone-related values (clone and clone x year interaction) are small in Poisson (1.4%, CI 0.6–2.8) and 1.3% (CI 0.6–2.1), but increased in the zero-inflated part (8.7%, CI 3.2–17.7 and 10.2%, CI 5.0–17.1) (Figure 1). In single-year models, no clear pattern due to clone was observed, just overall larger values in the zero-inflated part compared with Poisson, and wider 95% posterior intervals (Table 3).
The Pearson product moment correlation coefficients of cone production between the years were positive, significant, and higher between the years of good production, while moderate between others; a remark is on the weak, significant correlation between the ‘good’ and the ‘poor’ years (Table 4). The pattern is similar in Spearman’s rank correlation coefficients. No significance was found in negative correlations (2020–2021 and 2015–2022) and in correlations between a specific year (2022) and any others (Table 4). The results support the continuity of cone crops, especially in production rank of individual clones.
The broad-sense heritability of clonal cone production from pooled data was 0.569, with a large 95% CI (0.369, 0.709) (Figure 2). In the zero-inflated component, the values of heritability were very small (0.043 [0.009, 0.113]), tending to zero in good years (e.g., 2015, 2020), but were normally distributed both in pooled and yearly data and, therefore, were different than zero (Table 3, Supplementary Material S4). Across the monitoring period, the lower heritability value was recorded in the poor production year and tended to be similar in the good years. Marked differences were between the latent scale and data scale heritabilities of the Poisson component of the cone production model (Table 3).

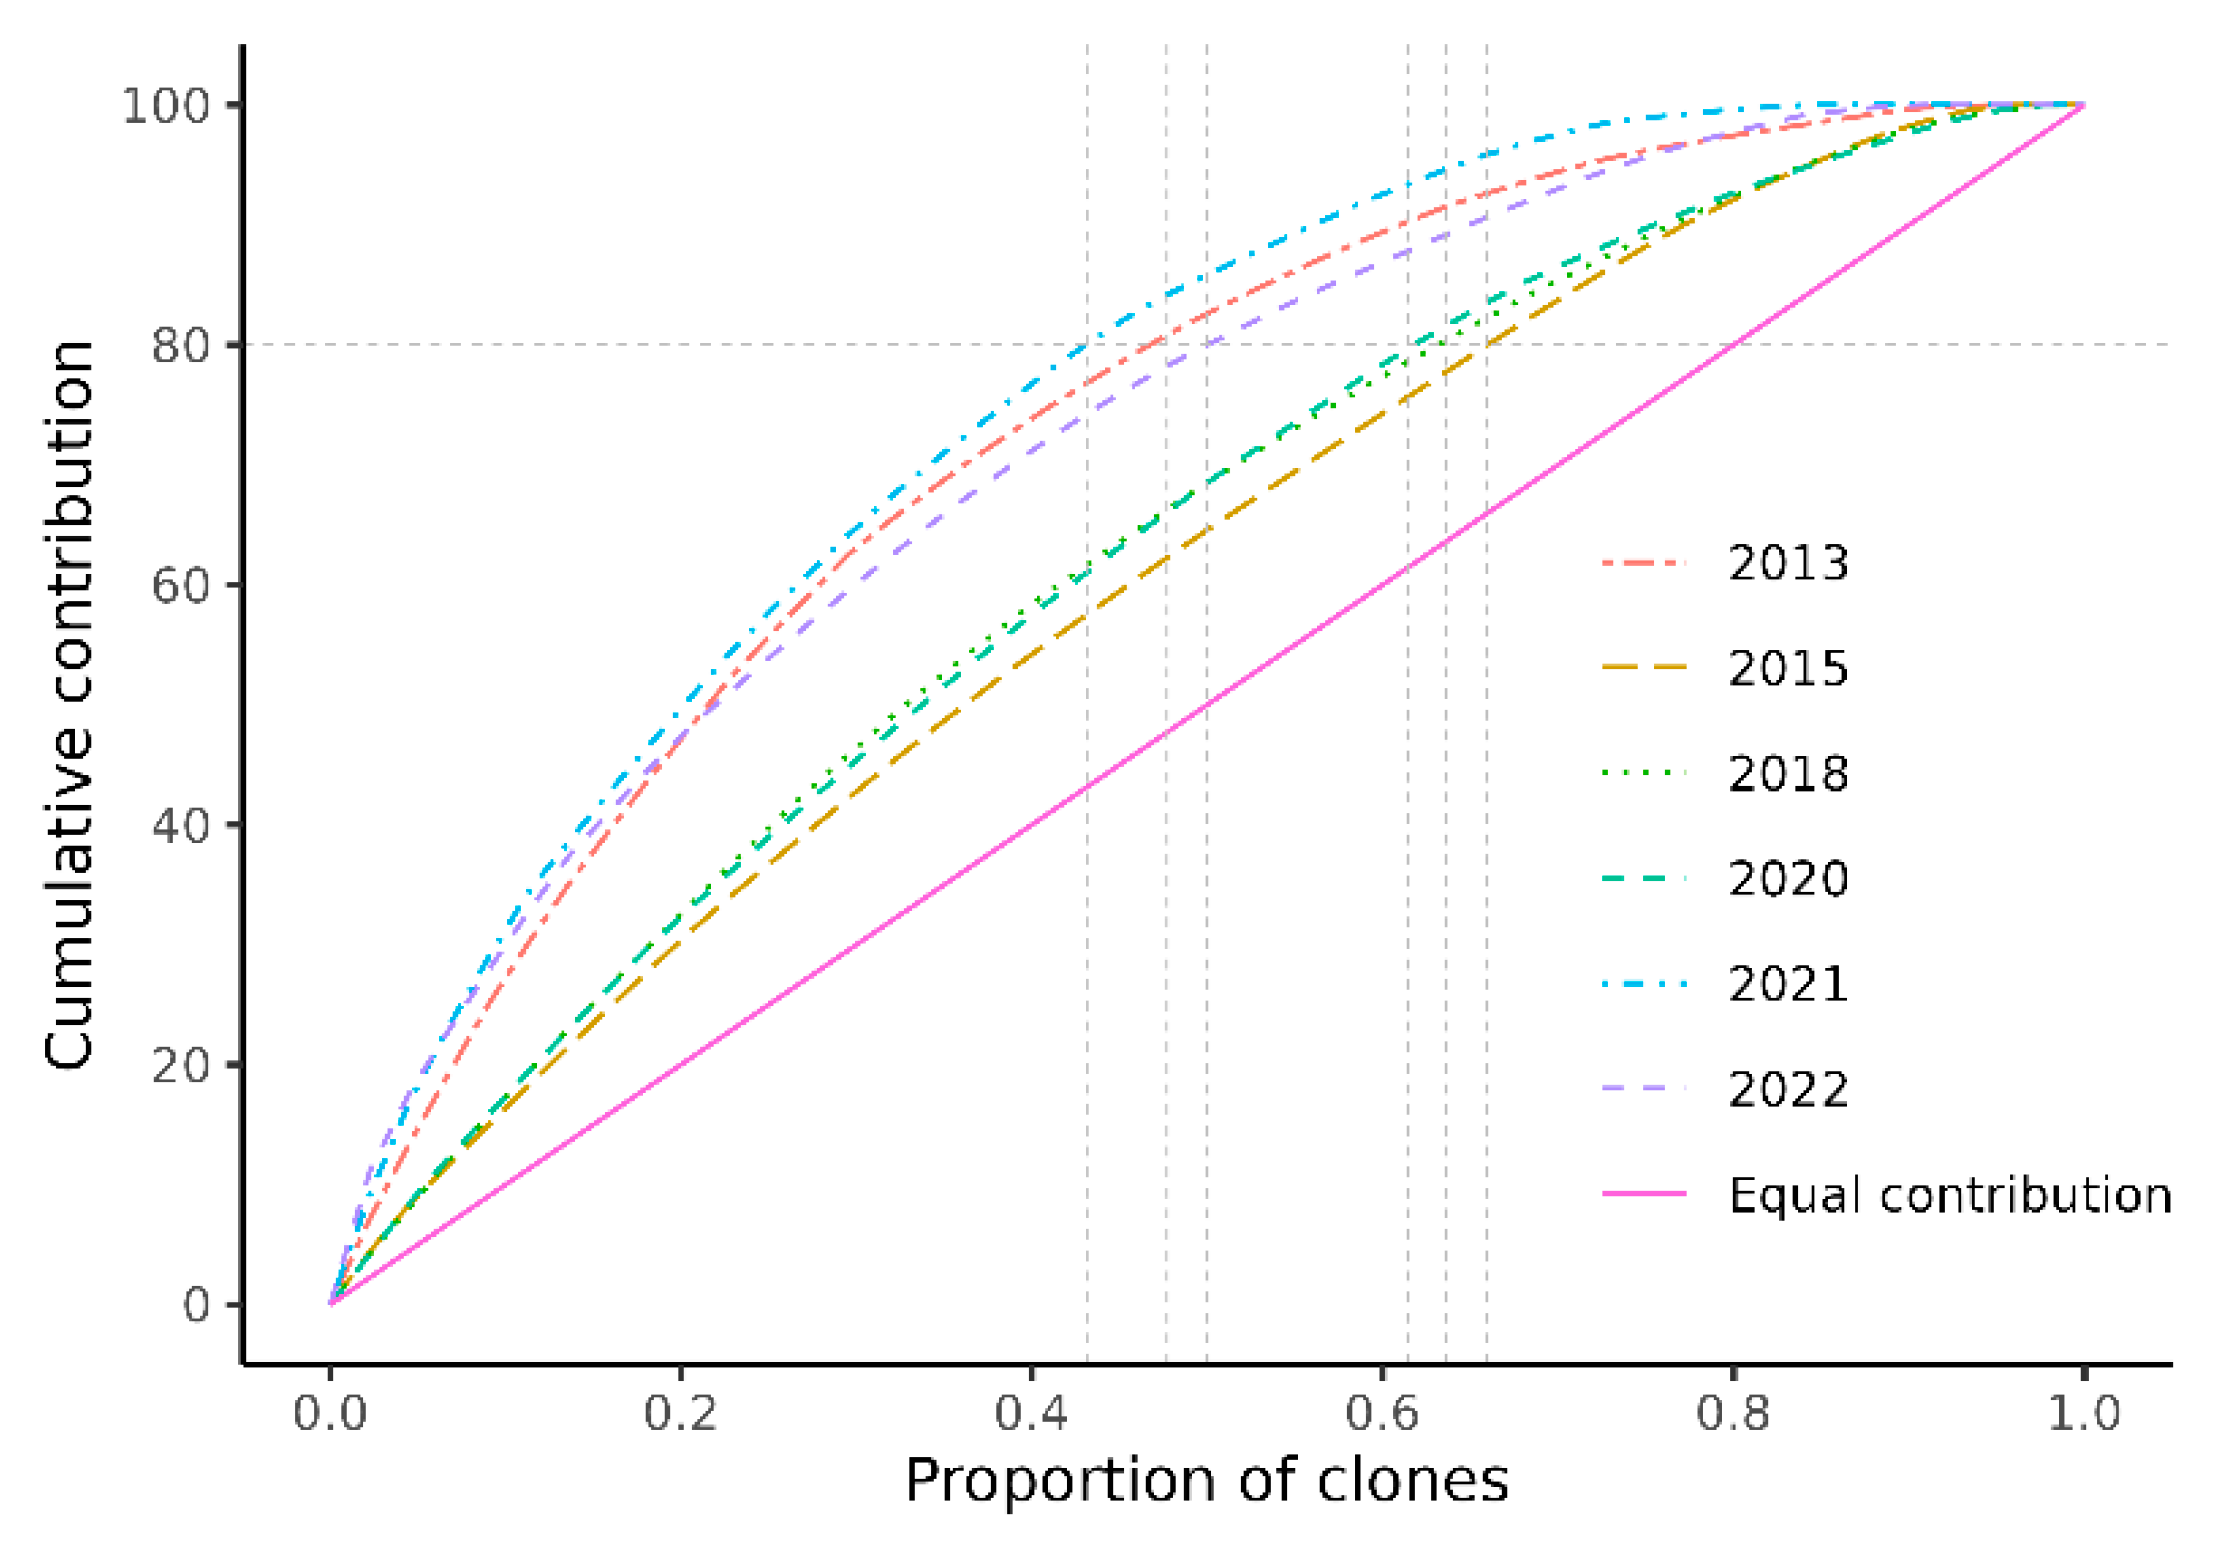
3.2. Female Fertility Variation and Genetic Diversity

Yearly cumulative curves of cones crop (Figure 3) showed deviations from the ideal case of a seed orchard with equal contribution, grouping the years in two groups of higher production (2015: closest to the expectation line, 2018 and 2020), and of poor production (2013 and 2021: furthest to the expectation line, and 2022). We found little evidence of the “20:80 rule”; the top 20% parents produced 50.5% of production in the poor year (2021) and 64.58 in the best (2015).
There was also individual clonal variation regarding the presence in the 20% list of parents. No clones were present in this ‘top’ list across all the monitoring years, and just a few were included in more than half of the observed period (the same three and five clones appeared in four and three years, respectively). More constancy was noticeable in the ‘bottom’, poor clones, where 1–2 clones were present persistently in all/most of the years (5–6 years). The two clone groups, one whose production exceeds the cumulative average of observation years, different as provenance (182, 173, 166, 176, 175, 178—local, Văratec; 3.1, 3.2. 3.16—Avrig; 4.29, 4.32—Sinaia), and of low production, below the multi-year average or without cones in some observation years (161, 167, 4.28) (Supplementary Material S1, Table S1.1).
The average female fertility coefficient (Ψf) has a value of 2.28 in pooled data, and inversely depicted the cones production across years, with extremes of 1.37 (2015, ‘top’) and 5.49 (2021, ‘poor’) (Table 5 and Supplementary Material S1, Table S1.2). Similarly, the effective number of female parents (Np(f)) was smaller in 2021 (8.19) and the largest in 2015 (32.90). The relative effective number (Nr) of female parents was between 19% and 75%, in 2021 and 2015, respectively. The lower genetic diversity in cone crops was associated with the poor year (0.939), which was slightly different than in the good years (0.985) (Table 5).

4. Discussion

Reproductive success is the confirmation that the genetic diversity of future generations will be spread [3]. It is common in tree’s fertility studies to present results based on seeds produced in good years [7]; however, for an effective selection of clones in a seed orchard, conclusions based on observations of mature grafts and cumulative cone output over many years are required [58]. The present study is the first describing the clonal genetics and female fertility variation in a mature Silver fir seed orchard, based on a full sampling (100% of ramets observed), over a longer monitoring period.
The presented inter-annual variation is recorded in a mature seed orchard, relative to other findings, which consider the annual variation observed more often in young seed orchards [15,59]. The largest yearly-based proportion of variance, both in Poisson and zero-inflated component, and the lower clone-by-year interaction, as compared to the genetic variation attributable to clone, is still quite high but in agreement with other results [7,60]. Generally, this could be attributed to climate as it has been reported that a warm and dry May contributes to good seed production of Silver fir seed stands [61,62,63] and also, in our case, the extent of observation period, which encompasses more years than other studies and thus opens the possibility to catch the extreme production years, or an increase in the reactions of clone to yearly climate variations as a seed orchard ages [64].
We found small clone-by-year interaction in both the multi-year models, which could suggest stability in the pattern of clone production ranking [2,15]. The low between-clone variation, not frequent in other studies [8], was reported in Pinus sylvestris [7]. Even that though the within-clone variation, associated with response to environmental conditions, is expected to stabilize with age [15] the mature seed orchard of our study still largely responds to the yearly, climatic conditions.
The repeatability in mean clone production was consistent across methods, with the highest heritabilities and correlations among the good years and a second lower value for the year not correlated with the others. We still found a moderate genetic control among clones variation with the estimated values of heritability in the Poisson component being higher than coniferous seed orchards of similar age (H2 = 0.38, 30 years Pinus sylvestris seed orchard) [65]. The overall values are similar to other species, e.g., Pinus nigra [10], with values between 0.61–0.71, higher than in Pinus halepensis [66], and lower than in Pinus radiata [2]-H2 = 0.91 or in Pinus patula (H2 = 0.80) [15] (see the further comments section). The small genetic control found in the zero-component of fertility (data in latent scale) indicates a small, but existing overall probability (4%) that some of the clones will not be fertile, which could increase almost four times in the years of low production.
One common characteristic of seed orchards is the large variation of number of ramets between clones [67], which impact the clone-level statistics [7]. If we also add to this the (present) case of a full, multi-year inventory, the possibility of observing ramets with no cones and with a skewed distribution is real and must be considered when deciding the methods of data processing. The usual methods of transformation of non-gaussian data, with the aim of stabilizing the variance, conduct results which are not in the original data scale, but in latent scale. Even though, in theory, these variance estimates are not changing, in practice this is not true, especially in the case of fertility data (e.g., different counts), which could result in 25% differences when using log and squared root transformations [24]. As one of the components of repeatability (or broad-sense heritability), the residual variance, is related to both the link function used and to details of the computation statistical software (e.g., the approach of overdispersion and additive vs. multiplicative), the recommendations to use proper models in analysis should be followed [24,68]. Our results indicated overestimates in latent scale compared to original data scale larger than mentioned, observed variation being between 16% and 36%, the latter in what we described as a ‘poor fertility year’ (Table 3). Considering the different possible sources of variation, the observation method and sampling, and the statistical treatment of data, the comparisons of heritability estimations across seed orchards should be made with caution; for interpretations close to real data, the above recommendations, to present the results also back-transformed to original data scale are necessary [51]. This was suggested some time before the mentioned studies, and points to the fact that the in practice clonal variability may be smaller than in published data [7].
Fertility variation presents importance in the management of forest genetic resources in different areas like seed production programs and gene conservation [5] and is also a management tool for an efficient seed crop management and in preventing the potential diminishment of genetic diversity [56].
The cumulative contribution curves or the parental balancing curves [11,53] showed a clonal contribution less than expected (i.e., equal contribution). In seed crops from seed orchards, the greatest gene diversity is only achievable when all parents equally contribute to the gamete gene pool (e.g., the H-W equilibrium). This hardly happens and frequently a small percentage of orchard parents provides an excessively large quantity of seed crops [17]. In the present analysis, the cone crop clonal involvement was relatively low, but consistent with other conifer results (e.g., 15); the top 20% of clones contributed between 51–65% of production. According to the current analysis, in top 20% only 3–5 clones ranked highly for their output in more than half of the monitoring period, an additional plus argument for extended periods of observation, which capture different performance years and, thus, more reliable average results.
In the present study, the pooled values of Ψ(f) are slightly higher than expected in seed orchards, but there was marked year-to-year variation, lower than expected in good production years and more than double in poor years. Similar variations of clone fertility over productivity years were reported in young seed orchards [8]. A possible source of variation in female fertility remains the unbalanced number of ramets per clone, as in our case, which will contribute to a larger coefficient; the mentioned reference value Ψ = 2 could be used in order to pass this [7]. The effective number of female parents (Np(f)), derived from effective population sizes, is used to assess the level of gene diversity in the population and refers to the number of individuals which, in a hypothetical population, would produce the same number of siblings (relatives) as the actual population [5,52]. Our results indicated a value over the years of Np(f) less than half the number of clones (Table 5) and yearly values which mirror the fertility variation and the cumulative curves. Similarly, the largest deviations from the equal fertility, expected when Np(f) equals the number of clones in the seed orchard [4], were found in poor years. The relative number of female parents Nr% in pooled data of 44% and annual extremes between 18% and 73% (Table 5) is different than the pattern reported in similar studies, but observed in young seed orchards, where the fertility changes with ageing [52]. The expected gene diversity of seed crops (GD) were in accordance with the other fertility indicators.
The scope of the seed orchards is to provide high genetic quality crops, under a balance of genetic gain and gene diversity [56]. From a seed orchard manager perspective, the female fertility will be prioritized because its aims are centered on the seeds as an income source, which can be quantitatively better estimated than the male, i.e., the precise number of successful female gametes of a ramet is known at harvest [2]. Although by counting the number of cones the female fertility was not fully estimated, it being necessary to estimate the number of seeds and their viability, our approach is useful in making informed decisions regarding the cone harvest and seed orchard management.
For commercial use, the values of clone-related variances present direct practical implications: single-years values depict the gene diversity received by customers using single-year seeds, while the multi-year value portray the gene diversity of the corresponding forest area regenerated using multi-year seeds from the seed orchard [7]. Thus, in order to accurately estimate the predicted genetic composition and the genetic gain of reforestation seed lots, the clonal differential contribution to the gamete gene pool is crucial [52]. Compared to earlier studies reports, the variance in female fertility is less in the studied seed orchard. Still, other factors can influence the genetic variation in cone production, including root-stock effect, crown-size, flowering synchronization and individual fecundity [16,69,70]. Also, climatic factors have a great influence in the variation of the clone production. According to marginality indices [71], the seed orchard is located in marginal site conditions for Silver fir. Recent studies have since highlighted that the climate has changed in Romania over the last few decades [72], which has certainly had a negative effect on the reproductive capacity of Silver fir in this seed orchard as the cone production gradually decreased from 2015 to 2022.
The use of information from year-to-year variation in cone crop can be useful for forestry practice. According to the lower between-clone variance and the rather substantial interaction with years, additional measures need to be added to fecundity as criteria for selecting clones. In our case it is unlikely that a few clones will have a dominant influence on the genetic diversity of the seed crop, as indicates the same magnitude of variance between clones, as between ramets within clones [7], and the parental balance of cumulative curves. Even though that the heritability estimates suggest that observations we made in the seed orchard are useful, for the future selection of clones to be developed in second-generation orchards, the fertility-based conclusions will be improved with other traits results [15]. Multiple techniques are available to manage the fertility variation: genetic thinning of individuals of low genetic values and fertility capabilities, toping and pruning, irrigation, and fertilization or intensification of flowering with plant growth regulators [2]. In our seed orchard, the estimates of the relative effective number were low and some measures to improve the genetic diversity would be required, such as genetic thinning of low fertility individuals and top pruning, which are already tested and successful methods in other Silver fir seed orchards (authors data) [52,56,70].
Our analysis presents some limitations. All the results of female fertility estimations are based on visual estimations, a method prone to errors, which could have been present even in our case, where all the trees were relatively small (about 7 m height), the cones were visible, and their count was relatively easy. In such estimations, the literature indicates possible underestimates in cones counts by a factor between 4 and 10 [7]. We based our conclusions on a set of assumptions, which are not valid in the real world, e.g., no possibility of pollen contamination, no influence of male fecundity, no clones inbreeding (e.g., the 44 plus trees acting as mothers and selected from different stands have no common genetic found), and equal gamete contributions from all the clones [2,7]. As these have implications in defining and applying further goals, these will be considered when defining the final management measures [15].

5. Conclusions

The studied Silver fir seed orchard have been established with 44 clones originating from plus trees selected in natural seed stands from four provenance regions; hence, the hypothesis that the genetic base is quite broad. Although the variation was observed between the clones, the influence of the provenances is insignificant, which means that maintaining the level of high genetic diversity is achieved. Clonal variation in cone production across years indicate that the good cone crop years, closer to the ideal situations (equal contribution of all clones) is the year with the average number of cones per tree as evenly distributed as possible, while for the years with high total production but wide variation between ramets, equal seed harvest is recommended. Considering that the storage of Silver fir seeds is possible for a period of 8 years [73], mixing seeds from consecutive years could apply, while in years with poor fructification the cone harvest will be dropped. Our results complete the fertility data of Silver fir and can be further integrated in breeding the tasks regarding the selection of the most adapted Silver fir clones to climate change, for conservation as a forest genetic resource, and to advance to the next generation of seed orchards.

Supplementary Materials

The following supporting information can be downloaded at: https://www.mdpi.com/article/10.3390/f14010017/s1, Supplementary Material S1. Summary of clone fertility, Supplementary Material S2. Dispersion and zero-inflation in cones distribution [19,40,41,42,43], Supplementary Material S3. Prior analysis and model diagnostics [46,47,48,49], Supplementary Material S4. Posterior distributions of clone variance and heritability, annual data.

Author Contributions

Conceptualization, M.T.; methodology, M.T. and A.B.; software, M.T. and G.M.; validation, G.M. and M.T.; formal analysis, M.T.; investigation, M.T. and A.B.; resources, M.T.; data curation, M.T. and A.B.; writing—original draft preparation, M.T.; writing—review and editing, M.T., A.B., G.M. and E.C.; visualization, M.T.; supervision, M.T., G.M. and E.C.; project administration, M.T; funding acquisition, M.T. All authors have read and agreed to the published version of the manuscript.

Funding

This study was funded by the Romanian Ministry of Research, Innovation and Digitalization, within the Nucleu National Program, Project 19070305/Contract no. 12N/2019 and CresPerfInst project (Contract nr. 34PFE/30.12.2021).

Institutional Review Board Statement

Not applicable.

Informed Consent Statement

Not applicable.

Data Availability Statement

Not applicable.

Acknowledgments

We would like to thank the colleagues from Neamț Forestry Directorate, Forest District Gârcina for their support in the field work. We are grateful to the anonymous reviewers who contributed to the improvement of the manuscript.

Conflicts of Interest

The authors declare no conflict of interest. The funders had no role in the design of the study, in the collection, analyses, or interpretation of data, in the writing of the manuscript, or in the decision to publish the results.

References

  1. El-Kassaby, Y.; Fashler, A.K.; Sziklai, O. Reproductive Phenology and Its Impact on Genetically Improved Seed Production in a Douglas-fir Seed Orchard. Silvae Genet. 1984, 33, 120–125. [Google Scholar]
  2. Codesido, V.; Fernández-López, J. Juvenile Radiata Pine Clonal Seed Orchard Management in Galicia (NW Spain). Eur. J. For. Res. 2014, 133, 177–190. [Google Scholar] [CrossRef]
  3. Funda, T.; El-Kassaby, Y.A. Seed Orchard Genetics. CAB Rev. Perspect. Agric. Vet. Sci. Nutr. Nat. Resour. 2012, 7, 1–23. [Google Scholar] [CrossRef]
  4. Kang, K.-S.; Kim, C.-S. Clonal Fertility Variation and Its Effects on the Effective Population Size in the Seed Orchard of Dioecious Species, Fraxinus Rhynchophylla. Silvae Genet. 2012, 61, 79–84. [Google Scholar] [CrossRef] [Green Version]
  5. Bilir, N.; Kang, K.-S. Fertility Variation, Seed Collection and Gene Diversity in Natural Stands of Taurus Cedar (Cedrus libani). Eur. J. For. Res. 2021, 140, 199–208. [Google Scholar] [CrossRef]
  6. Kang, K.; Harju, A.; Lindgren, D.; Nikkanen, T.; Almqvist, C.; Suh, G. Variation in Effective Number of Clones in Seed Orchards. New For. 2001, 21, 17–33. [Google Scholar] [CrossRef]
  7. Prescher, F.; Lindgren, D.; Almqvist, C.; Kroon, J.; Lestander, T.A.; Mullin, T.J. Female Fertility Variation in Mature Pinus sylvestris Clonal Seed Orchards. Scand. J. For. Res. 2007, 22, 280–289. [Google Scholar] [CrossRef]
  8. Kang, K.-S. Estimation of Fertility Variation in Forest Tree Populations. Forestry 2003, 76, 329–344. [Google Scholar] [CrossRef] [Green Version]
  9. Chen, X.; Guo, Q.; Brockway, D.G. Analyzing the Complexity of Cone Production in Longleaf Pine by Multiscale Entropy. J. Sustain. For. 2016, 35, 172–182. [Google Scholar] [CrossRef]
  10. Matziris, D. Variation in Cone Production in a Clonal Seed Orchard of Black Pine. Silvae Genet. 1993, 42, 136–141. [Google Scholar]
  11. Griffin, A. Clonal Variation in Radiata Pine Seed Orchards. I: Some Flowering, Cone and Seed Production Traits. Aust. For. Res. 1983, 12, 295–302. [Google Scholar]
  12. Askew, G. Estimation of Gamete Pool Compositions in Clonal Seed Orchards. Silvae Genet. 1988, 37, 5–6. [Google Scholar]
  13. Any, Y.E.-K.; FAsıER, A.; Crown, M. Variation in Fruitfulness in a Douglas-fir Seed Orchard and Its Effect on Crop-Management Decisions. Silvae Genet. 1989, 38, 3–4. [Google Scholar]
  14. Kang, K.S.; Mullin, T.J. Variation in Clone Fertility and Its Effect on the Gene Diversity of Seeds From a Seed Orchard of Chamaecyparis obtusa in Korea. Silvae Genet. 2007, 56, 134–137. [Google Scholar] [CrossRef] [Green Version]
  15. Muñoz-Gutiérrez, L.; Vargas-Hernández, J.J.; López-Upton, J.; Ramírez-Herrera, C.; Jiménez-Casas, M. Clonal Variation in Phenological Synchronization and Cone Production in a Pinus patula Seed Orchard. Silvae Genet. 2020, 69, 130–138. [Google Scholar] [CrossRef]
  16. Anonymous. Twentieth Annual Report. N.C. State Cooperative Tree Improvement and Hardwood Research Program; School of Forest Resources, North Carolina State University: Raleigh, NC, USA, 1976. [Google Scholar]
  17. Park, J.-M.; Kang, H.-I.; Yeom, D.-B.; Kang, K.-S.; El-Kassaby, Y.A.; Lee, K.-M. Gender, Reproductive Output Covariation and Their Role on Gene Diversity of Pinus Koraiensis Seed Orchard Crops. BMC Plant Biol. 2020, 20, 418. [Google Scholar] [CrossRef]
  18. Pick, J.L.; Lemon, H.E.; Thomson, C.E.; Hadfield, J.D. Decomposing Phenotypic Skew and Its Effects on the Predicted Response to Strong Selection. Nat. Ecol. Evol. 2022, 6, 774–785. [Google Scholar] [CrossRef]
  19. Martin, T.G.; Wintle, B.A.; Rhodes, J.R.; Kuhnert, P.M.; Field, S.A.; Low-Choy, S.J.; Tyre, A.J.; Possingham, H.P. Zero Tolerance Ecology: Improving Ecological Inference by Modelling the Source of Zero Observations: Modelling Excess Zeros in Ecology. Ecol. Lett. 2005, 8, 1235–1246. [Google Scholar] [CrossRef] [Green Version]
  20. Calama, R.; Mutke, S.; Tomé, J.; Gordo, J.; Montero, G.; Tomé, M. Modelling Spatial and Temporal Variability in a Zero-Inflated Variable: The Case of Stone Pine (Pinus pinea L.) Cone Production. Ecol. Model. 2011, 222, 606–618. [Google Scholar] [CrossRef]
  21. Andrus, R.A.; Harvey, B.J.; Hoffman, A.; Veblen, T.T. Reproductive Maturity and Cone Abundance Vary with Tree Size and Stand Basal Area for Two Widely Distributed Conifers. Ecosphere 2020, 11, e03092. [Google Scholar] [CrossRef]
  22. Kang, K.-S. Clonal and Annual Variation of Flower Production and Composition of Gamete Gene Pool in a Clonal Seed Orchard of Pinus Densiflora. Can. J. For. Res. 2000, 30, 1275–1280. [Google Scholar] [CrossRef]
  23. O’Hara, R.B.; Kotze, D.J. Do Not Log-Transform Count Data. Methods Ecol. Evol. 2010, 1, 118–122. [Google Scholar] [CrossRef] [Green Version]
  24. Nakagawa, S.; Schielzeth, H. Repeatability for Gaussian and Non-Gaussian Data: A Practical Guide for Biologists. Biol. Rev. 2010, 85, 935–956. [Google Scholar] [CrossRef] [PubMed]
  25. de Villemereuil, P.; Rutschmann, A.; Lee, K.D.; Ewen, J.G.; Brekke, P.; Santure, A.W. Little Adaptive Potential in a Threatened Passerine Bird. Curr. Biol. 2019, 29, 889–894.e3. [Google Scholar] [CrossRef] [PubMed] [Green Version]
  26. Moiron, M.; Charmantier, A.; Bouwhuis, S. The Quantitative Genetics of Fitness in a Wild Seabird. Evolution 2022, 76, 1443–1452. [Google Scholar] [CrossRef]
  27. Ferreira, F.M.; Evangelista, J.S.P.C.; Chaves, S.F.d.S.; Alves, R.S.; Silva, D.B.; Malikouski, R.G.; Resende, M.D.V.; Bhering, L.L.; Santos, G.A. Multivariate Bayesian Analysis for Genetic Evaluation and Selection of Eucalyptus in Multiple Environment Trials. Bragantia 2022, 81, e2922. [Google Scholar] [CrossRef]
  28. Peixoto, M.A.; Evangelista, J.S.P.C.; Coelho, I.F.; Alves, R.S.; Laviola, B.G.; Fonseca e Silva, F.; Resende, M.D.V.d.; Bhering, L.L. Multiple-Trait Model Through Bayesian Inference Applied to Jatropha curcas Breeding for Bioenergy. PLoS ONE 2021, 16, e0247775. [Google Scholar] [CrossRef]
  29. Tinner, W.; Colombaroli, D.; Heiri, O.; Henne, P.D.; Steinacher, M.; Untenecker, J.; Vescovi, E.; Allen, J.R.M.; Carraro, G.; Conedera, M.; et al. The Past Ecology of Abies alba Provides New Perspectives on Future Responses of Silver Fir Forests to Global Warming. Ecol. Monogr. 2013, 83, 419–439. [Google Scholar] [CrossRef] [Green Version]
  30. Bucher, H.U. Abies alba. In Enzyklopädie der Holzgewächse: Handbuch und Atlas der Dendrologie; John Wiley & Sons, Ltd.: Hoboken, NJ, USA, 2014; pp. 1–18. ISBN 978-3-527-67851-8. [Google Scholar]
  31. San-Miguel-Ayanz, J.; De Rigo, D.; Caudullo, G.; Durrant, T.H.; Mauri, A. European Atlas of Forest Tree Species. Abies alba in Europe: Distribution, Habitat, Usage and Threats; Publications Office of the European Union: Luxemburg, 2016. [Google Scholar]
  32. Dobrowolska, D.; Bončina, A.; Klumpp, R. Ecology and Silviculture of Silver Fir (Abies alba Mill.): A Review. J. For. Res. 2017, 22, 326–335. [Google Scholar] [CrossRef]
  33. Fady, B.; Aravanopoulos, F.A.; Alizoti, P.; Mátyás, C.; von Wühlisch, G.; Westergren, M.; Belletti, P.; Cvjetkovic, B.; Ducci, F.; Huber, G.; et al. Evolution-Based Approach Needed for the Conservation and Silviculture of Peripheral Forest Tree Populations. For. Ecol. Manag. 2016, 375, 66–75. [Google Scholar] [CrossRef] [Green Version]
  34. Teodosiu, M.; Mihai, G.; Fussi, B.; Ciocîrlan, E. Genetic Diversity and Structure of Silver Fir (Abies alba Mill.) At the South-Eastern Limit of Its Distribution Range. Ann. For. Res. 2019, 62, 139. [Google Scholar] [CrossRef]
  35. Mihai, G.; Bîrsan, M.-V.; Dumitrescu, A.; Alexandru, A.; Mirancea, I.; Ivanov, P.; Stuparu, E.; Teodosiu, M.; Daia, M. Adaptive Genetic Potential of European Silver Fir in Romania in the Context of Climate Change. Ann. For. Res. 2018, 61, 95–108. [Google Scholar] [CrossRef]
  36. NIS National Institute of Statistics. INSEE-Statistics Databases. TEMPO-Online Timeseries; National Institute of Statistics: Bucharest, Romania, 2019. [Google Scholar]
  37. Mihai, G. O generație avansată de plantaje de brad. An. ICAS 2007, 50, 45–55. [Google Scholar]
  38. Mohytych, V.; Sułkowska, M.; Klisz, M. Reproduction of Silver Fir (Abies alba Mill) Forests in the Ukrainian Carpathians. Folia For. Pol. 2019, 61, 156–158. [Google Scholar] [CrossRef]
  39. Woods, J.H. Methods for Estimating Gamete Contributions to Orchard Seed Crops and Vegetative Lots in British Columbia; British Columbia Forest Science Program: Victoria, Canada, 2005. [Google Scholar]
  40. Brooks, M.E.; Kristensen, K.; van Benthem, K.J.; Magnusson, A.; Berg, C.W.; Nielsen, A.; Skaug, H.J.; Mächler, M.; Bolker, B.M. glmmTMB Balances Speed and Flexibility Among Packages for Zero-inflated Generalized Linear Mixed Modeling. R J. 2017, 9, 378–400. [Google Scholar] [CrossRef] [Green Version]
  41. Hartig, F. DHARMa: Residual Diagnostics for Hierarchical (Multi-Level/Mixed) Regression Models. R Package Version 0.4.6: 2022. Available online: http://florianhartig.github.io/DHARMa/ (accessed on 22 July 2022).
  42. Lüdecke, D.; Ben-Shachar, M.S.; Patil, I.; Waggoner, P.; Makowski, D. performance: An R Package for Assessment, Comparison and Testing of Statistical Models. J. Open Source Softw. 2021, 6, 3139. [Google Scholar] [CrossRef]
  43. Campbell, H. The Consequences of Checking for Zero-inflation and Overdispersion in the Analysis of Count Data. Methods Ecol. Evol. 2021, 12, 665–680. [Google Scholar] [CrossRef]
  44. Blasco-Moreno, A.; Pérez-Casany, M.; Puig, P.; Morante, M.; Castells, E. What does a zero mean? Understanding false, random and structural zeros in ecology. Methods Ecol. Evol. 2019, 10, 949–959. [Google Scholar] [CrossRef]
  45. Hadfield, J.D. MCMC Methods for Multi-Response Generalized Linear Mixed Models: The MCMCglmm R Package. J. Stat. Soft. 2010, 33, 1–22. [Google Scholar] [CrossRef] [Green Version]
  46. Banner, K.M.; Irvine, K.M.; Rodhouse, T.J. The Use of Bayesian Priors in Ecology: The Good, the Bad and the Not Great. Methods Ecol. Evol. 2020, 11, 882–889. [Google Scholar] [CrossRef]
  47. de Villemereuil, P.; Gimenez, O.; Doligez, B. Comparing Parent-Offspring Regression with Frequentist and Bayesian Animal Models to Estimate Heritability in Wild Populations: A Simulation Study for Gaussian and Binary Traits. Methods Ecol. Evol. 2013, 4, 260–275. [Google Scholar] [CrossRef]
  48. Nikbin, S.; Almasi, F.; Alenizi, D.; Jenvey, C.; Sloan, S.; Preston, S.; Piedrafita, D.; Jonsson, N.; Stear, M. The Heritability of Nematodirus Battus Fecal Egg Counts. Parasitology 2022, 149, 555–561. [Google Scholar] [CrossRef] [PubMed]
  49. Hadfield, J. MCMCglmm Course Notes. 2022. Available online: https://mran.microsoft.com/snapshot/2018-08-24/web/packages/MCMCglmm/Vignettes/CourseNotes.Pdf (accessed on 22 July 2022).
  50. Plummer, M.; Best, N.; Cowles, K.; Vines, K. CODA: Convergence Diagnosis and Output Analysis for MCMC. R News 2006, 6, 7–11. [Google Scholar]
  51. de Villemereuil, P.; Schielzeth, H.; Nakagawa, S.; Morrissey, M. General Methods for Evolutionary Quantitative Genetic Inference from Generalized Mixed Models. Genetics 2016, 204, 1281–1294. [Google Scholar] [CrossRef] [Green Version]
  52. Park, J.-M.; Kwon, S.-H.; Lee, H.-J.; Na, S.-J.; El-Kassaby, Y.A.; Kang, K.-S. Integrating Fecundity Variation and Genetic Relatedness in Estimating the Gene Diversity of Seed Crops: Pinus koraiensis Seed Orchard as an Example. Can. J. For. Res. 2017, 47, 366–370. [Google Scholar] [CrossRef] [Green Version]
  53. Chaisurisri, K.; El-Kassaby, Y.A. Estimation of Clonal Contribution to Cone and Seed Crops in a Sitka Spruce Seed Orchard. Ann. For. Sci. 1993, 50, 461–467. [Google Scholar] [CrossRef] [Green Version]
  54. Kang, K.; Lindgren, D. Fertility Variation and Its Effect on the Relatedness of Seeds in Pinus densiflora, Pinus thunbergii and Pinus koraiensis Clonal Seed Orchards. Silvae Genet. 1998, 47, 196–201. [Google Scholar]
  55. Varghese, M.; Nicodemus, A.; Nagarajan, B.; Lindgren, D. Impact of Fertility Variation on Gene Diversity and Drift in Two Clonal Seed Orchards of Teak (Tectona grandis Linn. f.). New For. 2006, 31, 497–512. [Google Scholar] [CrossRef]
  56. Jiao, S.-Q.; Li, M.; Zhu, Y.-J.; Zhou, S.-S.; Zhao, S.-W.; Li, Z.-C.; Bao, Y.-T.; Shi, T.-L.; Zhang, H.-J.; Yang, X.-L.; et al. Variation in Platycladus orientalis (Cupressaceae) Reproductive Output and Its Effect on Seed Orchard Crops’ Genetic Diversity. Forests 2021, 12, 1429. [Google Scholar] [CrossRef]
  57. R Core Team. R: A Language and Environment for Statistical Computing; R Foundation for Statistical Computing: Vienna, Austria, 2022. [Google Scholar]
  58. Kroon, J.; Wennström, U.; Prescher, F.; Lindgren, D.; Mullin, T.J. Estimation of Clonal Variation in Seed Cone Production Over Time in a Scots Pine (Pinus sylvestris L.) Seed Orchard. Silvae Genet. 2009, 58, 53–62. [Google Scholar] [CrossRef] [Green Version]
  59. Li, W.; Wang, X.; Li, Y. Stability in and Correlation Between Factors Influencing Genetic Quality of Seed Lots in Seed Orchard of Pinus tabuliformis Carr. Over a 12-Year Span. PLoS ONE 2011, 6, e23544. [Google Scholar] [CrossRef] [PubMed] [Green Version]
  60. Gömöry, D.; Bruchanik, R.; Paule, L. Effective Population Number Estimation of Three Scots Pine (Pinus sylvestris L.) Seed Orchards Based on an Integrated Assessment of Flowering, Floral Phenology, and Seed Orchard Design. For. Genet. 2000, 7, 65–75. [Google Scholar]
  61. Enescu, V. Climate and the Choice of Seed Orchard Sites. For. Ecol. Manag. 1987, 19, 257–265. [Google Scholar] [CrossRef]
  62. Fernández-Martínez, M.; Vicca, S.; Janssens, I.A.; Espelta, J.M.; Peñuelas, J. The North Atlantic Oscillation Synchronises Fruit Production in Western European Forests. Ecography 2017, 40, 864–874. [Google Scholar] [CrossRef] [Green Version]
  63. Garcia-Barreda, S.; Sangüesa-Barreda, G.; Madrigal-González, J.; Seijo, F.; González de Andrés, E.; Camarero, J.J. Reproductive Phenology Determines the Linkages Between Radial Growth, Fruit Production and Climate in Four Mediterranean Tree Species. Agric. For. Meteorol. 2021, 307, 108493. [Google Scholar] [CrossRef]
  64. Byram, T.; Lowe, W.; McGriff, J. Clonal and Annual Variation in Cone Production in Loblolly Pine Seed Orchards. For. Sci. 1986, 32, 1067–1073. [Google Scholar]
  65. Jonsson, A.; Ekberg, I.; Eriksson, G. Flowering in a Seed Orchard of Pinus Sylvestris L. Studia For. Suec. 1976, 135, 38. [Google Scholar]
  66. Matziris, D. Variation in Growth, Flowering and Cone Production in a Clonal Seed Orchard of Aleppo Pine Grown in Greece. Silvae Genet. 1997, 46, 224–228. [Google Scholar]
  67. Kang, K.-S. Genetic Gain and Gene Diversity of Seed Orchard Crops; Swedish University of Agricultural Sciences: Uppsala, Sweden, 2001. [Google Scholar]
  68. Royauté, R.; Dochtermann, N.A. Comparing Ecological and Evolutionary Variability Within Datasets. Behav. Ecol. Sociobiol. 2021, 75, 127. [Google Scholar] [CrossRef]
  69. Jayawickrama, K.J.S.; Jett, J.B.; McKeand, S.E. Rootstock Effects in Grafted Conifers: A Review. New For. 1991, 5, 157–173. [Google Scholar] [CrossRef]
  70. Kamalakannan, R.; Varghese, M.; Park, J.-M.; Kwon, S.-H.; Song, J.-H.; Kang, K.-S. Fertility Variation and Its Impact on Effective Population Size in Seed Stands of Tamarindus indica and Azadirachta indica. Silvae Genet. 2015, 64, 91–99. [Google Scholar] [CrossRef] [Green Version]
  71. Picarda, N.; Marchi, M.; Serra-Varela, M.J.; Westergren, M.; Cavers, S.; Notivol, E.; Piotti, A.; Alizoti, P.; Bozzano, M.; Santiago, C.; et al. Marginality indices for biodiversity conservation in forest trees. Ecol. Indic. 2022, 143, 109367. [Google Scholar] [CrossRef]
  72. Mihai, G.; Alexandru, A.M.; Nita, I.A.; Birsan, M.V. Climate Change in the Provenance Regions of Romania over the Last 70 Years: Implications for Forest Management. Forests 2022, 13, 1203. [Google Scholar] [CrossRef]
  73. Mihai, G.; Alexandru, A.M. Silver Fir Seeds Conservation; Forestry Publishing: Bucharest, Romania, 2021; 65p. [Google Scholar]
Figure 1. Variance explained by random effects in the multi-year model, Poisson (P), and zero-inflated (zi) components. Posterior means (points), 99%, and 95% credible intervals (lines, respective blocks) are in latent scale.
Forests 14 00017 g001
Figure 2. Posterior MCMC samples (bars), kernel density estimation (thin solid line), posterior mean (dotted line), and 95% credible intervals (thick solid line) of heritability in zero-inflated (a) and Poisson (b) components of cone crops. Estimates are in data scale.
Forests 14 00017 g002
Figure 3. Cone crop parental balance curve over six years, based on the entire orchard clones (n = 44). The straight line represents an ideal orchard with equal contribution among individuals, while the dotted horizontal line is the 20:80 rule.
Forests 14 00017 g003
Table 1. Clone origin in the Silver fir (Abies alba Mill.) seed orchard.
Provenance
(Provenance Region)
Clone IDsNumber of ClonesLatitude NLongitude EAltitude (m)Mean Annual
Temperature (°C)
Mean Annual Precipitations (mm)
Avrig (C1)3.1–3.18745°39′24°29′7507.5694
Rusca Montană (D2)3.55–3.72445°39′24°29′10006.6878
Sinaia (B2)4.17–4.36745°19′25°32′11504.8783
Văratec (A2)158–1812647°08′26°15′6006.9606
Table 2. Statistics of cones production across years.
Parameter/Year201320152018202020212022Pooled
Alive ramets (n)636636636636636631-
Fertile ramets (%)75.395.1291.594.342.667.577.7
Mean28.067.9279.647.57.116.241.1
Std. deviation35.941.1861.436.315.121.346.4
Median14.567.570.042.00.07.025.0
Range0–2060–2000–3500–2150–1150–1100–350
Table 3. Proportion of variance explained by random effects and heritability in single-year models. Estimates are reported as posterior mode (95% credible interval, proportion of variance from latent scale, heritability in both latent (H2l(P)), and data scale (H2(zi), H2(P)), for Poisson (P) and zero-inflated (zi) component of the model.
Parameter/Year201320152018202020212022
Clone(zi)33.2
(17.9–50.4)
18.9
(0.1–55.6)
56.8
(36.9–74.6)
20.2
(0.1–52.6)
26.4
(13.1–42.7)
24.6
(10.1–42.8)
residual(zi)27.3
(20.1–34.2)
55.4
(30.3–69.9)
25.9
(15.5–38)
46
(27.3–58.7)
31.3
(23.8–38.3)
37
(27.9–45)
Clone(P)10.2 (5–18.3)5.5 (2.2–10.6)2.6 (1–5.4)6.2 (2.6–11.7)5.7 (1.1–13.4)6 (2.3–12)
residual(P)29.3
(21.2–37.4)
20.2
(10.9–26.3)
14.6
(8.5–21.7)
27.6
(16.3–36)
36.7
(27.4–46.2)
32.4
(24–40.2)
H2(zi)0.127
(0.07, 0.237)
0
(0, 0.049)
0.088
(0.033, 0.188)
0
(0, 0.065)
0.147
(0.07, 0.229)
0.106
(0.037, 0.191)
H2l(P)0.83
(0.723, 0.914)
0.797
(0.663, 0.891)
0.733
(0.548, 0.846)
0.783
(0.616, 0.866)
0.698
(0.323, 0.868)
0.724
(0.541, 0.877)
H2(P)0.607
(0.543, 0.633)
0.662
(0.536, 0.751)
0.616
(0.46, 0.715)
0.614
(0.486, 0.698)
0.443
(0.188, 0.594)
0.549
(0.353, 0.628)
Table 4. Pearson product moment and Spearman’s rank correlation coefficients (above and below the diagonal) among clone mean cone production across years.
Year201320152018202020212022
201310.473 ***0.462 *0.297 *0.2760.001
20150.535 ***10.797 ***0.560 ***0.343 *−0.003
20180.492 **0.811 ***10.588 ***0.1620.077
20200.346 *0.599 ***0.596 ***1−0.0690.163
20210.2800.329 *0.159−0.04910.136
20220.1510.280.3020.2620.2951.000
Statistical significance: ***—p < 0.001, **—p < 0.01, *—p < 0.05.
Table 5. Clonal coefficient of variation (CV), female fertility coefficient (Ψf), effective number of female parents (Np(f)), relative effective number of female parents (Nr%), and gene diversity (GD) in the Silver fir clonal seed orchard.
Parameter/Year201320152018202020212022Pooled
CV128.2460.6377.1676.44211.96131.06113.00
Ψ(f)2.641.371.601.585.492.722.28
Np17.0232.9028.2128.408.1916.5619.76
Nr%37.8273.1262.6863.1218.2036.8043.92
GD0.9710.9850.9820.9820.9390.9700.975
Disclaimer/Publisher’s Note: The statements, opinions and data contained in all publications are solely those of the individual author(s) and contributor(s) and not of MDPI and/or the editor(s). MDPI and/or the editor(s) disclaim responsibility for any injury to people or property resulting from any ideas, methods, instructions or products referred to in the content.

