

Insectivorous Bats in Eastern Mediterranean Planted Pine Forests—Effects of Forest Structure on Foraging Activity, Diversity, and Implications for Management Practices


Abstract
:1. Introduction
2. Materials and Methods
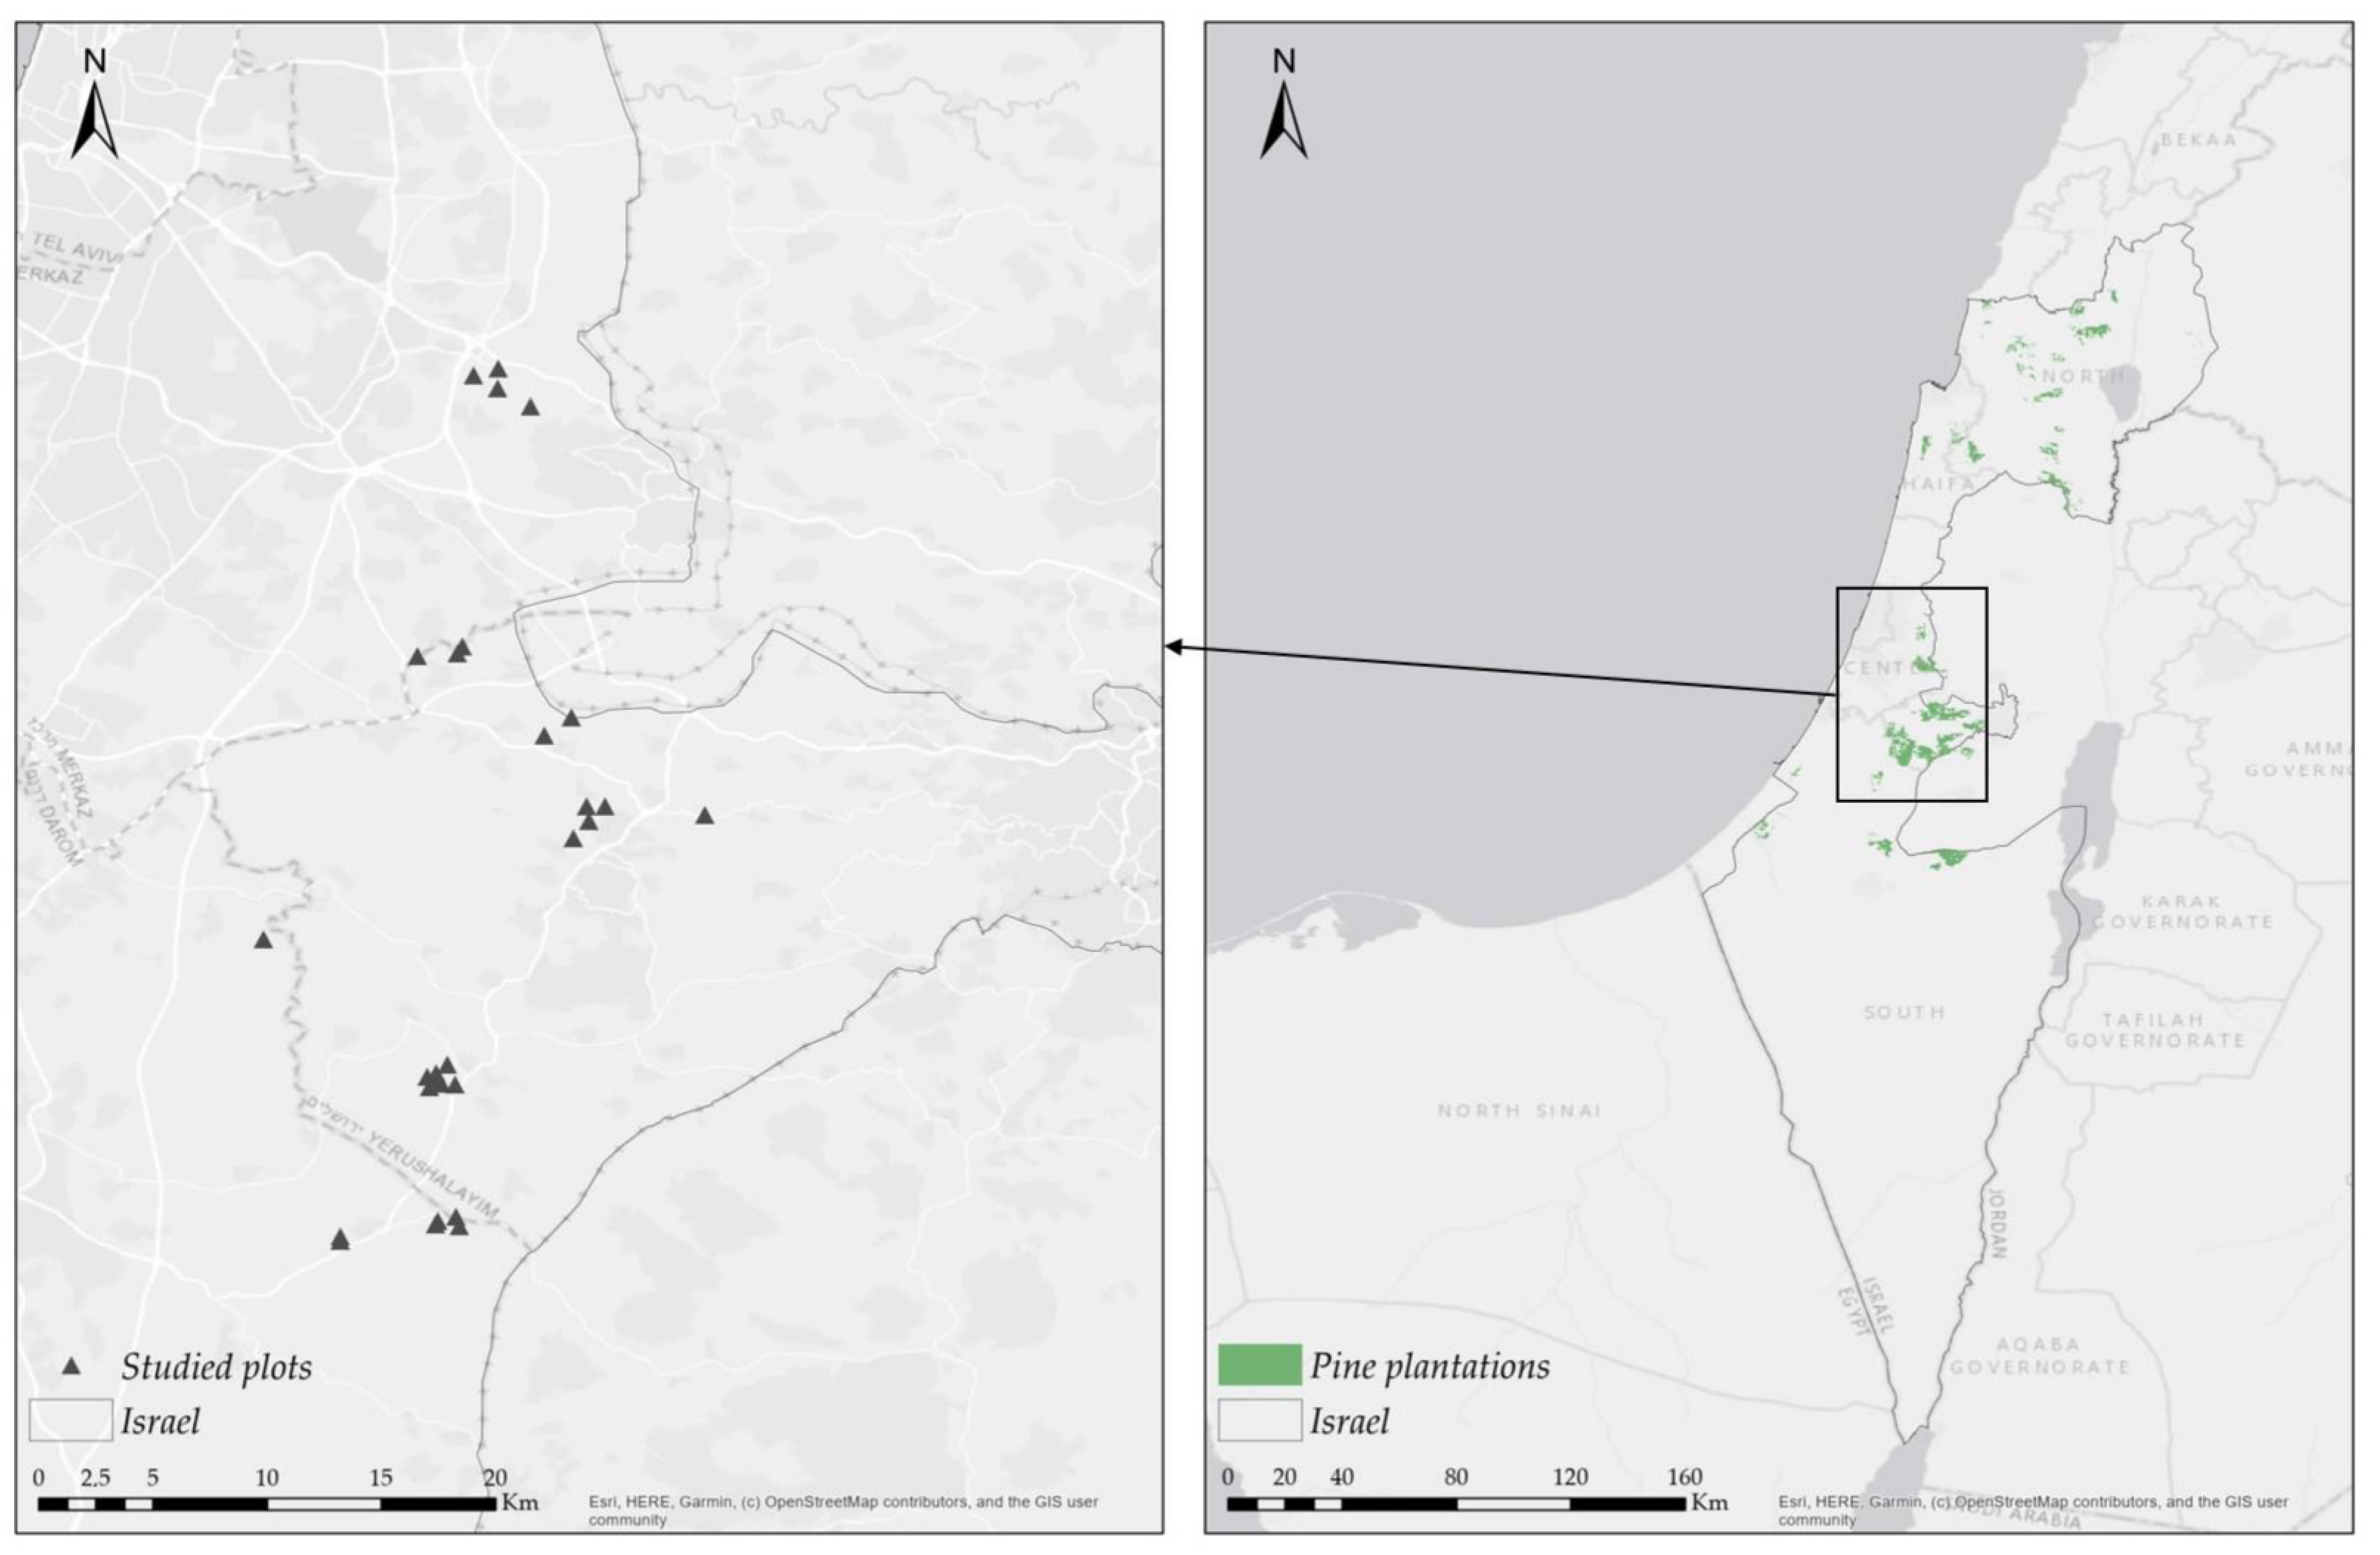
2.1. Research Area
2.2. Acoustic Monitoring and Sound Analysis
2.3. Measurement of Forest Structure
2.4. Statistical Analysis
3. Results
3.1. Species Occurrences
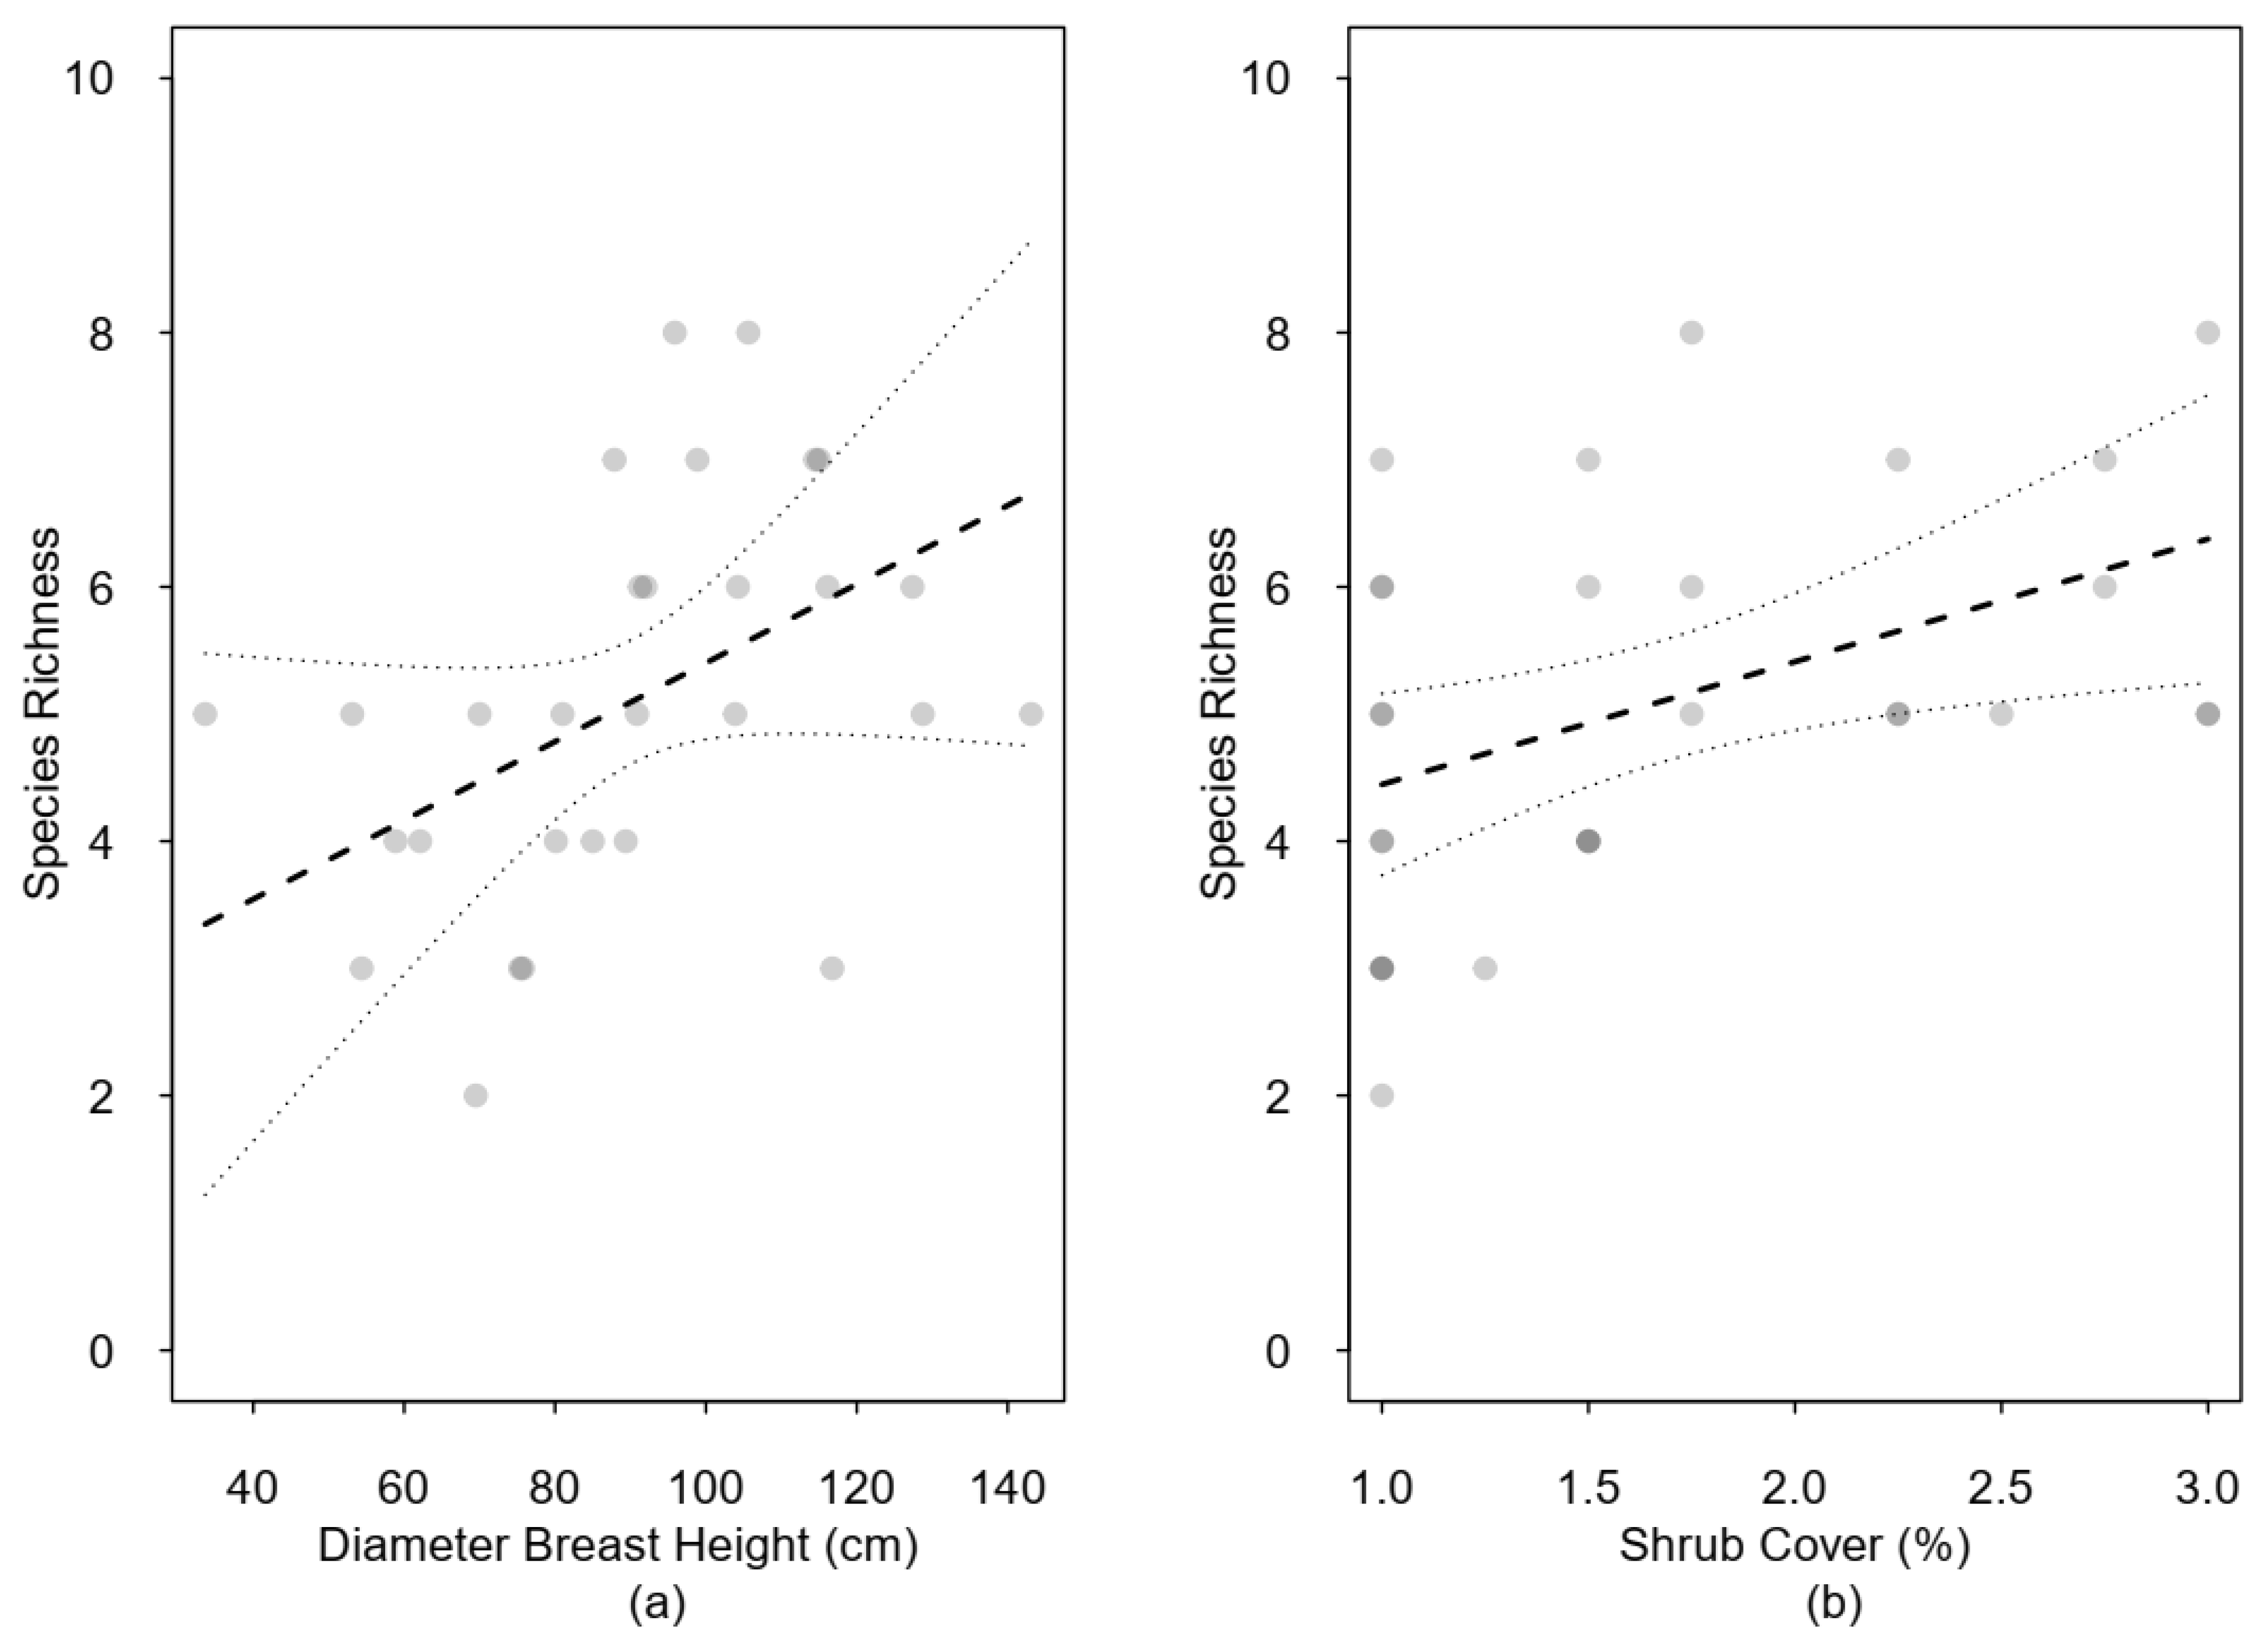
3.2. Species Richness and Forest Structure
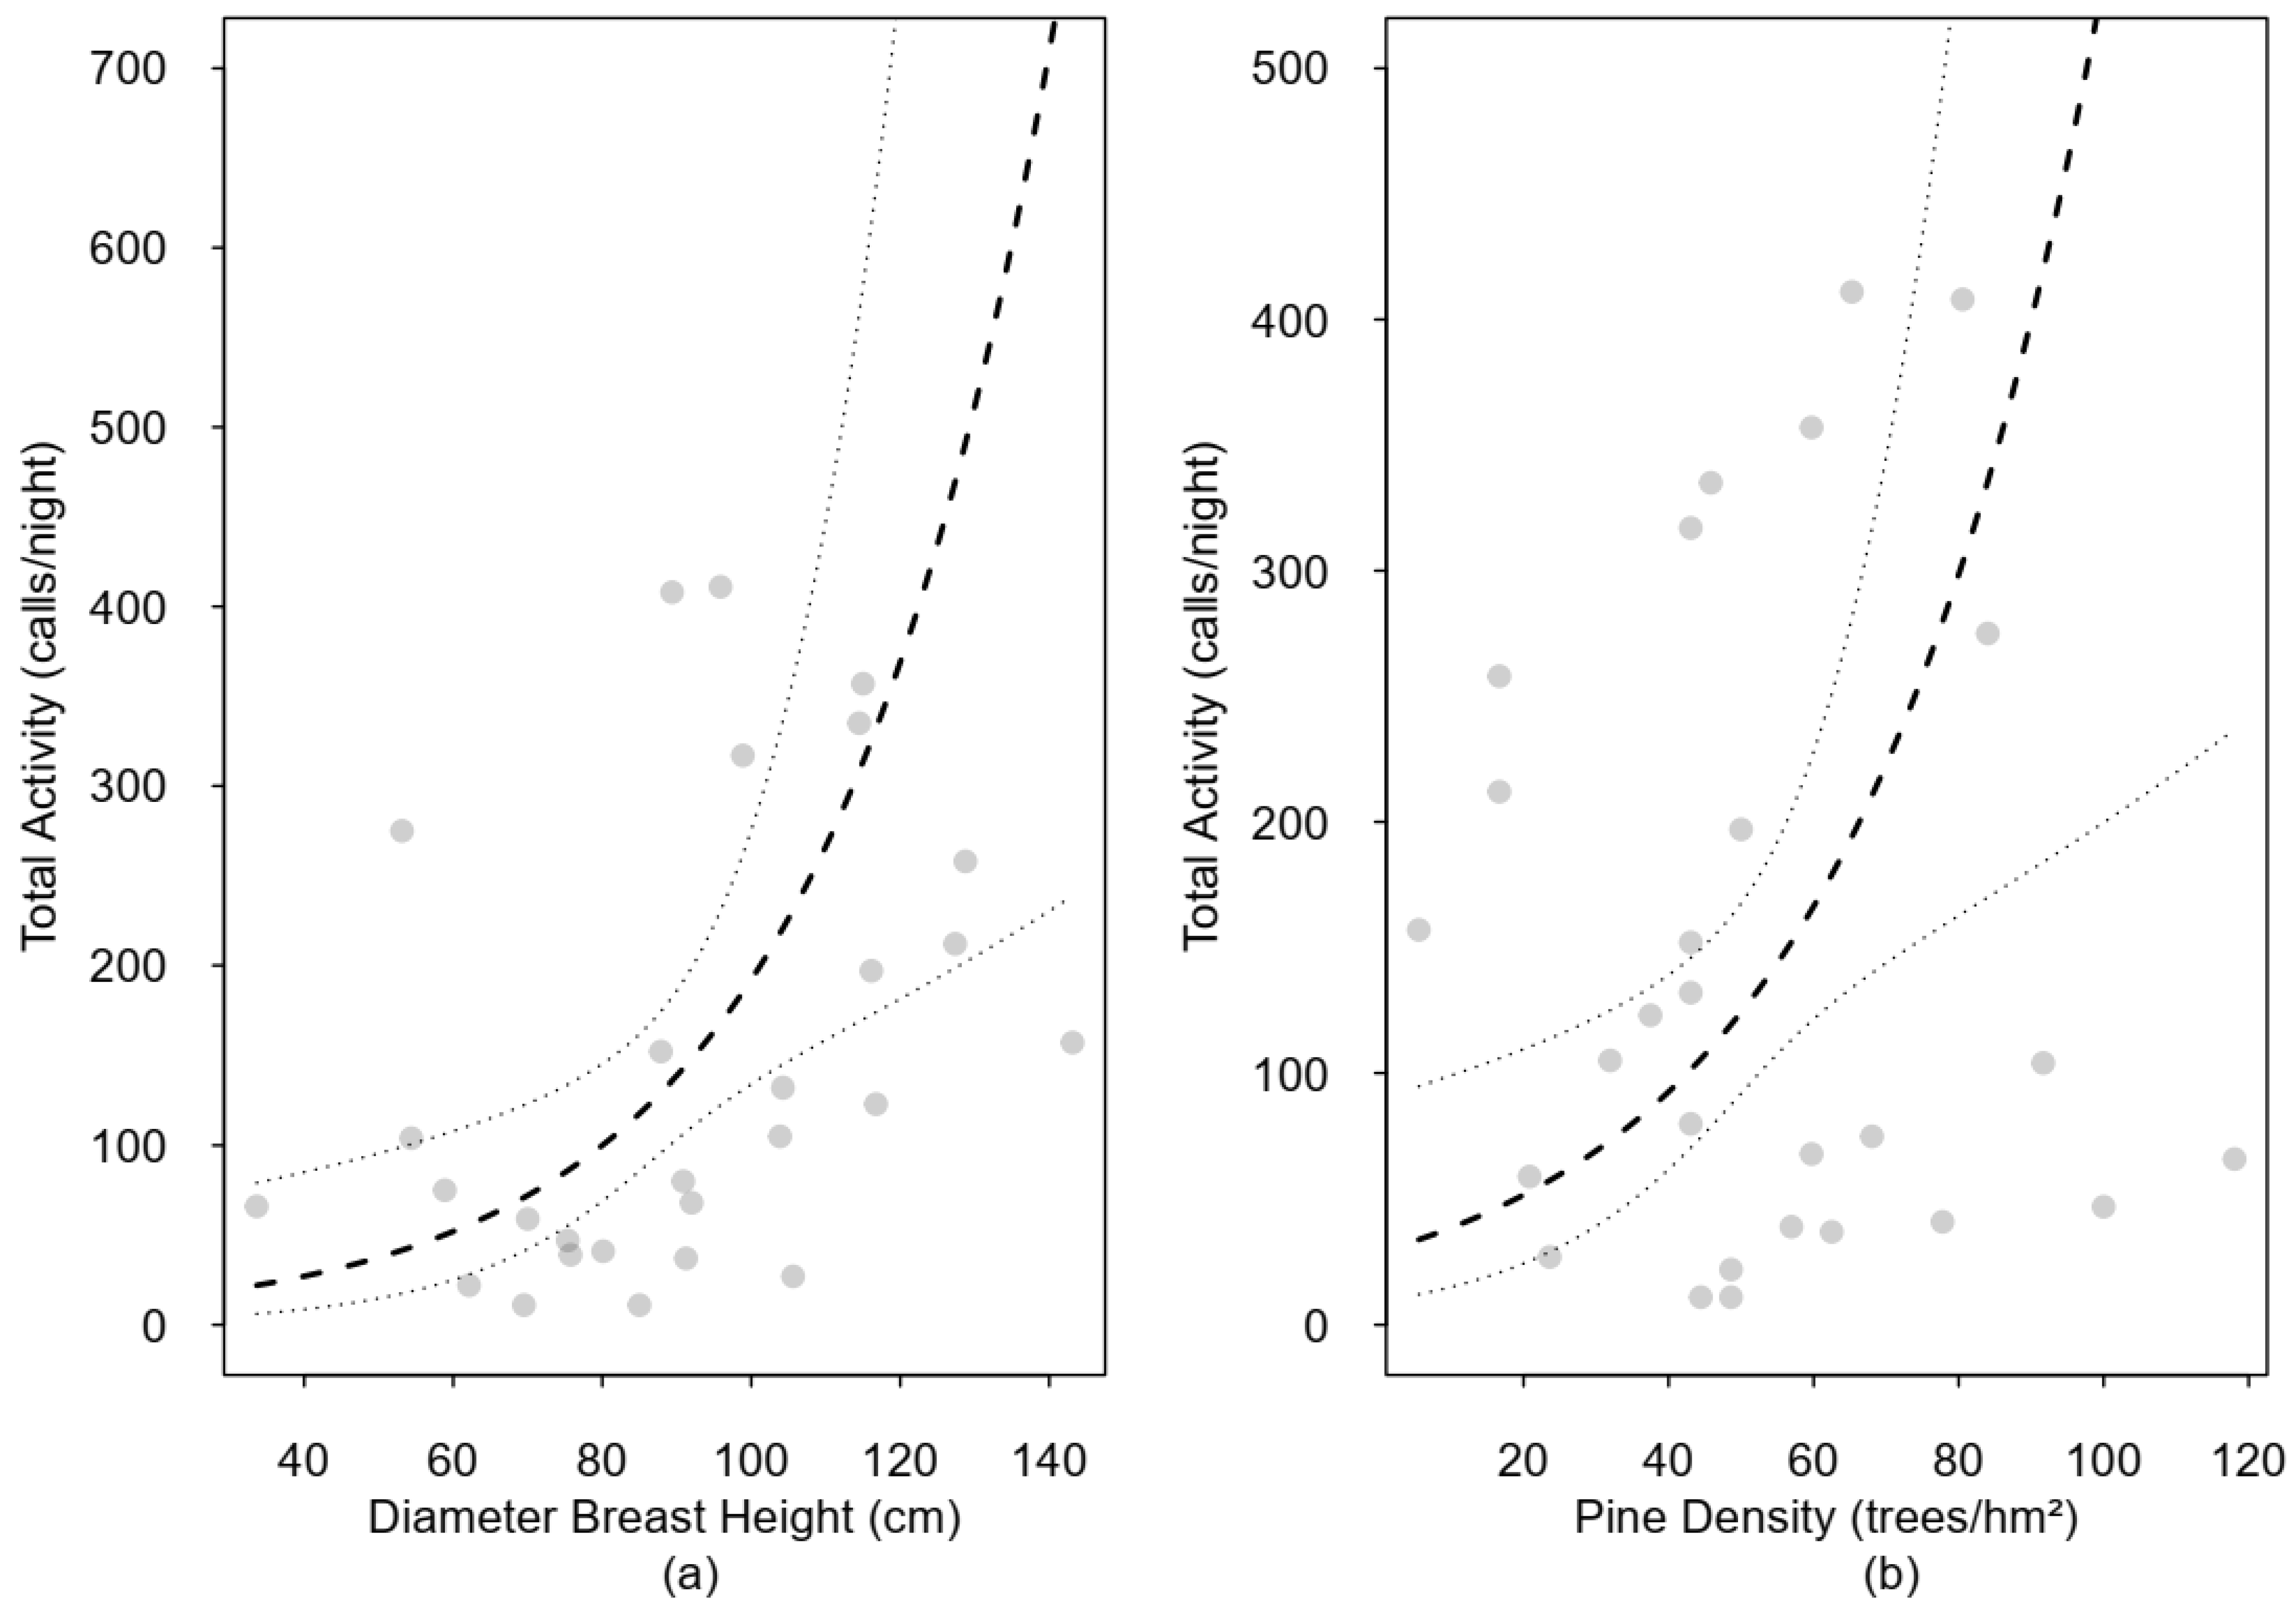
3.3. Total Activity and Forest Structure
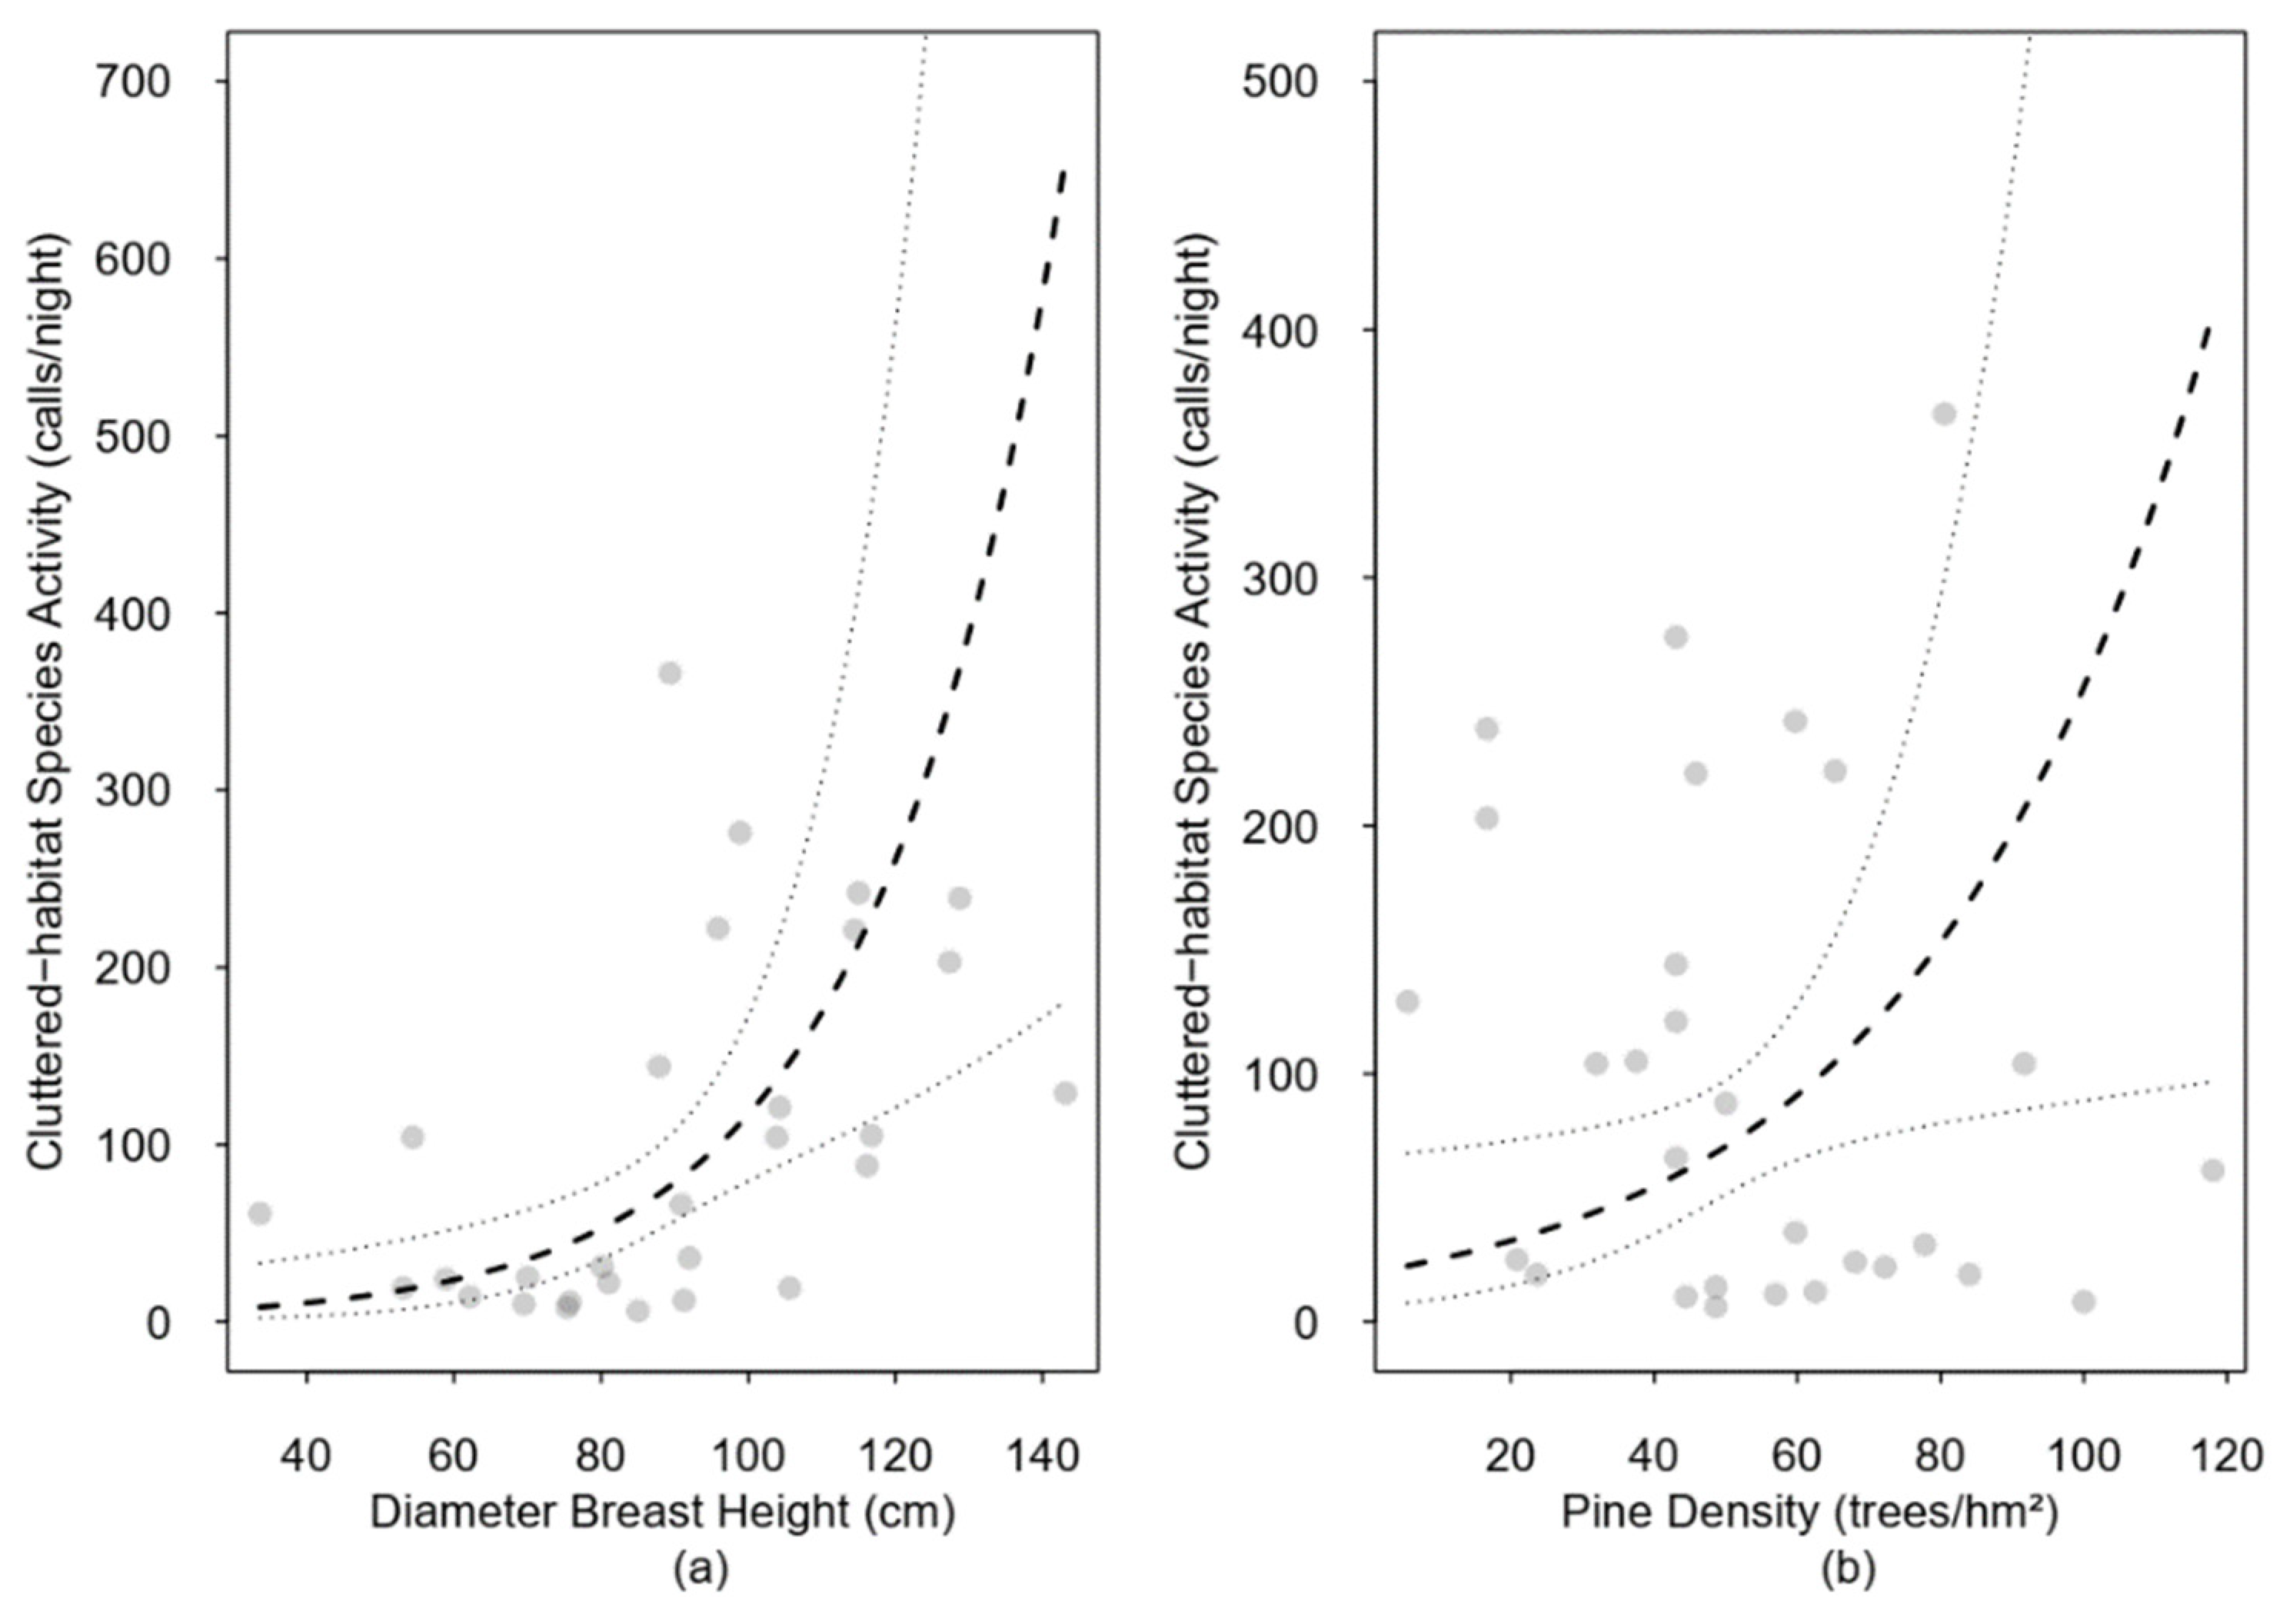
3.4. Species Composition and Forest Structure
3.5. Species-Level Effects of Forest Structure Variables
4. Discussion and Conclusions
4.1. Species Richness and Forest Structure
4.2. Total Activity and Forest Structure
4.3. Species Composition and Forest Structure
Supplementary Materials
Author Contributions
Funding
Data Availability Statement
Acknowledgments
Conflicts of Interest
References
- Altringham, J.D. Bats: From Evolution to Conservation, 2nd ed.; Oxford University Press: Oxford, UK, 2011. [Google Scholar]
- Russo, D.; Billington, G.; Bontadina, F.; Dekker, J.; Dietz, M.; Gazaryan, S.; Jones, G.; Meschede, A.; Rebelo, H.; Reiter, G. Identifying key research objectives to make European forests greener for bats. Front. Ecol. Evol. 2016, 4, 87. [Google Scholar] [CrossRef]
- Dietz, M.; Hörig, A. Thermoregulation of tree-dwelling temperate bats—A behavioural adaptation to force live history strategy. Folia Zool. 2011, 60, 5–16. [Google Scholar] [CrossRef]
- Kalda, R.; Kalda, O.; Lõhmus, K.; Liira, J. Multi-scale ecology of woodland bat the role of species pool, landscape complexity and stand structure. Biodivers. Conserv. 2015, 24, 337–353. [Google Scholar] [CrossRef]
- Cryan, P.M.; Veilleux, J. Migration and the use of autumn, winter, and spring roosts by tree bats. In Bats in Forests; Johns Hopkins University Press: Baltimore, MA, USA, 2007; pp. 153–175. [Google Scholar]
- Sagot, M.; Chaverri, G. Effects of roost specialization on extinction risk in bats. Conserv. Biol. 2015, 29, 1666–1673. [Google Scholar] [CrossRef] [PubMed]
- Leidinger, J.; Weisser, W.W.; Kienlein, S.; Blaschke, M.; Jung, K.; Kozak, J.; Fischer, A.; Mosandl, R.; Michler, B.; Ehrhardt, M.; et al. Formerly managed forest reserves complement integrative management for biodiversity conservation in temperate European forests. Biol. Conserv. 2020, 242, 9. [Google Scholar] [CrossRef]
- von Hirschheydt, G.; Kindvall, O.; de Jong, J. Testing bat abundance and diversity predictions by PREBAT, a connectivity-based habitat suitability model for insectivorous bats. Eur. J. Wildl. Res. 2020, 66, 14. [Google Scholar] [CrossRef]
- Ampoorter, E.; Barbaro, L.; Jactel, H.; Baeten, L.; Boberg, J.; Carnol, M.; Castagneyrol, B.; Charbonnier, Y.; Dawud, S.M.; Deconchat, M.; et al. Tree diversity is key for promoting the diversity and abundance of forest-associated taxa in Europe. Oikos 2020, 129, 133–146. [Google Scholar] [CrossRef]
- Atauri, J.A.; de Pablo, C.L.; de Agar, P.M.; Schmitz, M.F.; Pineda, F.D. Effects of management on understory diversity in the forest ecosystems of northern Spain. Environ. Manag. 2004, 34, 819–828. [Google Scholar] [CrossRef]
- Baker, A.G.; Catterall, C.; Benkendorff, K.; Law, B. No room to move: Bat response to rainforest expansion into long-unburnt eucalypt forest. Pac. Conserv. Biol. 2021, 27, 13–26. [Google Scholar] [CrossRef]
- Law, B.; Chidel, M.; Brassil, M.T.; Potter, T. Changes in bat activity over 10 years in silviculturally treated wet sclerophyll forest. Aust. Mammal. 2021, 43, 179–189. [Google Scholar] [CrossRef]
- Jimenez, M.N.; Spotswood, E.N.; Canadas, E.M.; Navarro, F.B. Stand management to reduce fire risk promotes understorey plant diversity and biomass in a semi-arid Pinus halepensis plantation. Appl. Veget. Sci. 2015, 18, 467–480. [Google Scholar] [CrossRef]
- Loeb, S.C. Qualitative synthesis of temperate bat responses to silvicultural treatments—Where do we go from here? J. Mammal. 2020, 101, 1513–1525. [Google Scholar] [CrossRef]
- Starik, N.; Göttert, T.; Heitlinger, E.; Zeller, U. Bat community responses to structural habitat complexity resulting from management practices within different land use types—A case study from North-Eastern Germany. Acta Chiropt. 2018, 20, 387–405. [Google Scholar] [CrossRef]
- Broken-Brow, J.; Hitch, A.T.; Armstrong, K.N.; Leung, L.K.P. Effect of fire on insectivorous bat activity in northern Australia: Does fire intensity matter on a local scale? Aust. J. Zool. 2019, 67, 260–268. [Google Scholar] [CrossRef]
- Habel, J.C.; Samways, M.J.; Schmitt, T. Mitigating the precipitous decline of terrestrial European insects: Requirements for a new strategy. Biodivers. Conserv. 2019, 28, 1343–1360. [Google Scholar] [CrossRef]
- Wegiel, A.; Grzywinski, W.; Ciechanowski, M.; Jaros, R.; Kalcounis-Ruppell, M.; Kmiecik, A.; Kmiecik, P.; Wegiel, J. The foraging activity of bats in managed pine forests of different ages. Eur. J. For. Res. 2019, 138, 383–396. [Google Scholar] [CrossRef]
- Alder, D.C.; Poore, A.; Norrey, J.; Newson, S.E.; Marsden, S.J. Irregular silviculture positively influences multiple bat species in a lowland temperate broadleaf woodland. For. Ecol. Manag. 2021, 483, 118786. [Google Scholar] [CrossRef]
- Muller, J.; Mehr, M.; Bassler, C.; Fenton, M.B.; Hothorn, T.; Pretzsch, H.; Klemmt, H.J.; Brandl, R. Aggregative response in bats: Prey abundance versus habitat. Oecologia 2012, 169, 673–684. [Google Scholar] [CrossRef]
- Fenton, M.B.; Simmons, N.B. Bats: A World of Science and Mystery; University of Chicago Press: Chicago, IL, USA, 2015. [Google Scholar]
- Norberg, U.M.; Rayner, J.M. Ecological morphology and flight in bats (Mammalia; Chiroptera): Wing adaptations, flight performance, foraging strategy and echolocation. Philos. Trans. R. Soc. Lond. B Biol. Sci. 1987, 316, 335–427. [Google Scholar]
- Borkin, K.M.; Parsons, S. Home range and habitat selection by a threatened bat in exotic plantation forest. For. Ecol. Manag. 2011, 262, 845–852. [Google Scholar] [CrossRef]
- Jung, K.; Kaiser, S.; Böhm, S.; Nieschulze, J.; Kalko, E.K.V. Moving in three dimensions: Effects of structural complexity on occurrence and activity of insectivorous bats in managed forest stands. J. Appl. Ecol. 2012, 49, 523–531. [Google Scholar] [CrossRef]
- Adams, R.A.; Pedersen, S.C. Bat Evolution, Ecology, and Conservation; Springer: Berlin/Heidelberg, Germany, 2013. [Google Scholar]
- Denzinger, A.; Schnitzler, H.-U. Bat guilds, a concept to classify the highly diverse foraging and echolocation behaviors of microchiropteran bats. Front. Physiol. 2013, 4, 164. [Google Scholar] [CrossRef] [PubMed]
- Park, K.J. Mitigating the impacts of agriculture on biodiversity: Bats and their potential role as bioindicators. Mamm. Biol. 2015, 80, 191–204. [Google Scholar] [CrossRef]
- Gregorin, R.; Bernard, E.; Lobao, K.W.; Oliveira, L.F.; Machado, F.S.; Gil, B.B.; da Cunha Tavares, V. Vertical stratification in bat assemblages of the Atlantic Forest of south-eastern Brazil. J. Trop. Ecol. 2017, 33, 299–308. [Google Scholar] [CrossRef]
- Law, B.; Chidel, M. Tracks and riparian zones facilitate the use of Australian regrowth forest by insectivorous bats. J. Appl. Ecol. 2002, 39, 605–617. [Google Scholar] [CrossRef]
- Korine, C.; Kalko, E.K.V. Fruit detection and discrimination by small fruit-eating bats (Phyllostomidae): Echolocation call design and olfaction. Behav. Ecol. Sociobiol. 2005, 59, 12–23. [Google Scholar] [CrossRef]
- Yates, M.; Muzika, R. Effect of forest structure and fragmentation on site occupancy of bat species in Missouri Ozark forests. J. Wildl. Manag. 2006, 70, 1238–1248. [Google Scholar] [CrossRef]
- Luszcz, T.M.J.; Barclay, R.M.R. Influence of forest composition and age on habitat use by bats in southwestern British Columbia. Can. J. Zool. 2016, 94, 145–153. [Google Scholar] [CrossRef]
- Wojciuch-Ploskonka, M. Bats in Niepolomicka Forest. Sylwan 2019, 163, 348–352. [Google Scholar] [CrossRef]
- Limpert, D.L.; Birch, D.L.; Scott, M.S.; Andre, M.; Gillam, E. Tree selection and landscape analysis of eastern red bat day roosts. J. Wildl. Manag. 2007, 71, 478–486. [Google Scholar] [CrossRef]
- Kalcounis-Rueppell, M.C.; Briones, K.M.; Homyack, J.A.; Petric, R.; Marshall, M.M.; Miller, D.A. Hard Forest Edges Act as Conduits, Not Filters, for Bats. Wildl. Soc. Bull. 2013, 37, 571–576. [Google Scholar] [CrossRef]
- Kubista, C.E.; Bruckner, A. Importance of urban trees and buildings as daytime roosts for bats. Biologia 2015, 70, 1545–1552. [Google Scholar] [CrossRef]
- Verboom, B.; Huitema, H. The importance of linear landscape elements for the pipistrelle Pipistrellus pipistrellus and the serotine bat Eptesicus serotinus. Landsc. Ecol. 1997, 12, 117–125. [Google Scholar] [CrossRef]
- Kalacska, M.; Sanchez-Azofeifa, G.A.; Calvo-Alvarado, J.C.; Quesada, M.; Rivard, B.; Janzen, D.H. Species composition, similarity and diversity in three successional stages of a seasonally dry tropical forest. For. Ecol. 2004, 200, 227–247. [Google Scholar] [CrossRef]
- Lindenmayer, D.B.; Laurance, W.F.; Franklin, J.F.J.S. Global decline in large old trees. Science 2012, 338, 1305–1306. [Google Scholar] [CrossRef]
- Fleming, H.L.; Jones, J.C. Multi-scale roost site selection by Rafinesque’s big-eared bat (Corynorhinus rafinesquii) and southeastern myotis (Myotis austroriparius) in Mississippi. Am. Midl. Nat. 2013, 169, 43–55. [Google Scholar] [CrossRef]
- Adams, M.D.; Law, B.S. Adams, M.D.; Law, B.S. A preliminary assessment of the impact of forest thinning on bat activity: Towards improved clutter-based hypotheses. In The Biology and Conservation of Australasian Bats; Law, B., Eby, P., Lunney, D., Lumsde, L., Eds.; Royal Zoological Society of NSW: Mosman, Australia, 2011; pp. 363–379. [Google Scholar]
- Hartley, M.J. Rationale and methods for conserving biodiversity in plantation forests. For. Ecol. Manag. 2002, 155, 81–95. [Google Scholar] [CrossRef]
- Lantschner, M.V.; Rusch, V.; Peyrou, C. Bird assemblages in pine plantations replacing native ecosystems in NW Patagonia. Biodivers. Conserv. 2008, 17, 969–989. [Google Scholar] [CrossRef]
- Charbonnier, Y.; Gauzere, P.; van Halder, I.; Nezan, J.; Barnagaud, J.Y.; Jactel, H.; Barbaro, L. Deciduous trees increase bat diversity at stand and landscape scales in mosaic pine plantations. Landsc. Ecol. 2016, 31, 291–300. [Google Scholar] [CrossRef]
- Barrios-Gómez, K.M.; López-Wilchis, R.; Díaz-Larrea, J.; Guevara-Chumacero, L.M. Spatial distribution of bat richness in Mexico at different taxonomic levels: Biogeographical and conservation implications. Therya 2019, 10, 11–24. [Google Scholar] [CrossRef]
- Gangenova, E.; Giombini, M.I.; Zurita, G.A.; Marangoni, F. Morphological responses of three persistent native anuran species after forest conversion into monoculture pine plantations: Tolerance or prosperity? Integr. Zool. 2020, 15, 428–440. [Google Scholar] [CrossRef] [PubMed]
- Loy, X.W.; Gruenewald, D.; Gottlieb, I.G.W.; Dobbs, E.K.; Miljanic, A.S.; Botsch, J.; Lawley, B.; Ober, H.K.; Smith, L.; Fletcher, R.J.; et al. The impacts of bioenergy pine plantation management practices on bee communities. J. Appl. Ecol. 2020, 57, 952–962. [Google Scholar] [CrossRef]
- Rodriguez-San Pedro, A.; Simonetti, J.A. Does understory clutter reduce bat activity in forestry pine plantations? Eur. J. Wildl. Res. 2015, 61, 177–179. [Google Scholar] [CrossRef]
- Osem, E.; Brand, D.; Tauber, I.; Pervolotsky, A.; Zoref, H. Forest Management Policy of Israel: Guidelines for Planning and Management; Jewish National Fund: Jerusalem, Israel, 2014. [Google Scholar]
- Osem, Y.; Zangy, E.; Bney-Moshe, E.; Moshe, Y.; Karni, N.; Nisan, Y. The potential of transforming simple structured pine plantations into mixed Mediterranean forests through natural regeneration along a rainfall gradient. For. Ecol. 2009, 259, 14–23. [Google Scholar] [CrossRef]
- Sternberg, M.; Gabay, O.; Angel, D.; Barneah, O.; Gafny, S.; Gasith, A.; Grunzweig, J.M.; Hershkovitz, Y.; Israel, A.; Milstein, D.; et al. Impacts of climate change on biodiversity in Israel: An expert assessment approach. Reg. Environ. Chang. 2015, 15, 895–906. [Google Scholar] [CrossRef]
- Rehm, E.M.; Olivas, P.; Stroud, J.; Feeley, K.J. Losing your edge: Climate change and the conservation value of range-edge populations. Ecol. Evol. 2015, 5, 4315–4326. [Google Scholar] [CrossRef] [PubMed]
- Bartlett, M.K.; Zhang, Y.; Yang, J.; Kreidler, N.; Sun, S.W.; Lin, L.; Hu, Y.H.; Cao, K.F.; Sack, L. Drought tolerance as a driver of tropical forest assembly: Resolving spatial signatures for multiple processes. Ecology 2016, 97, 503–514. [Google Scholar] [CrossRef]
- Osem, Y.; Fogel, T.; Moshe, Y.; Ashkenazi, M.; Brant, S. Understory structure and function following release from cattle grazing and overstory thinning in Mediterranean conifer plantations. Ann. For. Sci. 2017, 74, 22. [Google Scholar] [CrossRef]
- Goldreich, Y. The Climate of Israel: Observation, Research and Application; Kluwer Academic/Plenum Publishers, Ed.; Springer Science & Business Media: New York, NY, USA, 2012; p. 298. [Google Scholar]
- Benda, P.; Dietz, C.; Andreas, M.; Hotový, J.; Lučan, R.; Maltby, A.; Meakin, K.; Truscott, J.; Vallo, P. Bats (Mammalia: Chiroptera) of the Eastern Mediterranean and Middle East. Part 6. Bats of Sinai (Egypt) with some taxonomic, ecological and echolocation data on that fauna. Acta Soc. Zool. Bohem. 2008, 72, 1–103. [Google Scholar]
- Russo, D.; Jones, G. Identification of twenty-two bat species (Mammalia: Chiroptera) from Italy by analysis of time-expanded recordings of echolocation calls. J. Zool. 2002, 258, 91–103. [Google Scholar] [CrossRef]
- Hackett, T.D.; Holderied, M.W.; Korine, C. Echolocation call description of 15 species of Middle-Eastern desert dwelling insectivorous bats. Bioacoustics 2017, 26, 217–235. [Google Scholar] [CrossRef]
- Canfield, R. Application of the line interception method in sampling range vegetation. J. For. 1941, 39, 388–394. [Google Scholar]
- Forstmeier, W.; Schielzeth, H. Cryptic multiple hypotheses testing in linear models: Overestimated effect sizes and the winner’s curse. Behav. Ecol. Sociobiol. 2011, 65, 47–55. [Google Scholar] [CrossRef] [PubMed] [Green Version]
- Zuur, A.F.; Ieno, E.N.; Elphick, C. A protocol for data exploration to avoid common statistical problems. Meth. Ecol. Evol. 2010, 1, 3–14. [Google Scholar] [CrossRef]
- R Core Team. R: A Language Environment for Statistical Computing; R Foundation for Statistical Computing: Vienna, Austria, 2021. [Google Scholar]
- Bates, D.; Mächler, M.; Bolker, B.; Walker, S. Fitting linear mixed-effects models using lme4. arXiv 2014, arXiv:1406.5823. [Google Scholar]
- Venables, W.N.; Ripley, B.D. Random and mixed effects. In Modern Applied Statistics with S; Springer: Berlin/Heidelberg, Germany, 2002; pp. 271–300. [Google Scholar]
- Sakamoto, Y.; Ishiguro, M.; Kitagawa, G. Akaike Information Criterion Statistics; D. Reidel: Dordrecht, The Netherlands, 1986; Volume 81, p. 26853. [Google Scholar]
- Dobson, A.J.; Barnett, A.G. An Introduction to Generalized Linear Models; CRC Press: Boca Raton, FL, USA, 2018. [Google Scholar]
- Field, A. Discovering Statistics Using IBM SPSS Statistics; Sage: London, UK, 2013. [Google Scholar]
- Kotowska, D.; Zegarek, M.; Osojca, G.; Satory, A.; Part, T.; Zmihorski, M. Spatial patterns of bat diversity overlap with woodpecker abundance. PeerJ 2020, 8, e9385. [Google Scholar] [CrossRef]
- Sweeney, O.; Wilson, M.W.; Irwin, S.; Kelly, T.C.; O’Halloran, J. The influence of a native tree species mix component on bird communities in non-native coniferous plantations in Ireland. Bird Study 2010, 57, 483–494. [Google Scholar] [CrossRef]
- Dagan, U.; Izhaki, I. Understory vegetation in planted pine forests governs bird community composition and diversity in the eastern Mediterranean region. For. Ecosyst. 2019, 6, 16. [Google Scholar] [CrossRef]
- Tibbels, A.E.; Kurta, A. Bat activity is low in thinned and unthinned stands of red pine. Can. J. For. Res. 2003, 33, 2436–2442. [Google Scholar] [CrossRef]
- Johnson, S.A.; Chambers, C.L. Effects of ponderosa pine forest restoration on habitat for bats. West. N. Am. Nat. 2017, 77, 355–368. [Google Scholar] [CrossRef]
- Gonsalves, L.; Law, B.; Brassil, T.; Waters, C.; Toole, I.; Tap, P. Ecological outcomes for multiple taxa from silvicultural thinning of regrowth forest. For. Ecol. Manag. 2018, 425, 177–188. [Google Scholar] [CrossRef]
- Kirkpatrick, L.; Maher, S.J.; Lopez, Z.; Lintott, P.R.; Bailey, S.A.; Dent, D.; Park, K.J. Bat use of commercial coniferous plantations at multiple spatial scales: Management and conservation implications. Biol. Conserv. 2017, 206, 1–10. [Google Scholar] [CrossRef]
- Wood, H.; Lindborg, R.; Jakobsson, S. European Union tree density limits do not reflect bat diversity in wood-pastures. Biol. Conserv. 2017, 210, 60–71. [Google Scholar] [CrossRef]
- Menzel, J.M.; Menzel, M.A.; Kilgo, J.C.; Ford, W.M.; Edwards, J.W.; McCracken, G.F. Effect of habitat and foraging height on bat activity in the Coastal Plain of South Carolina. J. Wildl. Manag. 2005, 69, 235–245. [Google Scholar] [CrossRef]
- Rodriguez-San Pedro, A.; Simonetti, J.A. Foraging activity by bats in a fragmented landscape dominated by exotic pine plantations in central Chile. Acta Chiropt. 2013, 15, 393–398. [Google Scholar] [CrossRef]
- Peters, S.L.; Malcolm, J.R.; Zimmerman, B.L. Effects of selective logging on bat communities in the southeastern Amazon. Conserv. Biol. 2006, 20, 1410–1421. [Google Scholar] [CrossRef]
- Rodriguez, A.; Gasc, A.; Pavoine, S.; Grandcolas, P.; Gaucher, P.; Sueur, J. Temporal and spatial variability of animal sound within a neotropical forest. Ecol. Inform. 2014, 21, 133–143. [Google Scholar] [CrossRef]
- Marciente, R.; Bobrowiec, P.E.; Magnusson, W.E. Ground-Vegetation Clutter Affects Phyllostomid Bat Assemblage Structure in Lowland Amazonian Forest. PLoS ONE 2015, 10, e0129560. [Google Scholar] [CrossRef]
- Tanshi, I.; Kingston, T. Competitors versus filters: Drivers of non-random structure in forest interior insectivorous bat assemblages along elevational gradients. Bat Res. News 2019, 60, 74. [Google Scholar]
- Stevens, R.D.; Stuhler, J.D.; Grimshaw, J.R. Chiropteran metacommunity structure in the Atlantic Forest of South America. J. Biogeogr. 2020, 47, 2141–2155. [Google Scholar] [CrossRef]
- Simonetti, J.A.; Grez, A.A.; Estades, C.F. Providing Habitat for Native Mammals through Understory Enhancement in Forestry Plantations. Conserv. Biol. 2013, 27, 1117–1121. [Google Scholar] [CrossRef] [PubMed]

| Forest Variables | Description |
|---|---|
| Pine density | Number of pine trees (Pinus brutia or Pinus halepensis) in 60 × 60 m plots around the acoustic sampling point |
| Canopy closure index | Categories: (a) open (without any trees), (b) semi-closed (trees with few branches, the light can penetrate), closed (dense canopy, the light does not penetrate); measured along 40 m transects with five measurements every 8 m. |
| Vegetation cover | Four categories of vegetation cover that included bushes, trees, understory, and clearings (“no cover”). Additionally, we categorized the shrub cover as follows: 1: 0%–0%, 2: 40%–70%, and 3: 70%–100% and calculated the average value for each plot. We took the measurements along cross-transects (20 m) following the line interception method: with a tape measure recording where each plant begins and ends. We calculated the difference between the beginning and end to obtain the intercept [59]. When these intercepts are added and the sum divided by the total line length, the result is a percent cover estimate for a transect. |
| Accessibility index | Measurements of vegetation clutter taken every 8 m along a transect starting from the acoustic sampling point (total: 40 m). We recorded a categorical index at four heights (0.5 m, 2 m, 4 m, and more than 4 m) based on the following five categories: (a) no trees, or trees with 0 branches; (b) 1–2 branches; (c) 3–5 branches; (d) 6–8 branches, and (e) more than eight branches and we calculated the average value for each plot. |
| Tree diameter | Measured at 1 m and 1.5 m in height (DBH), on 2 pine trees for each direction on the cross-transect (N, S, W, E). |
| Model | Explanatory Variable | Est. | SE | 2.5% | 97.5% | z-Value | p-Value |
|---|---|---|---|---|---|---|---|
| Species richness | Intercept | 5.10 | 0.23 | 4.63 | 5.58 | 22.48 | 0.00 |
| Understory | −0.04 | 0.32 | −0.71 | 0.63 | −0.13 | 0.90 | |
| Pine density | 0.30 | 0.42 | −0.57 | 1.17 | 0.71 | 0.49 | |
| DBH | 0.90 | 0.40 | 0.07 | 1.74 | 2.25 | 0.04 | |
| Canopy closure | 0.66 | 0.34 | −0.05 | 1.37 | 1.92 | 0.07 | |
| Accessibility | −0.73 | 0.37 | −1.49 | 0.04 | −1.97 | 0.06 | |
| Shrub cover | 0.63 | 0.26 | 0.08 | 1.18 | 2.40 | 0.03 | |
| Bushes | −0.21 | 0.24 | −0.71 | 0.29 | −0.88 | 0.39 | |
| Total activity | Intercept | 138.77 | 0.14 | 105.67 | 182.24 | 35.48 | 0.00 |
| Understory | 1.06 | 0.20 | 0.72 | 1.56 | 0.29 | 0.77 | |
| Pine density | 2.14 | 0.26 | 1.29 | 3.55 | 2.96 | 0.00 | |
| DBH | 2.26 | 0.25 | 1.39 | 3.67 | 3.30 | 0.00 | |
| Canopy closure | 1.18 | 0.21 | 0.78 | 1.78 | 0.79 | 0.43 | |
| Accessibility | 1.02 | 0.23 | 0.65 | 1.59 | 0.08 | 0.94 | |
| Shrub cover | 1.43 | 0.16 | 1.04 | 1.97 | 2.22 | 0.03 | |
| Bushes | 1.09 | 0.15 | 0.82 | 1.46 | 0.61 | 0.54 | |
| Cluttered-habitat species | Intercept | 79.06 | 0.15 | 59.04 | 105.88 | 29.33 | 0.00 |
| Understory | 1.24 | 0.21 | 0.82 | 1.87 | 1.02 | 0.31 | |
| Pine density | 1.95 | 0.28 | 1.13 | 3.35 | 2.42 | 0.02 | |
| DBH | 2.95 | 0.27 | 1.75 | 4.96 | 4.08 | 0.00 | |
| Canopy closure | 0.90 | 0.23 | 0.58 | 1.40 | −0.47 | 0.64 | |
| Accessibility | 0.85 | 0.24 | 0.53 | 1.37 | −0.66 | 0.51 | |
| Shrub cover | 1.01 | 0.17 | 0.72 | 1.42 | 0.07 | 0.95 | |
| Bushes | 0.94 | 0.16 | 0.69 | 1.28 | −0.40 | 0.69 | |
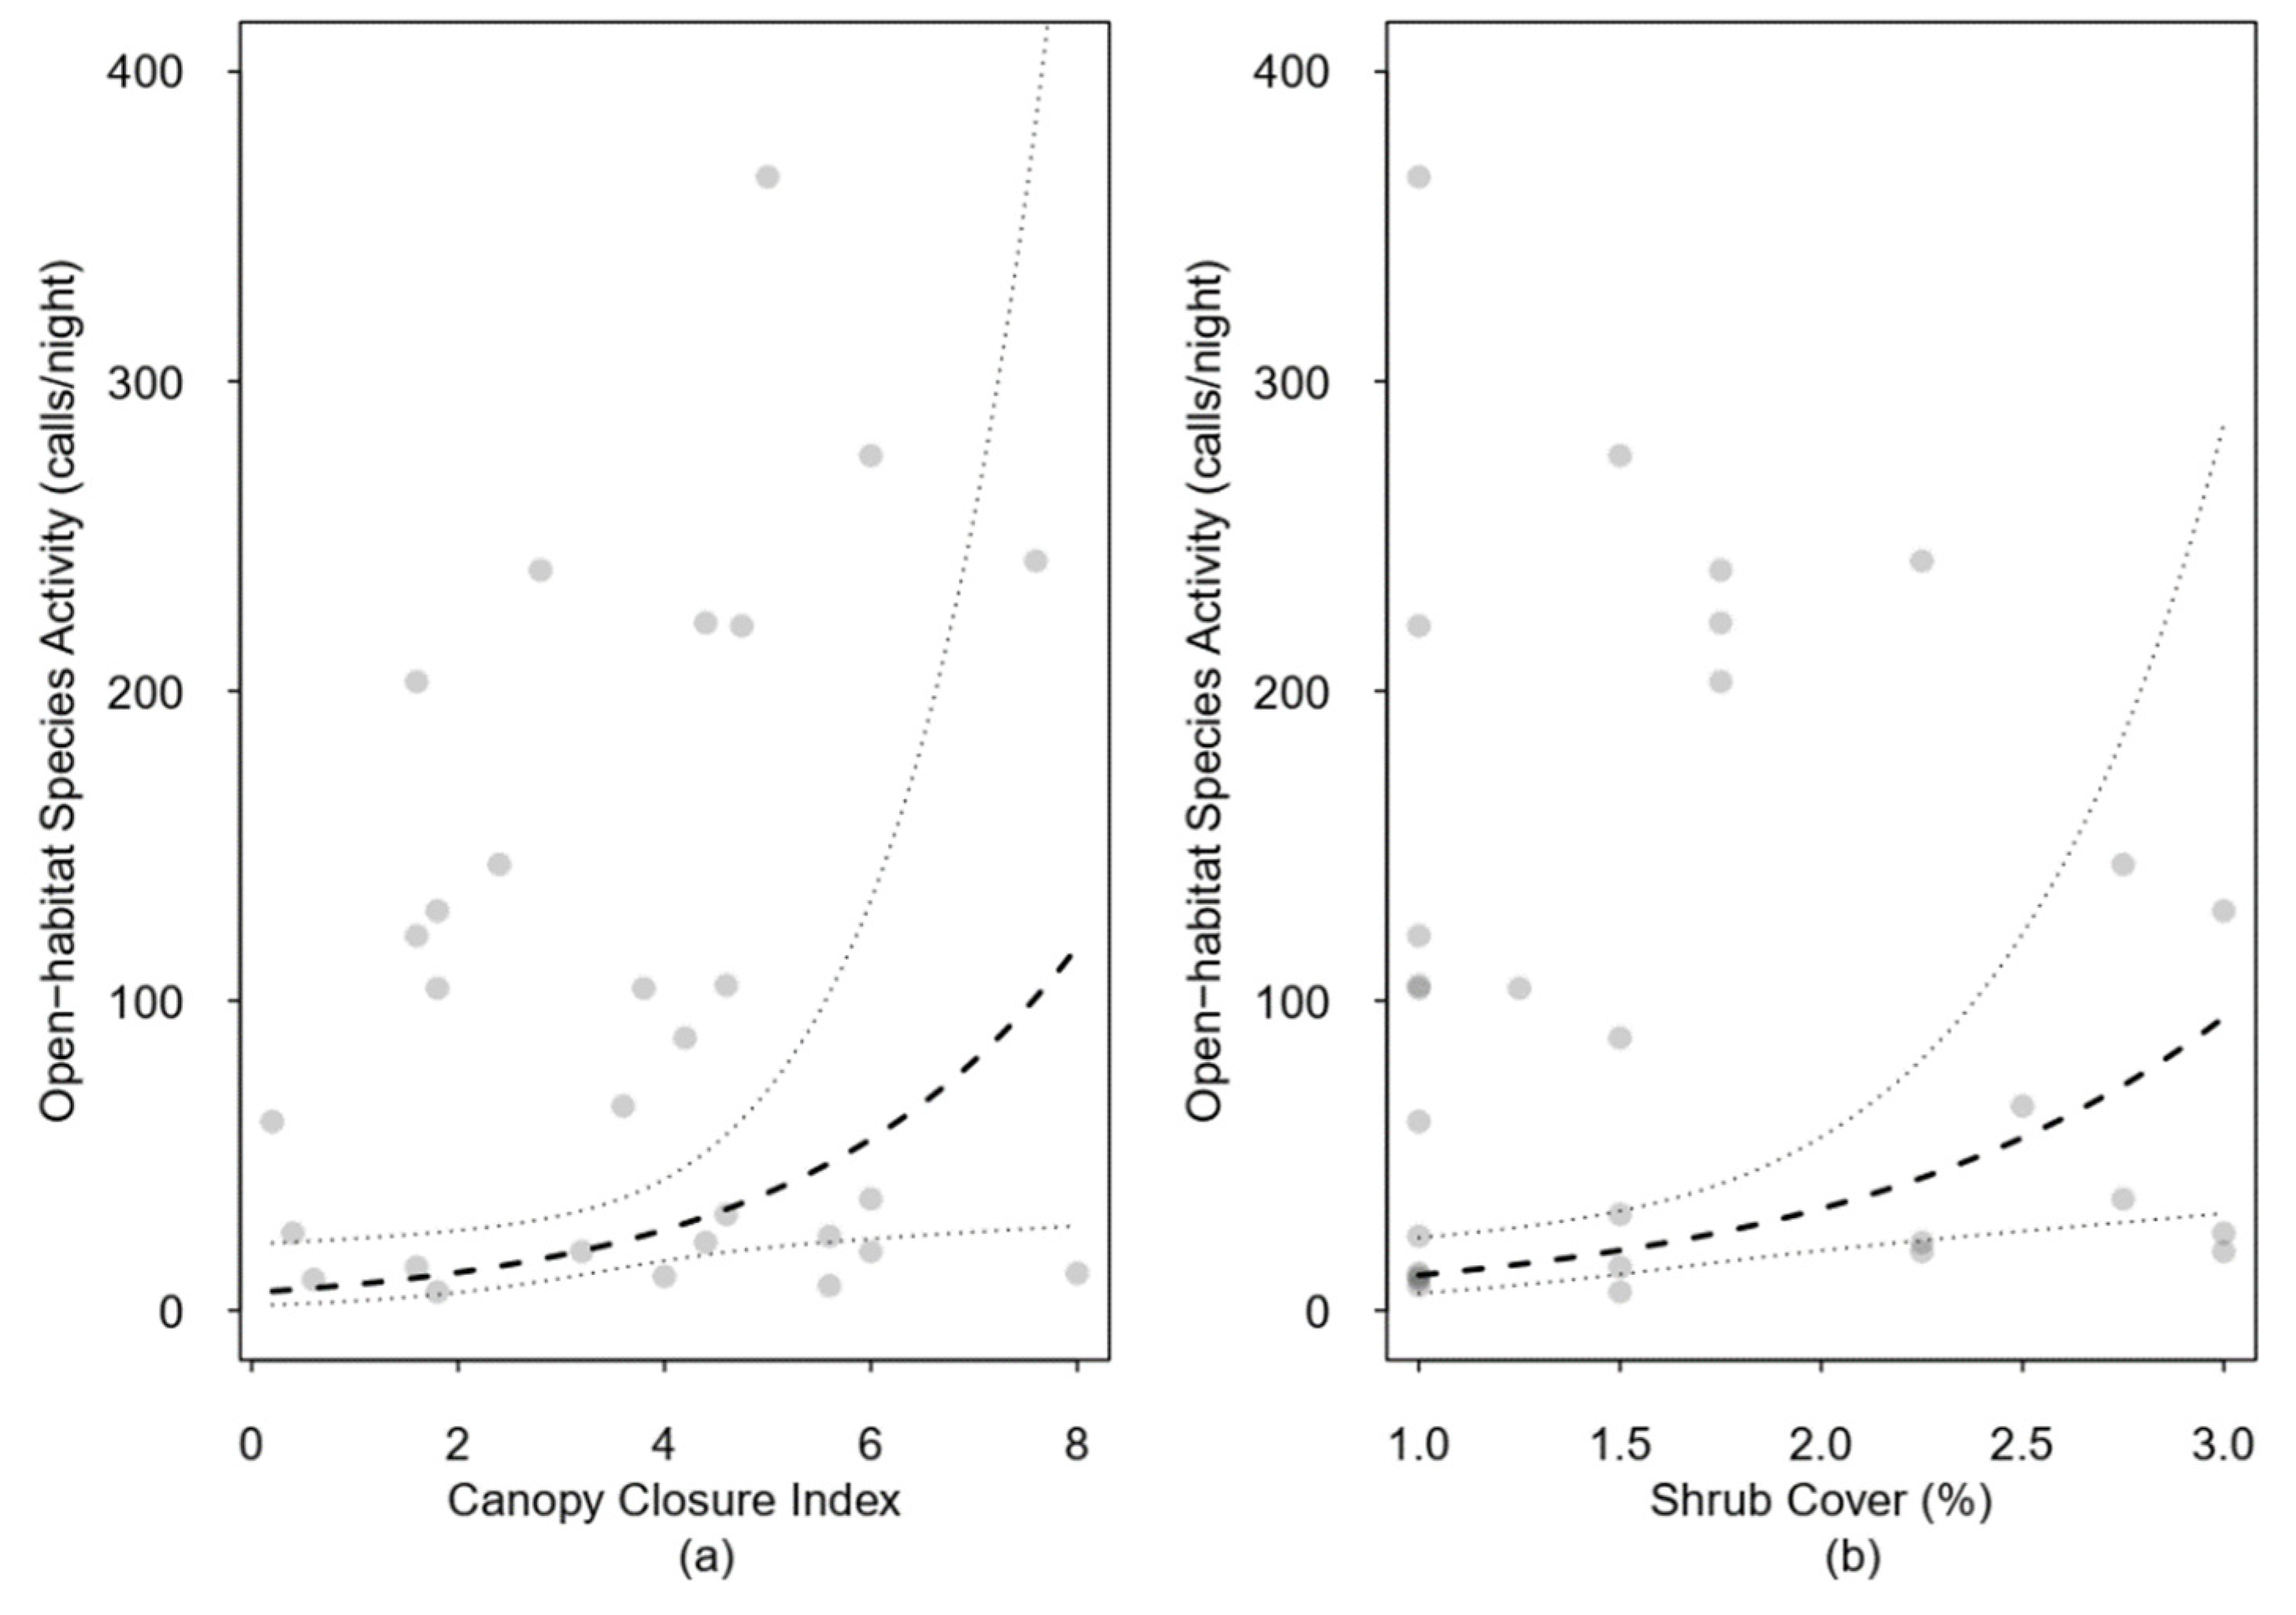
| Open-habitat species | Intercept | 23.47 | 0.20 | 14.93 | 36.88 | 18.21 | 0.00 |
| Understory | 0.74 | 0.28 | 0.39 | 1.39 | −0.42 | 0.67 | |
| Pine density | 1.91 | 0.37 | 0.82 | 4.45 | 1.65 | 0.10 | |
| DBH | 1.79 | 0.35 | 0.80 | 4.01 | 1.11 | 0.27 | |
| Canopy closure | 2.39 | 0.30 | 1.21 | 4.72 | 3.24 | 0.00 | |
| Accessibility | 0.91 | 0.32 | 0.44 | 1.90 | −0.35 | 0.72 | |
| Shrub cover | 2.12 | 0.23 | 1.25 | 3.58 | 2.64 | 0.01 | |
| Bushes | 1.32 | 0.21 | 0.82 | 2.12 | 1.74 | 0.08 |
| Model | Explanatory Variable | Est. | SE | 2.5% | 97.5% | z-Value | p-Value |
|---|---|---|---|---|---|---|---|
| Pipistrellus kuhlii | Intercept | 49.65 | 0.17 | 35.43 | 69.56 | 22.69 | 0.00 |
| Understory | 0.78 | 0.26 | 0.47 | 1.31 | −0.93 | 0.35 | |
| Pine density | 1.64 | 0.31 | 0.88 | 3.06 | 1.55 | 0.12 | |
| DBH | 2.90 | 0.31 | 1.58 | 5.33 | 3.43 | 0.00 | |
| Canopy closure | 0.82 | 0.24 | 0.51 | 1.32 | −0.83 | 0.41 | |
| Accessibility | 0.80 | 0.27 | 0.47 | 1.36 | −0.83 | 0.40 | |
| Shrub cover | 0.97 | 0.19 | 0.66 | 1.43 | −0.15 | 0.88 | |
| Bushes | 0.98 | 0.18 | 0.69 | 1.40 | −0.10 | 0.92 | |
| Eptesicus Serotinus | Intercept | 9.20 | 0.23 | 5.78 | 14.65 | 9.36 | 0.00 |
| Understory | 1.36 | 0.34 | 0.69 | 2.67 | 0.89 | 0.38 | |
| Pine density | 2.52 | 0.46 | 1.02 | 6.24 | 2.01 | 0.04 | |
| DBH | 3.53 | 0.46 | 1.43 | 8.69 | 2.74 | 0.01 | |
| Canopy closure | 0.62 | 0.32 | 0.33 | 1.18 | −1.46 | 0.15 | |
| Accessibility | 2.39 | 0.36 | 1.17 | 4.88 | 2.39 | 0.02 | |
| Shrub cover | 0.64 | 0.28 | 0.37 | 1.11 | −1.59 | 0.11 | |
| Bushes | 1.55 | 0.24 | 0.97 | 2.48 | 1.82 | 0.07 | |
| Pipistrellus Pipistrellus | Intercept | 2.64 | 0.33 | 1.39 | 5.04 | 2.95 | 0.00 |
| Understory | 0.92 | 0.44 | 0.39 | 2.18 | −0.19 | 0.85 | |
| Pine density | 6.12 | 0.59 | 1.93 | 19.37 | 3.08 | 0.00 | |
| DBH | 7.07 | 0.62 | 2.12 | 23.61 | 3.18 | 0.00 | |
| Canopy closure | 2.07 | 0.39 | 0.96 | 4.49 | 1.85 | 0.06 | |
| Accessibility | 0.34 | 0.52 | 0.12 | 0.95 | −2.06 | 0.04 | |
| Shrub cover | 1.05 | 0.35 | 0.53 | 2.07 | 0.14 | 0.89 | |
| Bushes | 0.35 | 0.37 | 0.17 | 0.73 | −2.81 | 0.00 |
Publisher’s Note: MDPI stays neutral with regard to jurisdictional claims in published maps and institutional affiliations. |
© 2022 by the authors. Licensee MDPI, Basel, Switzerland. This article is an open access article distributed under the terms and conditions of the Creative Commons Attribution (CC BY) license (https://creativecommons.org/licenses/by/4.0/).
Share and Cite
Allegrini, C.; Korine, C.; Krasnov, B.R. Insectivorous Bats in Eastern Mediterranean Planted Pine Forests—Effects of Forest Structure on Foraging Activity, Diversity, and Implications for Management Practices. Forests 2022, 13, 1411. https://doi.org/10.3390/f13091411
Allegrini C, Korine C, Krasnov BR. Insectivorous Bats in Eastern Mediterranean Planted Pine Forests—Effects of Forest Structure on Foraging Activity, Diversity, and Implications for Management Practices. Forests. 2022; 13(9):1411. https://doi.org/10.3390/f13091411
Chicago/Turabian StyleAllegrini, Claudia, Carmi Korine, and Boris R. Krasnov. 2022. "Insectivorous Bats in Eastern Mediterranean Planted Pine Forests—Effects of Forest Structure on Foraging Activity, Diversity, and Implications for Management Practices" Forests 13, no. 9: 1411. https://doi.org/10.3390/f13091411
APA StyleAllegrini, C., Korine, C., & Krasnov, B. R. (2022). Insectivorous Bats in Eastern Mediterranean Planted Pine Forests—Effects of Forest Structure on Foraging Activity, Diversity, and Implications for Management Practices. Forests, 13(9), 1411. https://doi.org/10.3390/f13091411