Vegetation Dynamics in the Qinling-Daba Mountains through Climate Warming with Land-Use Policy


Abstract
:1. Introduction
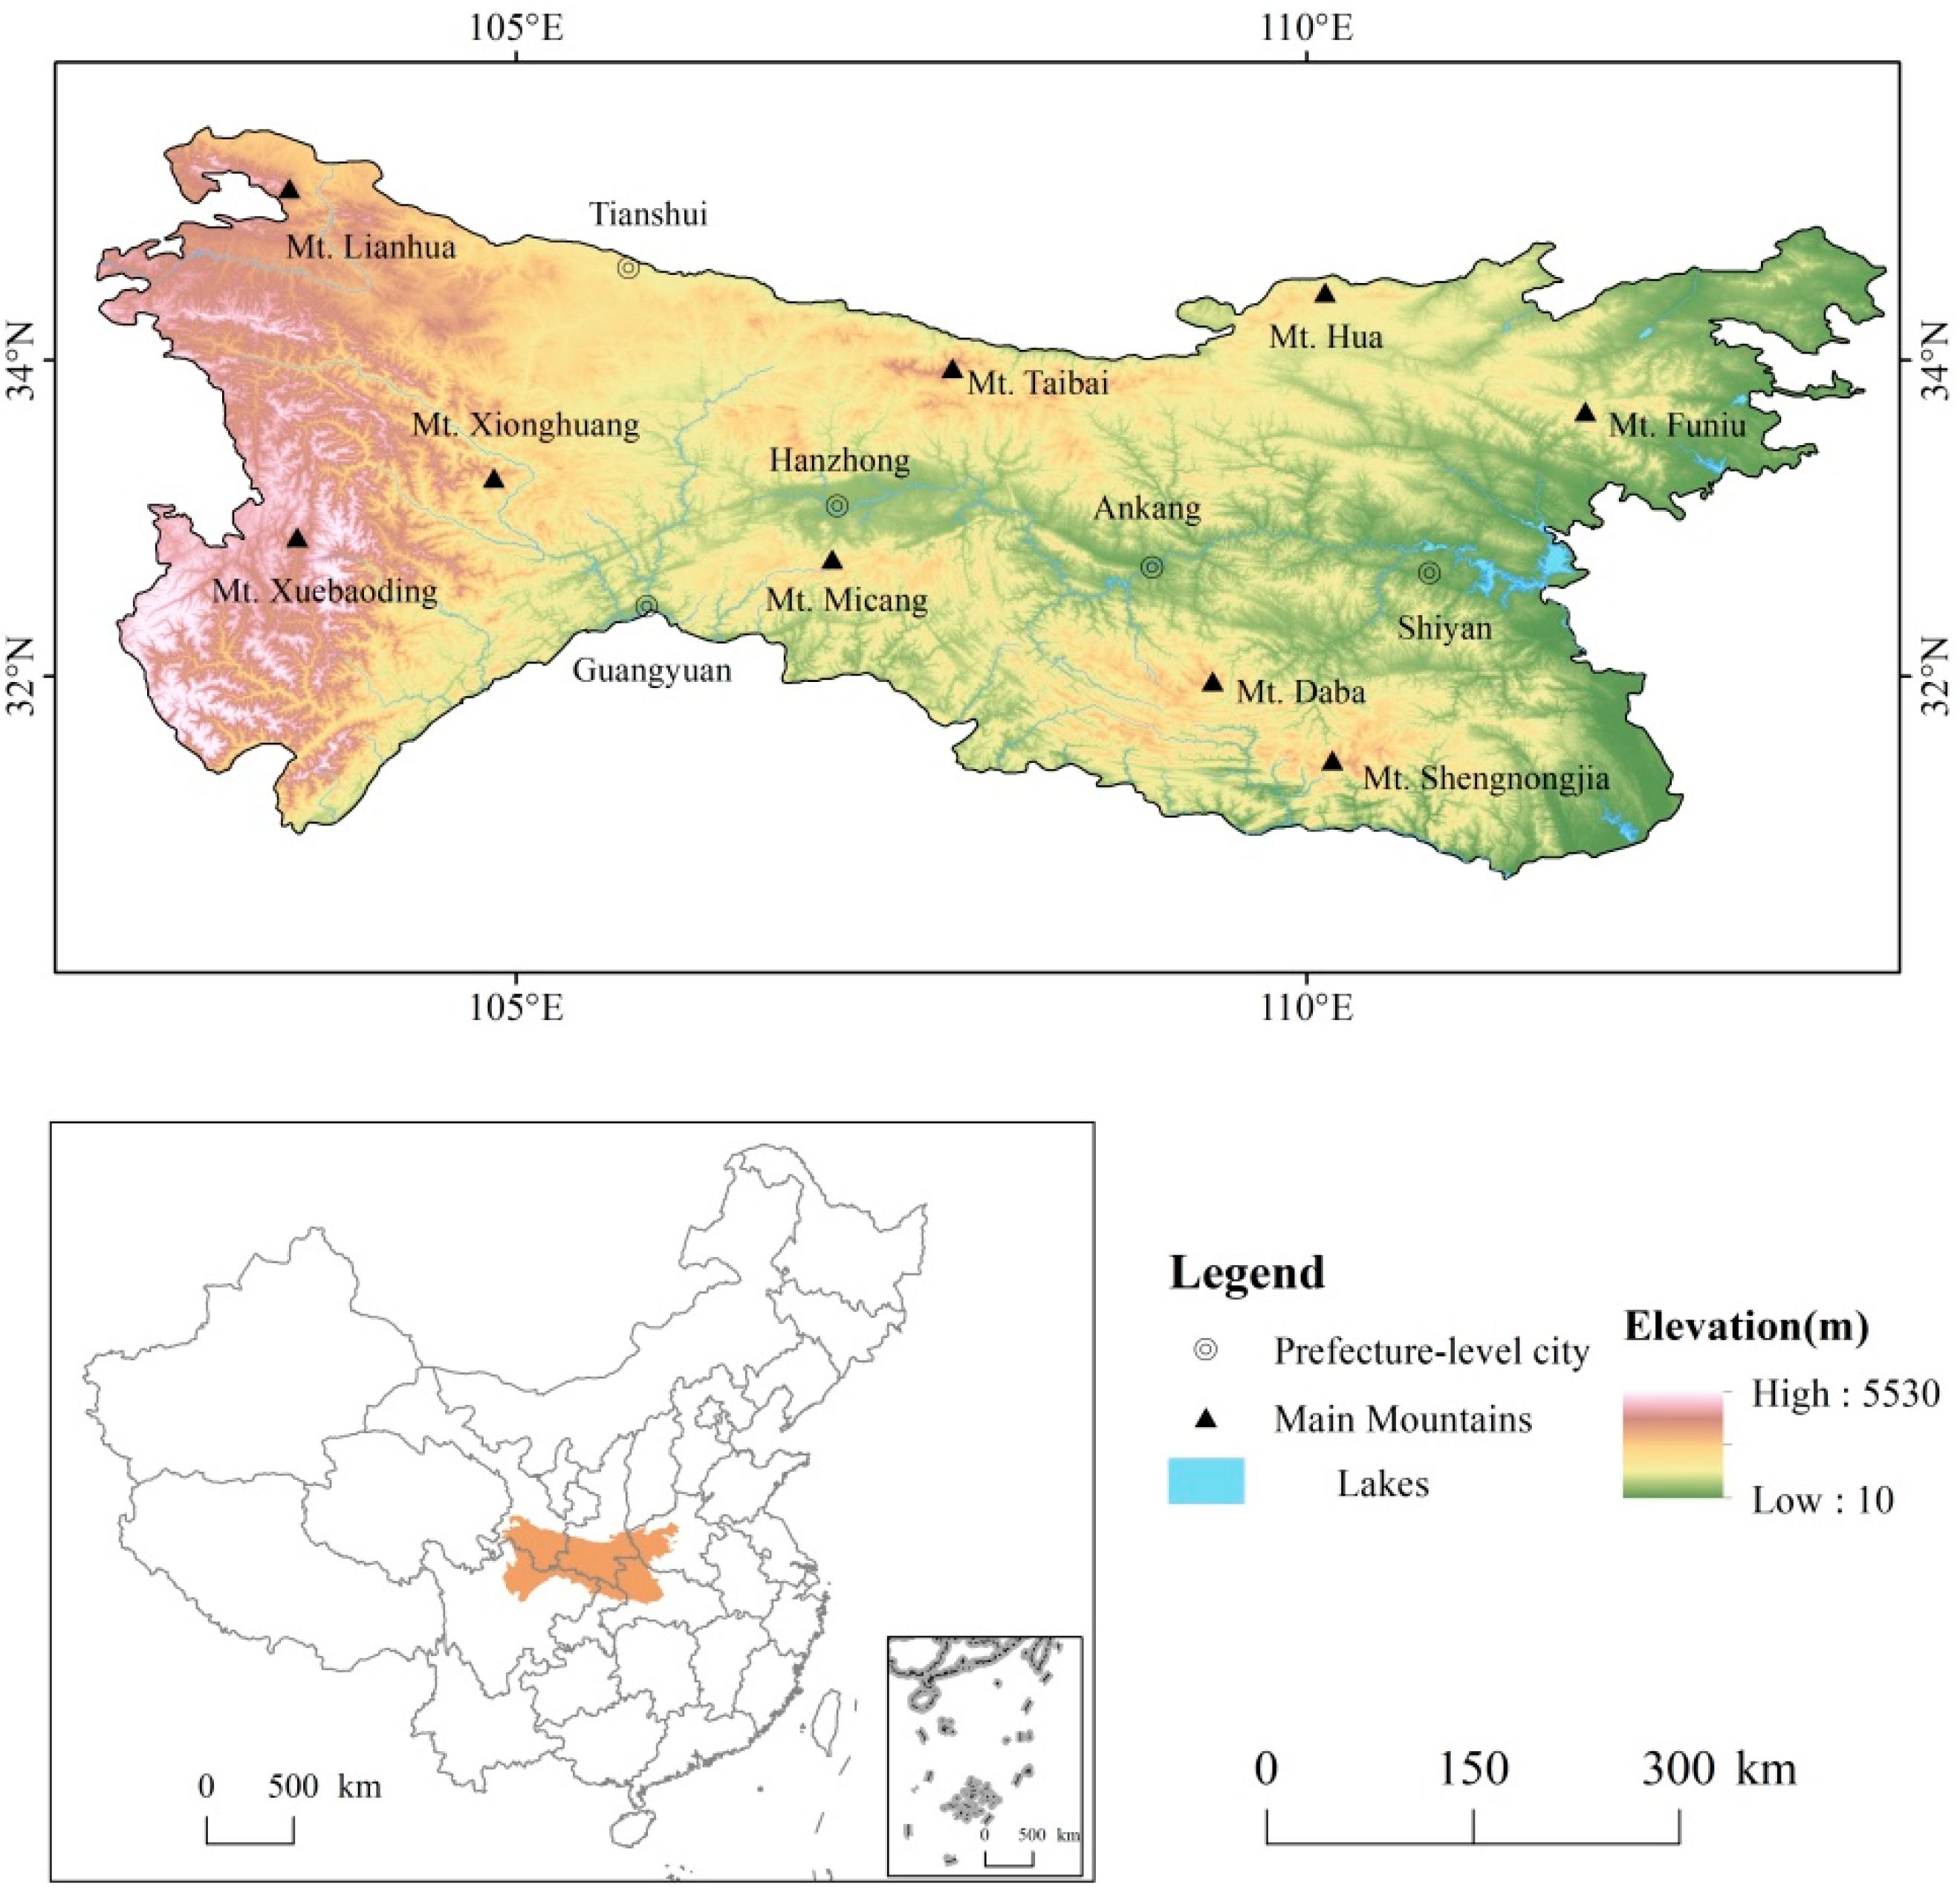
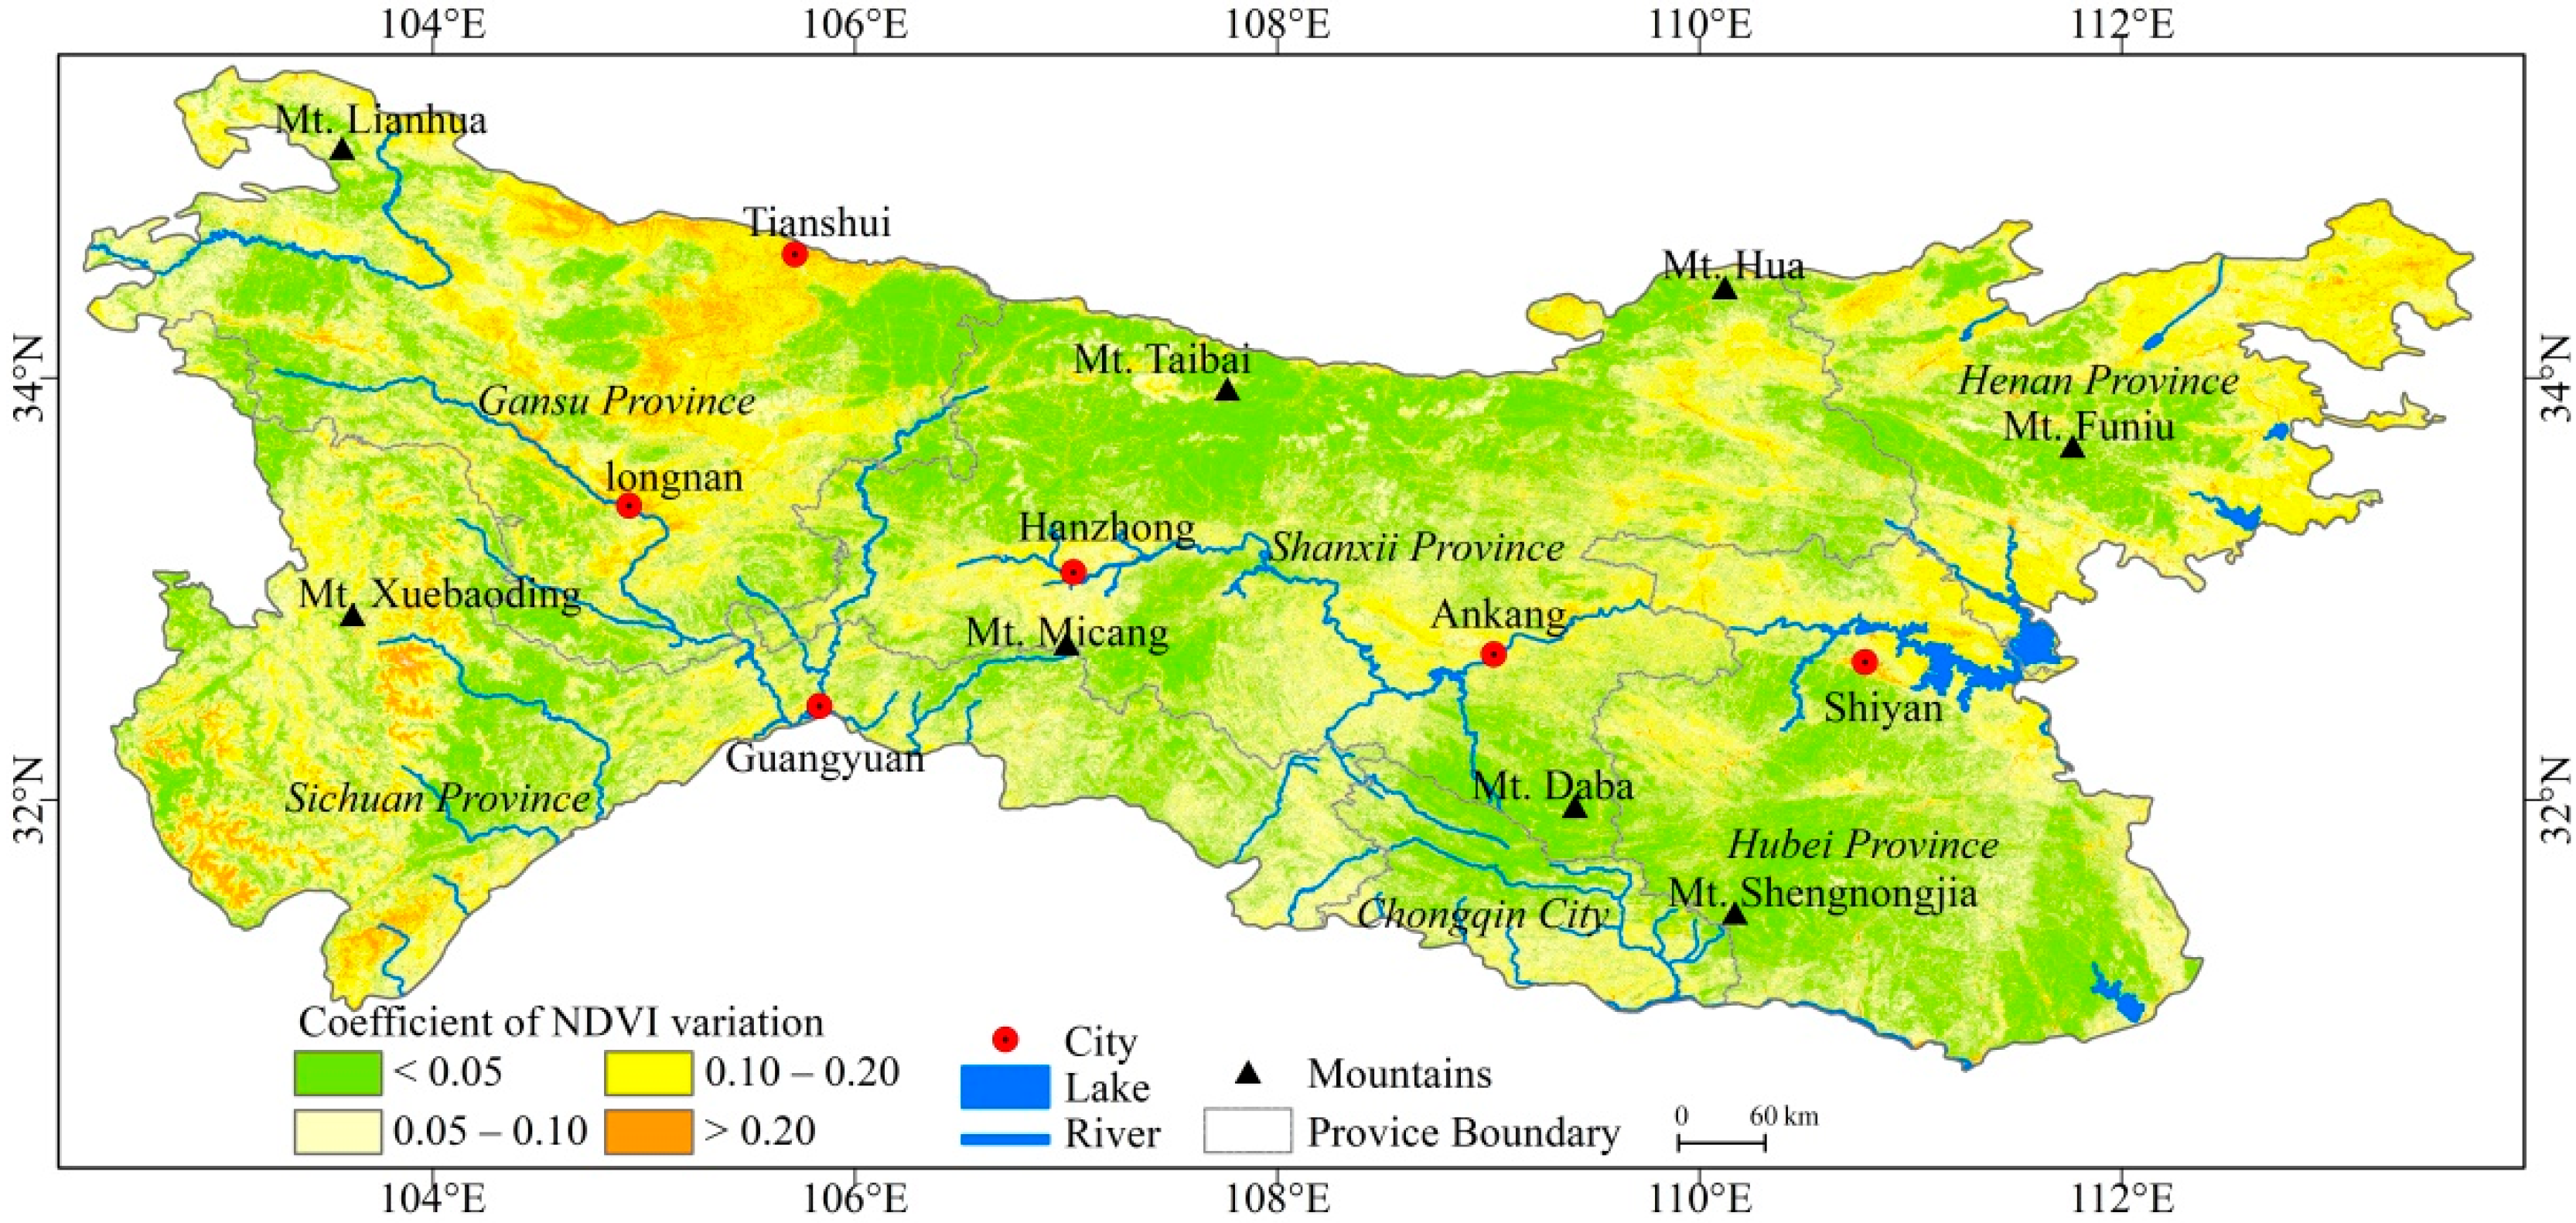
2. Study Area
3. Datasets and Methods
3.1. Data
3.2. Methods
4. Results
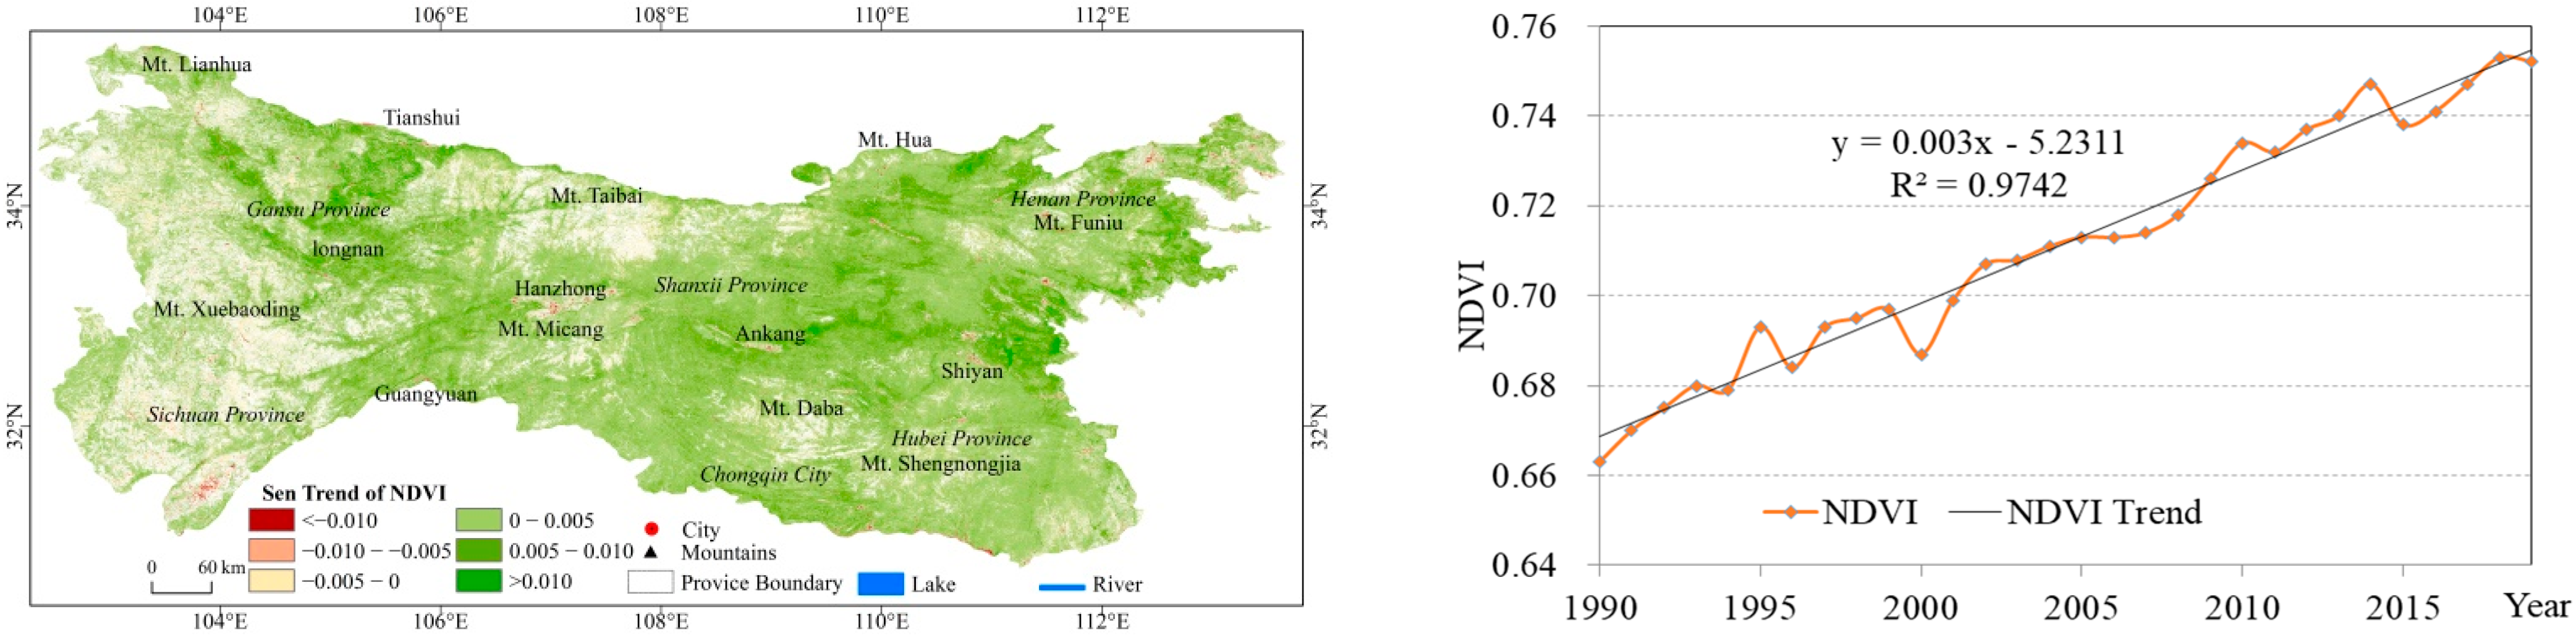
4.1. Significant NDVI Increase in the Qinling-Daba Mountains
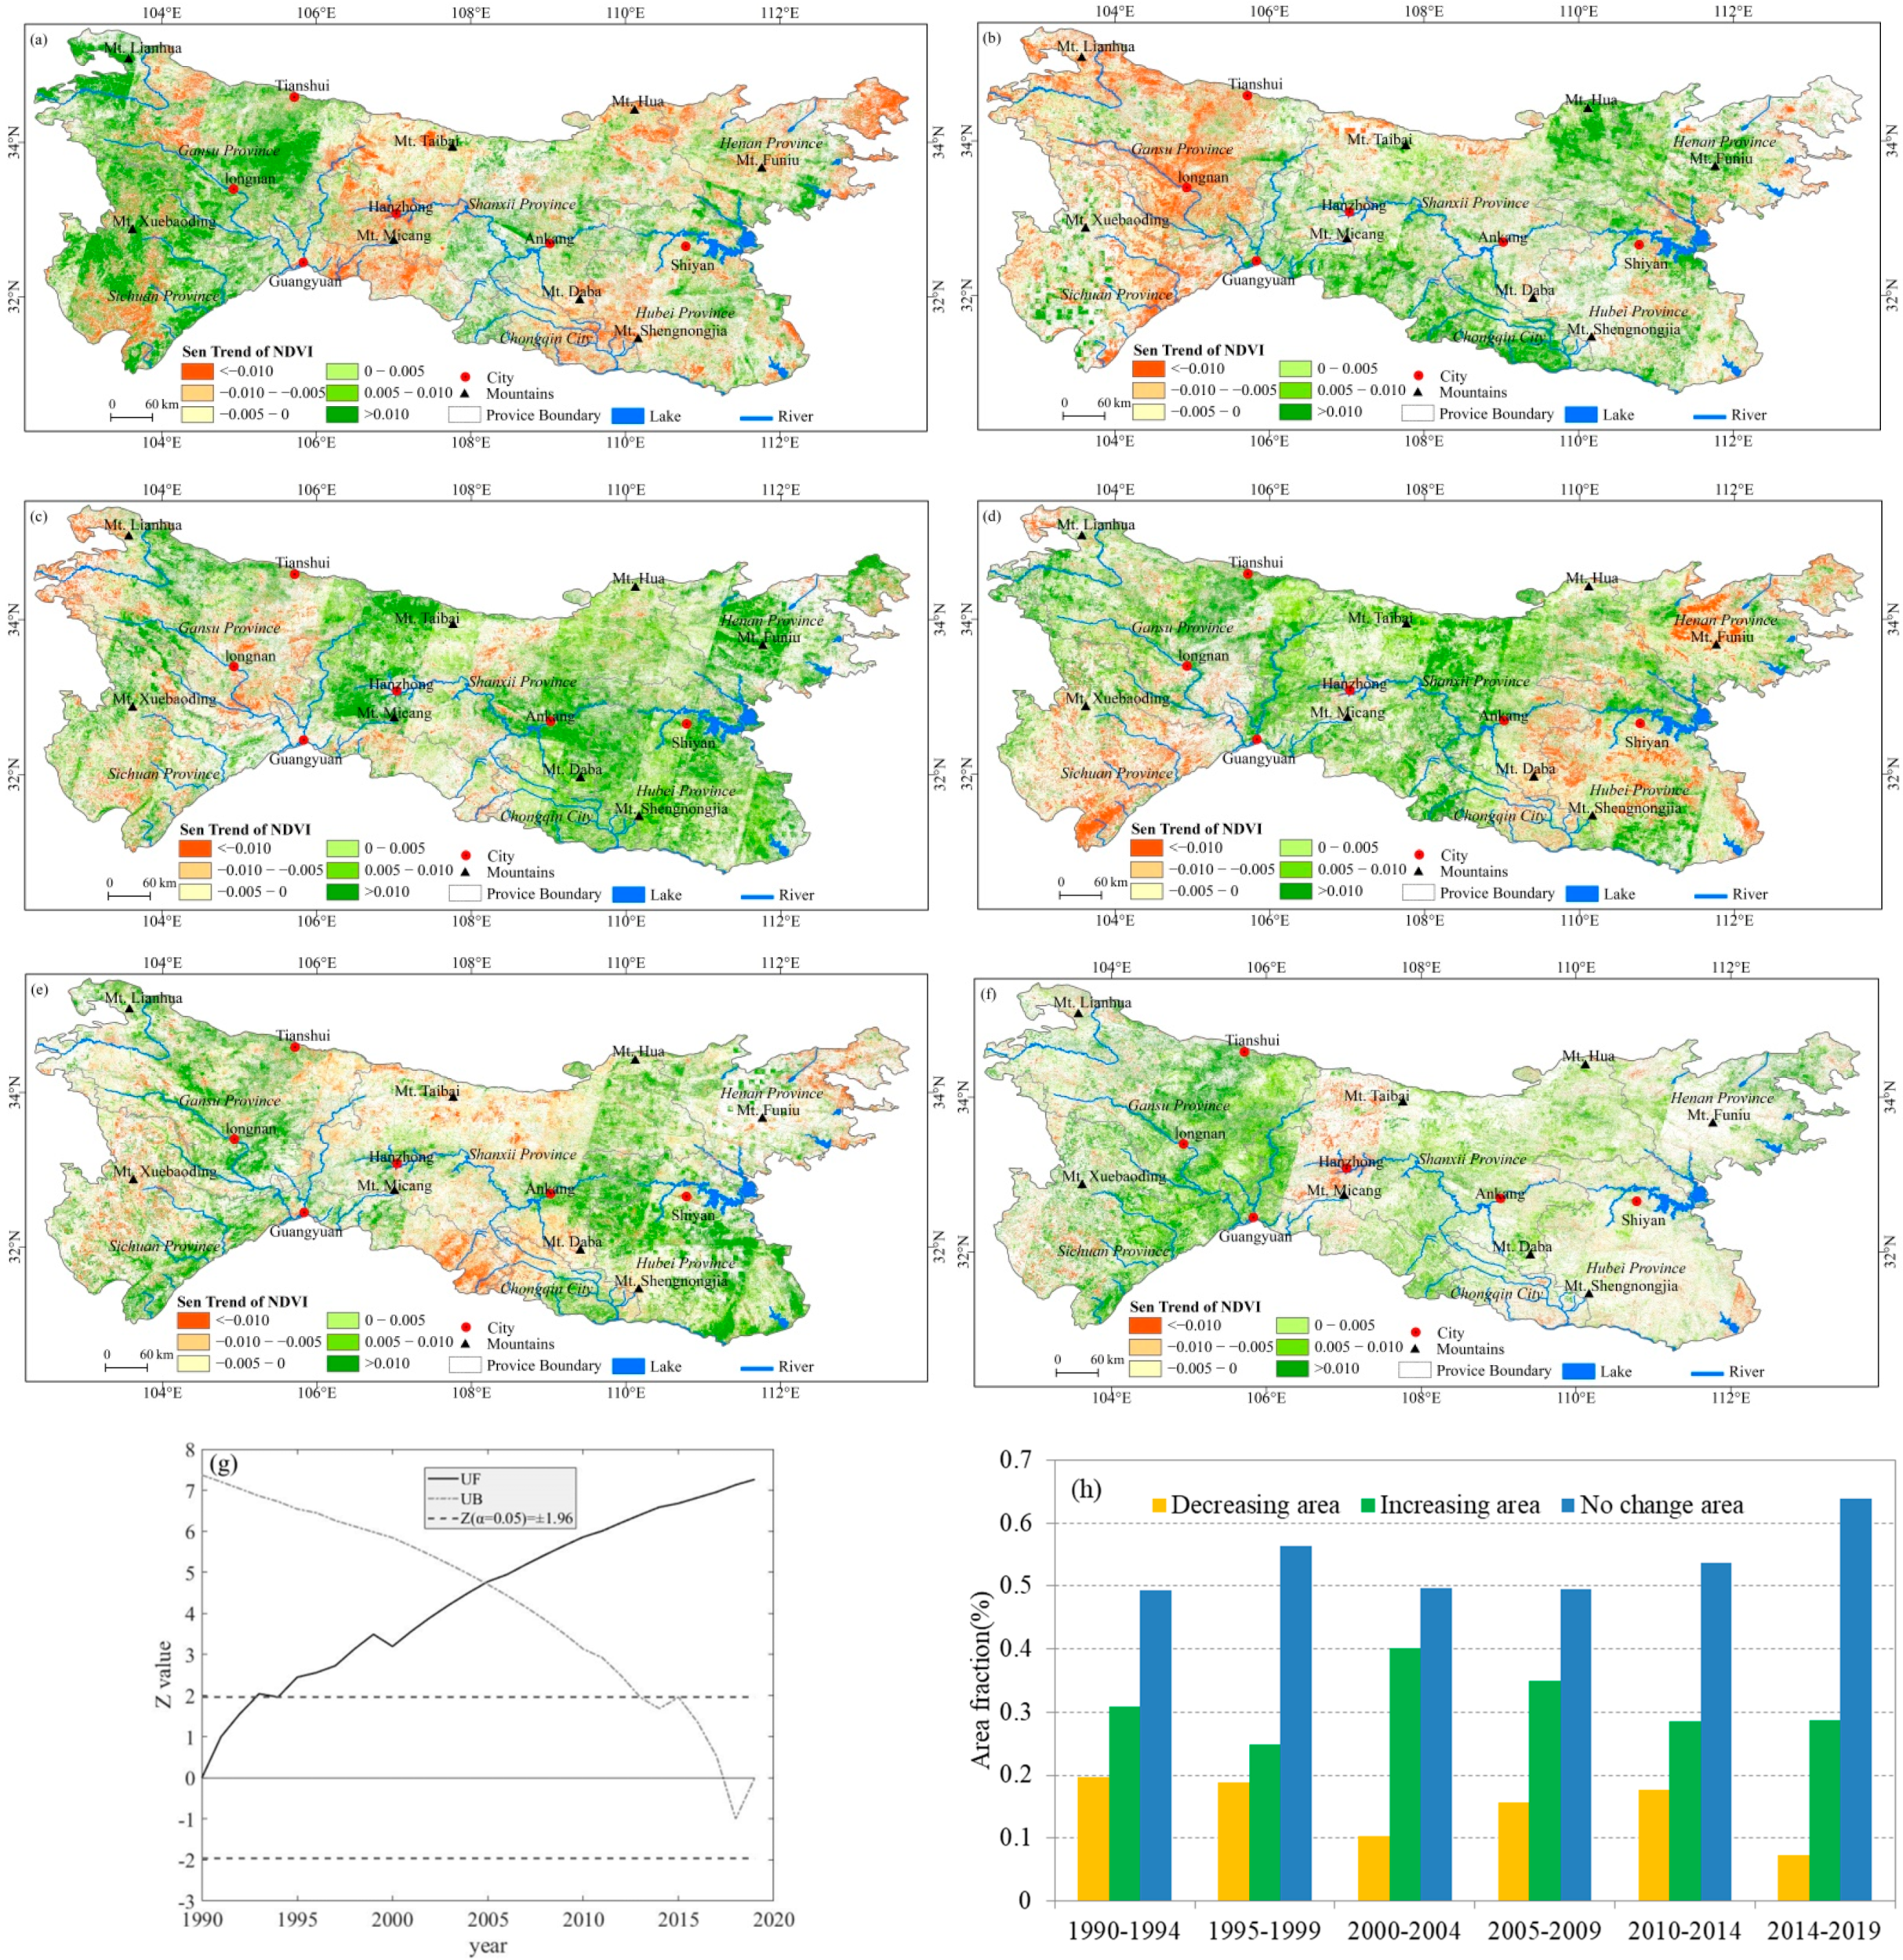
4.2. Temporal and Spatial Differences of NDVI Changes in the Qinling-Daba Mountains
4.3. Influence of Elevation and Slope on NDVI Changes
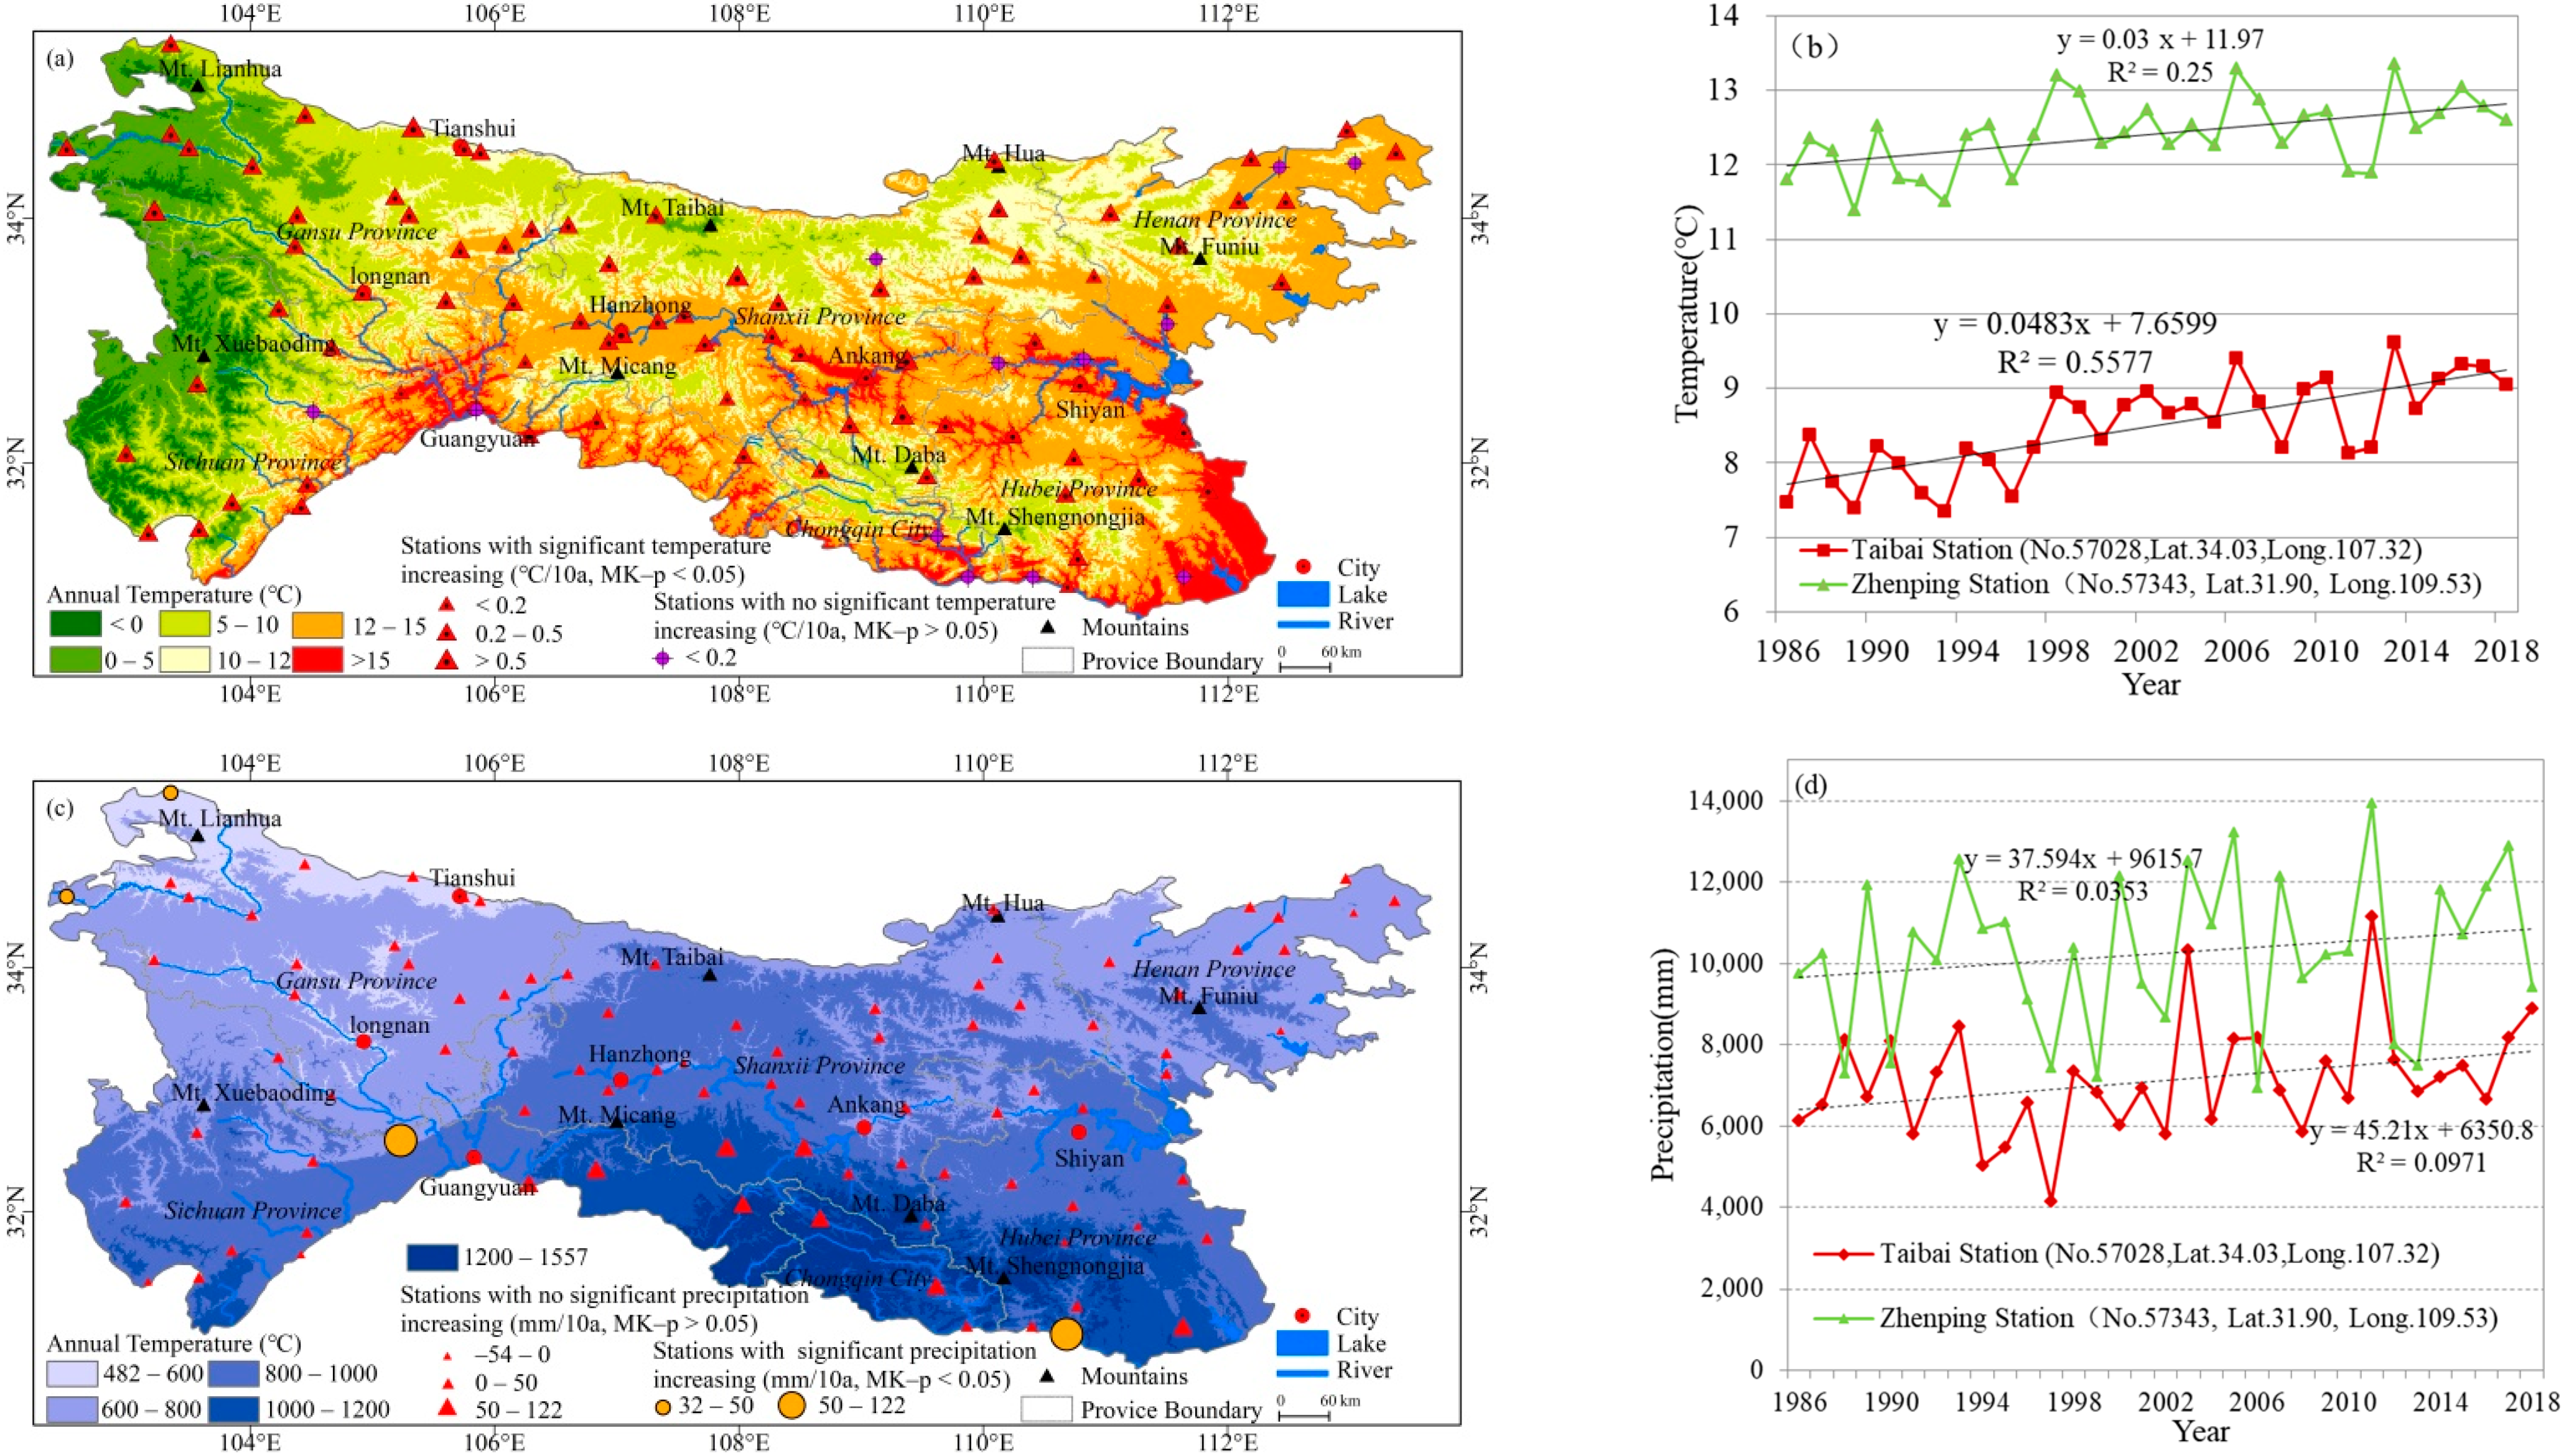
4.4. Climate Warming as a Driving Factor of NDVI Change
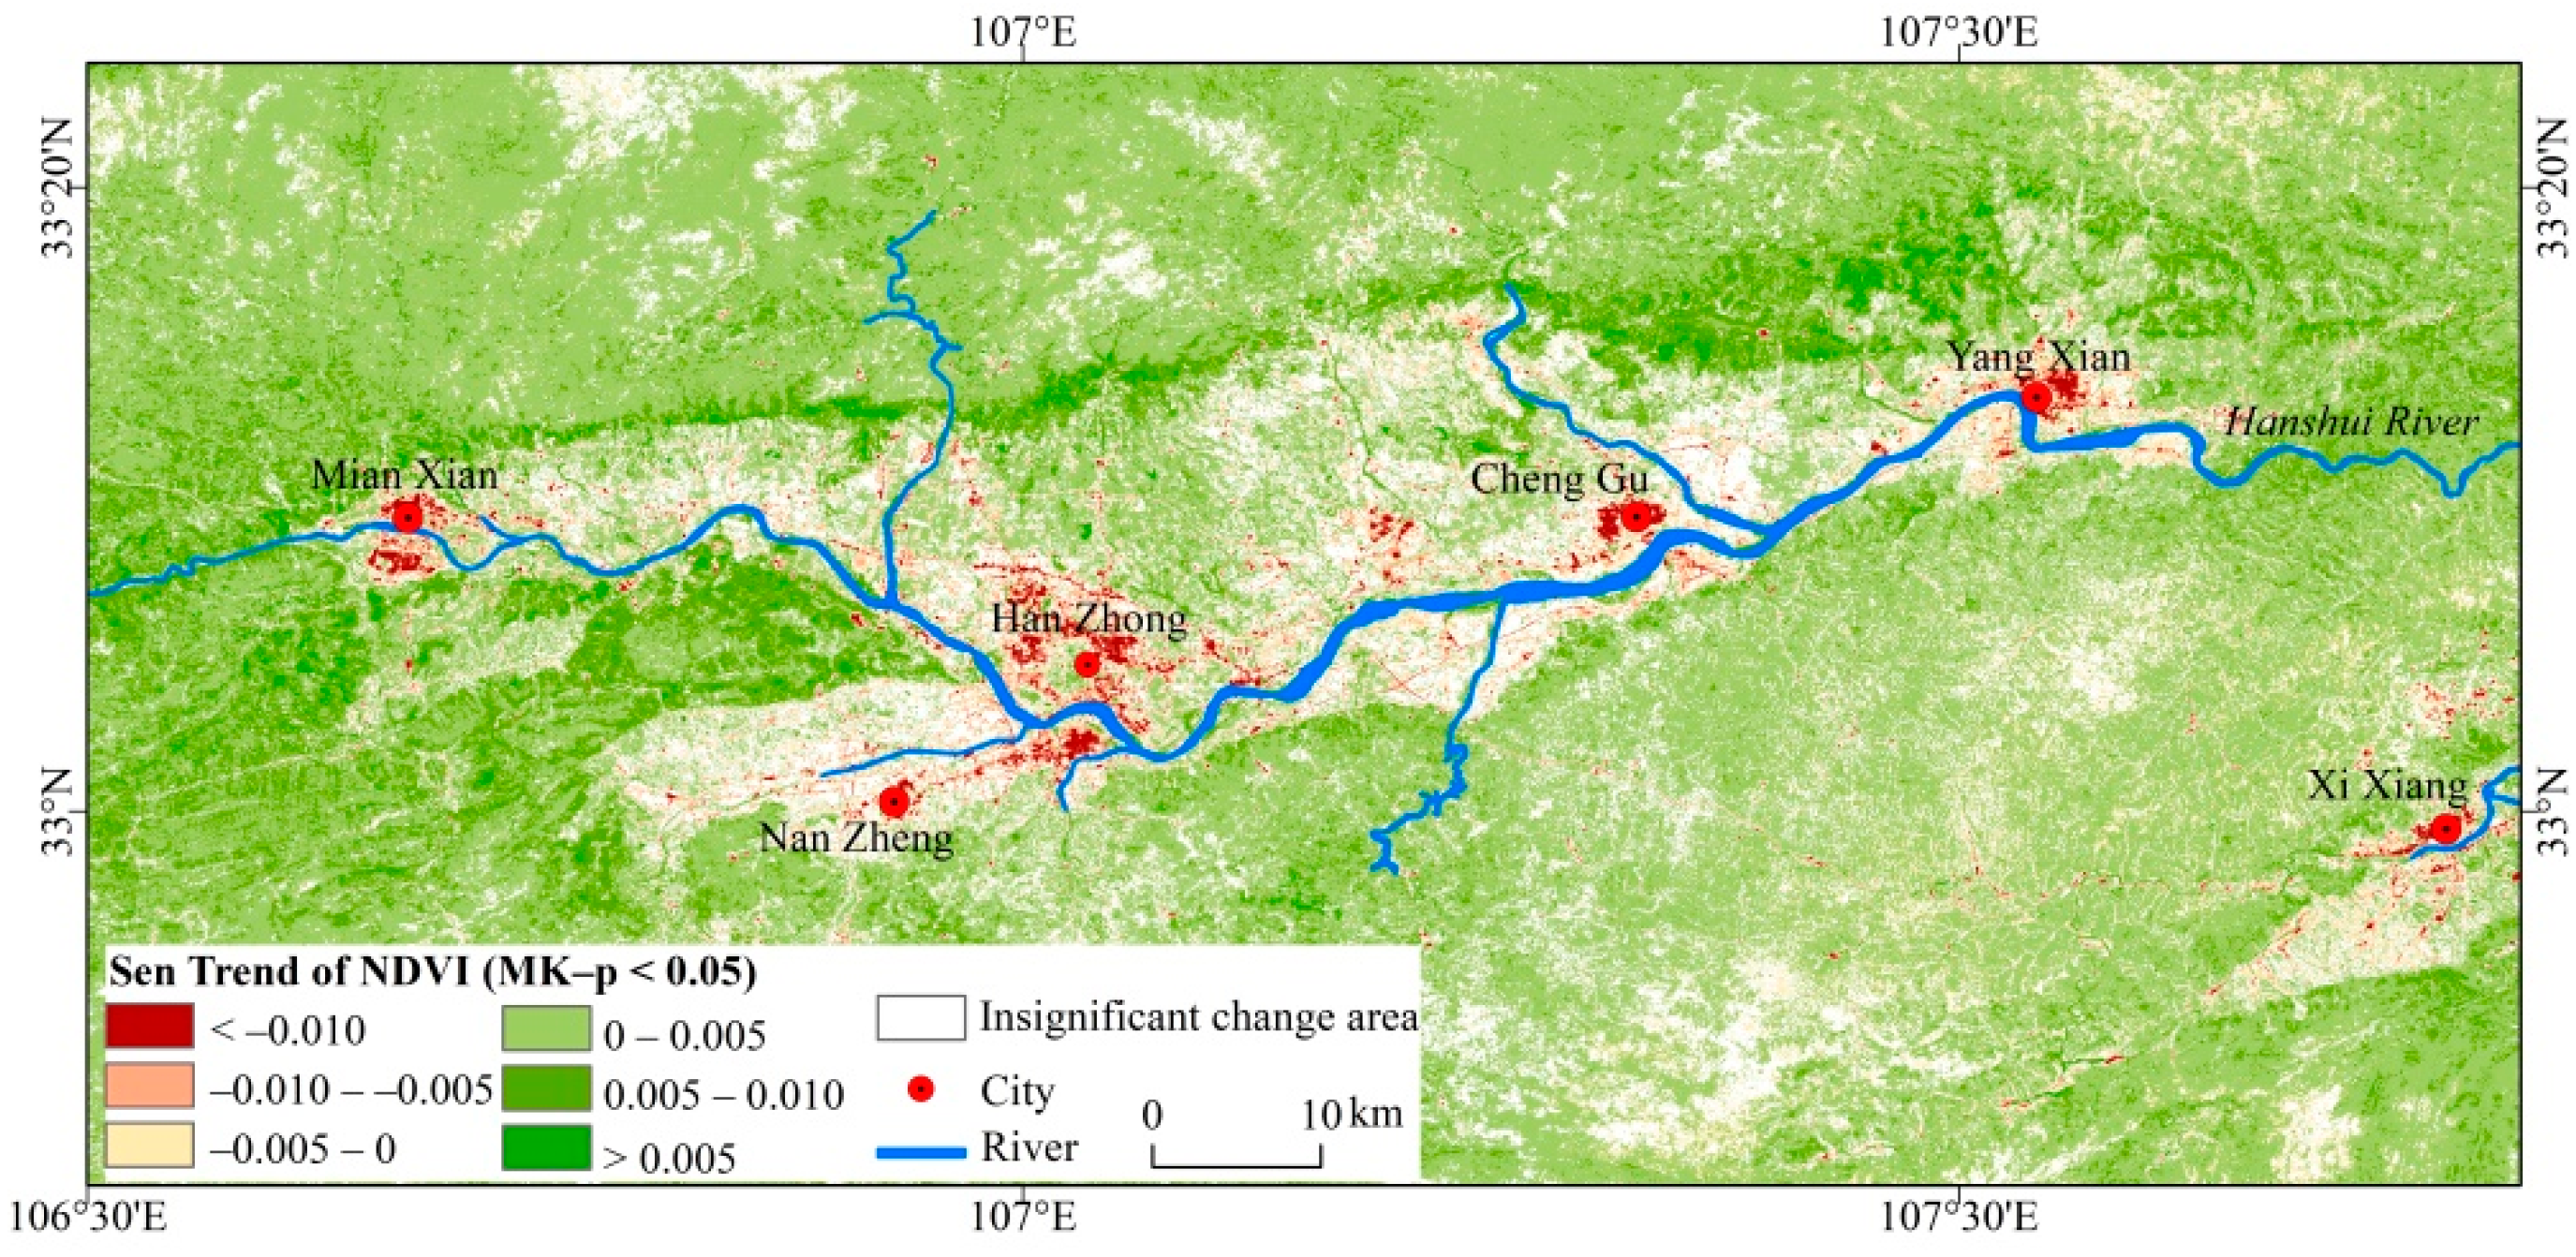
4.5. Human Land Use as an Important Driving Factor of NDVI Change
5. Discussion and Conclusions
5.1. Discussion
5.2. Conclusions
Author Contributions
Funding
Informed Consent Statement
Acknowledgments
Conflicts of Interest
References
- Chen, C.; Park, T.; Wang, X.H.; Piao, S.L.; Xu, B.D.; Chaturvedi, R.K.; Fuchs, R.; Brovkin, V.; Ciais, P.; Fensholt, R.; et al. China and India lead in greening of the world through land-use management. Nat. Sustain. 2019, 2, 122–129. [Google Scholar] [CrossRef] [PubMed]
- Liu, Y.L.; Lei, H.M. Responses of Natural Vegetation Dynamics to Climate Drivers in China from 1982 to 2011. Remote Sens. 2015, 7, 10243–10268. [Google Scholar] [CrossRef]
- Steltzer, H.; Welker, J.M. Modeling the effect of photosynthetic vegetation properties on the NDVI-LAI relationship. Ecology 2006, 87, 2765–2772. [Google Scholar] [CrossRef]
- Phillips, L.B.; Hansen, A.J.; Flather, C.H. Evaluating the species energy relationship with the newest measures of ecosystem energy: NDVI versus MODIS primary production. Remote Sens. Environ. 2008, 112, 3538–3549. [Google Scholar] [CrossRef]
- Myneni, R.B.; Tucker, C.J.; Asrar, G.; Keeling, C.D. Interannual variations in satellite-sensed vegetation index data from 1981 to 1991 (vol 103, pg 6145, 1998). J. Geophys. Res.-Atmos. 1998, 103, 19839. [Google Scholar] [CrossRef]
- Anyamba, A.; Tucker, C.J. Analysis of Sahelian vegetation dynamics using NOAA-AVHRR NDVI data from 1981–2003. J. Arid. Environ. 2005, 63, 596–614. [Google Scholar] [CrossRef]
- Herrmann, S.M.; Anyamba, A.; Tucker, C.J. Recent trends in vegetation dynamics in the African Sahel and their relationship to climate. Glob. Environ. Chang. 2005, 15, 394–404. [Google Scholar] [CrossRef]
- Tucker, C.J.; Pinzon, J.E.; Brown, M.E.; Slayback, D.A.; Pak, E.W.; Mahoney, R.; Vermote, E.F.; El Saleous, N. An extended AVHRR 8-km NDVI dataset compatible with MODIS and SPOT vegetation NDVI data. Int. J. Remote Sens. 2005, 26, 4485–4498. [Google Scholar] [CrossRef]
- de Jong, R.; de Bruin, S.; de Wit, A.; Schaepman, M.E.; Dent, D.L. Analysis of monotonic greening and browning trends from global NDVI time-series. Remote Sens. Environ. 2011, 115, 692–702. [Google Scholar] [CrossRef]
- Beck, H.E.; McVicar, T.R.; van Dijk, A.; Schellekens, J.; de Jeu, R.A.M.; Bruijnzeel, L.A. Global evaluation of four AVHRR-NDVI data sets: Intercomparison and assessment against Landsat imagery. Remote Sens. Environ. 2011, 115, 2547–2563. [Google Scholar] [CrossRef]
- Liu, X.F.; Pan, Y.Z.; Zhu, X.F.; Li, S.S. Spatio-temporal variation of vegetation coverage in Qinling-Daba Mountains in relation to environmental factors. Acta Geogr. Sin. 2015, 70, 705–716. [Google Scholar]
- Fang, J.Y.; Piao, S.L.; He, J.S.; Ma, W.H. Vegetation of China is invigorated in recent 20 years. Sci. China Ser. C-Life Sci. 2003, 33, 554–565. [Google Scholar]
- Deng, C.H.; Bai, H.Y.; Gao, S.; Liu, R.J.; Ma, X.P.; Huang, X.Y.; Meng, Q. Spatial-temporal Variation of the Vegetation Coverage in Qinling Mountains and Its Dual Response to Climate Change and Human Activities. J. Nat. Resour. 2018, 33, 425–438. [Google Scholar]
- Zhao, F.; Zhang, B.P.; Zhu, L.Q.; Yao, Y.H.; Cui, Y.P.; Liu, J.J. Spectra structures of altitudinal belts and their significance for determining the boundary between warm temperate and subtropical zones in the Qinling-Daba Mountains. Acta Geogr. Sin. 2019, 74, 889–901. [Google Scholar]
- Sun, Y.X.; McMurty, M.; Ahmadi, M.; Tao, H.F.; Li, Q. Research on the temporal and spatial dynamic changes of vegetation coverage in Kashgar City from 1995 to 2020. In China Rural Water and Hydropower; The Editorial Office of China Rural Water and Hydropowe: Wuhan, China, 2022; pp. 71–78. [Google Scholar]
- Wang, X.H.; Piao, S.L.; Ciais, P.; Li, J.S.; Friedlingstein, P.; Koven, C.; Chen, A.P. Spring temperature change and its implication in the change of vegetation growth in North America from 1982 to 2006. Proc. Natl. Acad. Sci. USA 2011, 108, 1240–1245. [Google Scholar] [CrossRef]
- Peng, S.S.; Chen, A.P.; Xu, L.; Cao, C.X.; Fang, J.Y.; Myneni, R.B.; Pinzon, J.E.; Tucker, C.J.; Piao, S.L. Recent change of vegetation growth trend in China. Environ. Res. Lett. 2011, 6, 044027. [Google Scholar] [CrossRef]
- Luo, X.P. Spatial-Temporal Changes of NDVI and the Response to the Regional Climate in the Qinling-Daba Mountains for 25 Years; Northwest University: Xi’an, China, 2009. [Google Scholar]
- Zhang, S.H.; Bai, H.Y.; Gao, X.; He, Y.N. Spatial-temporal Changes of Vegetation Index and Its Responses to Regional Temperature in Taibai Mountain. J. Nat. Resour. 2011, 26, 1377–1386. [Google Scholar]
- Piao, S.L.; Fang, J.Y.; Zhou, L.M.; Guo, Q.H.; Henderson, M.; Wei, J.; Li, Y.; Tao, S. Interannual variations of monthly and seasonal normalized difference vegetation index (NDVI) in China from 1982 to 1999. J. Geophys. Res. Atmos. 2003, 108, 4401–4413. [Google Scholar]
- Kawabata, A.; Ichii, K.; Yamaguchi, Y. Global monitoring of interannual changes in vegetation activities using NDVI and its relationships to temperature and precipitation. Int. J. Remote Sens. 2001, 22, 1377–1382. [Google Scholar] [CrossRef]
- Tucker, C.J.; Slayback, D.A.; Pinzon, J.E.; Los, S.O.; Myneni, R.B.; Taylor, M.G. Higher northern latitude normalized difference vegetation index and growing season trends from 1982 to 1999. Int. J. Biometeorol. 2001, 45, 184–190. [Google Scholar]
- Qu, S.; Wang, L.C.; Lin, A.W.; Yu, D.Q.; Yuan, M.X.; Li, C.A. Distinguishing the impacts of climate change and anthropogenic factors on vegetation dynamics in the Yangtze River Basin, China. Ecol. Indic. 2020, 108, 105724. [Google Scholar] [CrossRef]
- Jiang, M.C.; He, Y.X.; Song, C.H.; Pan, Y.P.; Qiu, T.; Tian, S.F. Disaggregating climatic and anthropogenic influences on vegetation changes in Beijing-Tianjin-Hebei region of China. Sci. Total Environ. 2021, 786, 147574. [Google Scholar] [CrossRef]
- Qiu, T.; Song, C.H.; Zhang, Y.L.; Liu, H.S.; Vose, J.M. Urbanization and climate change jointly shift land surface phenology in the northern mid-latitude large cities. Remote Sens. Environ. 2020, 236, 111477. [Google Scholar] [CrossRef]
- Xu, X.J.; Liu, H.Y.; Jiao, F.S.; Gong, H.B.; Lin, Z.S. Nonlinear relationship of greening and shifts from greening to browning in vegetation with nature and human factors along the Silk Road Economic Belt. Sci. Total Environ. 2021, 766, 142553. [Google Scholar] [CrossRef]
- Zhang, B.P. Ten major scientific issues concerning the study of China’s north-south transitional zone. Prog. Geogr. 2019, 38, 305–311. [Google Scholar]
- Chen, C.N.; Zhu, L.Q.; Tian, L.; Li, X.G. Spatial-temporal changes in vegetation characteristics and climate in the Qinling-Daba Mountains. Acta Ecol. Sin. 2019, 39, 3257–3266. [Google Scholar]
- Wurster, C.M.; Bird, M.I. Barriers and bridges: Early human dispersals in equatorial SE Asia. Geol. Soc. Lond. Spec. Publ. 2014, 411, 235–250. [Google Scholar]
- Caplat, P.; Edelaar, P.; Dudaniec, R.Y.; Green, A.J.; Okamura, B.; Cote, J.; Ekroos, J.; Jonsson, P.R.; Londahl, J.; Tesson, S.V.M.; et al. Looking beyond the mountain: Dispersal barriers in a changing world. Front. Ecol. Environ. 2016, 14, 262–269. [Google Scholar] [CrossRef]
- He, Y.N.; Bai, H.Y.; Gao, X.; Ma, X.P. Analysis on the Variation Tendency of Vegetation Cover of Micang Mountains. Acta Bot. Bor-Occid. Sin. 2011, 31, 1677–1682. [Google Scholar]
- Ren, Y.Y.; Zhang, Z.; Hou, Q.L.; He, Y.N.; Yuan, B. Response of vegetation cover changes to climate change in Daba Mountains. Bull. Soil Water Conserv. Res. 2012, 32, 56–59. [Google Scholar]
- Li, P.A.; Jiang, Y.T.; Qi, P.C.; Wang, L.M. Research on the time-spatial evolution characteristics of vegetation in the water source area of the Middle Route Project of S-N water diversion. J. Yangtze River Sci. Res. Inst. 2021. Available online: https://kns.cnki.net/kcms/detail/42.1171.tv.20211012.1328.016.html (accessed on 6 July 2022).
- Gao, Y.; Sun, H.; Xu, Y.Y.; Zhang, S.F. Temporal and spatial variation of vegetation cover and its response to extreme climate in Shaanxi Province. Acta Ecol. Sin. 2022, 42, 1022–1033. [Google Scholar]
- Zhao, T.; Bai, H.Y.; Deng, C.H.; Meng, Q.; Guo, S.Z.; Qi, G.Z. Topographic differentiation effect on vegetation cover in the Qinling Mountains from 2000 to 2016. Acta Ecol. Sin. 2019, 39, 4499–4509. [Google Scholar]
- Cui, X.L.; Bai, H.Y.; Shang, X.Q. The vegetation dynamic in Qinling area based on MODIS NDVI. J. Northwest Univ. 2012, 42, 1021–1026. [Google Scholar]
- Ren, Z.Y.; Li, J. The Valuation of Ecological Services from the Vegetation Ecosystems in the Qinling-Daba Mountains. Acta Geogr. Sin. 2003, 58, 503–511. [Google Scholar]
- Liu, Y.H.; Lu, L.X. Exploitation and utilization for agricultural natural resources in Qinling-Daba mountainous region of Shanxi Province. J. Mt. Sci. 1990, 8, 45–52. [Google Scholar]
- Yao, Y.H.; Hu, Y.F.; Kou, Z.X.; Zhang, B.P. Spatial patterns of Pinus tabulaeformisand Pinus massonianaforests in Qinling-Daba Mountains and the boundary of subtropical and warm temperate zones. Acta Geogr. Sin. 2020, 30, 1523–1533. [Google Scholar]
- Committee, C.V.M.E. Vegetation Atlas of China (1:1,000,000); Science Press: Beijing, China, 2001. [Google Scholar]
- Roy, D.P.; Kovalskyy, V.; Zhang, H.K.; Vermote, E.F.; Yan, L.; Kumar, S.S.; Egorov, A. Characterization of Landsat-7 to Landsat-8 reflective wavelength and normalized difference vegetation index continuity. Remote Sens. Environ. 2016, 185, 57–70. [Google Scholar] [CrossRef] [PubMed]
- Hijmans, R.J.; Cameron, S.E.; Parra, J.L.; Jones, P.G.; Jarvis, A. Very high resolution interpolated climate surfaces for global land areas. Int. J. Climatol. 2005, 25, 1965–1978. [Google Scholar] [CrossRef]
- Yang, J.; Huang, X. The 30 m annual land cover dataset and its dynamics in China from 1990 to 2019. Earth Syst. Sci. Data 2021, 13, 3907–3925. [Google Scholar] [CrossRef]
- Sen, P.K. Estimates of the regression coefficient based on Kendall’s tau. J. Am. Stat. Assoc. 1968, 63, 1379–1389. [Google Scholar] [CrossRef]
- Liu, Y.L.; Wang, Q.; Bi, J.Z.; Zhang, M.M.; Xing, Q.G.; Shi, P. The analysis of NDVI trends in the coastal zone based on Mann-Kendall test:a case in the Jiaodong Peninsula. Acta Oceanolog. Sin. 2010, 32, 79–87. [Google Scholar]
- Mann, H.B. Nonparametric Tests Against Trend. Econometrica 1945, 13, 245–259. [Google Scholar] [CrossRef]
- Kendall, M.G. Rank Correlation Methods, 4th ed.; Charles Griffin: London, UK, 1975. [Google Scholar]
- Karpouzos, D.; Kavalieratou, S.; Babajimopoulos, C. Trend Analysis of Precipitation Data in Pieria Region (Greece). Eur. Water 2010, 30, 31–40. [Google Scholar]
- Zhang, W.; Wang, L.C.; Xiang, F.F.; Qin, W.M.; Jiang, W.Z. Vegetation dynamics and the relations with climate change at multiple time scales in the Yangtze River and Yellow River Basin, China. Ecol. Indic. 2020, 110, 105892. [Google Scholar] [CrossRef]
- Xu, X.L.; Ma, K.M.; Fu, B.J.; Liu, X.C.; Huang, Y.; Qi, J. Research review of the relationship between vegetation and soil loss. Acta Ecol. Sin. 2006, 26, 3137–3143. [Google Scholar]
- Xiong, K.N.; Li, J.; Long, M.Z. Features of soil and water loss and key lssues in demonstration areas for combating Karst rocky desertification. Acta Geogr. Sin. 2012, 67, 878–888. [Google Scholar]
- Shen, J.X.; Wang, X.H. Spatial-temporal Changes in Ecological Risk of Land Use before and after Grain-for-Green Policy in Zhengning County, Gansu Province. J. Resour. Ecol. 2013, 4, 36–42. [Google Scholar]
- Chen, Y.Q.; Liu, L.M.; Lai, M.; Li, J.L. The research on the policy system of Cropland Conversion Program-case study at Wuchuan County. Res. Soil Water Conserv. 2006, 13, 120–123. [Google Scholar]
- Zhang, B.S.; Jiang, Y.J.; Yang, Z.S. Study on land use changes in the southeast Karst Mountainous areas of Yunnan Province driven by the national project of converting farmland to forest in recent eight years: A case in Wenshan County. Chin. Agric. Sci. Bull. 2010, 26, 338–343. [Google Scholar]


| Year | Mean NDVI at Different Altitudes | Mean NDVI for Different Slopes | |||||||||
|---|---|---|---|---|---|---|---|---|---|---|---|
| 0–1000 m | 1000–1500 m | 1500–2000 m | 2000–2500 m | 2500–3000 m | >3000 m | 0°–5° | 5°–15° | 15°–25° | 25°–35° | >35° | |
| 1990 | 0.632 | 0.699 | 0.705 | 0.691 | 0.684 | 0.608 | 0.545 | 0.614 | 0.665 | 0.694 | 0.701 |
| 1995 | 0.654 | 0.724 | 0.734 | 0.722 | 0.725 | 0.674 | 0.571 | 0.646 | 0.695 | 0.726 | 0.733 |
| 2000 | 0.655 | 0.729 | 0.723 | 0.698 | 0.702 | 0.649 | 0.557 | 0.639 | 0.691 | 0.720 | 0.725 |
| 2005 | 0.693 | 0.752 | 0.740 | 0.716 | 0.719 | 0.657 | 0.588 | 0.669 | 0.718 | 0.743 | 0.745 |
| 2010 | 0.718 | 0.774 | 0.766 | 0.742 | 0.736 | 0.664 | 0.609 | 0.698 | 0.743 | 0.762 | 0.757 |
| 2015 | 0.727 | 0.778 | 0.762 | 0.743 | 0.737 | 0.662 | 0.613 | 0.703 | 0.749 | 0.763 | 0.759 |
| 2019 | 0.736 | 0.794 | 0.785 | 0.762 | 0.748 | 0.672 | 0.612 | 0.716 | 0.763 | 0.778 | 0.774 |
| Linear trend analysis | Y = 0.0186x + 0.6134 (R2 = 0.96) | Y = 0.0156x + 0.6874 (R2 = 0.98) | Y = 0.0121x + 0.6966 (R2 = 0.90) | Y = 0.0107x + 0.6821 (R2 = 0.81) | Y = 0.0089x + 0.6859 (R2 = 0.75) | Y = 0.0065x + 0.6290 (R2 = 0.39) | Y = 0.012x + 0.5369 (R2=0.87) | Y = 0.0171x + 0.6009 (R2 = 0.95) | Y = 0.0162x + 0.6529 (R2 = 0.96) | Y = 0.0131x + 0.6883 (R2 = 0.94) | Y = 0.0108x + 0.6987 (R2 = 0.91) |
| Land-Use Type | Proportion of NDVI Change of the Qinling-Daba Mountains for 1990–2019 (%) | Proportion of Land Use Type of the Qinling-Daba Mountains (%) | |||
|---|---|---|---|---|---|
| Increasing | Decreasing | Insignificant Change | 2019 | 1990 | |
| Forests | 54.47 | 1.65 | 13.04 | 69.16 | 62.85 |
| Croplands | 12.60 | 0.91 | 3.31 | 16.82 | 19.71 |
| Grasslands | 7.01 | 0.90 | 3.74 | 11.65 | 14.97 |
| Shrub-wood lands | 0.26 | 0.02 | 0.15 | 0.43 | 1.47 |
| Total for above four vegetated lands | 74.08 | 3.46 | 20.09 | 97.63 | 99 |
| Impervious surface land | 0.46 | 0.40 | 0.28 | 1.14 | 0.50 |
Publisher’s Note: MDPI stays neutral with regard to jurisdictional claims in published maps and institutional affiliations. |
© 2022 by the authors. Licensee MDPI, Basel, Switzerland. This article is an open access article distributed under the terms and conditions of the Creative Commons Attribution (CC BY) license (https://creativecommons.org/licenses/by/4.0/).
Share and Cite
Yao, Y.; Cui, L. Vegetation Dynamics in the Qinling-Daba Mountains through Climate Warming with Land-Use Policy. Forests 2022, 13, 1361. https://doi.org/10.3390/f13091361
Yao Y, Cui L. Vegetation Dynamics in the Qinling-Daba Mountains through Climate Warming with Land-Use Policy. Forests. 2022; 13(9):1361. https://doi.org/10.3390/f13091361
Chicago/Turabian StyleYao, Yonghui, and Lulu Cui. 2022. "Vegetation Dynamics in the Qinling-Daba Mountains through Climate Warming with Land-Use Policy" Forests 13, no. 9: 1361. https://doi.org/10.3390/f13091361
APA StyleYao, Y., & Cui, L. (2022). Vegetation Dynamics in the Qinling-Daba Mountains through Climate Warming with Land-Use Policy. Forests, 13(9), 1361. https://doi.org/10.3390/f13091361